

Introduction: previous variationist analyses of word-final /t/ and /d/ release
Released /t/ and /d/: linguistic and social factors
Word-final American English /t/ and /d/ have several gesturally and auditorily distinct variants (Davidson, Reference Davidson2011; Farrington, Reference Farrington2018; Podesva, Reynolds, Callier, & Baptiste, Reference Podesva, Reynolds, Callier and Baptiste2015; Sumner & Samuel, Reference Sumner and Samuel2005): a released or unreleased alveolar stop, a released alveolar stop with aspiration following the release, an alveolar stop with glottalization on the preceding segment, a glottal stop, and a lenited (e.g., spirantized) alveolar stop. Word-final /t/ and /d/ are often deleted when the word is a monomorpheme, as in mist, in contrast with words such as missed in which the /t/ or /d/ encodes a past tense morpheme (Baranowski & Turton, Reference Baranowski and Turton2020; Guy, Reference Guy and Labov1980; Holliday, Reference Holliday2017; MacKenzie & Tamminga, Reference MacKenzie and Tamminga2021; Smith, Durham, & Fortune, Reference Smith, Durham and Fortune2009; Wolfram, Reference Wolfram1969:49-50). Word-final /t/ and /d/ are more often released, or have a longer release, in phrase-final position in spontaneous speech, probably because phrase-final position is perceptually salient (Davidson, Reference Davidson2011:1045; Podesva et al., Reference Podesva, Reynolds, Callier and Baptiste2015:66). In American politicians’ speech, word-final /t/ release is favored by preceding obstruents, following pauses or vowels, past tense verbs versus monomorphemes and semiweak verbs, and low-frequency words (D’Onofrio & Stecker, Reference D’Onofrio and Stecker2022:15; Podesva et al., Reference Podesva, Reynolds, Callier and Baptiste2015:66).
Previous sociolinguistic analyses of released and unreleased word-final /t/ and /d/ in American English reveal complex and strong indexicality. Depending on the social context, released /t/ can index professional competence, articulateness, learnedness, formality, “traditional” femininity, Whiteness, and other qualities (Eckert, Reference Eckert2008:467-470). The ideological link between released /t/ and clear, learned, articulate, “standard” speech is broadly shared across social contexts in which American English is spoken. In fact, sociolinguistic studies of national political speech use this link as a starting point in their investigations of inter- and intra-speaker variation in production and perception (Podesva et al., Reference Podesva, Reynolds, Callier and Baptiste2015:62-63; D’Onofrio & Stecker, Reference D’Onofrio and Stecker2022:3-5). Released /t/ is also ideologically linked to Whiteness. Bucholtz (Reference Bucholtz2010:151-153) found that White self-identified “nerds” in a northern California high school use word-final released /t/ and /d/ as part of a “superstandard English” variety that evokes “the registers of scholarship and science” as well as Whiteness. In Davidson’s (Reference Davidson2011) study of StoryCorps data, White speakers, relative to Black speakers, produce significantly more /d/ release in phrase-final position (1050).
Methods for coding /t/ and /d/ in previous sociolinguistic studies
In nearly all sociolinguistic studies of English word-final /t/ release, coding is chiefly impressionistic and categorical. The coding process usually combines listening with visual inspection of spectrographic cues (Benor, Reference Benor2004; D’Onofrio & Stecker, Reference D’Onofrio and Stecker2022; Podesva et al., Reference Podesva, Reynolds, Callier and Baptiste2015), a time-consuming process. In some cases, /t/ is coded as either released or unreleased, and in other cases there are more variants coded but not distinguished in the quantitative analysis. For example, Podesva et al. (Reference Podesva, Reynolds, Callier and Baptiste2015) coded for released, flapped, glottalized, and deleted variants but subsequently collapsed all of the unreleased variants into one category for quantitative analysis. Some phonetic studies of English stops similarly assess the categorical presence versus absence of a release burst (Zsiga, Reference Zsiga2000). While many studies of stop release use VOT as the (continuous) dependent variable rather than categorical presence versus absence (Abramson & Whalen, Reference Abramson and Whalen2017; Cho, Whalen, & Docherty, Reference Cho, Whalen and Docherty2019; Flege & Hillenbrand, Reference Flege and Hillenbrand1987; Fritche, Shattuck-Hufnagel, & Song, Reference Fritche, Shattuck-hufnagel and Song2021; Nagy, Reference Nagy2015; Nodari, Celata, & Nagy, Reference Nodari, Celata and Nagy2019; Ostrand & Chodroff, Reference Ostrand and Chodroff2021; Stoehr, Benders, Van Hell, & Fikkert, Reference Stoehr, Benders, Van Hell and Fikkert2018; Stuart-Smith, Sonderegger, Rathcke, & Macdonald, Reference Stuart-Smith, Sonderegger, Rathcke and Macdonald2015; Torreira & Ernestus, Reference Torreira and Ernestus2011), VOT is not applicable to prepausal /t/ because there is no immediate following sound.
Research aims
This paper describes a new automated method for reliably collecting acoustic information about coda stops in conversational data. We further describe a process for using the acoustic information to code prepausal /t d/ automatically as released or unreleased with a random forest classifier. Both tasks are demonstrated with data from a conversational corpus in the Southern U.S. city of Raleigh, North Carolina. The results from the automated classifier are assessed by comparing the internal and social distribution of released versus unreleased /t d/ with their distribution in previous studies of /t/ release. As previous studies have generally not considered /d/ release, the investigation of the distribution of /d/ release in the Raleigh data is exploratory. The /t d/ tokens classified as “released” by the random forest are used to investigate the social and internal factors influencing the magnitude of releases in Raleigh. The pragmatic and social functions of /t d/ releases and high-magnitude releases are considered in the context of Raleigh’s changing social environment.
Acoustic analysis of /t/ and /d/ in the Raleigh corpus
Data
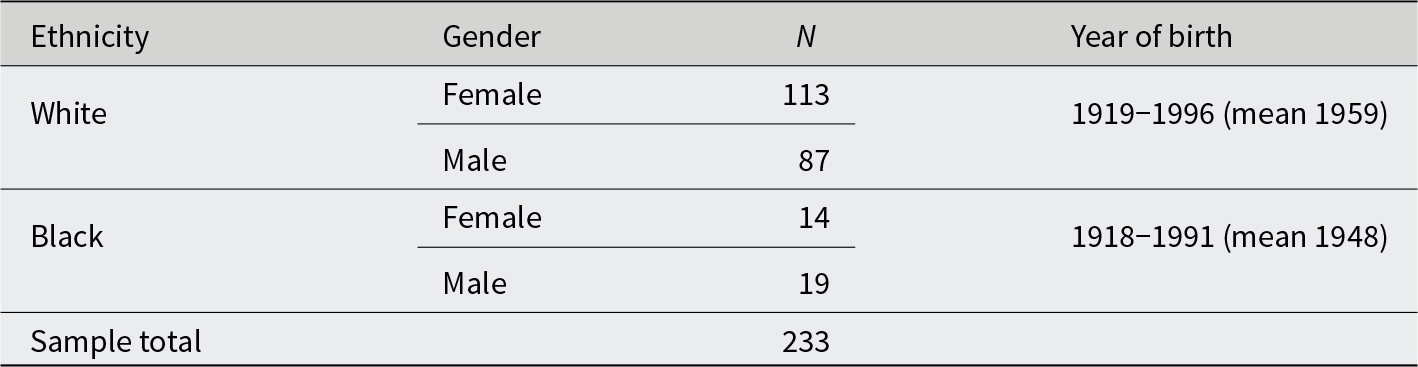
The data used in this analysis are drawn from a corpus of conversational interviews with people who grew up in, and mostly still live in, the city of Raleigh, North Carolina, or in Garner, a small town adjacent to Raleigh. Collection of the corpus data began in 2008 and is ongoing. Extensive description of the corpus appears elsewhere, particularly in Dodsworth and Benton (Reference Dodsworth and Benton2020:44-59). All of the speakers arrived in Raleigh before age 5, and most were born in Raleigh. Most of the interviews are private conversations between the speaker and the interviewer, usually in the speaker’s home but sometimes in an office on the North Carolina State campus. The speaker wore a lapel microphone while the digital audio recorder sat in full view in front of the interviewer. The speakers were asked to talk about their life experiences including family, school, neighborhoods, and jobs. Because Raleigh has been growing quickly in terms of both land area and population since the mid-20th century, often the conversations turned to Raleigh’s expansion and change. The sample used in the present analysis consists of 233 White and Black speakers born between 1918 and 1996. Table 1 summarizes the demographic information for the sample.
Speakers in the present sample from the Raleigh corpus
In the present sample, some of the 33 interviews with Black speakers were collected for a related but distinct oral history project in Raleigh’s South Park neighborhood, which lies in the historically African American southeastern quadrant. These speakers are older on average than those in the White sample and were often speaking in a more formal style than other speakers in the Raleigh corpus. In contrast, the youngest Black speakers in the sample, born after 1980, were not part of the oral history project, and most are interviewed by peers.
Acoustic methods
In order to measure the spectral and temporal properties of stop releases, it was necessary to first locate the release phase (if present) of each prepausal /t/ and /d/. All 233 recordings were force-aligned using the Montreal Forced Aligner (McAuliffe, Socolof, Mihuc, Wagner, & Sonderegger, Reference McAuliffe, Socolof, Mihuc, Wagner and Sonderegger2017) and its english_us_arpa acoustic models. This applies a single phone interval to each stop phoneme, generally including its closure phase and its release phase, if present, but it does not distinguish the two phases. We extracted all word intervals with prepausal /t d/ (plus a 0.1s pad before and after) using one_script (Mielke & Wilbanks, Reference Mielke and Wilbanks2015) for Praat (Boersma & Weenink, Reference Boersma and Weenink2018). This yielded 38,071 tokens of prepausal /t/ in 1,343 distinct words and 27,166 tokens of prepausal /d/ in 1,254 distinct words. To help put the magnitude of the noisy stop releases in terms of English affricates and alveolar sibilants, we similarly extracted all prepausal /s/ and /tʃ/, yielding 15,389 tokens of prepausal /s/ in 1,359 distinct words and 1,728 tokens of prepausal /tʃ/ in 69 distinct words.
To find stop (and affricate) releases, we applied a segmentation scheme following Cronenberg, Gubian, Harrington, and Ruch (Reference Cronenberg, Gubian, Harrington and Ruch2020), who used a high-frequency energy signal (along with a voicing measure) to identify pre- and post-aspiration in Andalusian Spanish. Following Cronenberg et al. (Reference Cronenberg, Gubian, Harrington and Ruch2020), we created the high-frequency signal by first applying preemphasis twice to effectively boost the signal 12 dB per octave, then high-pass filtering at 3 kHz using the wrassp package (a wrapper for libassp, version 1.0.5; Winkelmann & Raess, Reference Winkelmann and Raess2014) in R (version 4.1.2, R Core Team, 2000) and calculating the RMS intensity of this high-frequency sound signal. Note that these filters are part of the segmentation procedure but not part of the measurement procedure, which used no preemphasis. Since we are using this signal specifically for segmentation, we diverged from Cronenberg et al. (Reference Cronenberg, Gubian, Harrington and Ruch2020) by using a time step of 1 ms for the intensity signal and not applying a Butterworth filter.
To achieve segmentation, we found the time point of the maximum high-frequency signal value during the stop interval assigned by forced alignment (which should be within the release phase, if a release is present), and the minimum high-frequency signal value between the start of the stop interval and the maximum (which should be within the closure phase). The amplitude difference between the (release) maximum and (closure) minimum is taken as the release amplitude (dB). We calculated the difference between frames of the high-frequency signal. The maximum value of this difference represented the steepest rise. The time of the steepest rise of the high-frequency signal between the minimum and maximum was taken as the start of the release. The release end was taken to be the time after the maximum high-frequency signal when the signal first drops down back to half its peak amplitude.Footnote 1 This release interval can be understood as a candidate release interval. For intervals with an actual release, the amplitude will be high and the release duration (s; the time between the release start and release end) is a meaningful measure of it. If the amplitude is low, as when there is no release, then this duration measure is mostly meaningless. Below we evaluate these candidate release intervals quantitatively, to determine how to distinguish between actual stop releases and non-releases.
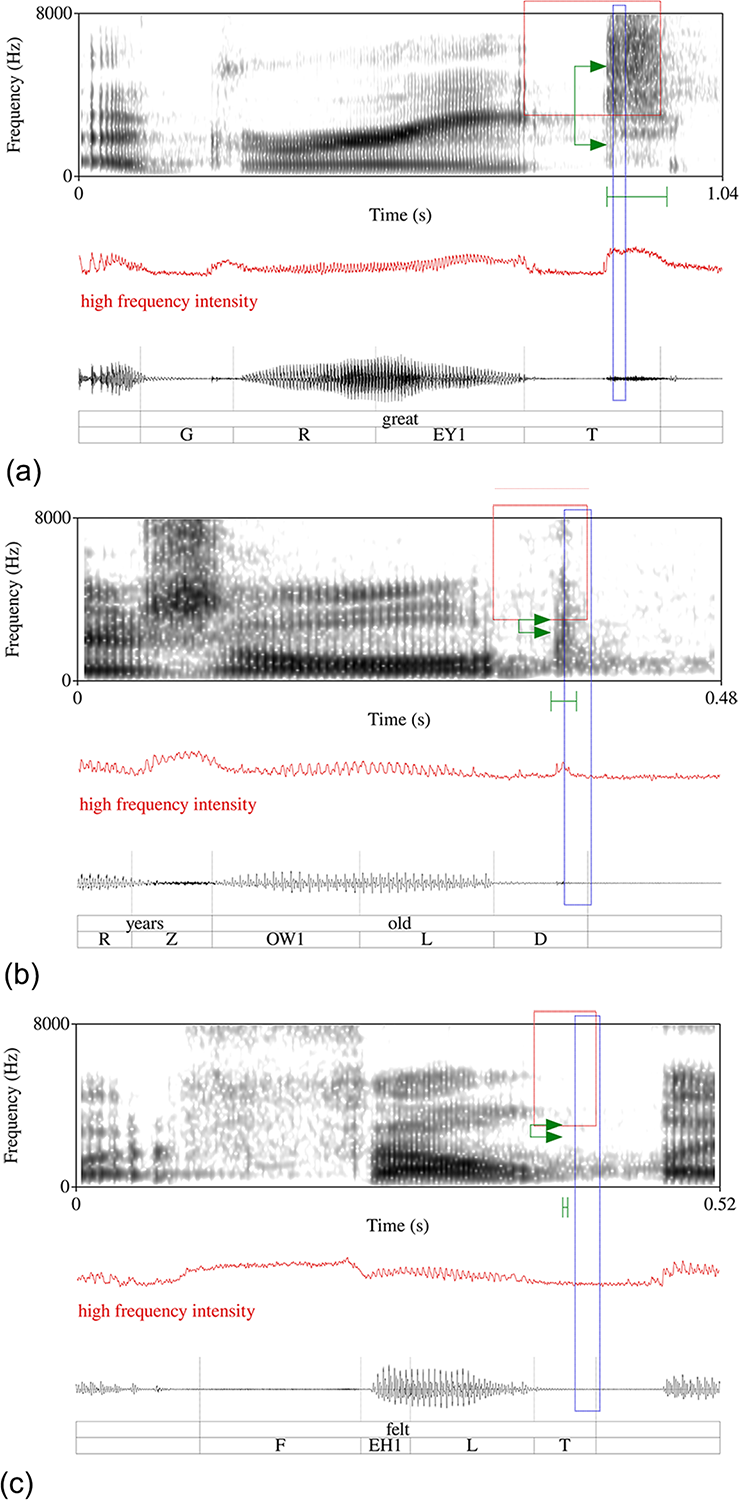
Multitaper spectra were extracted from a single 20 ms window beginning 10 ms after the start of each candidate release interval with the spectRum package (Reidy, Reference Reidy2013) for R (version 4.1.2, R Core Team, 2000), with eight tapers and a bandwidth parameter of 4. This analysis was applied to the original waveforms. Preemphasis and high-pass filtering were not applied for the purposes of making spectral measurements. Spectral amplitude difference (dB) was defined as the amplitude difference between the main spectral peak within the 1–22.05 kHz range and the lowest spectral trough between 1 kHz and the spectral peak. This measure is intended to quantify sibilance (following Jesus & Shadle, Reference Jesus and Shadle2002; Koenig, Shadle, Preston, & Mooshammer, Reference Koenig, Shadle, Preston and Mooshammer2013; Shadle, Reference Shadle2023). Figure 1a–c illustrates the measurement scheme for three words ending in /t d/ with different releases or no release, all produced by the same female speaker born in 1988. The top panel shows great produced with an affricated /t/. The middle panel shows old produced with an unaffricated release. The bottom panel shows felt produced with no audible release. The affricated /t/ in great has the largest values for release duration (.097 s), release amplitude (37 dB louder than the silence interval) and spectral amplitude difference (a mid-frequency peak 17 dB louder than the low-frequency trough), yielding a release magnitude value of 1.38. The less affricated released /d/ in old is shorter in duration (.019 s) and lower in amplitude (21 dB), and it has no prominent mid-frequency peak characteristic of sibilants (a spectral amplitude difference of only .1 dB). The lack of release for the /t/ in felt is indicated by its release amplitude of 0 dB (i.e., no discernible noise after the closure. In the absence of a release, the other release measures (.004 s duration and 5 dB spectral amplitude difference) are not meaningful.
Measurement illustration for three sample tokens. The red high-frequency intensity signal below the spectrogram in each subfigure was used to locate stop releases. The red box indicates the time interval segmented as /t/ or /d/ and the frequency band used to generate the high-frequency intensity signal. The release amplitude is the difference between the greatest high-frequency intensity value during the stop (i.e., the release) and the lowest value before it in the stop interval (i.e., the closure). The green whiskers below the spectrogram show the duration of the release according to the high-frequency intensity signal. The blue box extending below the spectrogram indicates the 20 ms window that was used for the multitaper spectrum analysis. The green arrows indicate the frequencies of the spectral peak and spectral trough that were used to calculate the spectral amplitude difference. Top: affricated /t/ in great (release duration = .097 s, release amplitude = 37 dB, spectral amplitude difference = 17 dB, release magnitude = 1.38). Middle: less affricated released /d/ in old (release duration = .019 s, release amplitude = 21 dB, spectral amplitude difference = .1 dB, release magnitude = .60). Bottom: unreleased /t/ in felt (release duration = .004 s, release amplitude = 0 dB, spectral amplitude difference = 5 dB; release magnitude = .22).
Coding prepausal /t d/ as released or unreleased
Data cleaning, impressionistic coding, and acoustic “zones”
The initial dataset consisted of 65,237 tokens of prepausal /t d/. Eleven tokens with erroneous release duration above .3 s were removed. Further data cleaning involved the removal of wordlist and reading passage tokens that only a subset of speakers read, leaving a total of 63,913.
On the basis of graphical inspection of the three acoustic indicators of release (release duration, release amplitude, and spectral amplitude difference), a 460-token sample of the remaining data was selected and coded impressionistically by the first author. In the impressionistic coding, “unreleased” included all tokens without a release burst, including deleted and glottalized tokens. An exploration of the acoustic characteristics of tokens coded as released versus unreleased led to an initial set of acoustic criteria for classifying /t d/ as released or unreleased. For example, all tokens with release amplitude under 2 dB or release duration under .01 s were hypothesized to be unreleased (including deleted /t d/). Tokens with both release amplitude and spectral amplitude difference above 5 dB, for which release duration was also greater than .025 s, were hypothesized to be released. These acoustic criteria were used for grouping all tokens in the corpus into three categorical acoustic “zones”: released (n = 8096), undetermined (n = 18,342), and unreleased (n = 37,493). The large number of “undetermined” tokens results from the fact that the acoustic measurements are noisy; for example, some tokens with high duration values are in fact unreleased. The acoustic “zones” represent a careful but inadequate method for binning acoustic objects that vary greatly along multiple dimensions.
The random forest classifier
In order to avoid ending up with an “undetermined” category, we used an automated classifier to label every token as released or unreleased on the basis of the three acoustic variables. A random forest was chosen as the automated classifier method in view of evidence that random forests perform well when the token count is high and the number of variables is low (Althnian, AlSaeed, Al-Baity, Samha, Dris, Alzakari, Abou Elwafa, & Kurdi, Reference Althnian, AlSaeed, Al-Baity, Samha, Dris, Alzakari, Abou Elwafa and Kurdi2021). Random forests are similar to decision trees, which recursively identify the best feature (acoustic variable, in this case) for splitting tokens in a data frame into groups (in this case, released versus unreleased). A random forest is a collection of decision trees, each using a random subset of the data and a random selection of the features. The importance of each feature for making predictions (in this case, for predicting whether any token is released or unreleased) is determined by aggregating across the individual trees. In this way, the model determines the relative importance of each feature while avoiding the overfitting that often occurs when there are multiple interrelated features.
A random forest model was trained on the 460 tokens that had been coded impressionistically; of these, 209 were impressionistically coded as released and 251 as unreleased. The training dataset included the three acoustic measures (release duration, release amplitude, and spectral amplitude difference) as well as the impressionistic coding. The train function in the R package caret (version 6.0-94, Kuhn, Reference Kuhn2008) and the randomForest function in the package randomForest (version 4.7-1.1, Liaw & Wiener, Reference Liaw and Wiener2002) were used to train a random forest model on the training data using 10-fold cross-validation. The random forest had 500 trees, each involving a sample of 414 or 415 tokens from the training data and two of the three acoustic variables.
In the random forest model, the mean decrease accuracy, a measure of each variable’s importance in classifying tokens, was .07 for release duration, .08 for release amplitude, and .02 for spectral amplitude difference, indicating that spectral amplitude difference contributes the least to the model predictions. The model was overall 76% accurate in classifying the training data as released or unreleased, with an error rate of 25% for unreleased and 33% for released tokens, as derived from the model’s confusion matrix. Crucially, checking the model’s predictions against the impressionistic coding revealed that the model was better at identifying released tokens relative to the human-generated acoustic zone system described above, which grouped tokens according to acoustic criteria but ended up with many “undetermined” tokens. Accordingly, the trained random forest model was applied to the full data frame, generating a prediction (released or unreleased) for each prepausal /t d/ token in the corpus. The random forest predictions yield a dataset of 50,577 unreleased and 13,336 released tokens.
Figure 2 shows the human-generated acoustic zones and random forest model predictions for all pairs of the three acoustic measures. The human-generated zones (released, undetermined, and unreleased) are represented by shaded rectangular and L-shaped regions. Contour lines show the distributions of tokens labeled as released or unreleased by the random forest model.
Distribution of all tokens of /t/ and /d/ according to three spectral measures. Shaded areas show initial acoustic criteria. Contour lines illustrate predictions from the random forest model. Cross hairs indicate mean and standard deviation of reference sounds (/tʃ/ for release duration and release amplitude, /s/ for spectral amplitude difference).
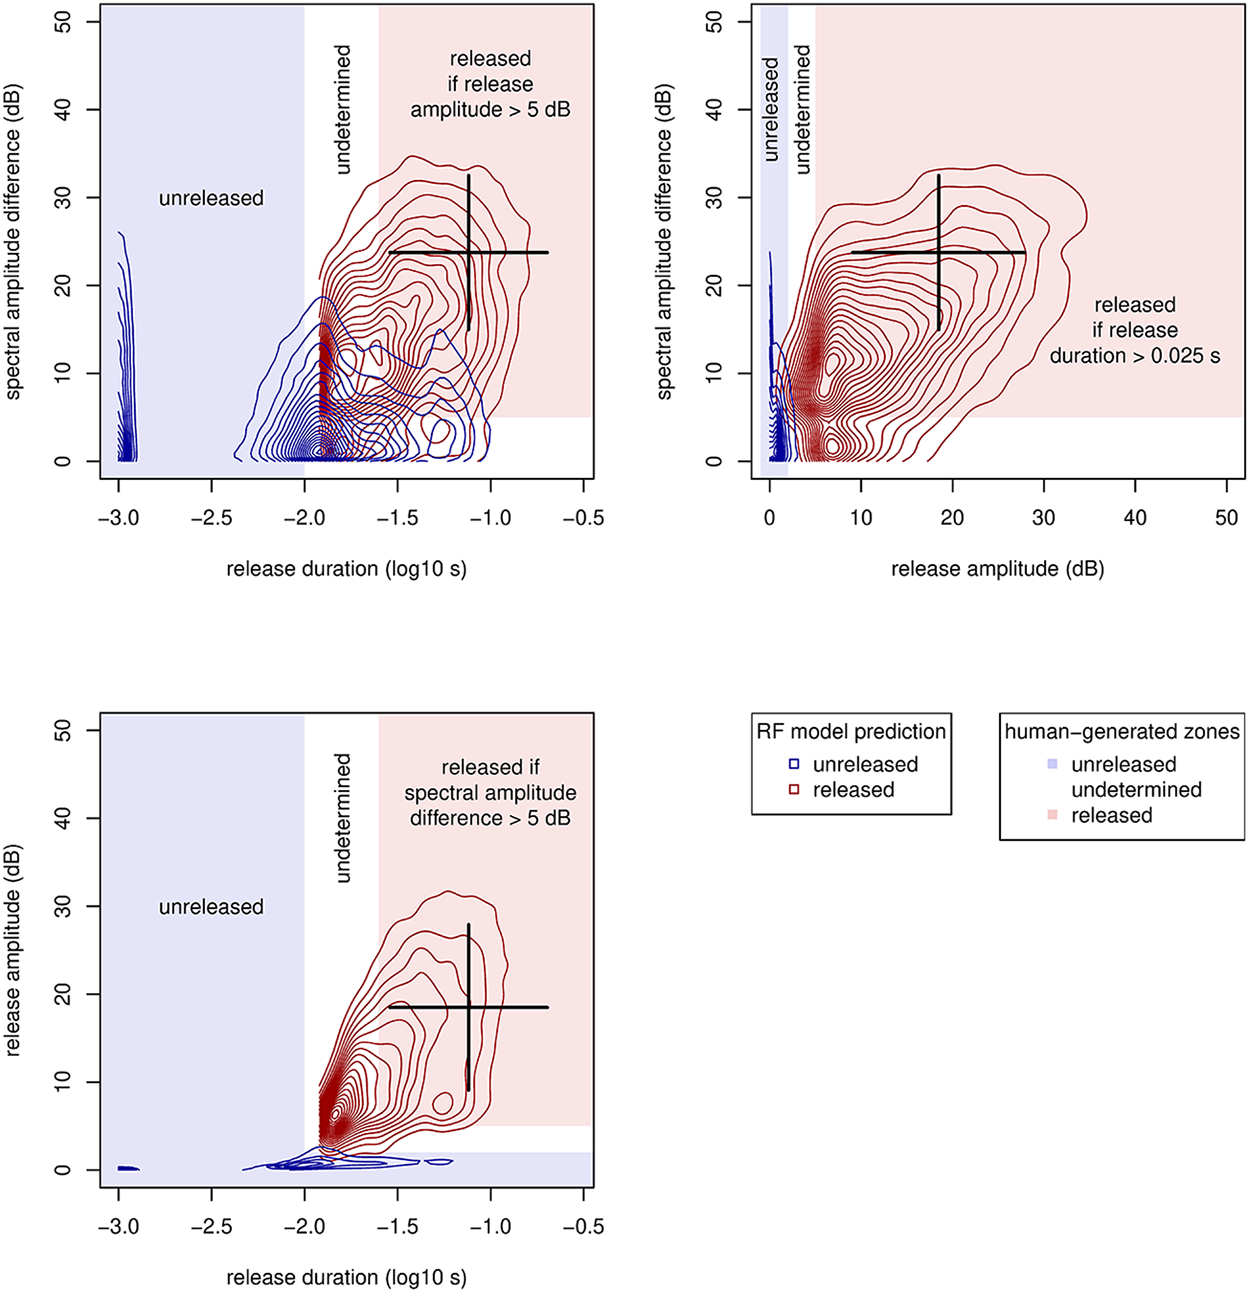
Tokens labeled as unreleased by the random forest model generally have very low release amplitude. This is because they lack a silent closure interval followed by a contrastingly noisy release that gives the released tokens their relatively large release amplitude. There is more overlap between unreleased and released tokens with respect to the other two measures. Tokens which are actually unreleased may have a closure followed fairly long interval of not very high-amplitude energy that is not a release. This low-amplitude energy may also have a spectral shape with a mid-frequency peak and a low-frequency trough similar to some released tokens. What separates these unreleased tokens from released tokens is their low release amplitude, and most unreleased tokens have low values for spectral amplitude difference and release duration as well.
All three measures are useful for distinguishing among released tokens, which range from a minimal audible release of the stop closure to quite a lot of affrication. An affricated /t/ or /d/ is expected to have a release intensity and duration profile similar to the affricate /tʃ/, and a release spectrum similar to the alveolar fricative /s/. The crosshairs in each panel of Figure 2 show expected values for a very affricated /t/ or /d/, based on the means and standard deviations of measurements of prepausal /s/ and /tʃ/. In the top-left panel, we see that the longest and noisiest /t d/ tokens reach the release duration of /tʃ/ and the spectral amplitude difference of /s/. In the top-right panel, we see that they also reach the release amplitude of /tʃ/. The bottom-left panel shows that they reach the release duration and amplitude of /tʃ/.
Calculating release magnitude
Among tokens classified as released by the random forest, release duration and release amplitude are strongly and positively correlated. We constructed an index of release magnitude using the three acoustic measures shown in Figure 2. A strongly affricated /t d/ resembles an alveolar affricate such as [ts] or [dz]. Since American English does not have alveolar affricate phonemes, we compared /t d/ to an alveolar fricative and a postalveolar affricate. We imagine that a very affricated /t d/ will have a release phase with spectral properties similar to /s/ and that its timing and intensity envelope will resemble /tʃ/, so we scaled the acoustic measures so that a value of 0 will represent the minimum and a value of 1 means a spectral peak as high as in /s/, or a release that is as long or as loud as in /tʃ/.
Accordingly, each of the three measures was normalized so that the mean for the reference sound (/s/ or /tʃ/) has a value of 1 and the minimum value for /t d/ is 0 (the minimum value is 0 for the two amplitude measures and −3.000829 [i.e., slightly less than 1 ms] for the log duration measure).
The three measures were combined by taking the square root of the sum of their squares (i.e., the diagonal of a rectangular prism whose sides are the values of the three normalized acoustic measures), and then dividing this by the square root of 3, so that a token with values identical to the reference sounds will have a value of 1.
Assessing the automated classification: internal and external factors
We examine the distribution of released and unreleased /t d/ in relation to internal (linguistic) and external (social) factors in order to assess the automated method for identifying released and unreleased tokens and for measuring the varying phonetic properties of releases.
/t d/ release versus non-release: internal factors
Previous research has found word-final /t/ release to be promoted by preceding obstruents, following pauses or vowels, and past tense verbs versus monomorphemes and semiweak verbs (D’Onofrio & Stecker, Reference D’Onofrio and Stecker2022:15; Podesva et al., Reference Podesva, Reynolds, Callier and Baptiste2015:66). Table 2 gives the release proportions in the Raleigh data for /t/ and /d/ in relation to each of these three factors.
/d/ and /t/ release rates across linguistic factors (rates were calculated on the basis of the random forest classifications)
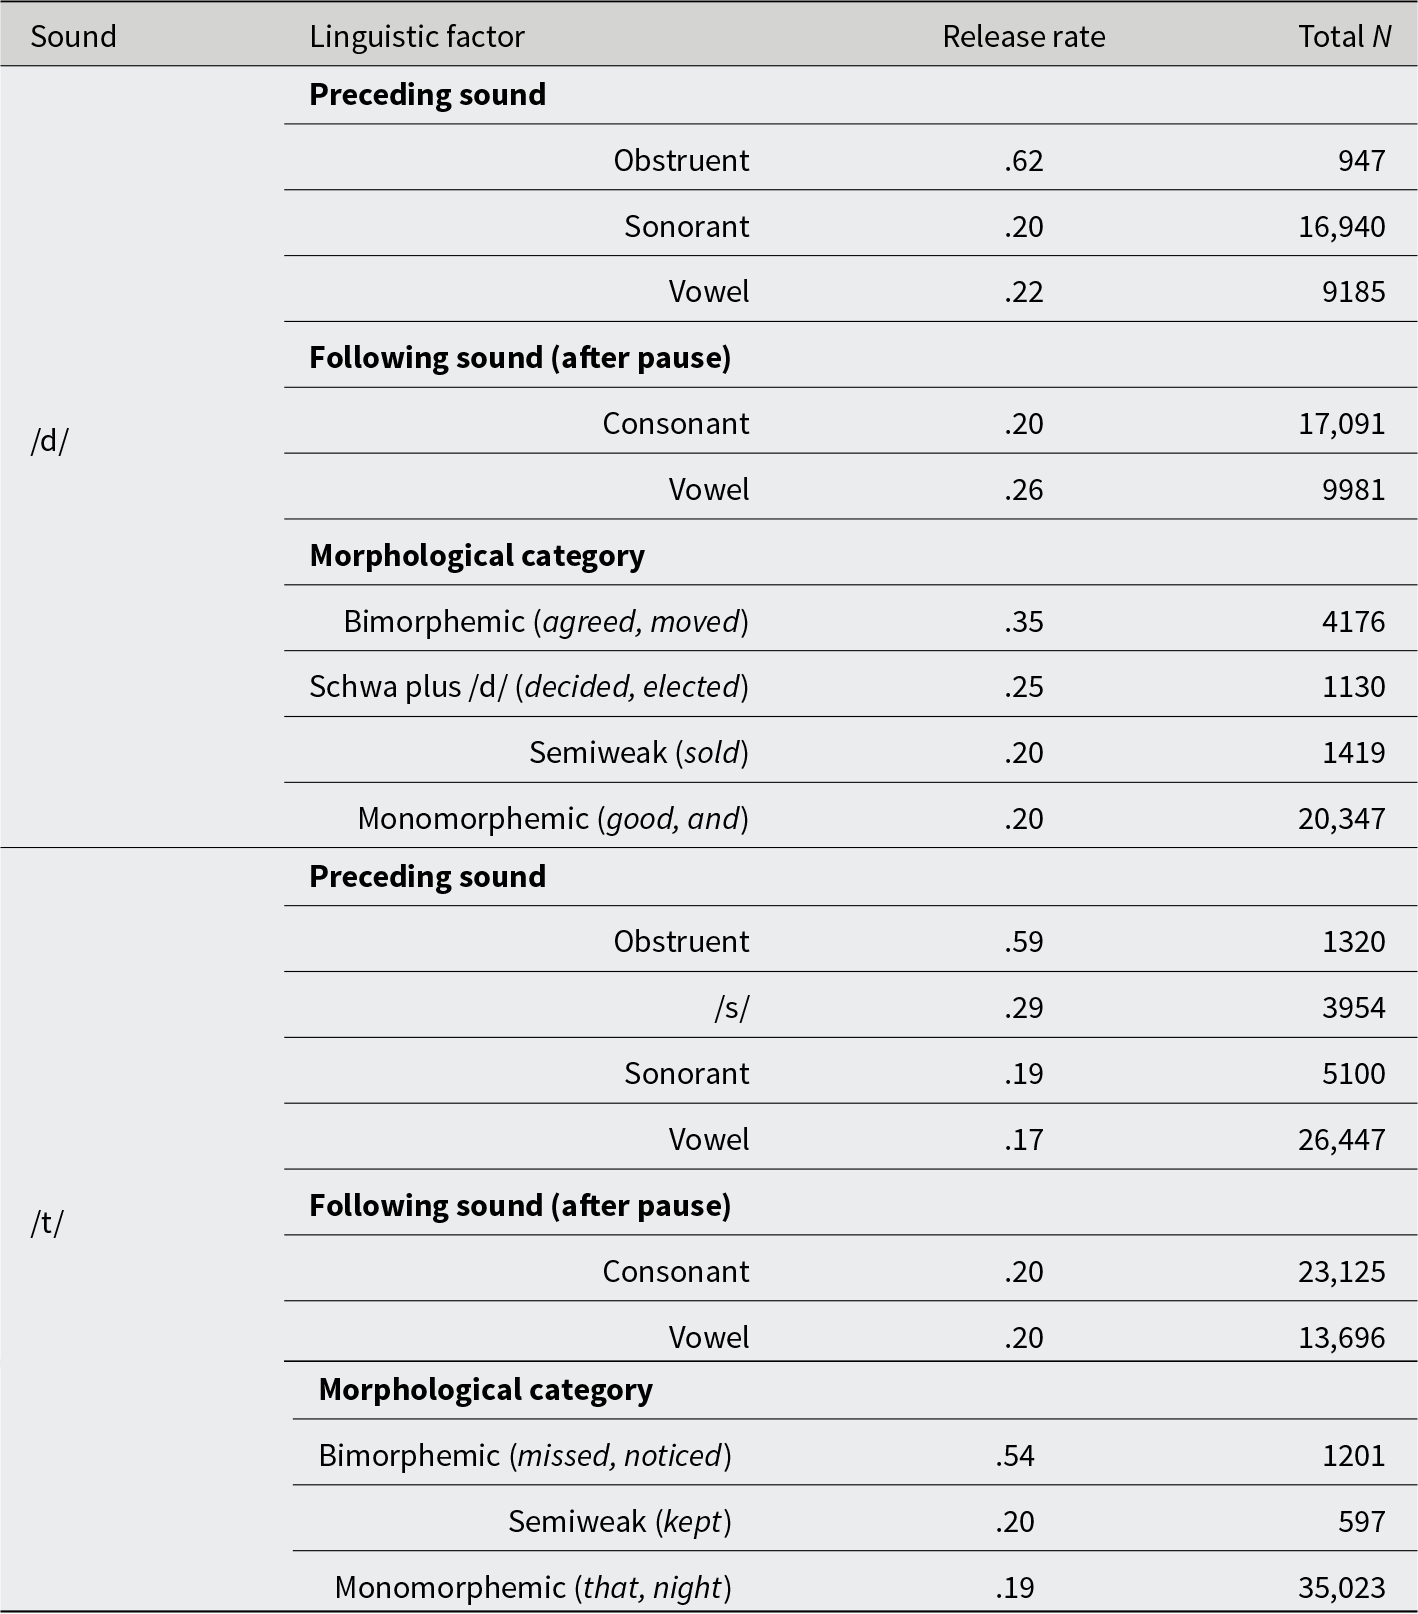
The sound preceding coda /t/ or /d/ was coded into one of four categories: obstruent, /s/, sonorant, and vowel. As in previous studies, /t/ and /d/ in Raleigh are proportionally more often released after obstruents relative to sonorants and vowels. While a direct comparison of proportions between studies is vulnerable to many factors surrounding data collection, including the social and situational setting, we can compare the release proportions in Table 2 with those in D’Onofrio and Stecker’s (Reference D’Onofrio and Stecker2022:18, Figure 4) analysis of U.S. presidential candidates. The presidential candidates’ median /t/ release rates after obstruents range from just over .4 to just below .7, as compared with the Raleigh post-obstruent /t/ release rate of .59. After vowels and sonorants, the presidential candidates’ medians range from 0 to about .2, as compared with the Raleigh /t/ release proportions of .17 and .19. The Raleigh proportions are therefore within the ranges defined by the presidential candidates. Table 2 additionally shows that /d/ occurs most often after sonorants while /t/ predominantly occurs after vowels; this is partly because /t/ and /d/ occur in different high-frequency words, especially that, but, and it (n = 14,493) versus and (n = 12,479).
Following sound is more difficult to assess in the context of previous studies because the present study includes only prepausal tokens. In the Raleigh data, /t/ release rates before following consonants versus vowels are identical, and /d/ release rates are higher before vowels (Table 2).Footnote 2
With respect to morphological status, we follow previous studies in comparing bimorphemic, semiweak, and monomorphemic words, and we additionally distinguish the category of words such as decided or elected in which schwa plus /d/ constitutes a morpheme. For both /t/ and /d/, the morphological categories pattern as expected insofar as release rates are highest for past tense verbs or past participles. There is very little difference between semiweak verbs and monomorphemes (Table 2).
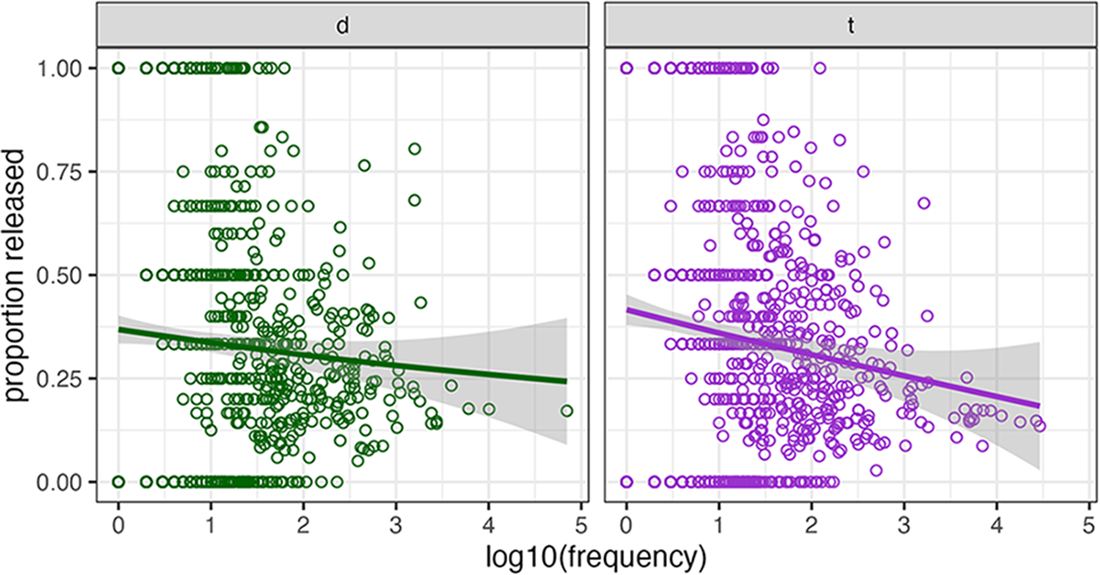
In previous studies, lexical frequency is negatively correlated with /t/ release. Lexical frequency is defined here as a word’s frequency as its number of occurrences in the entire Raleigh corpus (not just the subset of prepausal /t d/ tokens). The most frequent words, including and, have relatively low release rates below .25, as shown in Figure 3. Most of the lowest-frequency words have release rate 1 or 0, and middle-frequency words have widely varying release rates. Therefore, the effect of lexical frequency is in the expected direction, but it is noisy.
Release rate by word as a function of word frequency in the Raleigh corpus.
The above descriptive account of internal factors takes a step toward legitimizing the automated acoustic method of release detection followed by random forest categorization. Three of the four internal factors pattern as expected on the basis of previous research, and the fourth, following sound, is largely irrelevant here because all tokens are prepausal.
/t d/ release versus non-release: social factors
Our hypotheses concerning social factors are guided by previous findings about /t/ release and about language change in Raleigh. The first social factor is year of birth. Because previous work on the social and apparent-time patterning of linguistic variation in Raleigh has found the ongoing, socially conditioned replacement of Southern linguistic norms with pan-regional norms (Dodsworth & Benton, Reference Dodsworth and Benton2020), we expect apparent-time change toward more frequent /t d/ releases when taking into account internal factors. We further expect female speakers to release /t d/ more frequently than males in the aggregate, both because female politicians have been found to use more frequent releases (Podesva et al., Reference Podesva, Reynolds, Callier and Baptiste2015:66) and because released /t/ has been argued to index a “Good Woman” persona (Davies, Reference Davies, Lakoff and Bucholtz2004; Sclafani, Reference Sclafani2009). We expect higher education levels to correspond to higher release rates, given the association between released /t/ and articulateness or learnedness (Benor, Reference Benor2010; Eckert, Reference Eckert2008:467-470; Podesva, Roberts, & Campbell-Kibler, Reference Podesva, Roberts, Campbell-Kibler, Campbell-Kibler, Podesva, Roberts and Wong2001). Finally, on the basis of previous arguments that /t/ release is linked to Whiteness (Bucholtz, Reference Bucholtz2001), we expect White speakers in the Raleigh sample to have higher rates of /t d/ release than Black speakers in the aggregate.
Table 3 presents group-level release rates for /t/ and /d/. Because there are only 33 Black speakers in the sample, in contrast with 200 White speakers, and because there is only one Black woman born after 1965 in the sample, we assess Black and White speakers separately. In both groups, and for both /d/ and /t/, women show higher release rates than men in the aggregate. White speakers have higher release rates: White women show a higher /d/ release rate relative to Black women (.26 versus .20), and White men relative to Black men (.19 versus .13). For /t/, the release rates are lower than the /d/ release rates, but the differences between groups are parallel.
/d/ and /t/ release rates by social group (rates were calculated on the basis of the random forest classifications)
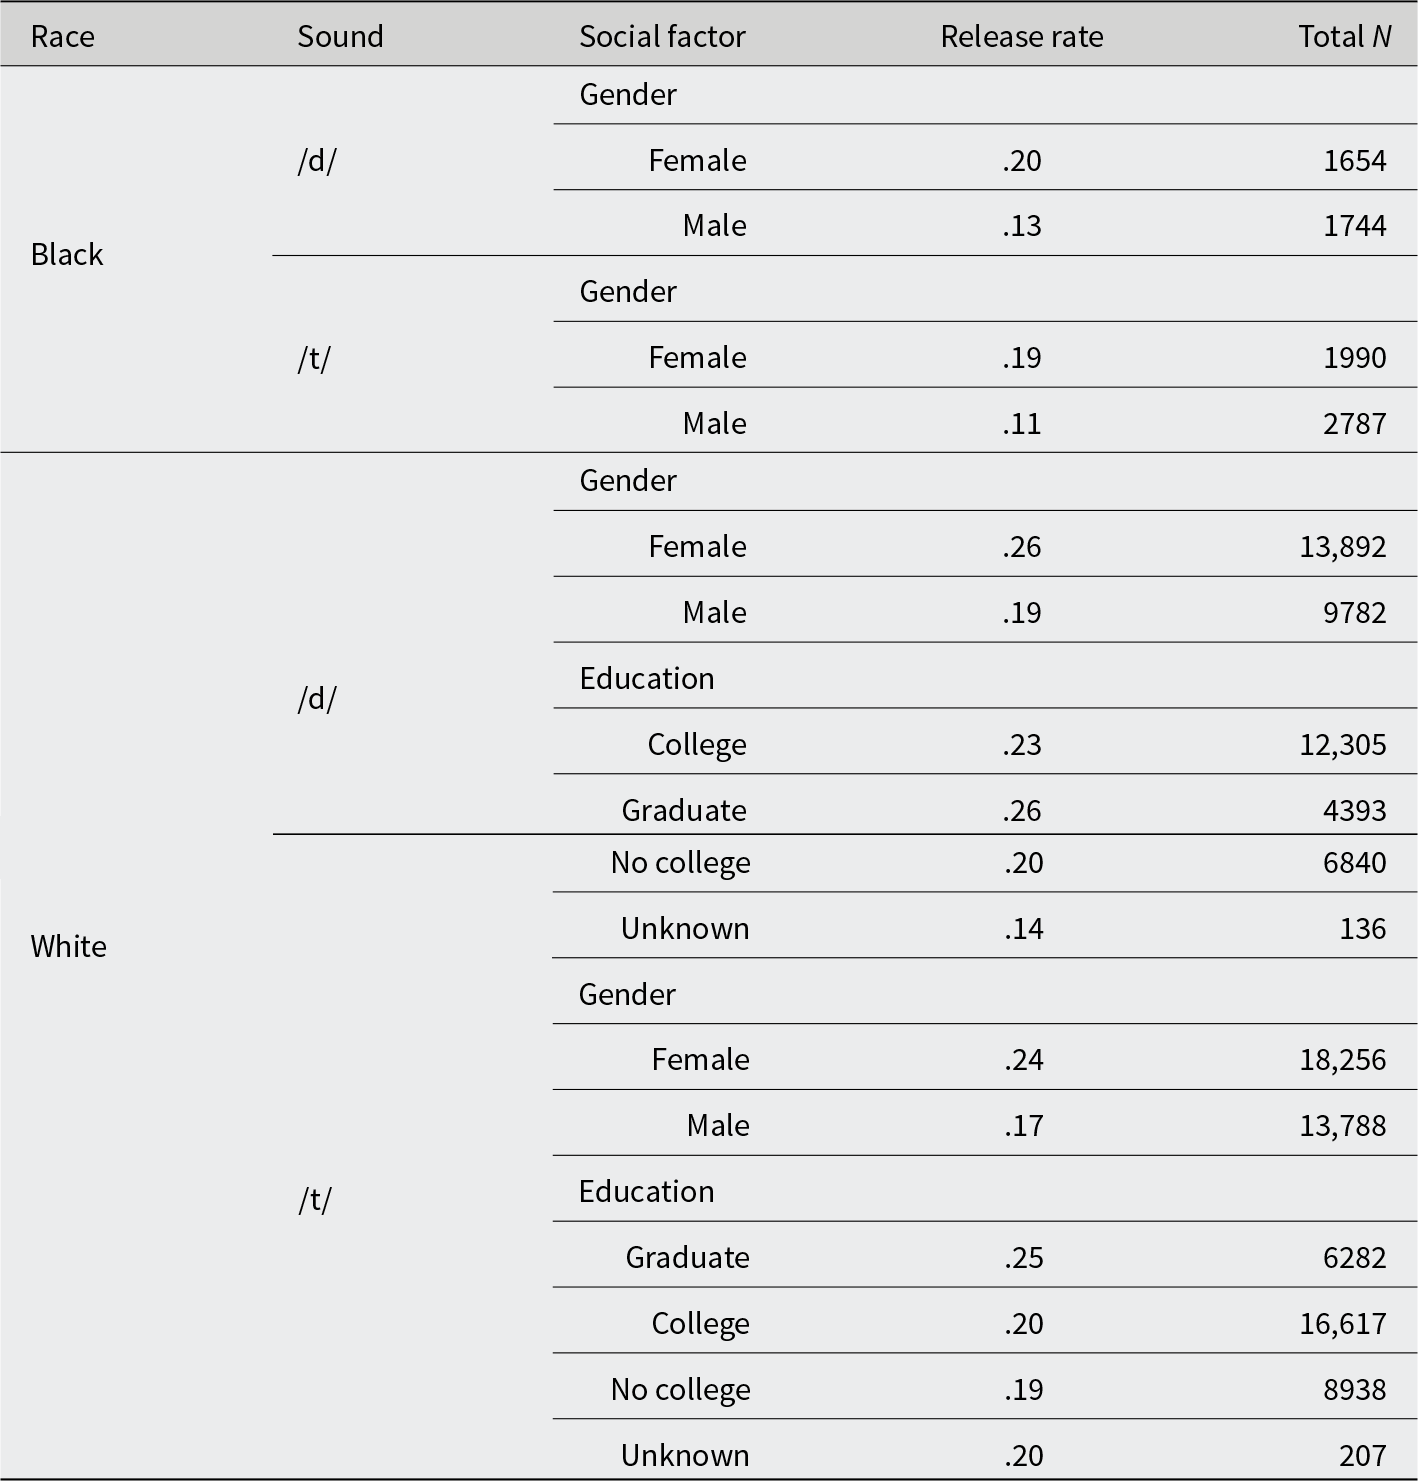
An important discrepancy between the Black and White samples has to do with education. Among White speakers, the highest level of education obtained is known for all but one speaker, and the highest overall release rate is observed for speakers who attended graduate school. Among Black speakers, however, education level is known for only 11 out of 33 speakers, and 6 of those 11 were born after 1980. For this reason, we do not show release rates by educational group for the Black sample in Table 3, but we discuss individual speakers (Figure 4).
/d/ and /t/ release rate by individual speaker, race, gender, and birthyear. Rates were calculated on the basis of the random forest classifications.
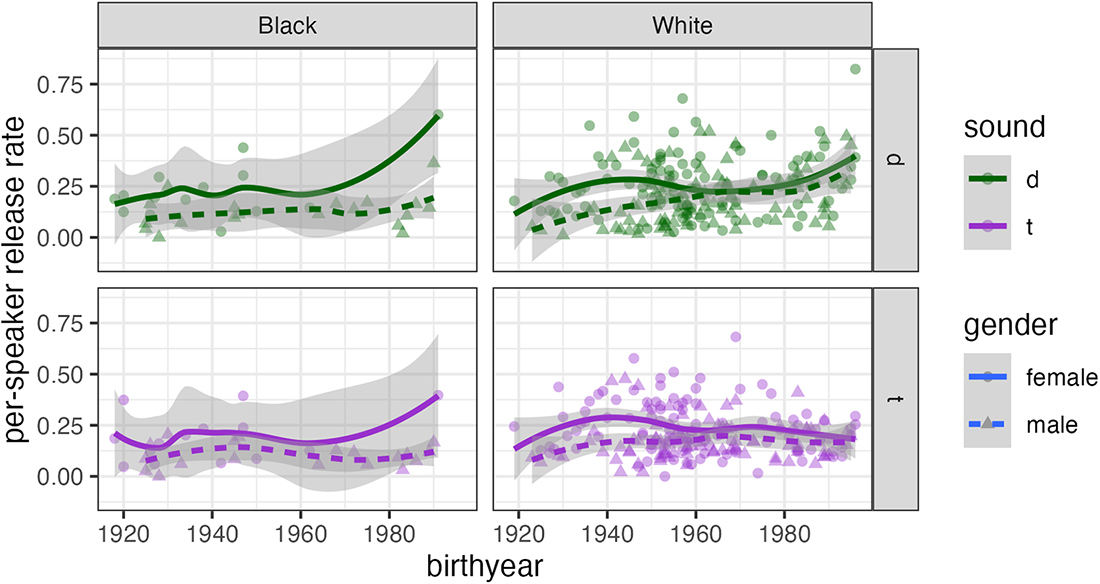
Most individual Black speakers have release rates below .25, with no clear apparent-time rise (Figure 4). Instead, there are a few speakers with unusually high rates. The highest /d/ release rate among Black speakers is observed for a female born in 1991, who also has an unusually high /t/ release rate. This speaker grew up in a predominantly Black neighborhood but recalled being teased as a child for “sounding White”; she dropped out of college but expressed interest in returning; and (crucially, we think) she was interviewed by a White friend. The Black male speaker born in 1990 with an unusually high /d/ release rate (.36) also had a White interviewer, whereas all of the other Black males born in the 1980s were interviewed by a familiar Black male. A college-educated Black woman born in 1947 has release rates for both /t/ and /d/ near .4. We suspect that her high release rates are not simply a product of her education, as the other college-educated speakers born around the same time have lower rates. Instead, we suspect that her high release rates reflect her status as a community organizer, the most vocal and active champion of the advancement of a historically Black neighborhood.
Among White speakers, Figure 4 shows one particularly striking outlier, a female born in 1996 with a /d/ release rate of .82. We have no explanation for her high /d/ release rate on the basis of social or individual facts. We can note, however, that 29 of her 51 prepausal /d/ tokens occur in the word and; of these, 27 are released. The word and has an overall release rate of .17 in the corpus and is therefore not exceptional, but as we will argue, one pragmatic function of released /t d/ appears to be holding the floor, and the word and comes up often in this context.
/t d/ release versus non-release: mixed effects logistic regression
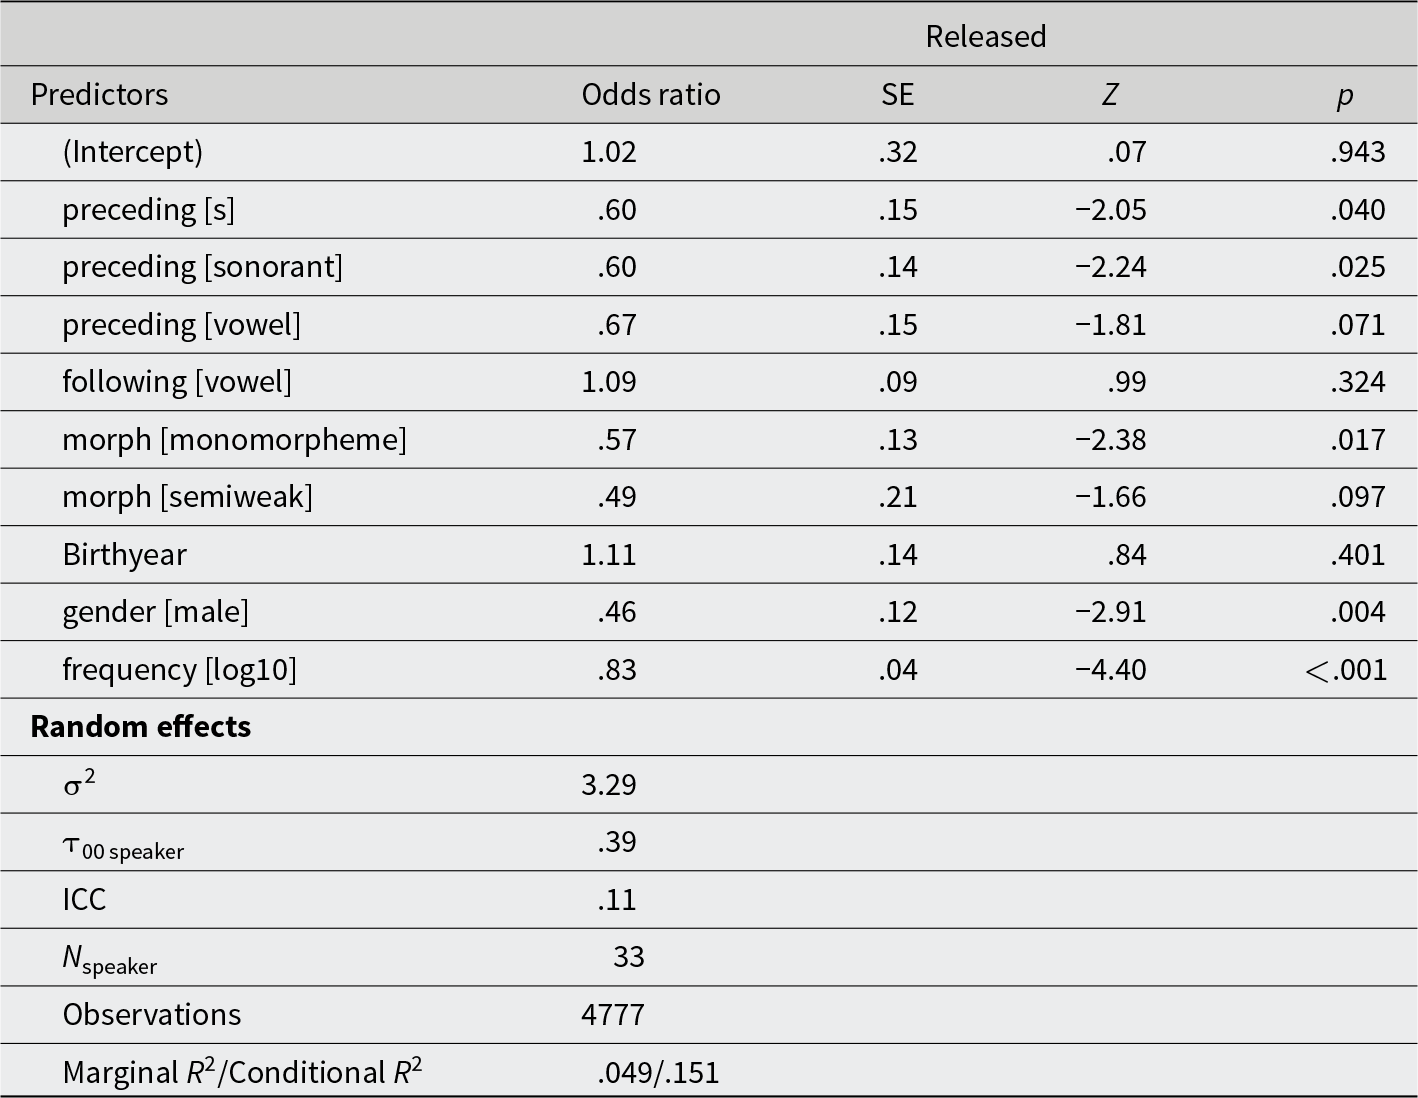
Generalized linear mixed effects models were fit using the glmer function in the R package lme4 (Bates et al., Reference Bates, Mächler, Bolker and Walker2015) to assess the effects of internal and social factors on /t d/ release. Regressions were run separately for /t/ and /d/. Regressions were run for Black and White speakers separately because we lack education data for 21 of the 33 Black speakers. Our model building strategy follows a “holistic” approach (Sonderegger, Reference Sonderegger2023:142) in which variables and interactions between them are chosen on the basis of substantive reasons, in this case previous findings concerning /t/ release, common sociolinguistic patterns, and the limitations of our data. The fixed effects included in all models were preceding sound, following sound (after the pause), morphological status, lexical frequency, gender, and year of birth. Categorical predicters were treatment coded, and birthyear was standardized.
The models for White speakers have the additional fixed effect of highest education level completed. The models for White speakers include random intercepts for speakers and random intercepts for words. The models for Black speakers have random intercepts for speakers. More complex random effects structures for both groups resulted in singular fits or non-convergence.
Several interactions between fixed effects were tested in accordance with the hypotheses and distribution of data. Among these, only two improved the models for White speakers as determined by model comparison via the anova function: preceding sound and year of birth, and gender and year of birth. The interaction between year of birth and gender was motivated by the well-known, though not universal, tendency for women to lead linguistic change in the aggregate (Labov, Reference Labov2001). The interaction between year of birth and preceding sound was tested chiefly because preceding sound has shown strong effects in prior studies. Moreover, as Raleigh is undergoing dialect change away from Southern linguistic norms and toward pan-regional “standard” norms, it would not be surprising to find that an apparent-time increase in /t d/ release rates was accompanied by a strengthening of pan-regional internal effects.
Full model summaries appear in Appendix A, Tables A1-A4. In the models for both Black and White speakers, the variables of preceding sound, morphological status, and gender pattern in the expected direction on the basis of previous research: /t d/ release is favored by preceding obstruents, past tense morphemes, and females. Speakers who attended graduate school are more likely to release /t/ than others in White speakers’ /t/ model, but the effect does not quite reach significance in the /d/ model. Less frequent words favor release in all models except Black speakers’ /d/ release model. In the Black speakers’ models, birthyear is not significant. In the White speakers’ models, however, birthyear shows significant effects: a more positive birthyear slope (meaning, in this case, a greater apparent-time rise in release rates) is associated with men relative to women, and preceding obstruents relative to preceding vowels. Note that in the White speakers’ models, the presence of the interactions means that the coefficients for the effects of preceding sound and gender indicate the estimates when standardized birthyear = 0, which is the mean birthyear. Similarly, the simple effect of birthyear gives the estimated birthyear slope for females and when the preceding sound is an obstruent.
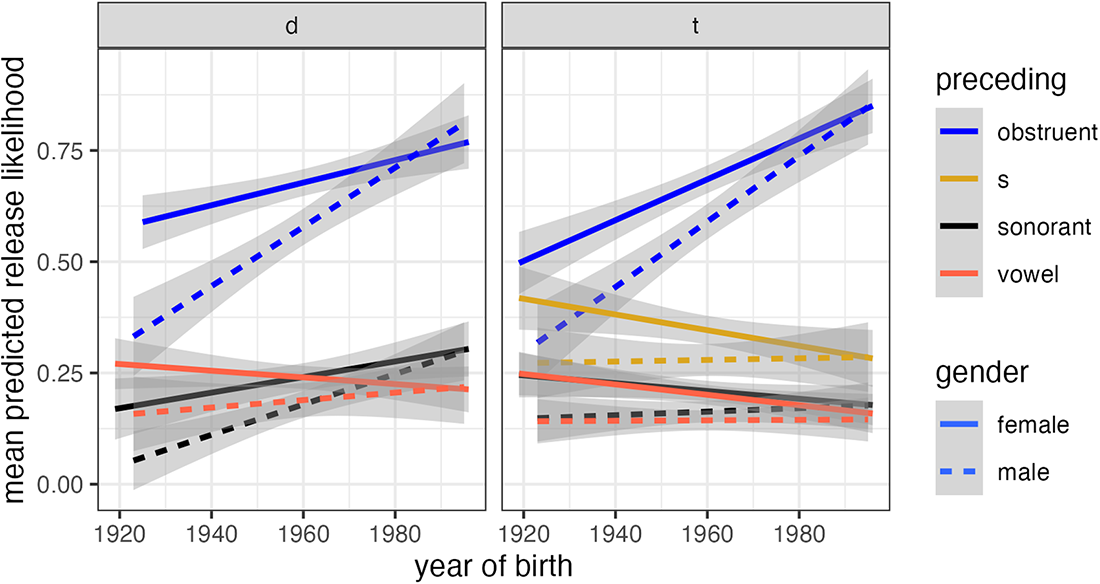
Model comparison determined that none of the tested interactions between fixed effects improved the /t/ and /d/ models for Black speakers. The interactions between birthyear and preceding sound, and between birthyear and gender, in the models for White speakers are represented in Figure 5, which shows the mean predicted likelihood of release for all combinations of birthyear, preceding sound, and gender. In the early-20th century, White speakers’ release rates were generally low, but women had higher release rates after obstruents. Over time, men acquired the same effect of preceding obstruents, and the effect of preceding sound strengthened among both men and women as indicated by rising release rates after obstruents. In summary, while individual differences remain high, a pan-regional internal factor has strengthened in apparent time among White speakers but not Black speakers.
Mean predicted /d/ and /t/ release likelihood, White speakers only.
Neither White nor Black speakers show a significant effect of following vowel versus consonant, but recall that the following interval is actually a pause, and “following sound” here refers to the consonant or vowel after the pause.
Finally, we note that in all of the /t d/ release models, the marginal R 2, a measure of the variance accounted for by fixed effects, is substantially smaller than the conditional R 2, indicating that the random effects account for a great deal of variance. Inter-speaker variation is high, even in the presence of significant linguistic effects.
The rising /t d/ release rates likely reflect ongoing dialect contact in Raleigh, which has resulted in the gradual shift from Southern linguistic norms to pan-regional American English norms. The near-identical distribution of /d/ release with respect to internal and social factors is a new finding that requires further exploration, especially with respect to individual words and their discourse functions. Many speakers release /d/ in the word and when holding the floor during a pause, though and is not driving the apparent-time change; its release rate is unexceptional in the sample, even among the youngest speakers.
In the /t/ release model for White speakers, the five words with the highest intercepts are built, aunt, eight, dirt, and straight. Among the 37 prepausal occurrences of aunt, 20 are classified as unreleased by the random forest, and 17 are classified as released. We coded the 37 tokens impressionistically in order to check the random forest’s predictions. In 31 of the 37 tokens of aunt, the impressionistic coding matches the random forest model’s prediction. In three of the remaining six cases, there are transcription errors or other obstacles: in one case, aunts was incorrectly transcribed as aunt; another case was a false start, and in another case, the interviewer was talking over the speaker. The remaining three tokens had short releases but were incorrectly classified as unreleased by the random forest.
When the /t/ in aunt is released, it usually corresponds to the introduction of the aunt as a new character in the speaker’s narrative, as in (1a-c):
(1) (a) My uh aunt (pause) Joyce who was very prim and proper …
(b) Well we still have an aunt (pause) who lives in Springmoor.
(c) My aunt (pause) um was a renowned English teacher at [high school].
When aunt is unreleased, it usually refers to a person who has been introduced earlier in the narrative as in (2):
(2) …[my father] had an older sister named Louise and Louise had four kids, that’s the one that lived in Silver Spring, Maryland. So during the sixth grade I would go up … and stay for a couple weeks with my aunt.
It appears that prepausal released /t/ and /d/ can index new information, akin to syntactic and prosodic techniques for presenting new or focal topics (Lambrecht, Reference Lambrecht1996).
/t d/ release magnitude
Having assessed the social and linguistic factors correlated with /t d/ release, we turn to the release magnitude of tokens classified as released by the random forest model. Recall that the release magnitude index combines release duration, release amplitude, and the spectral amplitude difference between the main spectral peak and the lowest spectral trough. A release magnitude value of 1 corresponds to the reference sounds (/tʃ/ for release duration and release amplitude, /s/ for spectral amplitude difference).
Release magnitude data
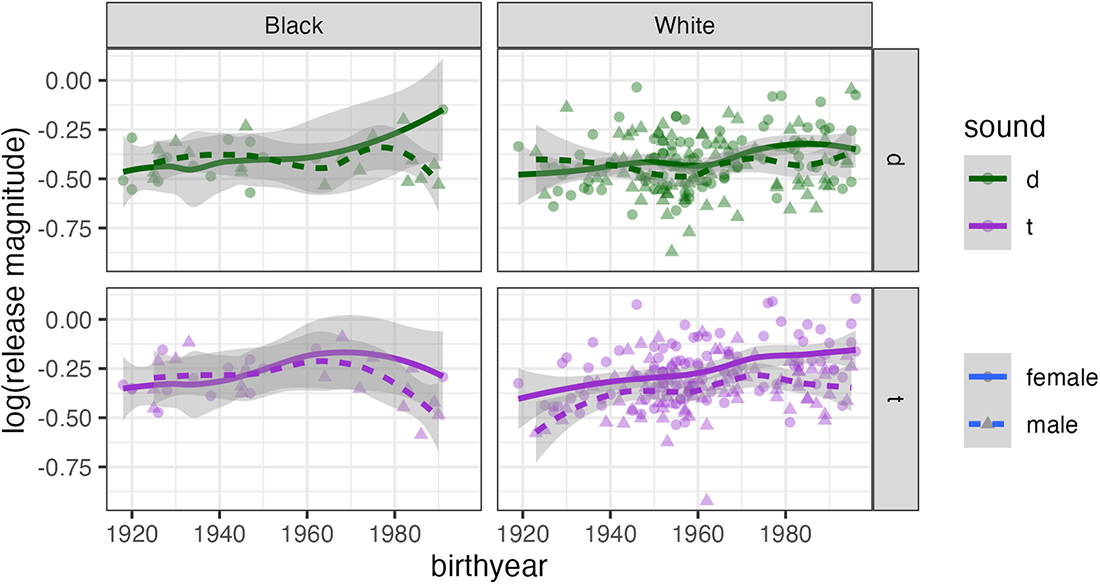
The distribution of release magnitude values (Figure 6) is similar for Black and White speakers despite the large difference in number of released tokens (Black: n = 1253, White: n = 12,077). Black speakers have lower release rates in the aggregate, but when they do release /t d/, their release magnitude is similar to that of White speakers. A larger sample of Black speakers, especially women born in the 1980s and 1990s, would be needed to confirm this impression. Inter-speaker variability is high in both groups, as in the case of release versus non-release. The appearance of an upward trend for /d/ among Black females is due entirely to one speaker born in 1991 who was interviewed by a White peer, the same speaker who appears as an outlier in Figure 4.
Per-speaker means of log(release magnitude) for /t/ and /d/ among Black (n = 1253) and White (n = 12,077) speakers.
/t d/ release magnitude: mixed effects linear regression
We investigated the relationship between release magnitude and both internal and social factors using mixed effects linear regression models fit with the lmerTest package in R (version 3.1-3, Kuznetsova, Brockhoff, & Christensen, Reference Kuznetsova, Brockhoff and Christensen2017). The dependent variable is the natural log of release magnitude. We began with the most complex random effects structure that allowed for convergence, which was similar to the random effects in the /t d/ release models: for White speakers, the models include random intercepts for speakers and words, plus (in White speakers’ /d/ model) by-speaker random slopes for preceding sound. The models for Black speakers include random intercepts for speakers, and the /d/ model for Black speakers additionally has random intercepts for words. The fixed effects in all models are the same as those in the /t d/ release models. Well-motivated interactions among fixed effects were tested via model comparison. A polynomial term for birthyear was tried in the /t/ and /d/ models for White speakers but did not improve the model fits. Model summaries appear in Appendix B, Tables B1-B4.
In both the /t/ and /d/ release magnitude models for White speakers, preceding obstruents are associated with higher-magnitude releases relative to preceding vowels, and relative to preceding /s/ in the /t/ model, and their release magnitude shows greater apparent-time change as indicated by the interaction term (Figure 7). In the case of /t/, predicted release magnitude for preceding obstruents and preceding sonorants is similar. The effect of birthyear in the regression table indicates the birthyear slope for preceding obstruents due to the presence of the interaction. Women have higher predicted release magnitude than men. In the /t/ model, past tense morphemes have higher predicted release magnitude than monomorphemes. The youngest White speakers in the corpus still commonly produce low-magnitude /t d/ releases, especially after vowels, but they produce high-magnitude releases more frequently than older speakers.
Mean predicted /t d/ release magnitude, White speakers only.
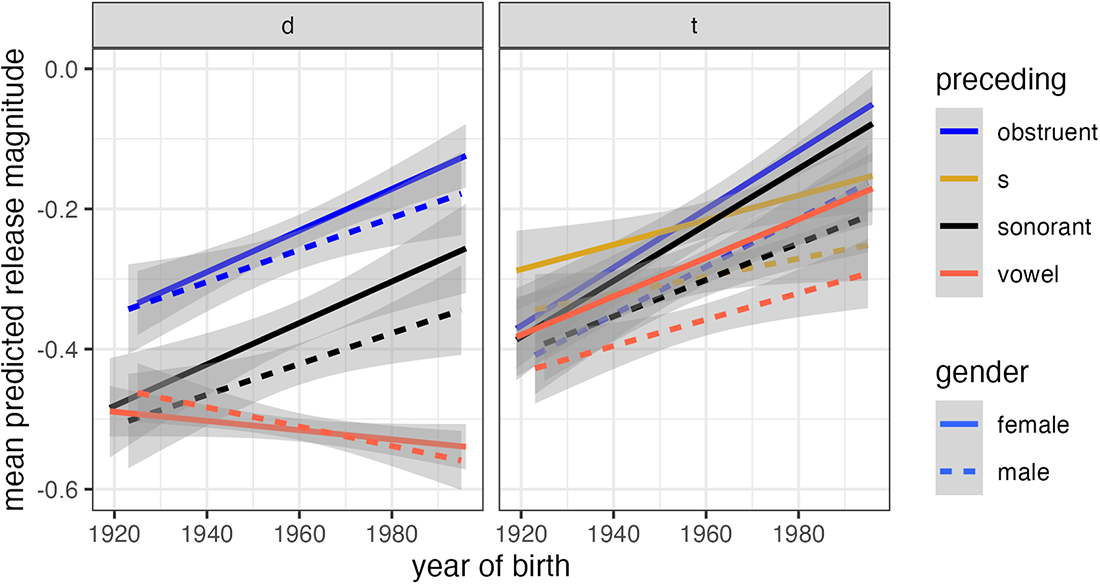
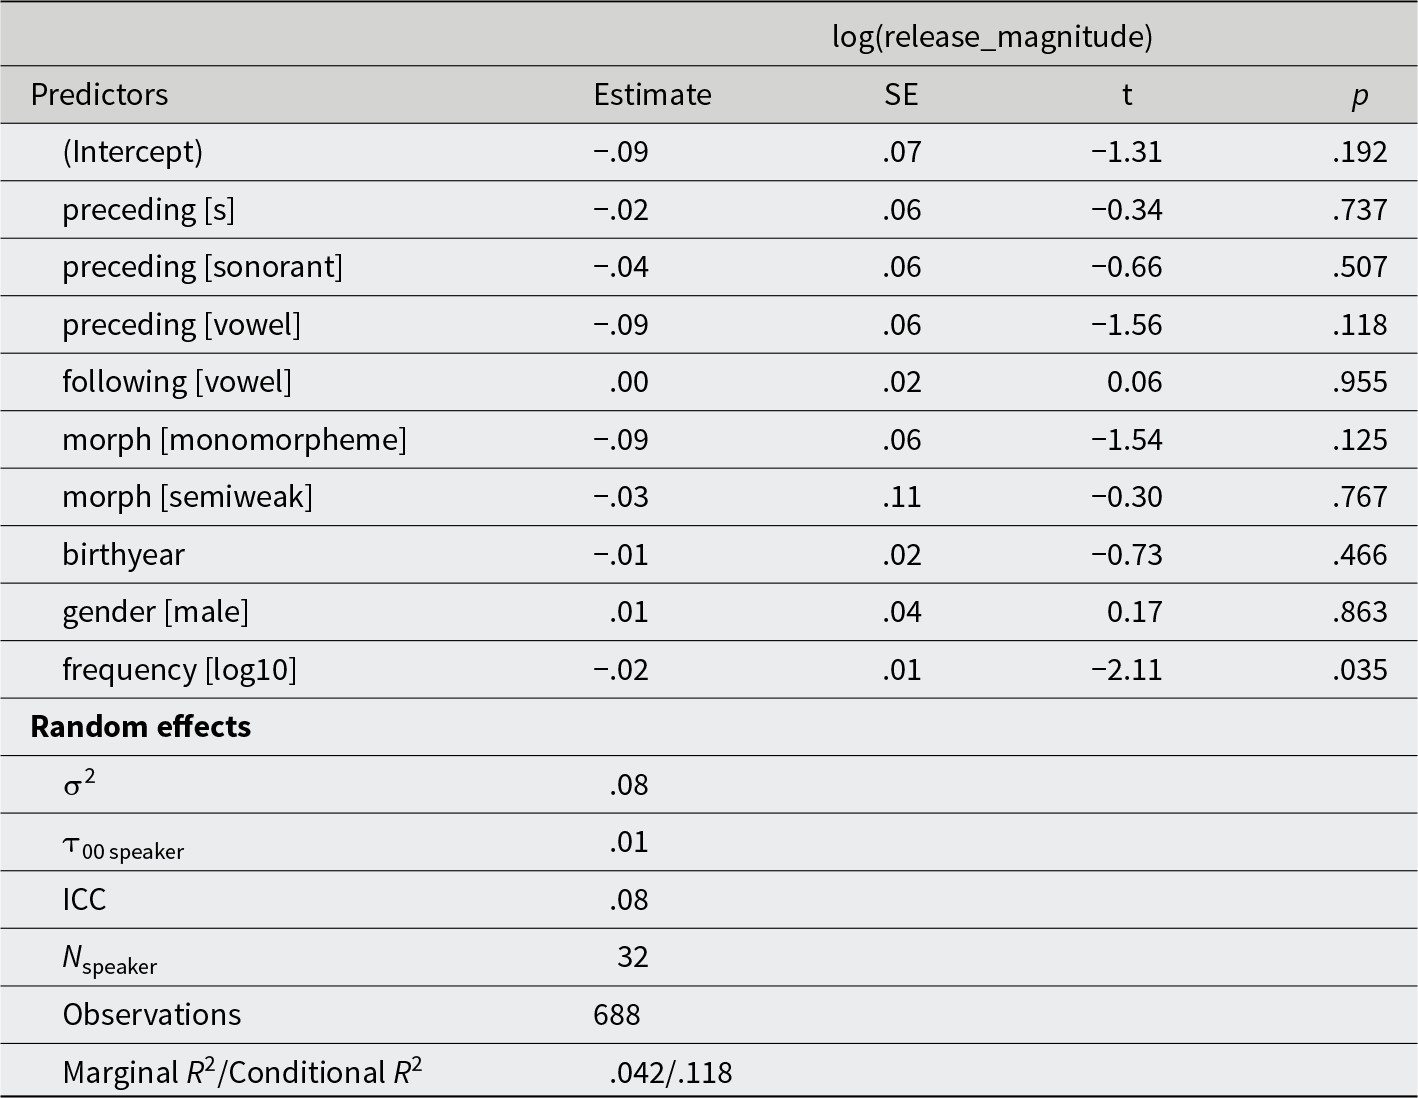
The results for Black speakers are quite different. In the /t/ release magnitude model, only lexical frequency has a significant effect, with high-frequency words predicted to show lower-magnitude releases. In Black speakers’ /d/ release magnitude model, the only significant factor is preceding sound: preceding obstruents are associated with higher release magnitude relative to preceding sonorants and vowels. There is no evidence of change across apparent time for Black speakers.
In all of the release magnitude models, comparing the conditional and marginal R 2 values indicates that the random effects account for more of the variance than the fixed effects. Even in the context of the familiar, pan-regional effects of preceding sound, morphological status, and lexical frequency, inter-speaker variation is high and is only partly reducible to gender and birthyear for White speakers, and not significantly for Black speakers.
We argued that one pragmatic use of released /t d/ is to introduce new information in narratives. We investigate the pragmatic function of the increasingly prevalent high-magnitude /t d/ releases by looking at the highest-magnitude releases among the 703 released tokens produced by speakers born in the 1990s. High-magnitude releases appear to be used for holding the floor while pausing to think or slowing down before giving new information. This happens often when speakers are listing events in their lives chronologically. In (3a–f), the bolded words contain strong releases; the examples in (a–b) contain the two highest-magnitude releases in the 1990s sample.
(3) (a) I never got (pause) my um (pause) First Communion and then it’s something else, Confirmation.
(b) You know, Wakefield schools are right in a row together um (pause) and (pause) high school except for the Freshman Center is what they call it.
(c) I think it was just convenience um and (pause) the fact that you know I was an in-state student I was paying in-state tuition.
(d) And then I worked (pause) at (pause) Chuck E Cheese for one summer.
(e) And we moved (pause) out (pause) close to kind of like, it was like North Raleigh.
(f) Our plan is to get a very large space that can accommodate (pause) both a shop, a showroom, um offices and storage.
Discussion
Different trends: Black and White speakers
The distribution of release versus non-release is consistent with previous research: preceding obstruents are associated with higher release rates, as are past tense morphemes, low-frequency words, and women. White speakers’ /t d/ release rates are rising after obstruents, and release magnitude is rising for White speakers, especially after obstruents or sonorants. Black speakers, in contrast, show both apparent-time stability and fewer internal constraints. We can attribute some differences between the Black and White regression results to the unequal sample sizes, but we can also recognize Black speakers’ stability in the context of other evidence of the stability of African American English (AAE) vowels in Raleigh and in the South even in the context of linguistic change in adjacent dialects (Kohn, Reference Kohn2013, Reference Kohn, Reaser, Wilbanks, Wojcik and Wolfram2018; Smith, Sonderegger, & Dodsworth, Reference Smith, Sonderegger and Dodsworth2024; Thomas, Reference Thomas2001, Reference Thomas2007). In Raleigh, one reason for linguistic stability in AAE appears to be racial segregation. The Raleigh-Cary metropolitan area has a very high “Black-White divergence” score (Menendian, Gailes, & Gambhir, Reference Menendian, Gailes and Gambhir2021), indicating pronounced residential segregation. At the same time, the social and pragmatic functions of released /t d/ likely contribute to the differences between Black and White Raleigh speakers.
The social meaning of /t d/ release in Raleigh
In the context of sociolinguistic interviews, Raleigh speakers use strong /t d/ releases to hold the floor and indicate that new information is coming. But strong /t d/ releases have powerful, multifaceted indexicality in the U.S. and elsewhere. When Raleigh speakers use strong /t d/ releases, they necessarily use not only a discourse pragmatic tool but also a symbol that indexes locally or situationally relevant social meanings. In the context of Raleigh, symbolic choices are made within the changing cultural landscape in which a formerly mid-sized Southern town is becoming a large urban center that is only secondarily Southern. For several decades, White speakers in Raleigh have been replacing Southern vocalic variants with pan-regional variants such as diphthongal /ai/ in words such as tide or high (Dodsworth & Benton, Reference Dodsworth and Benton2017, Reference Dodsworth and Benton2020; Dodsworth & Kohn, Reference Dodsworth and Kohn2012; Lundergan, Reference Lundergan2024) as educated people from outside the South move to Raleigh for jobs in the technology industry, universities, and other sectors. We expect that the increasing use of /t d/ release is part of the general linguistic turn away from traditional Southern identities and toward urban Southern, or just urban, self-presentation. The ideological link between released /t d/ and personal qualities such as educated, professional, or White allow Raleigh speakers to distance themselves from longstanding negative stereotypes about Southerners and Southern speech (Cramer, Reference Cramer, Cramer and Montgomery2016; Preston, Reference Preston, Bernstein, Nunnally and Sabino1997, Reference Preston, Picone and Davies2015) without letting go of what they see as positive elements of Southern culture.
The excerpt in (4) is from an interview with a White male Raleigh speaker born in 1994. The interviewer is a White male from the large Southern city of Charlotte, North Carolina. The final /d/ release in raised in the excerpt is in the top 5.4% of releases, by magnitude, among speakers born in the 1990s, and sounds similar to [ts].
(11)
Interviewer: So do you feel like you’re Southern?
Speaker: I don’t know. {laughs} Uh I was raised (pause) in Raleigh which I do and don’t consider the South. See, my take is, it’s North Carolina. It’s got the word north in it. {laughs} But uh it’s the South, no doubt. You’ll find a lot of people from the South down here, a lot of people that call it the South. Everyone does, actually, except for me. But uh, my mom’s from the South, my dad’s from the North, I don’t know how to really answer that. … I try to be polite. I let people in when I’m driving. Go up to Maryland and they won’t let you do that, uh Maryland, Pennsylvania. You sit at the stoplight after it turns green for half a second, everyone’s laying on their horn, and you’re like what did I do? … Not down here, you’ve got five minutes. {laughs} … They just sit there patiently.
The speaker echoes others in the Raleigh corpus in expressing ambivalence about his own, and Raleigh’s, status as Southern or not Southern. Like many others, he embraces what he understands to be the characteristic friendliness of Southern people, in opposition to (perceived) Northern impatience, but he nevertheless does not straightforwardly identify as Southern. The increasing prevalence of aregional or pan-regional linguistic features, including high-magnitude /t d/ releases, does not specifically index non-Southern identity but is rather one of many linguistic elements that mark the ongoing shift away from a regionally based cultural identity.
Conclusion
Our acoustic method for assessing prepausal /t d/ release finds validation in the effects of preceding sound, morphological status, and lexical frequency, which closely resemble effects found in previous studies. The method additionally allowed us to consider social effects in a large corpus, at a scale that would have been unrealistic for impressionistic analysis. We found that /t d/ release is conditioned by gender for both Black and White speakers in Raleigh and is changing in apparent time for White speakers. The magnitude of /t d/ release also shows apparent-time change for White speakers, strengthening across time as Raleigh’s transition away from Southern linguistic norms continues.
Acknowledgements
The National Science Foundation supported the collection of the Raleigh corpus (BCS-1323153) and the development of the data analysis tools (BCS-1451475 and SMA-1730479). We are grateful to two anonymous reviewers.
Competing interests
The authors declare none.
Appendix A
Mixed effects logistic regression summaries for /t/ release and /d/ release
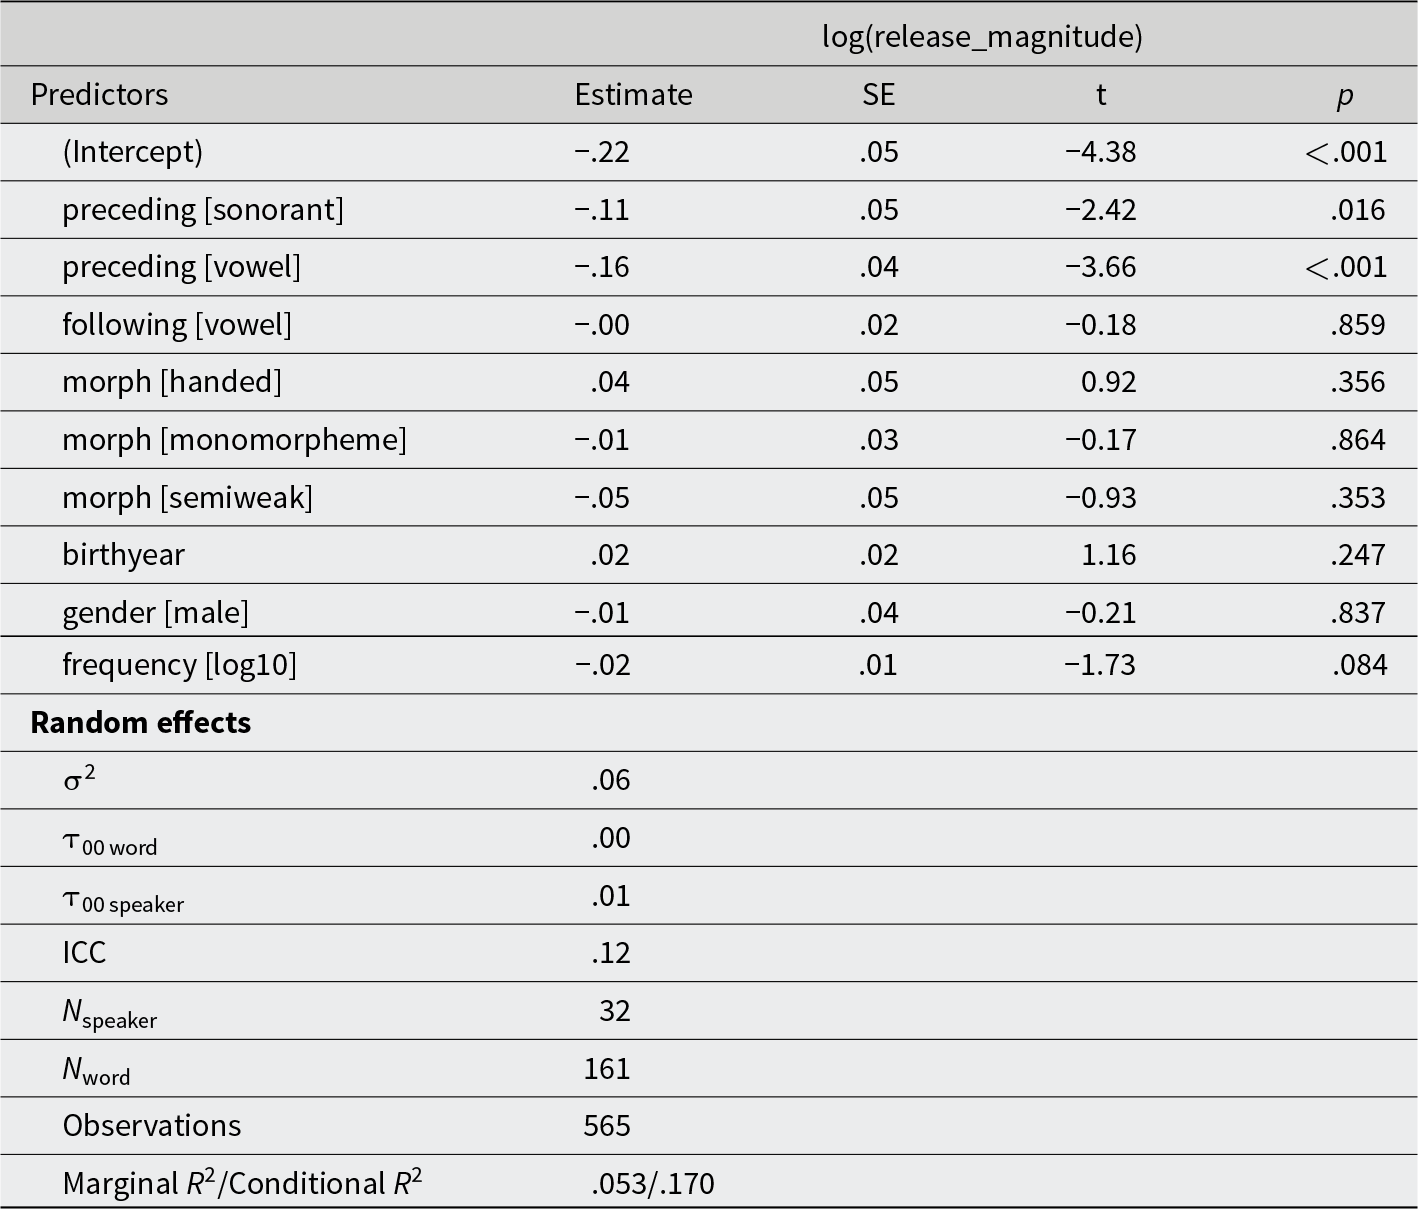
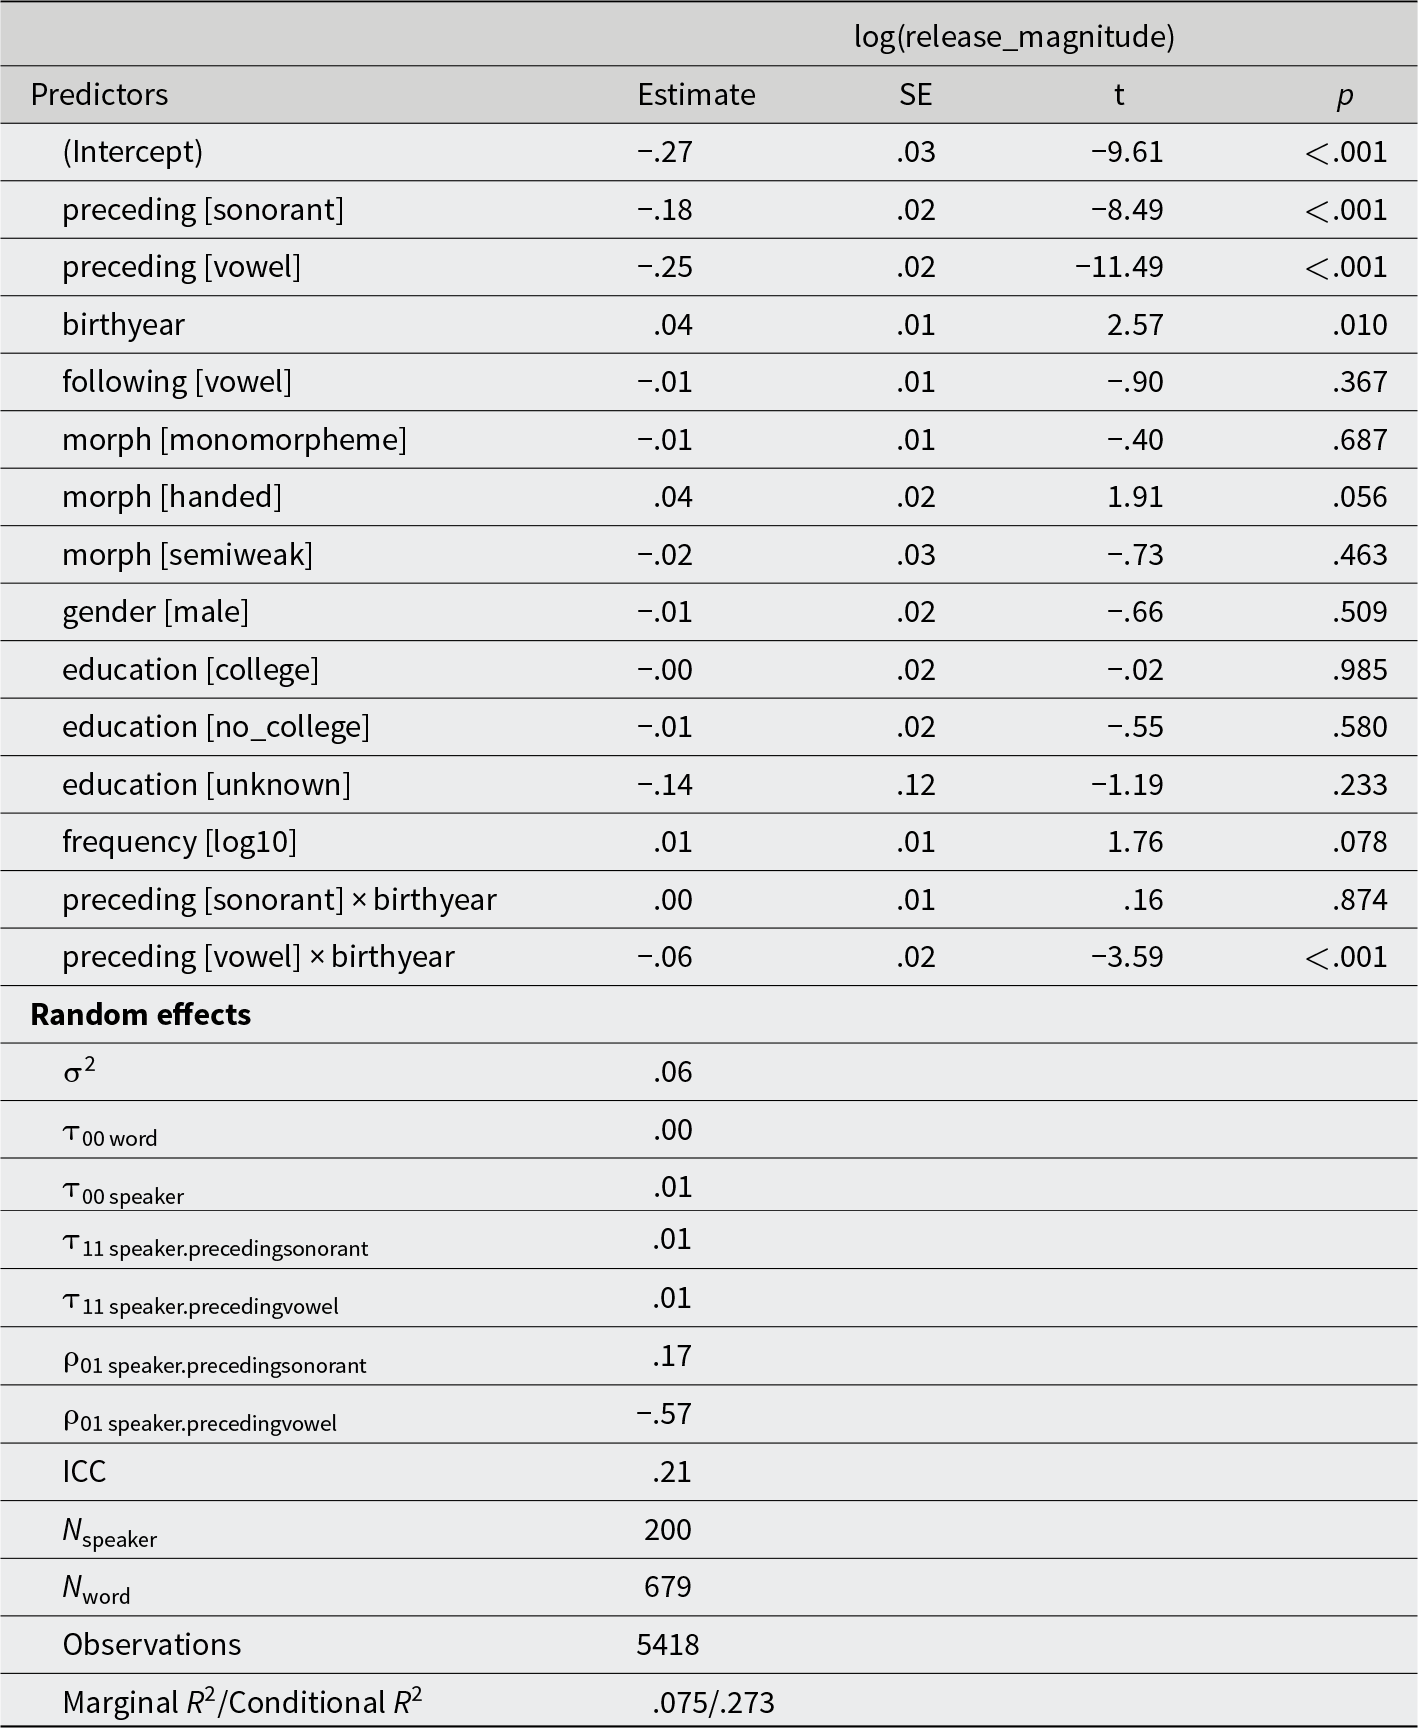
The reference level for the dependent variable is unreleased. Reference levels for the independent variables are as follows: preceding sound: obstruent; following sound: consonant; morphological status: past tense; gender: female; education: graduate.
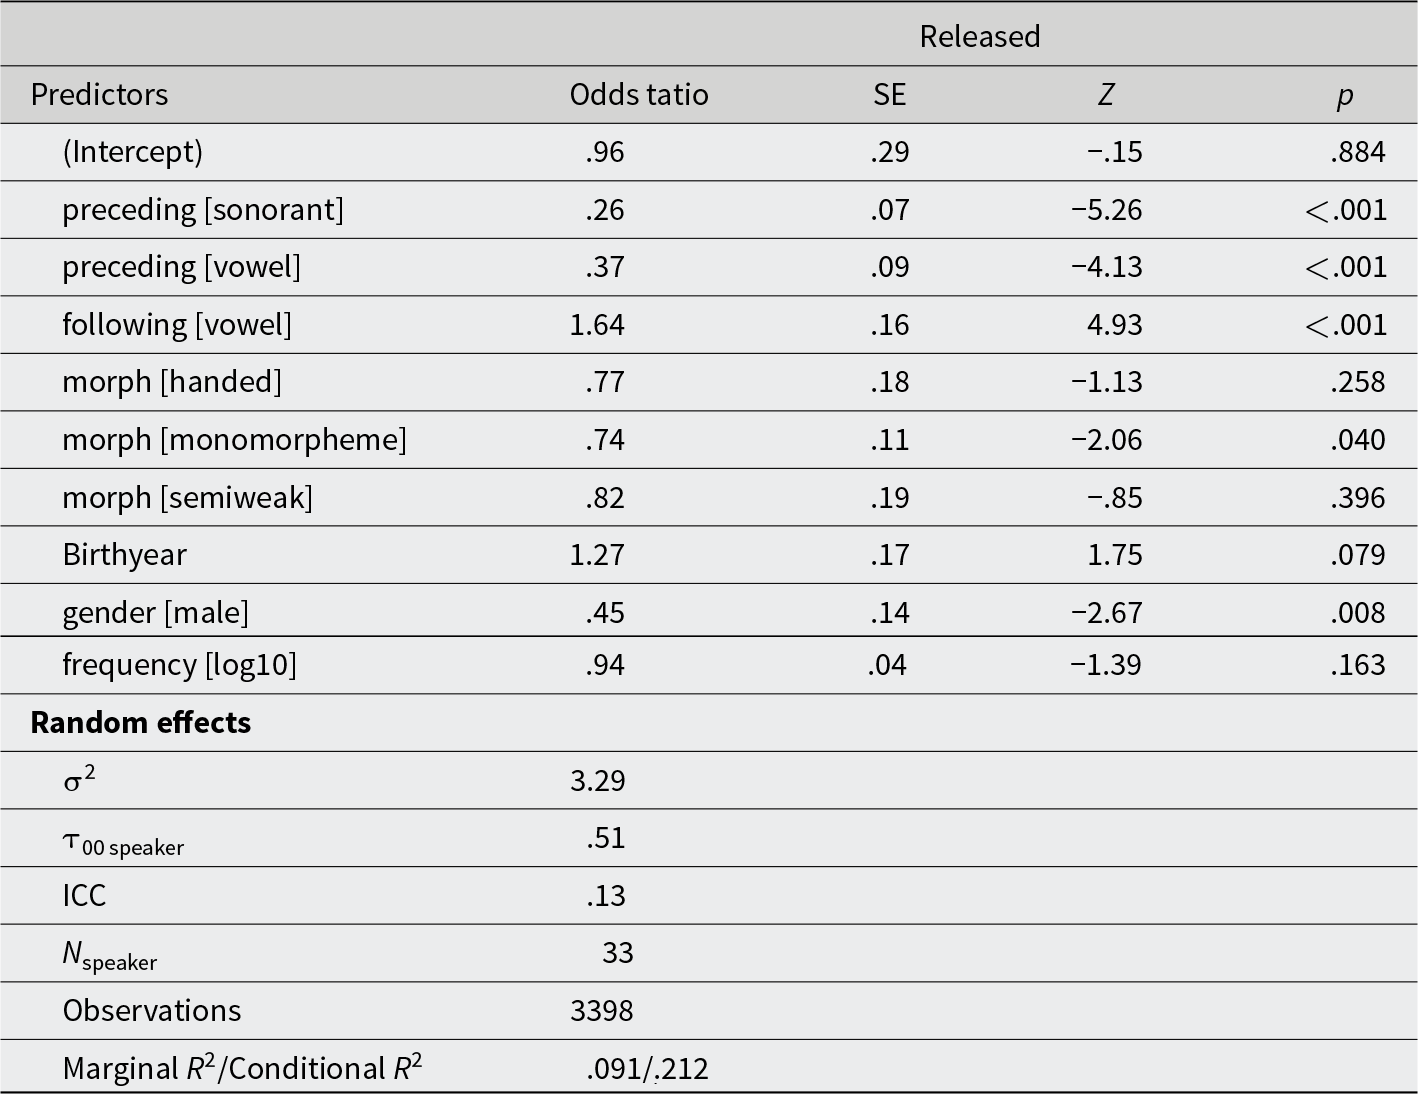
Black speakers, /t/ release
Black speakers, /d/ release
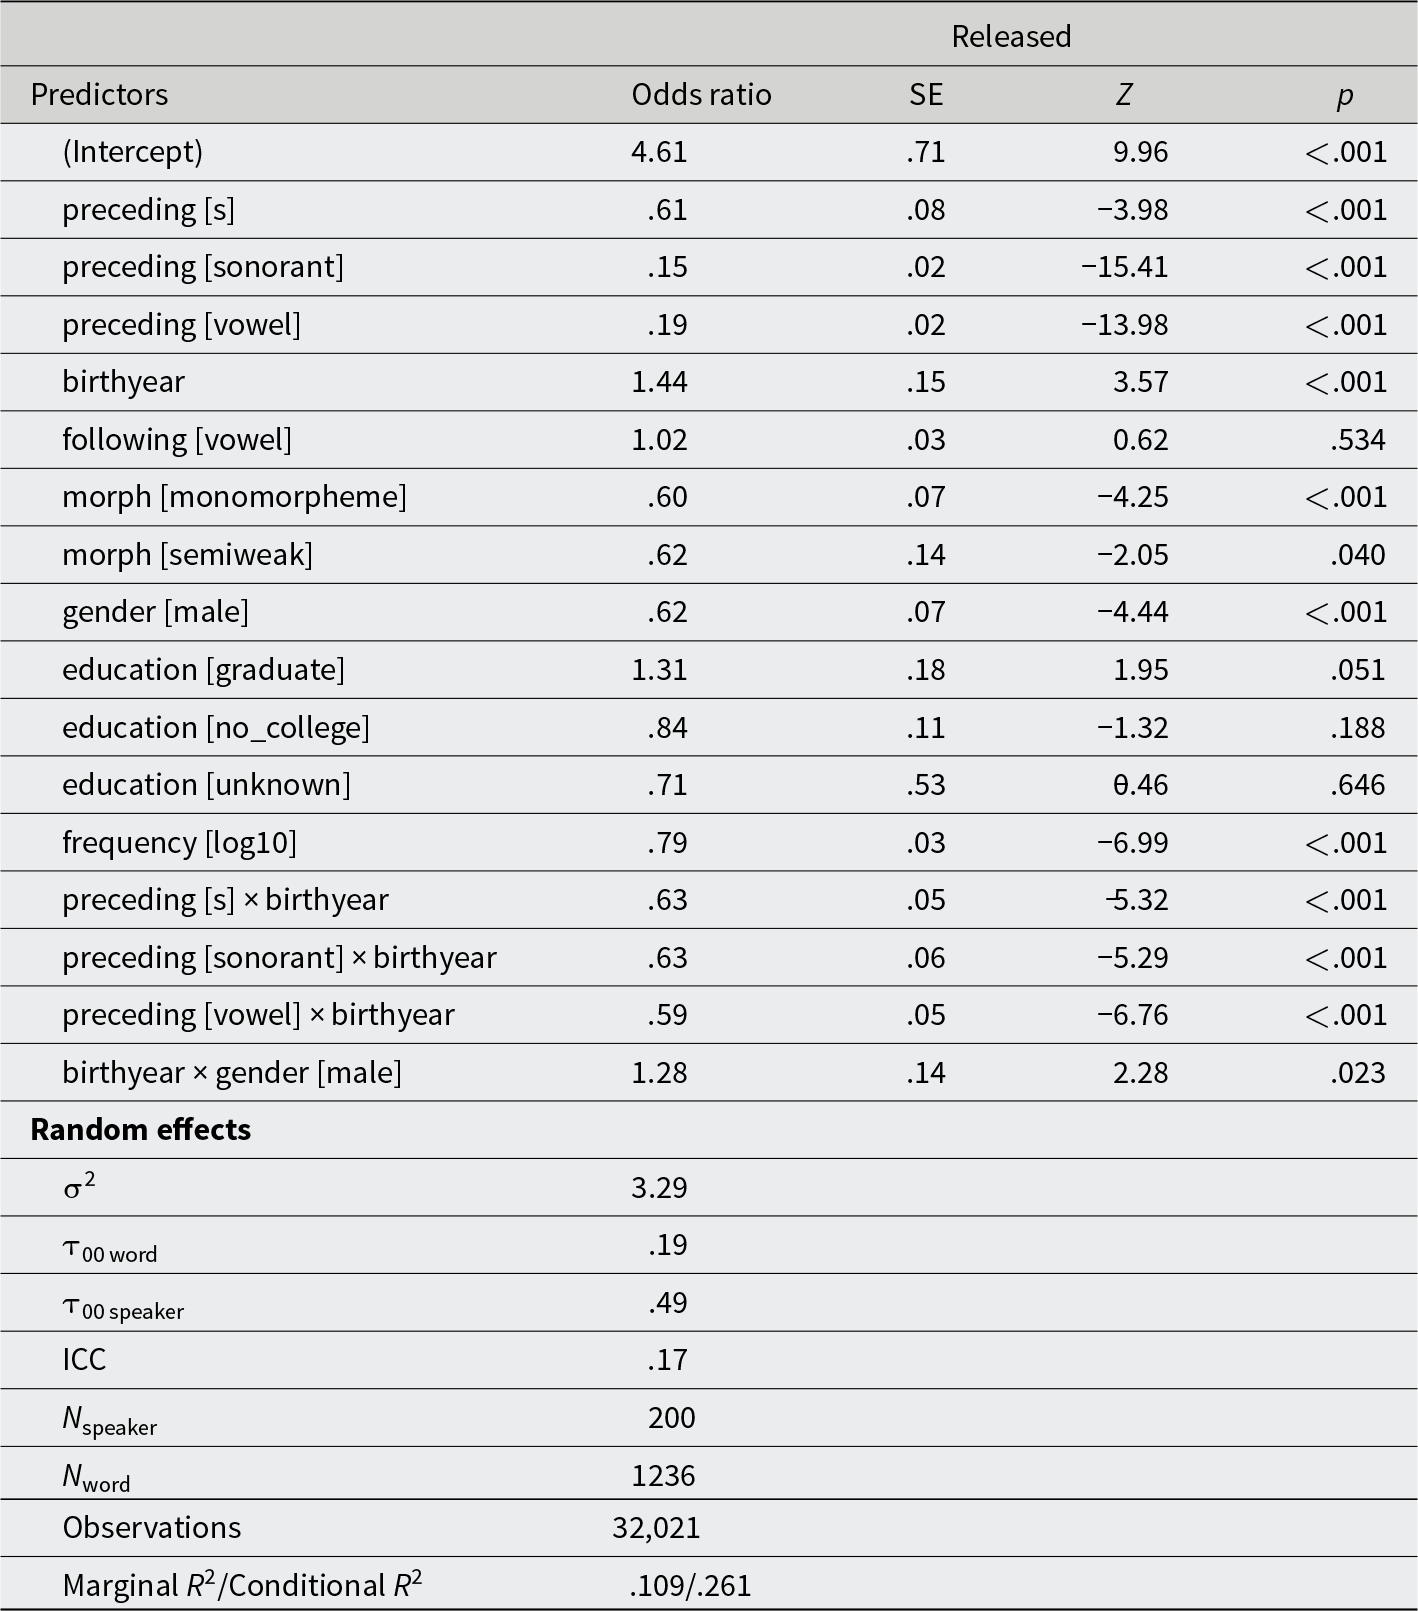
White speakers, /t/ release
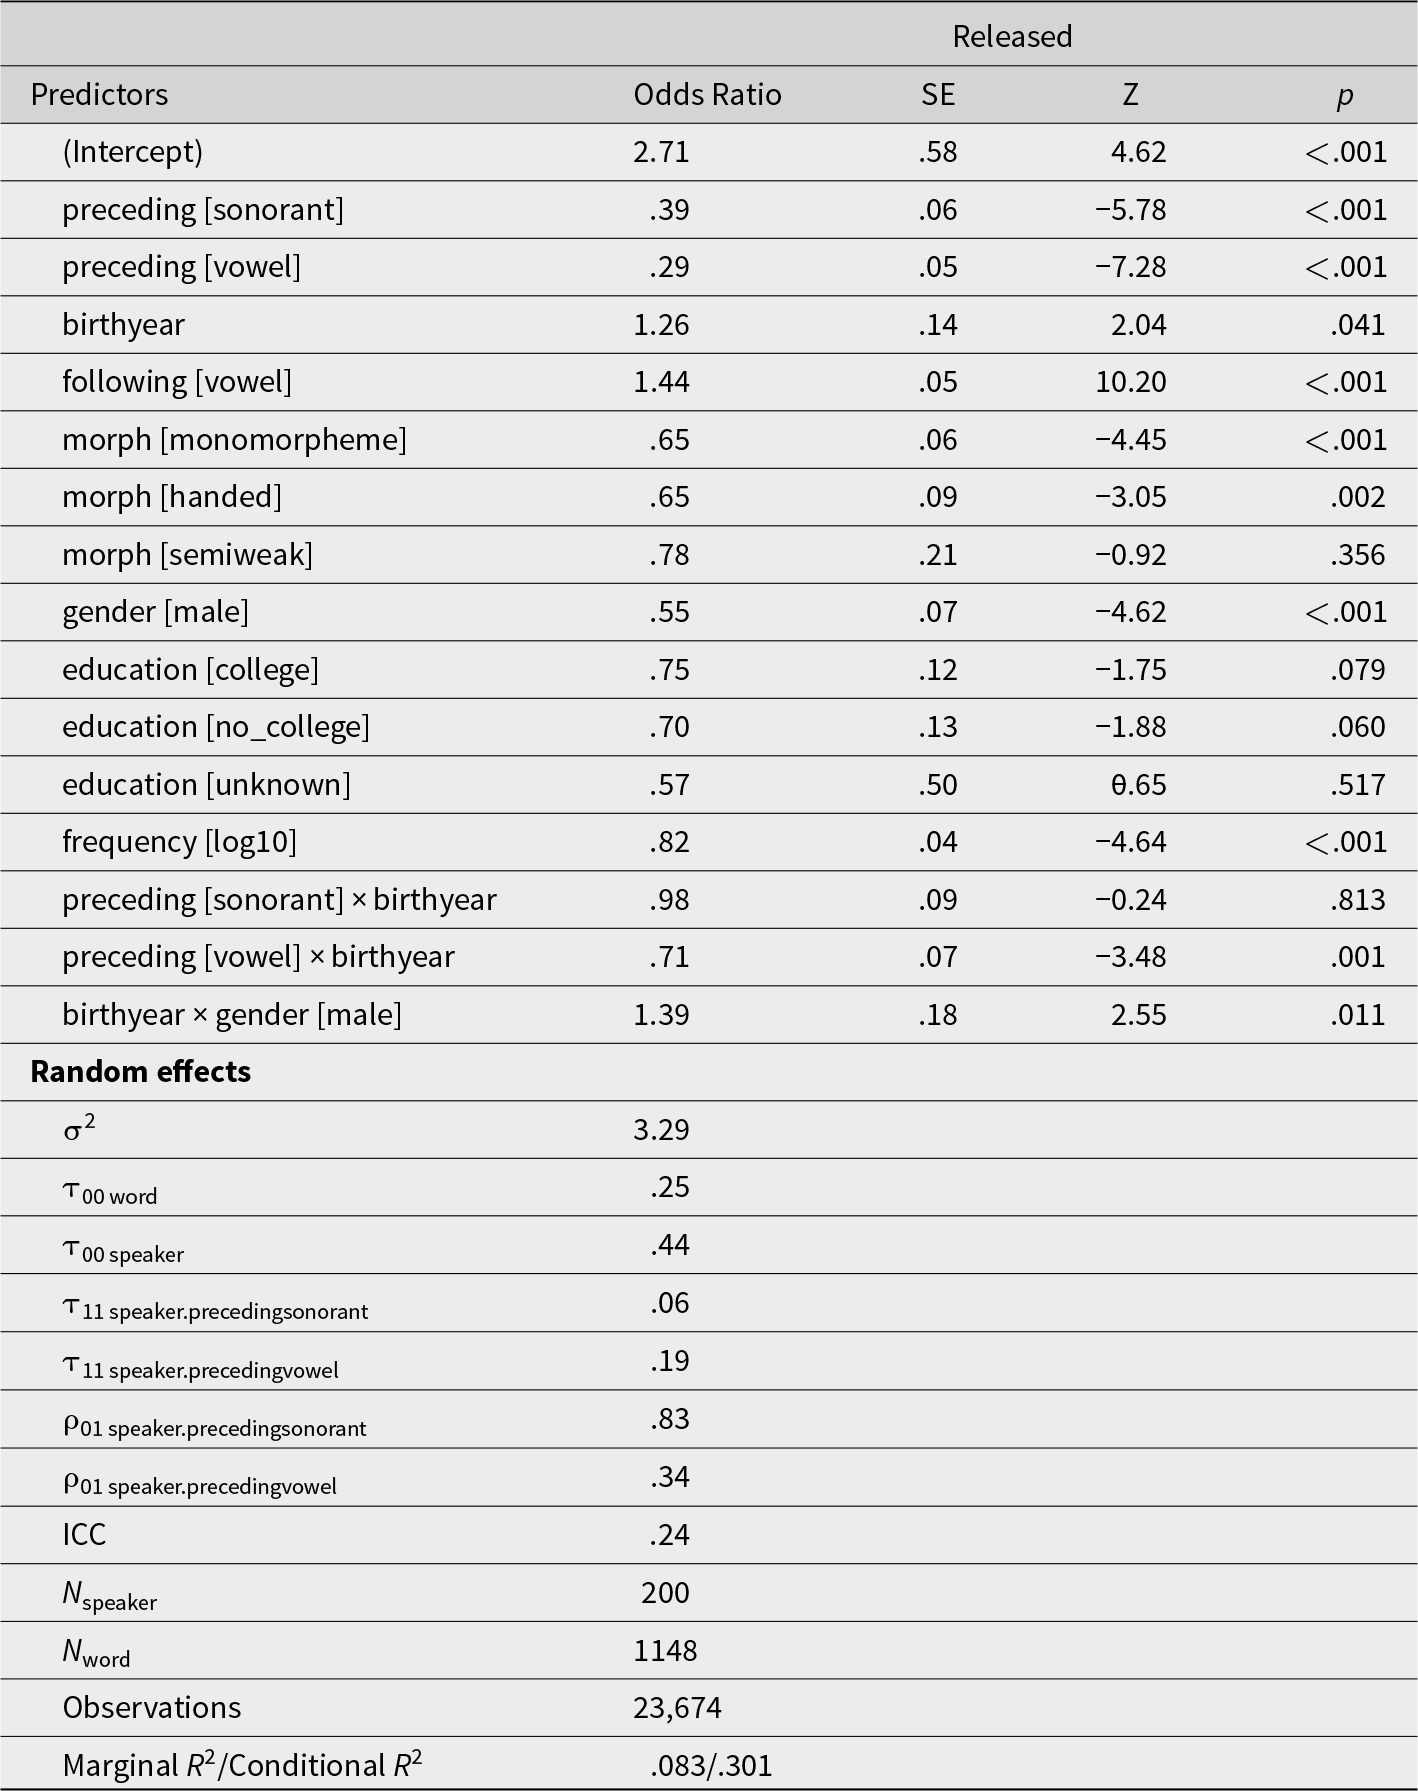
White speakers, /d/ release
Appendix B
Mixed effects linear regression summaries for /t/ and /d/ release magnitude
Reference levels for the independent variables are as follows: preceding sound: obstruent; following sound: consonant; morphological status: past tense; gender: female; education: graduate.
Black speakers, /t/ release magnitude
Black speakers, /d/ release magnitude
White speakers, /t/ release magnitude
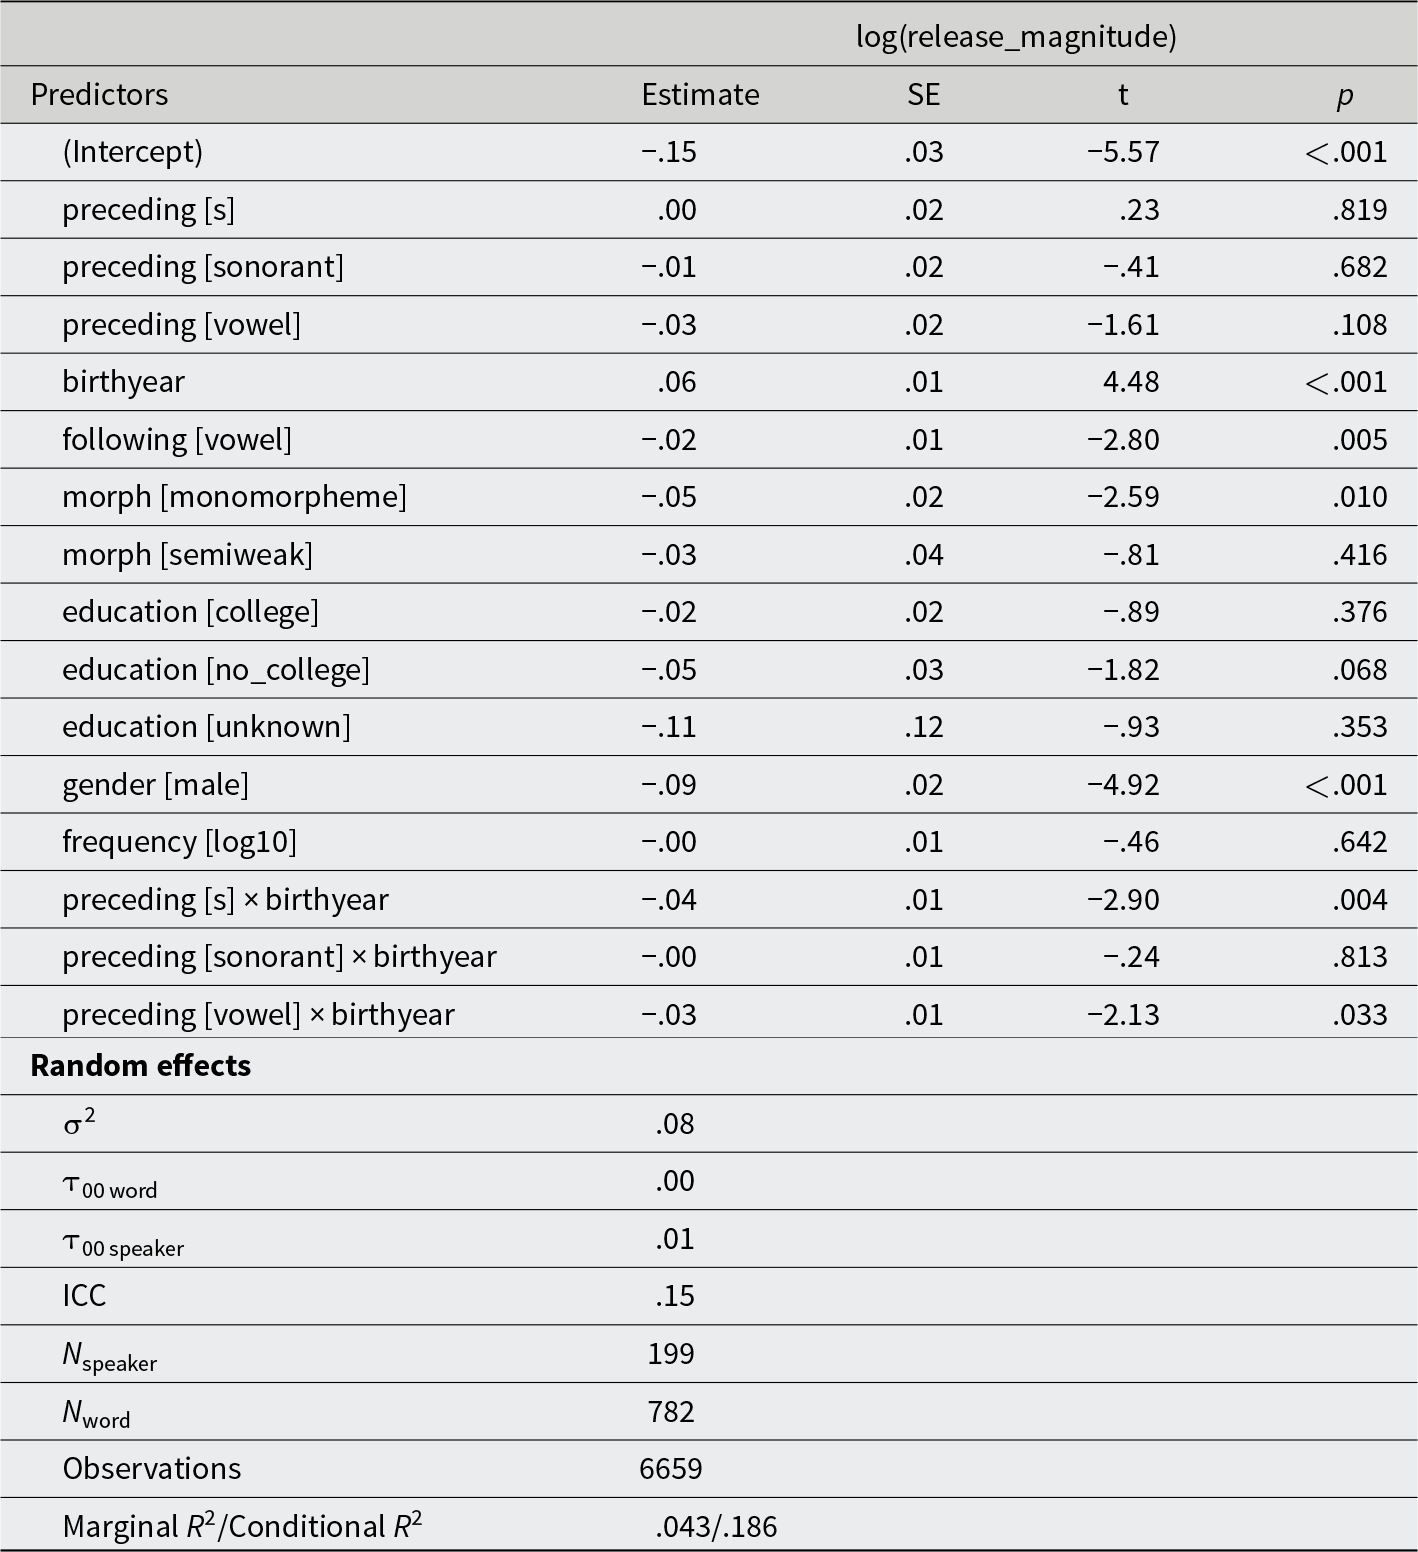
White speakers, /d/ release magnitude


 Open access