





Introduction
In the past century, central investigations have laid the foundations for understanding the interaction between electromagnetic fields and biological materials, leading to the establishment of microwave dielectric spectroscopy applied to biological and medical applications [Reference Schwan1]. Microwave dielectric spectroscopy is getting increased attention as it provides attractive features such as giving access to intracellular information, being noninvasive, label-free, and cost-effective for biological studies. Moreover, microwave-based sensors offer the advantages of high sensitivity, as well as timeliness in the provided response, and the ability to probe complex biological samples and processes. This technique has already been demonstrated for the analysis of cells, from single cell [Reference Chen, Dubuc, Poupot, Fournié and Grenier2, Reference Tamra, Zedek, Rols, Dubuc and Grenier3] to organ investigations, including cell suspensions measurements [Reference Artis, Chen, Chrétiennot, Fournié, Poupot, Dubuc and Grenier4, Reference Grenier, Dubuc, Poleni, Kumemura, Toshiyoshi, Fujii and Fujita5]. Recently, a microwave sensor has also been developed for the dielectric characterization of microtissues in the microwave frequency range [Reference Peytral-Rieu, Grenier and Dubuc6]. This biological model, also called spheroids and even organoids when exhibiting advanced composition close to the physiological complexity of the in vivo tissues, are widely used for in vitro biomedical research. It indeed closely mimics the realistic cellular behavior found in tissues and organs, while limiting in vivo experiments. Depending on culture parameters, 3D microtissues exhibit a drug response closer to that obtained with humans than with an animal model [Reference Pinto, Henriques, Silva and Bousbaa7, Reference Khot, Levenstein, Kapur and Jayne8].
So far, traditional equipment employed to analyze such bio-models is based on optical ones. The microwave sensing technology can therefore provide a complementary characterization technique based on the dielectric properties. Its previously listed advantages make it suitable for various applications, with further insights for drug testing or physiological functions, for instance. However, existing microwave sensors and associated electrical models applied to biological and medical applications are mainly designed to operate with 2-port structures such as Coplanar Waveguide (CPW) or microstrip waveguides, interdigitated electrodes, or resonators [Reference Chen, Dubuc, Poupot, Fournié and Grenier2–Reference Peytral-Rieu, Grenier and Dubuc6; Reference Bao, Ocket, Bao, Doijen, Zheng, Kil, Liu, Puers, Schreurs and Nauwelaers9–Reference Mertens, Chavoshi, Peytral-Rieu, Grenier and Schreurs13]. Those sensors are appropriate in getting a global response of the entire sample. Nevertheless, such a 3D bio-model may present a structural heterogeneity with a necrotic core surrounded by senescent and proliferating cells as well as unperfect spherical shape. Two-port sensors are consequently incompatible with a more precise consideration of the microtissue structure, limiting and even hindering a comprehensive understanding of complex biological systems.
This paper, therefore, introduces a 4-port sensor configuration aiming to analyze a 3D entity, while considering not only its global dielectric response but also focusing on specific parts of this entity. The first step toward mapping of such a complex 3D structure is to consider it as divided into four parts. It implies developing an electrical model tailored specifically for the 4-port microwave-based sensor. The architecture of the 4-port sensor as well as its microfluidic part is illustrated in Section II. The next section is then dedicated to the electrical model specifically developed for such a structure. To validate this electrical model, a mathematical verification is then performed. Afterward, preliminary experiments are carried out with different elementary models. Ethanol-based aqueous solutions are first evaluated in Section V due to their homogeneity, whereas Section VI is dedicated to the numerical and experimental investigation of polystyrene beads with two diameter sizes (200 and 150 µm). An earlier version of this paper was presented at the 54th European Microwave Conference and was published in its Proceedings [Reference Li, Peytral-Rieu, Dubuc and Grenier14].
Architecture of the 4-port biosensor and its microwave measurement test setup
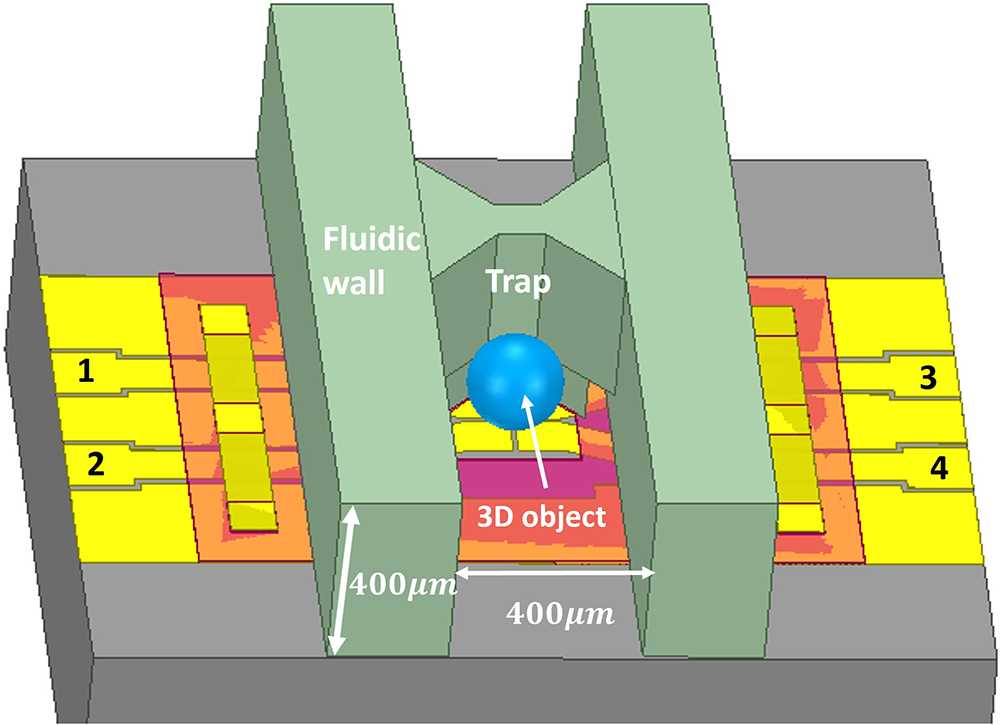
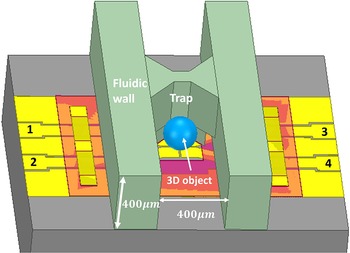
A schematic view of the 4-port sensor is given in Figure 1. It includes a metallic part dedicated to the propagation of electromagnetic waves and a fluidic part for handling and maintaining biological samples in their living cell culture medium.
Tilted view of the 4-port sensor with a 200 µm-diameter 3D object (in blue) trapped in the center of the sensing area. Fluidic walls are shown in green color and include a central trap in the middle of the structure.
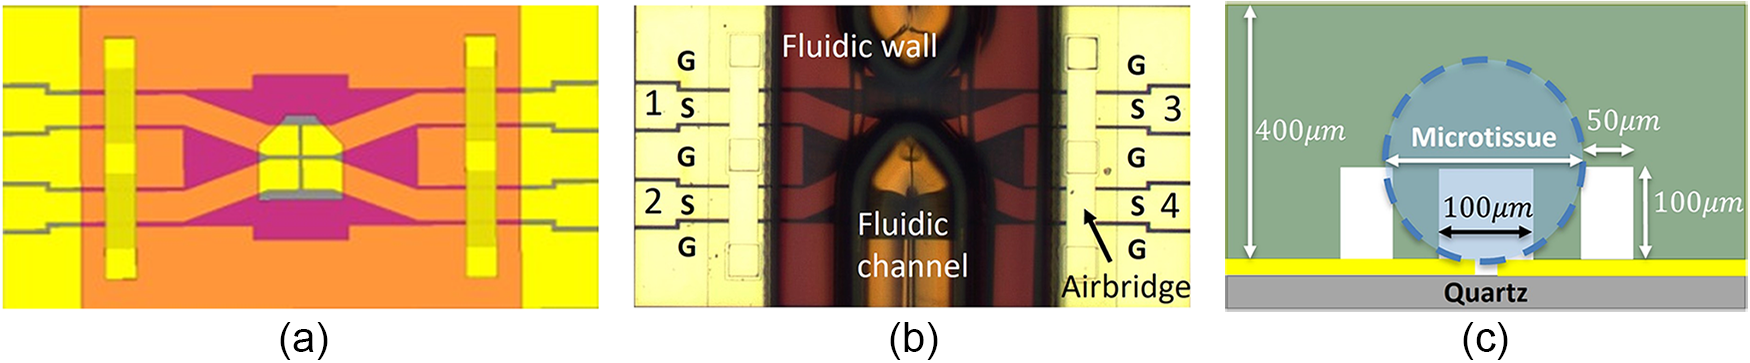
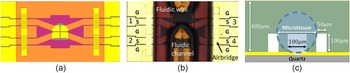
The 4-port sensor is also depicted in Figure 2(a) through different schematics and photography. It comprises four coplanar waveguides, which exhibit a 10 µm wide capacitive gap at the center of the structure for sensing. It includes twice two coplanar accesses implemented with air bridges between grounds to ensure an identical ground level to all four ports. A microfluidic channel (cf. Figure 2b) is placed on the top of the sensor and includes a hydrodynamic trap, which enables the precise location of the 3D model to be dielectrically characterized [Reference Peytral-Rieu, Dubuc and Grenier15]. Figure 2(c) presents the cross-section view of the structure at this exact location. The yellow and green layers represent the coplanar waveguides and the fluidic channel material, respectively. A three-opened hole configuration in the fluidic channel enables the trapping of the 3D entity and ensures a fluidic flow, which is necessary to keep any biological model in its appropriate host medium. This device is fabricated in a clean room using conventional processes: lift-off for the two metallization, and photolithography processes for the SU8-based fluidic structure.
Four-port biosensor with its microfluidic channel. (a) Top view schematic of the structure with only the metal and isolation layers. (b) Its photography, where S and G represent the signal and ground strips of the coplanar configuration, respectively. (c) Cross-section schematic of the trapping area. The coplanar waveguide is in yellow, whereas the fluidic channel is mentioned in green.
For microwave characterization, the device under test is connected to a Vector Network Analyzer (VNA C420 from Copper Mountain® Technologies) using two differential coplanar probes and four coaxial cables, whereas measurements are performed from 200 MHz to 3 GHz. A standard short-open-load-through calibration is applied to locate the microwave reference planes at the tips of the RF probes.
An electrical model is then developed to consider the subdivisions of the 3D entity.
Electrical model
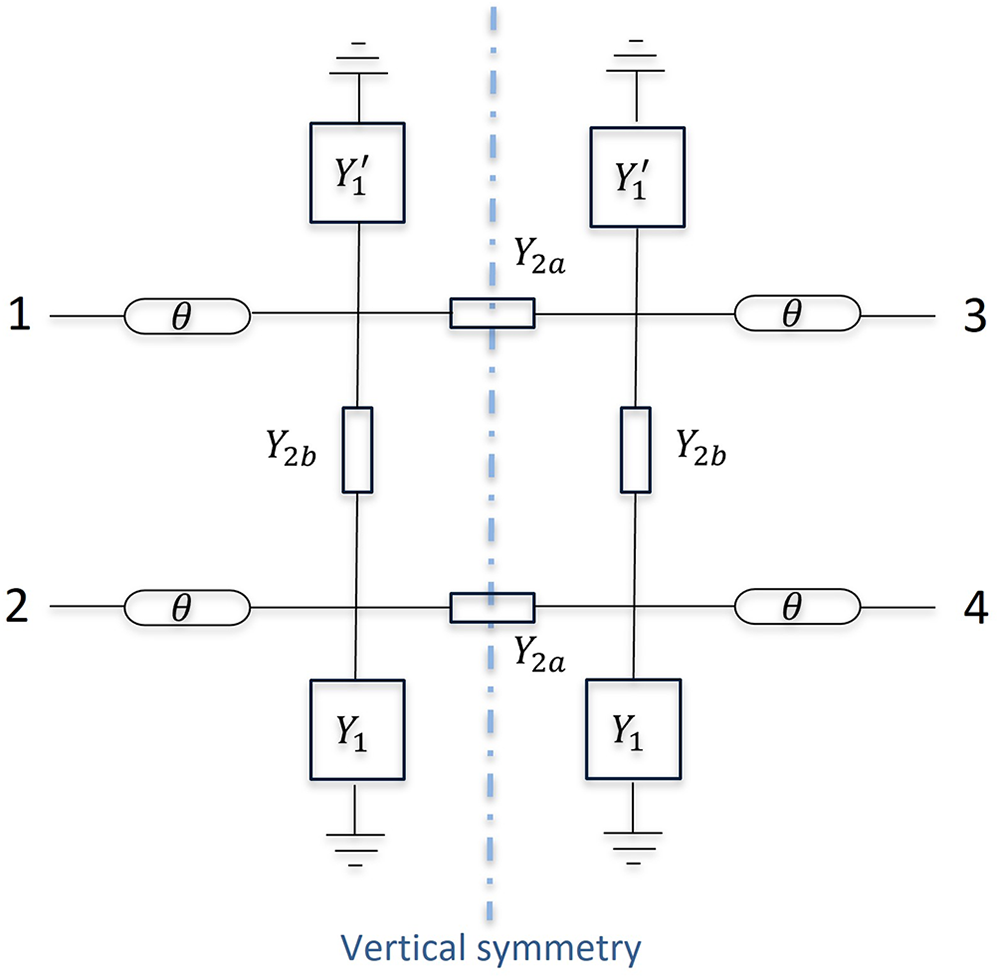
Due to the configuration of the considered 4-port microwave biosensor, we have defined an equivalent electrical model, which is given in Figure 3. The coplanar waveguide accesses are treated as a transmission line, featuring a characteristic impedance of 50 Ω (Z0). As a first approach, the electrical phase is equal to 0 (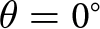 $\theta = 0^\circ $) under normalized conditions. ${Y_1}$ and $Y_1^{\text{'}}$ denote the admittances of the microfluidic channel for inflow and outflow, respectively, that is, before the trap for ${Y_1}$ and with and after the trap for $Y_1^{\text{'}}$. $Y_1^{\text{'}}$ is defined as $Y_1^{\text{'}} = {Y_1} + {\Delta }Y$, where ${\Delta }Y$ is small compared to ${Y_1}$. Based on the 4-port system, the biological object, which is located just before the location of the trap, can be modeled by two admittances, ${Y_{2a}}$ and ${Y_{2b}}$, which are both constituted by a capacitance Cap in parallel with a conductance G.
Equivalent electrical model of the 4-port device.  ${Y_1}$ and $Y_1^{\text{'}}$ denote the admittances of the microfluidic channel.
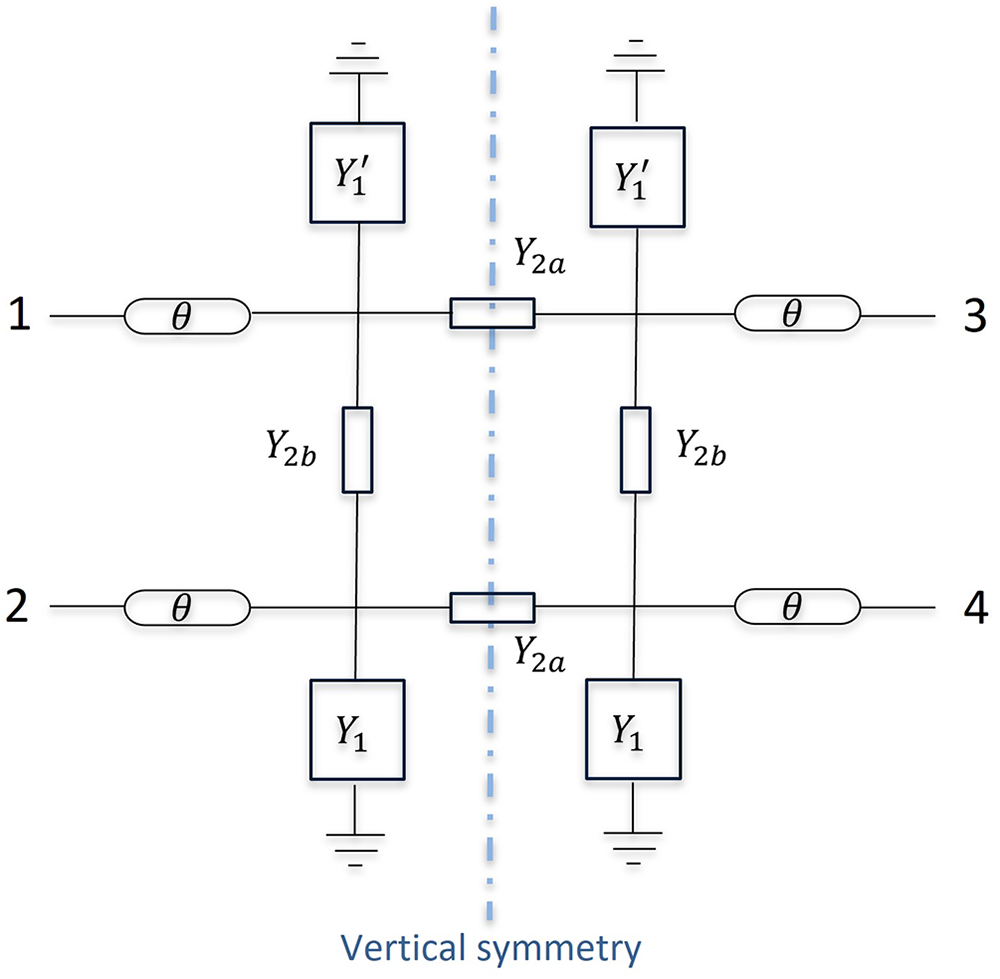
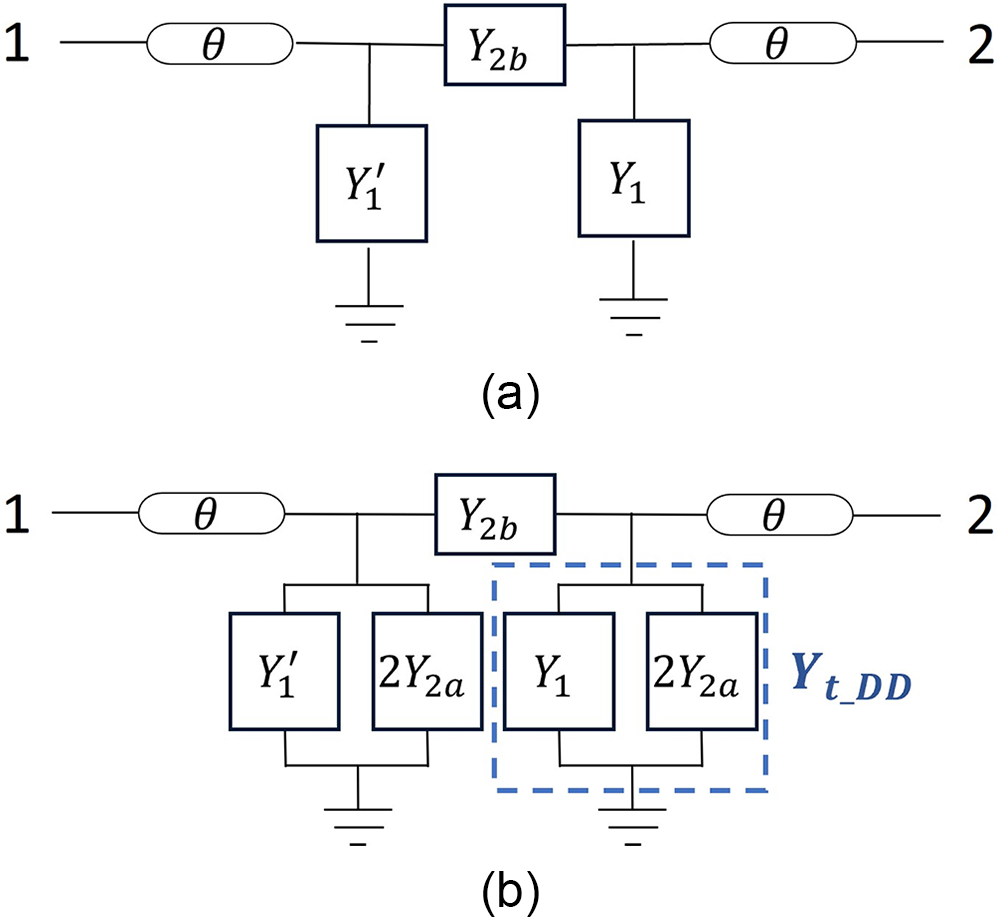
Taking the 4-port microwave configuration shown in Figure 1 into account and its vertical symmetry with a symmetry line located in the middle of the fluidic channel, a differential modeling approach is applied. The differential mode circuit, named as D-mode, is virtually grounded along the line of symmetry, while the common mode circuit, C-mode, is virtually opened.
In a first step, the 4-port S parameters are translated into common (open circuit) and differential (short circuit) modes [Reference Roberg and Campbell16–Reference Reed and Wheeler18] by using the classical formulas [Reference Pozar19]. The four physical ports can be considered as having one input and one output ports associated with a differential signal, or the two ports associated with a common mode signal. The 4 × 4 standard S-matrix can therefore be transformed into the mixed  ${S_{MN}}$ matrix (cf. Eq. [1]) [Reference Ho, Vaz and Caggiano20].
 \begin{equation}{S_{MN}} = \left[ {\begin{array}{*{20}{c}}
{{S_{DD}}}&{{S_{DC}}} \\
{{S_{CD}}}&{{S_{CC}}}
\end{array}} \right]\end{equation}
\begin{equation}{S_{MN}} = \left[ {\begin{array}{*{20}{c}}
{{S_{DD}}}&{{S_{DC}}} \\
{{S_{CD}}}&{{S_{CC}}}
\end{array}} \right]\end{equation}The common and differential modes matrices can be expressed as in Eqs. (2) and (3), where C and D correspond to the common and differential modes, respectively.
 \begin{equation}{S_{CC}} = \left[ {\begin{array}{*{20}{c}}
{\left( {{s_{11}} + {s_{13}} + {s_{31}} + {s_{33}}} \right)}&{\left( {{s_{12}} + {s_{14}} + {s_{32}} + {s_{34}}} \right)} \\
{\left( {{s_{21}} + {s_{23}} + {s_{41}} + {s_{43}}} \right)}&{\left( {{s_{22}} + {s_{24}} + {s_{42}} + {s_{44}}} \right)}
\end{array}} \right]\end{equation}
\begin{equation}{S_{CC}} = \left[ {\begin{array}{*{20}{c}}
{\left( {{s_{11}} + {s_{13}} + {s_{31}} + {s_{33}}} \right)}&{\left( {{s_{12}} + {s_{14}} + {s_{32}} + {s_{34}}} \right)} \\
{\left( {{s_{21}} + {s_{23}} + {s_{41}} + {s_{43}}} \right)}&{\left( {{s_{22}} + {s_{24}} + {s_{42}} + {s_{44}}} \right)}
\end{array}} \right]\end{equation} \begin{equation}{S_{DD}} = \left[ {\begin{array}{*{20}{c}}
{\left( {{s_{11}} - {s_{13}} - {s_{31}} + {s_{33}}} \right)}&{\left( {{s_{12}} - {s_{14}} - {s_{32}} + {s_{34}}} \right)} \\
{\left( {{s_{21}} - {s_{23}} - {s_{41}} + {s_{43}}} \right)}&{\left( {{s_{22}} - {s_{24}} - {s_{42}} + {s_{44}}} \right)}
\end{array}} \right]\end{equation}
\begin{equation}{S_{DD}} = \left[ {\begin{array}{*{20}{c}}
{\left( {{s_{11}} - {s_{13}} - {s_{31}} + {s_{33}}} \right)}&{\left( {{s_{12}} - {s_{14}} - {s_{32}} + {s_{34}}} \right)} \\
{\left( {{s_{21}} - {s_{23}} - {s_{41}} + {s_{43}}} \right)}&{\left( {{s_{22}} - {s_{24}} - {s_{42}} + {s_{44}}} \right)}
\end{array}} \right]\end{equation} In  ${S_{MN}}$ matrix, ${S_{CC11}}$ corresponds to the common-mode return loss at the common port 1. ${S_{DD12}}$ is the differential insertion loss from the differential port 2 to the differential port 1. The remaining S-parameters are defined similarly, with DC corresponding to the differential to common-mode conversion, CD corresponding to the common to differential-mode conversion, and DD corresponding to differential to differential – mode parameters, respectively.
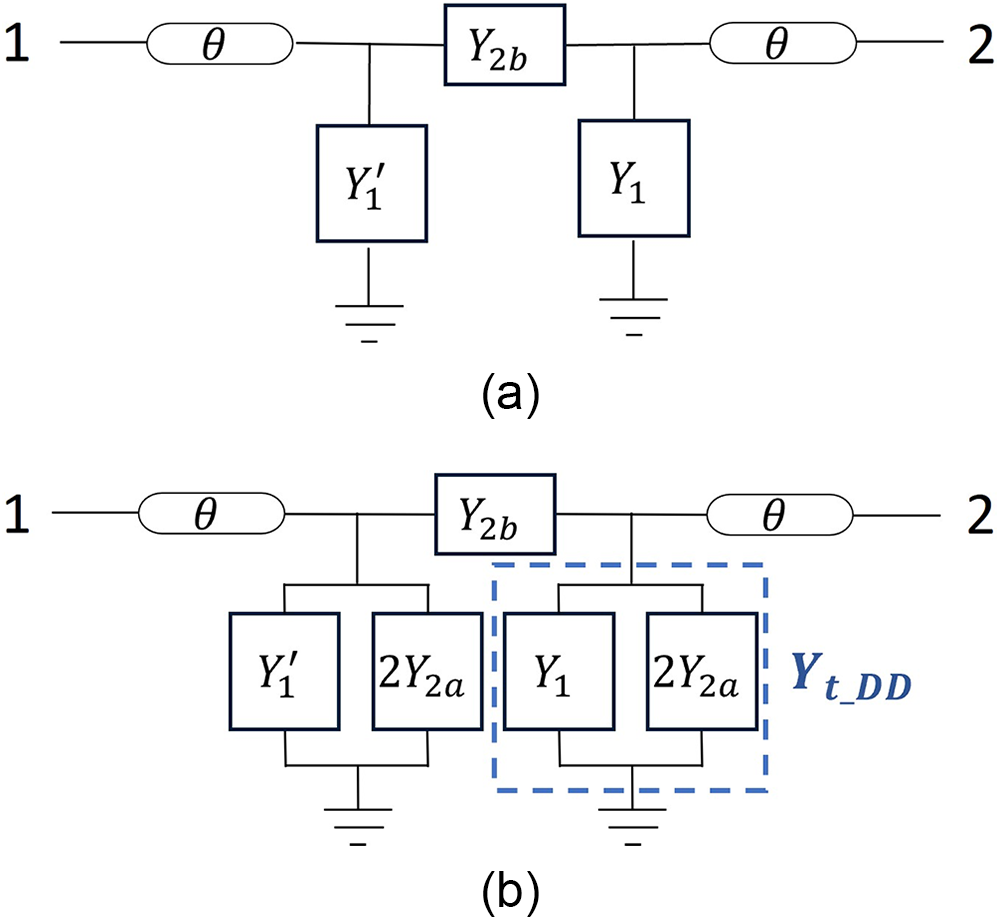
Due to the symmetrical properties, calculations are carried out considering only one part of the symmetry, leading to two 2-port models. The common and differential modes are illustrated in Figure 4(a) and 4(b).
(a) Common and (b) Differential modes (with  $Y_1^{'} = {Y_1} + \Delta Y$).
Based on the 2-port system calculation in [Reference Peytral-Rieu, Dubuc and Grenier15],  ${S_{CC}}$ parameters may be obtained as shown below with Eqs. (4), (5), and (6):
 \begin{equation}{S_{CC11}} = \frac{{1 - {y_1}\left( {{y_1} + 2{y_{2b}}} \right) + \Delta y\left( {1 - {y_1} - {y_{2b}}} \right)}}{{1 + {y_1}\left( {2 + {y_1} + 2{y_{2b}}} \right) + \Delta y\left( {1 + {y_1} + {y_{2b}}} \right) + 2{y_{2b}}}}\end{equation}
 \begin{align}&{S_{CC12}} = \nonumber\\
&{S_{CC21}} = \frac{{2{y_{2b}}}}{{1 + {y_1}\left( {2 + {y_1} + 2{y_{2b}}} \right) + \Delta y\left( {1 + {y_1} + {y_{2b}}} \right) + 2{y_{2b}}}}\end{align}
\begin{align}&{S_{CC12}} = \nonumber\\
&{S_{CC21}} = \frac{{2{y_{2b}}}}{{1 + {y_1}\left( {2 + {y_1} + 2{y_{2b}}} \right) + \Delta y\left( {1 + {y_1} + {y_{2b}}} \right) + 2{y_{2b}}}}\end{align} \begin{equation}{S_{CC22}} = \frac{{\left( {1 + {y_1} - y_1^{'}} \right) - {y_1}y_1^{'} - {y_{2b}}\left( {{y_1} + y_1^{'}} \right)}}{{\left( {1 + {y_1} + y_1^{'}} \right) + {y_1}y_1^{'} + {y_{2b}}\left( {2 + {y_1} + y_1^{'}} \right)}}\end{equation}
 where  ${y_x} = {Y_x} \cdot {Z_0}$.
From the theoretical formula in [Reference Pozar19],  $y_{2b\_CC}$ and $\Delta y_{CC}$ can be expressed as given in Eqs. (7) and (8), respectively:
 \begin{equation}y_{2b\_CC}=\frac{2S_{CC21}}{\left(1+S_{CC11}\right)\left(1+S_{CC22}\right)-S_{CC12}S_{CC21}}\end{equation}
 \begin{equation}\Delta y_{CC} = \frac{{2\left( {{S_{CC11}} - {S_{CC22}}} \right)}}{{\left( {1 + {S_{CC11}}} \right)\left( {1 + {S_{CC22}}} \right) - {S_{CC12}}{S_{CC21}}}}\end{equation} $y_{1\_CC}$ may then be calculated as:
 \begin{equation}y_{1\_CC}=\frac{\left(1-S_{CC11}\right)\left(1+S_{CC22}\right)+S_{CC12}S_{CC21}-2S_{CC21}}{\left(1+S_{CC11}\right)\left(1+S_{CC22}\right)-S_{CC12}S_{CC21}}\end{equation}
 Eqs. (7), (8), and (9) correspond to normalized admittances of the structure when 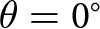 $\theta = 0^\circ $. The CPW accesses located on each side of the device are also considered by adding four transmission lines, exhibiting a characteristic impedance ${Z_0}$. The measured S parameters then become:
 \begin{equation}\begin{array}{*{20}{c}}
{S_{CC11}^{'} = {S_{CC11}}{e^{ - 2j\theta }}}&{S_{CC12}^{'} = {S_{CC12}}{e^{ - 2j\theta }}} \\
{S_{CC21}^{'} = {S_{CC21}}{e^{ - 2j\theta }}}&{S_{CC22}^{'} = {S_{CC22}}{e^{ - 2j\theta }}}
\end{array}\end{equation}
\begin{equation}\begin{array}{*{20}{c}}
{S_{CC11}^{'} = {S_{CC11}}{e^{ - 2j\theta }}}&{S_{CC12}^{'} = {S_{CC12}}{e^{ - 2j\theta }}} \\
{S_{CC21}^{'} = {S_{CC21}}{e^{ - 2j\theta }}}&{S_{CC22}^{'} = {S_{CC22}}{e^{ - 2j\theta }}}
\end{array}\end{equation} where j is the complex operator, 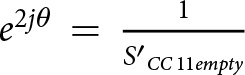 $\begin{array}{*{20}{l}}
{{e^{2j\theta }}\, = \,\frac{1}{{{{S'}_{CC\,11empty}}}}} \\
{}
\end{array}$ (the “empty” configuration regarding to the S parameter, when the device is filled with air) [Reference Peytral-Rieu, Dubuc and Grenier15]. By applying the measured S parameters to Eqs. (7–9), the admittances in C-mode can be obtained as:
$\begin{array}{*{20}{l}}
{{e^{2j\theta }}\, = \,\frac{1}{{{{S'}_{CC\,11empty}}}}} \\
{}
\end{array}$ (the “empty” configuration regarding to the S parameter, when the device is filled with air) [Reference Peytral-Rieu, Dubuc and Grenier15]. By applying the measured S parameters to Eqs. (7–9), the admittances in C-mode can be obtained as:
 \begin{equation}y_{2b\_CC}=\frac{2\frac{S_{CC21}^{\;'}}{S_{CC11empty}^{\;'}}}{\left(1+\frac{S_{CC11}^{\;'}}{S_{CC11empty}^{\;'}}\right)\left(1+\frac{S_{CC22}^{\;'}}{S_{CC11empty}^{\;'}}\right)-\frac{S_{CC12}^{\;'}S_{CC21}^{\;'}}{\left(S_{CC11empty}^{\;'}\right)^2}}\end{equation}
 \begin{equation}\Delta y_{CC} = \frac{{2\left( {\frac{{S_{CC11}^{'}}}{{S_{CC11empty}^{'}}} - \frac{{S_{CC22}^{'}}}{{S_{CC11empty}^{'}}}} \right)}}{{\left( {1 + \frac{{S_{CC11}^{'}}}{{S_{CC11empty}^{'}}}} \right)\left( {1 + \frac{{S_{CC22}^{'}}}{{S_{CC11empty}^{'}}}} \right) - \frac{{S_{CC12}^{'}S_{CC21}^{'}}}{{S{{_{CC11empty}^{'}}^{2}}}}}}\end{equation}
 \begin{equation}y_{1\_CC}=\frac{\left(1-\frac{S_{CC11}^{\;'}}{S_{CC11empty}^{\;'}}\right)\left(1+\frac{S_{CC22}^{\;'}}{S_{CC11empty}^{\;'}}\right)+\frac{S_{CC12}^{\;'}S_{CC21}^{\;'}}{\left(S_{CC11empty}^{\;'}\right)^2}-2\frac{S_{CC21}^{\;'}}{S_{CC11empty}^{\;'}}}{\left(1+\frac{S_{CC11}^{\;'}}{S_{CC11empty}^{\;'}}\right)\left(1+\frac{S_{CC22}^{\;'}}{S_{CC11empty}^{\;'}}\right)-\frac{S_{CC12}^{\;'}S_{CC21}^{\;'}}{\left(S_{CC11empty}^{\;'}\right)^2}}\end{equation}
 The admittances in D-mode can be calculated using the method applied to the C-mode. By comparing the D- and C-mode circuits, we can obtain  ${y_{2a}}$ with Eq. (14):
 \begin{equation}y_{2a}=\frac{y_{t\_DD}-y_{1\_CC}}2\end{equation}
 where  $y_{t\_DD}$ comprises ${y_1}$ and $2{y_{2a}}$ in parallel.
Afterward, the capacitance Cap and conductance G of the targeted entity can be extracted with Eqs. (15) and (16), respectively, where  ${y_x}$ is dedicated to the admittances of the biological entity, that is, ${y_{2a}}$ and ${y_{2b}}$.
 \begin{equation}Cap = \frac{1}{{2\pi f}}\frac{{Img\left( {{y_x}} \right)}}{{50}}\end{equation}
 \begin{equation}G = \frac{{Re\left( {{y_x}} \right)}}{{50}}\end{equation}
Equations validation
The validation of the approach is performed in two steps.
Validation of the C- and D-modes
In our validation process, a dual-check mechanism is employed. In the first approach, we set  ${Y_x}$ parameters and use derived equations to calculate the C and D matrices. From these matrices, ${y_x}$ values are computed using assumed data. A comparison with the initially set of ${Y_x}$ data ensures consistency. Similarly, in the second approach, we assume the C and D matrices, obtain the ${Y_x}$ values, and finally infer the corresponding C and D matrices. This dual-validation strategy provides a robust means of ensuring the accuracy of the proposed method by cross-verifying the results obtained through different paths. This procedure is done with MATLAB software.
Validation with the raw S-parameters
In terms of the theoretical fourfold symmetry, the following equivalences given in Eq. (17) are considered for our validation.
 \begin{align}\left\{ {\begin{array}{*{20}{c}}
{\begin{array}{*{20}{c}}
{{s_{11}} \equiv {s_{22}} \equiv {s_{33}} \equiv {s_{44}}} \cr
{{s_{12}} \equiv {s_{21}} \equiv {s_{34}} \equiv {s_{43}}}
\end{array}} \cr
{\begin{array}{*{20}{c}}
{{s_{13}} \equiv {s_{31}} \equiv {s_{24}} \equiv {s_{42}}} \cr
{{s_{14}} \equiv {s_{41}} \equiv {s_{23}} \equiv {s_{32}}}
\end{array}}
\end{array}} \right.\end{align}
\begin{align}\left\{ {\begin{array}{*{20}{c}}
{\begin{array}{*{20}{c}}
{{s_{11}} \equiv {s_{22}} \equiv {s_{33}} \equiv {s_{44}}} \cr
{{s_{12}} \equiv {s_{21}} \equiv {s_{34}} \equiv {s_{43}}}
\end{array}} \cr
{\begin{array}{*{20}{c}}
{{s_{13}} \equiv {s_{31}} \equiv {s_{24}} \equiv {s_{42}}} \cr
{{s_{14}} \equiv {s_{41}} \equiv {s_{23}} \equiv {s_{32}}}
\end{array}}
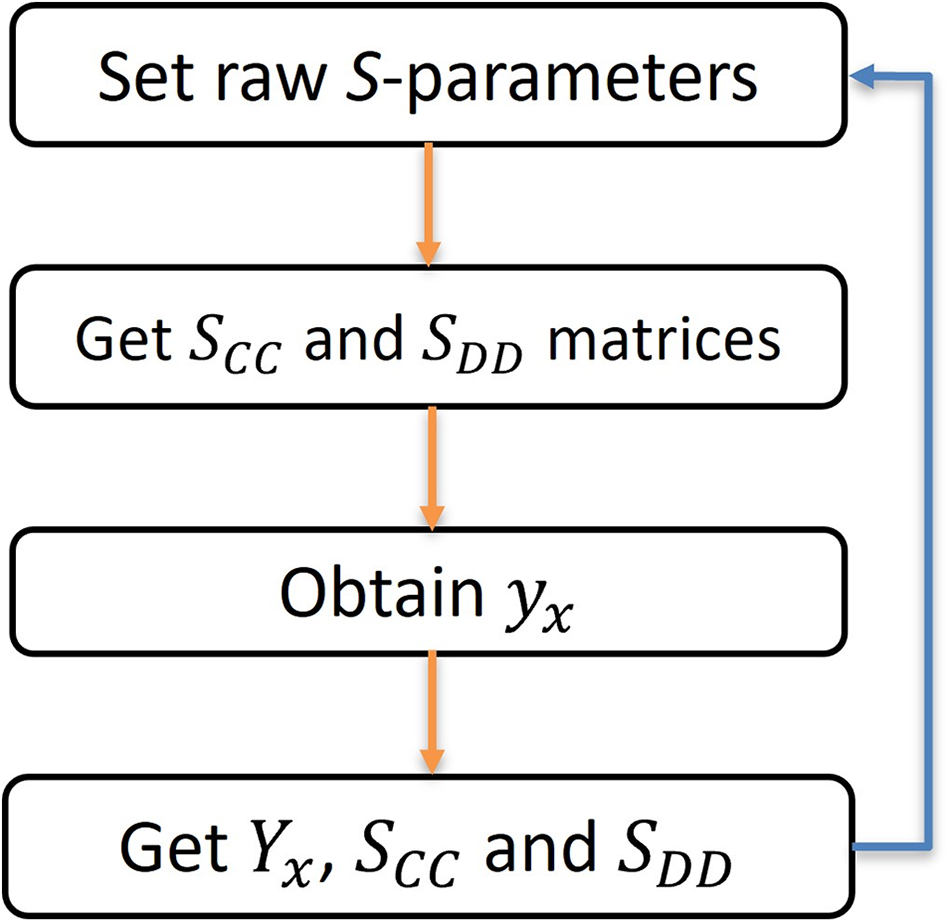
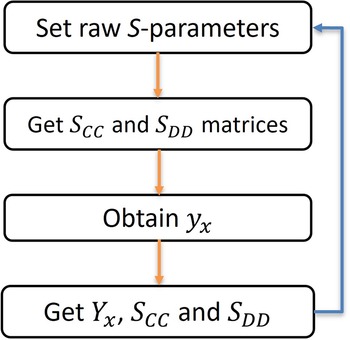
\end{array}} \right.\end{align} Using the same methodology as previously described, we first assume the values of the raw S-parameter by applying Eq. (17). Then, we obtain the matrices for C and D, thereby acquiring the  ${y_x}$ values. From the previous equations, we then once again get C and D matrices. This procedure is indicated in Figure 5.
Validation process with programs applied in MATLAB software.
Five groups of value for both validations in a range of (0–200) for  ${Y_x}$ and (−1–+1) for S parameters to the MATLAB calculation have been tested. No difference between the initial items and what we obtain theoretically is found, which validates our calculations.
Experimental evaluation of the sensor and the electrical model with ethanol solutions at different concentrations
Before being able to use the sensor with complex biological elements, tests with simpler and homogeneous solutions have been performed using ethanol solutions. Our initial sensitivity analysis of the 4-port mapping sensor involves three ethanol dilutions in DI water with varying concentrations: 10%, 20%, and 40%. Deionized water (DI water) is initially measured and referred to as 0% ethanol.
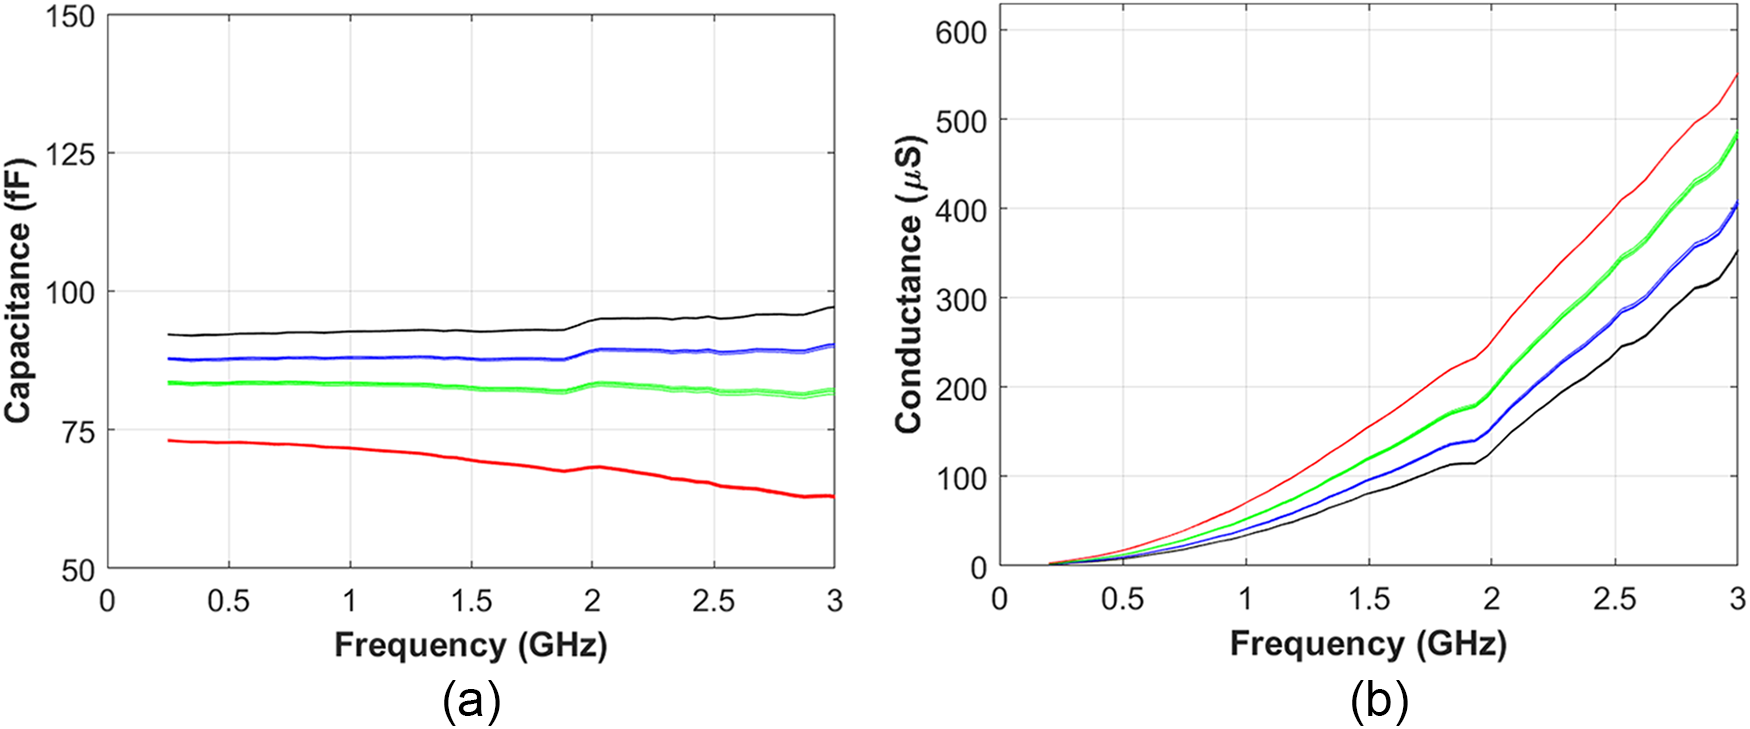
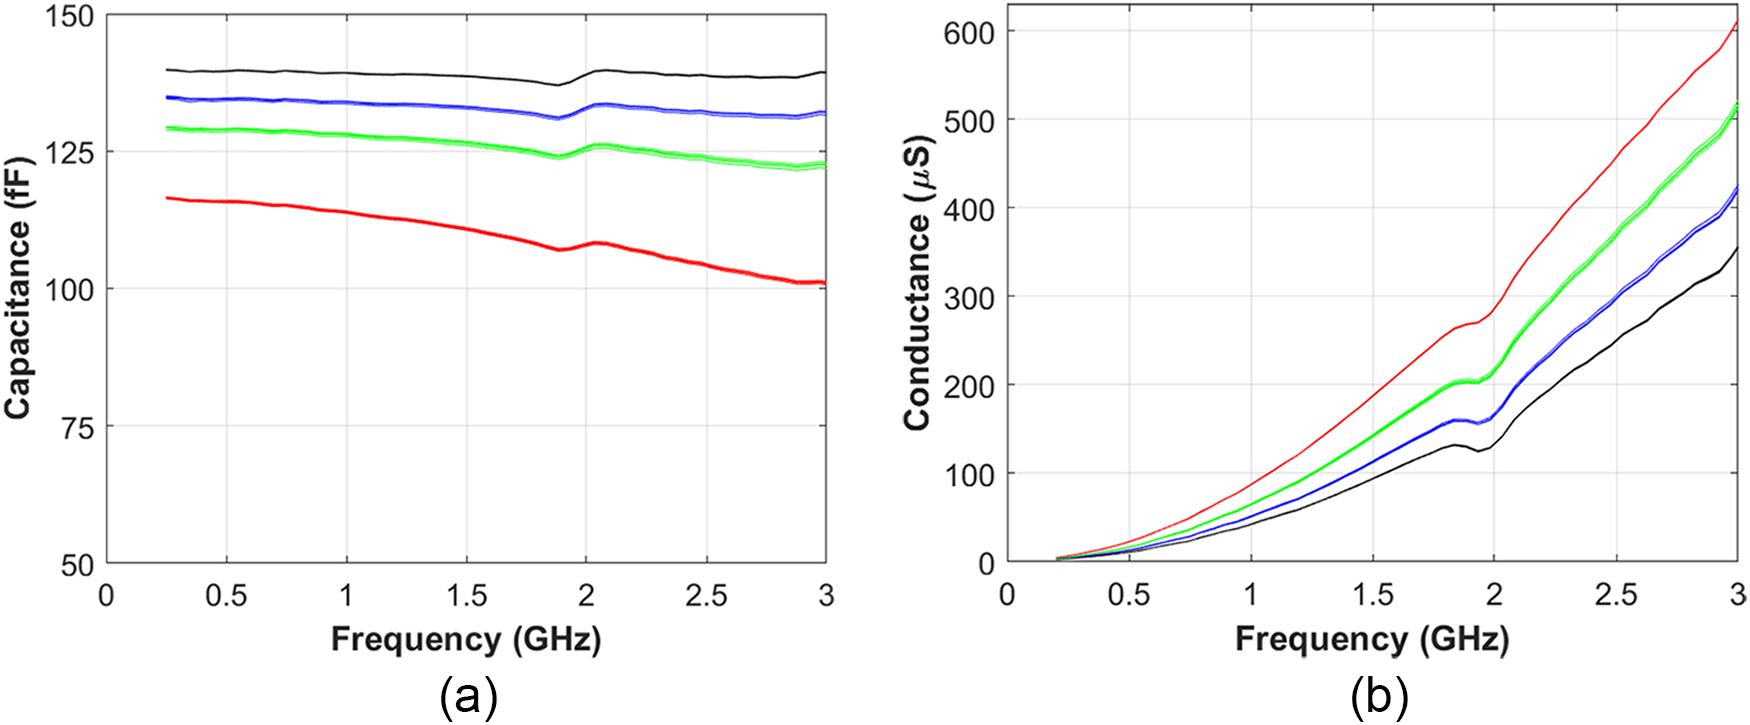
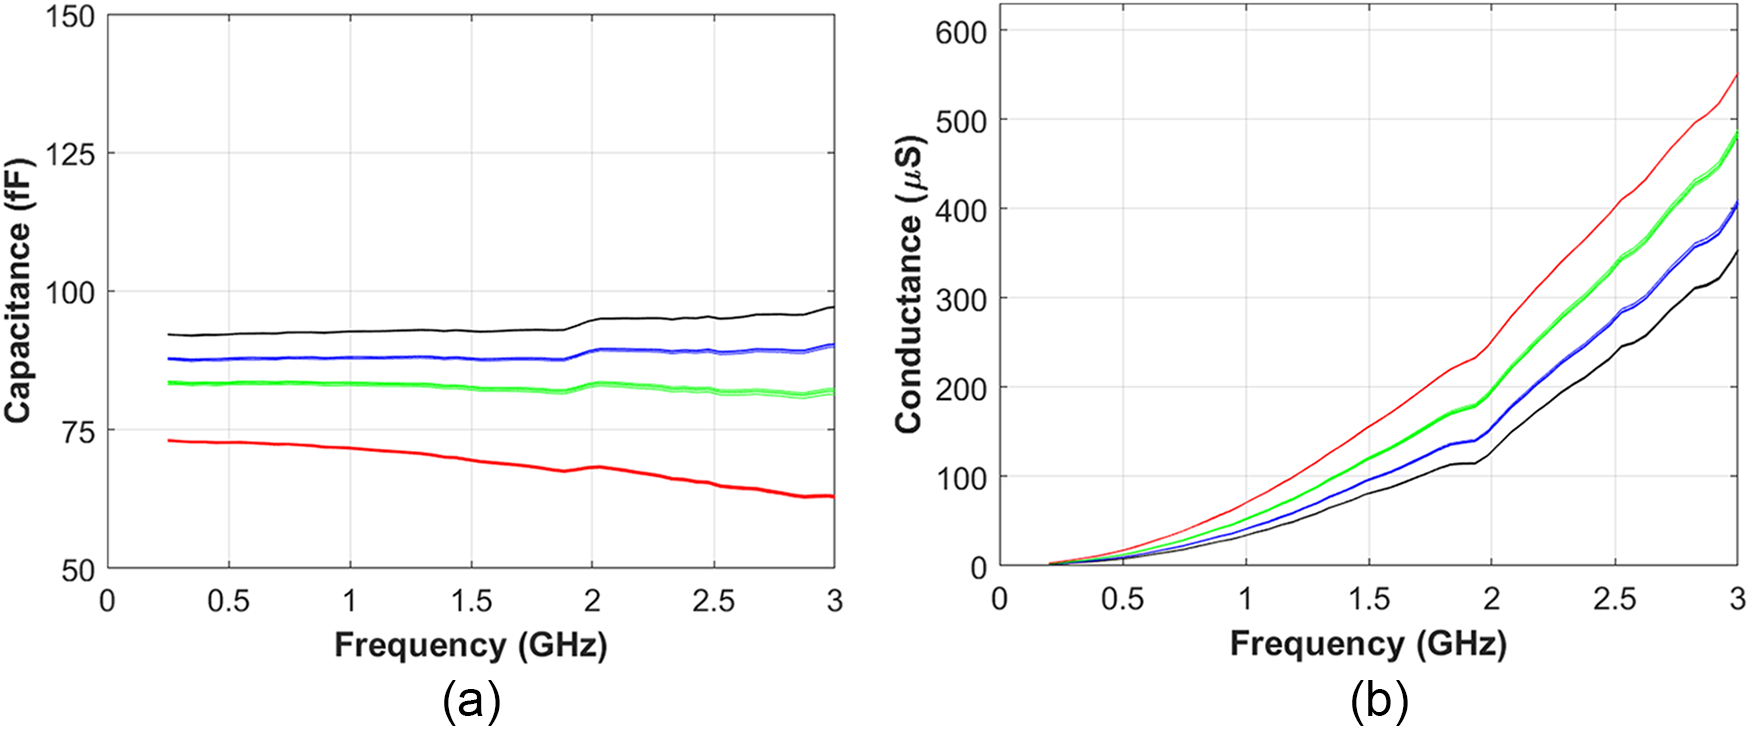
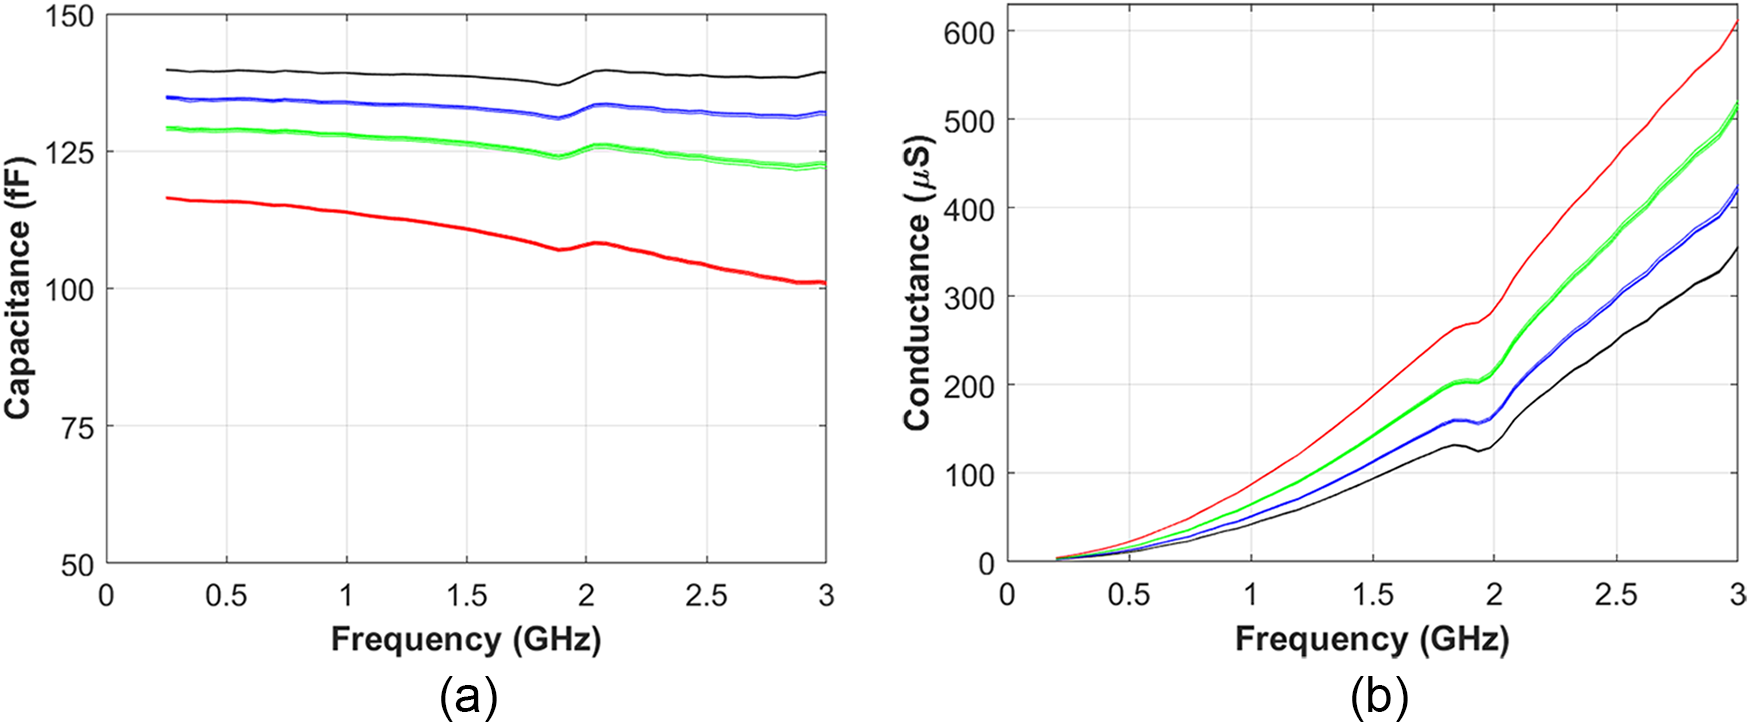
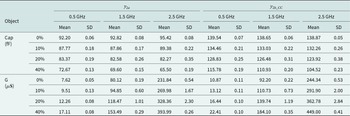
Figures 6 and 7 present the capacitance and conductance of  ${y_{2a}}$ and $y_{2b\_CC}$ obtained for the different ethanol solutions. The measurement for each concentration is replicated four times. The averages and standard deviations for both Cap and G at each concentration are summarized in Table 1 at three frequencies, 0.5, 1.5, and 2.5 GHz.
Capacitance (a) and conductance (b) of different concentrations of ethanol mixed with DI water for  ${y_{2a}}$. Black: 0%; blue: 10%; green: 20%; red: 40%. N = 4 for each concentration.
Capacitance (a) and conductance (b) of different concentrations of ethanol mixed with DI water for  $y_{2b\_CC}$. Black: 0%; blue: 10%; green: 20%; red: 40%. N = 4 for each concentration.
Values of the mean and the standard deviation of the capacitance and the conductance at three frequencies, 0.5 GHz, 1.5 GHz, and 2.5 GHz, for  ${y_{2a}}$ and $y_{2b\_CC}$ with ethanol solutions ranging from 0% to 10%, 20%, and 40%
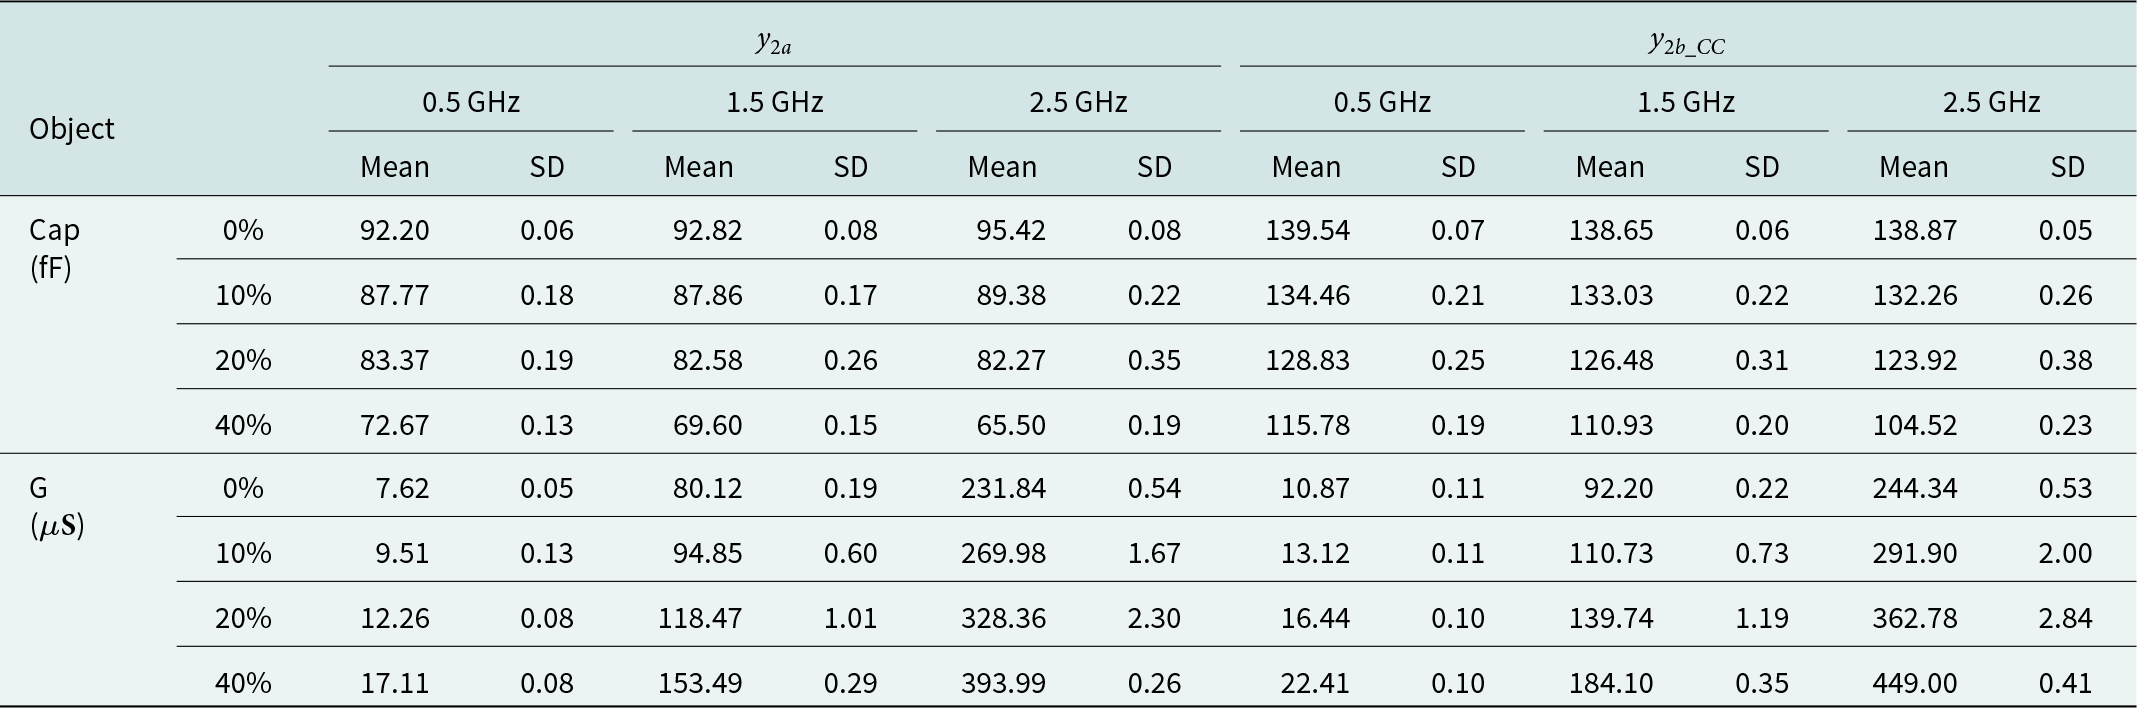
The standard deviation ranges from 0.06 to 0.38 fF for Cap and from 0.05 to 2.84 µS for G. It confirms the high accuracy obtained for all ethanol concentrations. The capacitance exhibits a minor fluctuation less than 0.38 fF. This is explained by the fact that the imaginary part of the aqueous solution permittivity is close to 0 at low frequency [Reference Petong, Pottel and Kaatze21].
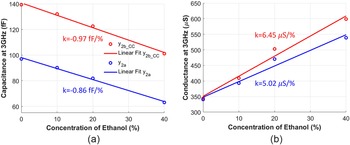
Figure 8(a) and 8(b) presents the extracted values of the capacitance and the conductance at 3 GHz for the different ethanol concentrations, respectively. An important discrimination curve indeed occurs at this frequency. A linear regression may be applied, while the calculated slope is mentioned by the factor k. The capacitance versus the ethanol concentration exhibits a negative slope. A k value of −0.86 fF/% is obtained when  ${y_{2a}}$ is considered, and −0.97 fF/% with $y_{2b\_CC}$.
Average values of (a) the capacitance and (b) the conductance at 3 GHz, for the different ethanol concentrations, when extracted from  ${y_{2a}}$ in red and from $y_{2b\_CC}$ in blue. The lines show the linear fit for both capacitance and conductance.

On the contrary, the conductance variation presents a positive slope with k values of 5.02  ${\mu \text{S}}/{\text{\% }}$ and 6.45 ${\mu \text{S}}/{\text{\% }}$ for ${y_{2a}}$ and $y_{2b\_CC}$, respectively. These results are in agreement with the theory [Reference Cole and Cole22], as ethanol and water have a real part of dielectric constant of around 7 and 78 at 3 GHz, respectively. Moreover, one may notice that ${y_{2a}}$ and $y_{2b\_CC}$ do not present the same values. This may be explained by the fact that ${y_{2a}}$ is perpendicularly placed to the fluidic flow, whereas $y_{2b\_CC}$ is in parallel with different surrounding materials.
To conclude this part, a linear variation depending on the ethanol concentration in the solution under test is well obtained for both Cap and G parameters.
To go further toward the evaluation of the sensor, polystyrene beads, which constitute a 3D model exhibiting a homogeneous and known permittivity, are then considered.
Numerical and experimental evaluation of the sensor with polystyrene beads
Numerical procedure followed with the sensor loaded with polystyrene beads
First, a numerical investigation of the sensor loaded with polystyrene beads is performed. To do so, the structure is simulated using the HFSS software of ANSYS, integrating all the materials implemented. The followed approach includes several simulation steps. A first simulation is done, whilst the structure is empty, that is, filled with air in the fluidic channel for normalization. A second one is then performed while the fluidic host medium is located within the channel, a Phosphate-buffered Saline solution (PBS) in our case, in order to obtain a reference value ( $Ca{p_{ref}}$) [Reference Cole and Cole22]. Finally, a polystyrene bead is simulated in the structure, when placed upon the sensing area, as illustrated in Figure 1. A new capacitance (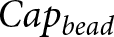 $Ca{p_{bead}}$) is extracted. Based on the simulation results, a capacitive contrast reflecting the presence of the polystyrene bead in the channel compared to the situation with only liquid is calculated with Eq. (18).
 \begin{equation}\Delta Cap = Ca{p_{bead}} - Ca{p_{ref}}\end{equation}
Simulations are carried out at five frequencies, 1, 1.5, 2, 2.5, and 3 GHz, for polystyrene beads exhibiting two different sizes of diameter, 150 and 200 µm.
Experimental procedure followed with the sensor loaded with polystyrene beads
A similar approach is carried out experimentally. The experiments are also conducted from 1 to 3 GHz and applied while the structure is empty, then filled with the fluidic host medium, and then the beads. The only difference is that the tests are repeated several times for each bead diameter size. Three beads exhibiting a diameter close to 200 µm are used, ranging from 180 to 204 µm, whereas four ones are measured with a diameter in the vicinity of 150 µm with samples ranging from 134 to 160 µm. Commercial bead solutions present indeed a dispersion in size. Each sample typically requests 13 minutes of experimental time. The first 3 minutes correspond to the stabilization of the individual bead within the structure and are not considered in the results. The next 10-minute period is recorded every minute. Associated fluctuation is considered negligible. The bead is not reusable and is intended for a one-time measurement. The capacitance contrast is calculated on the considered frequency range according to Eq. (18).
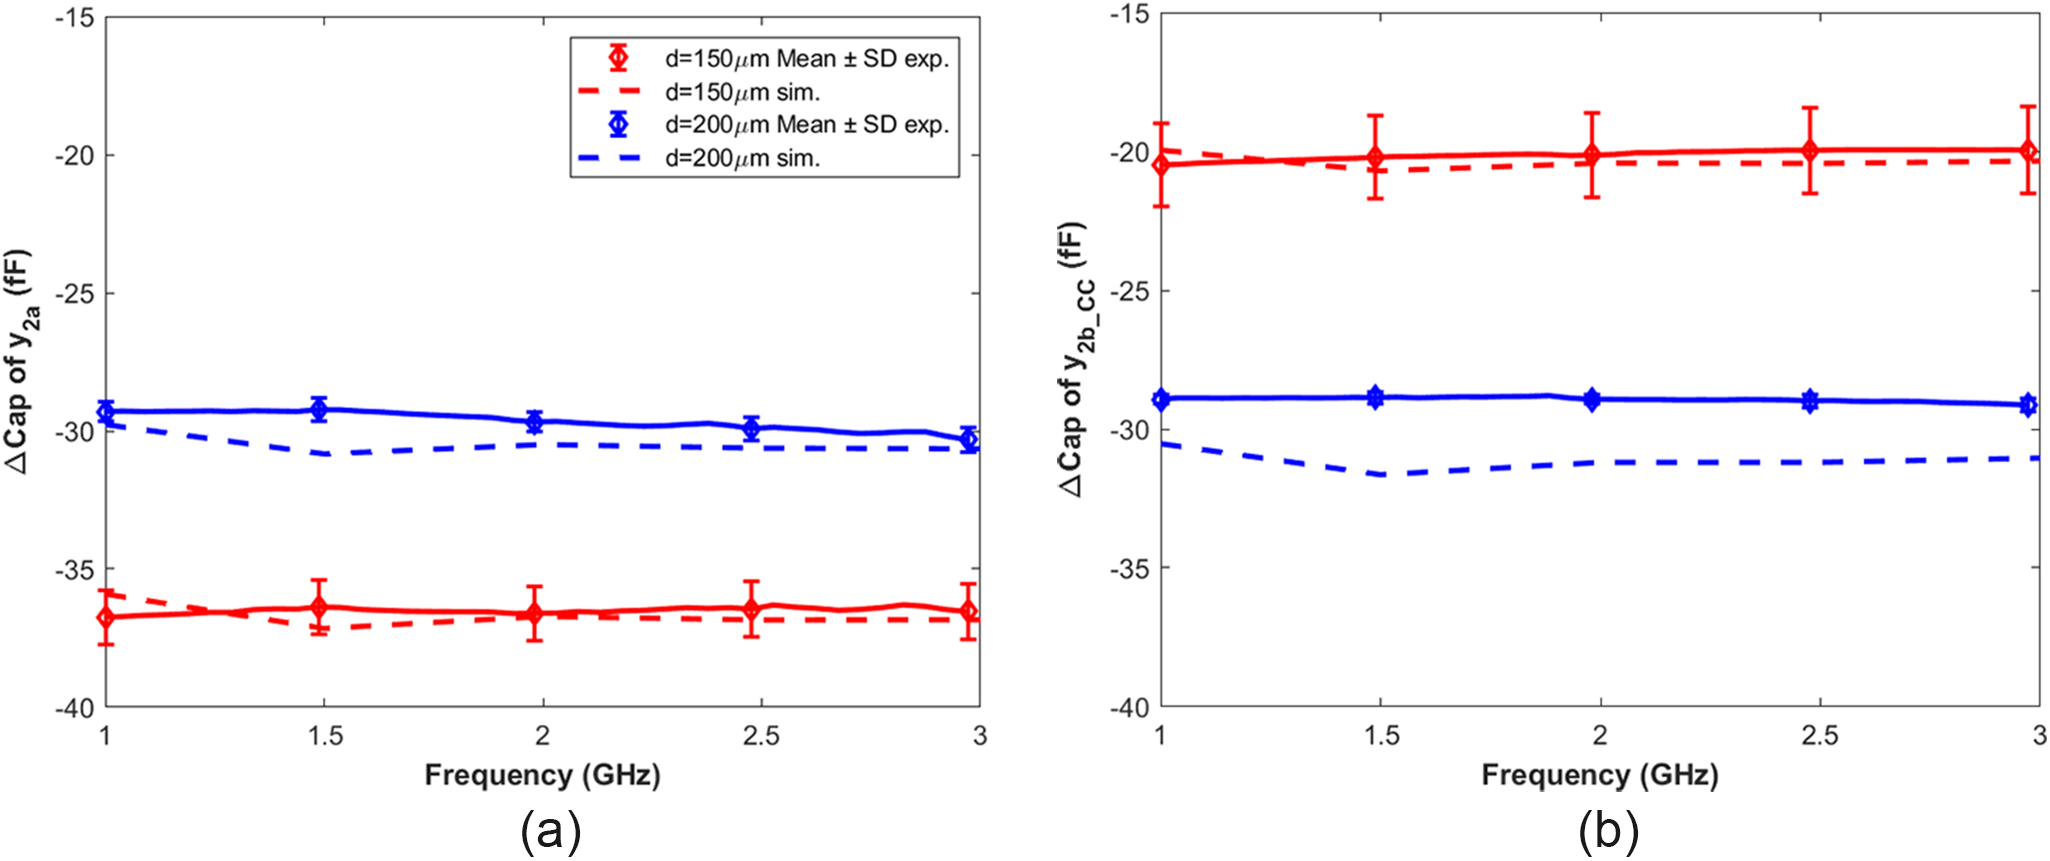
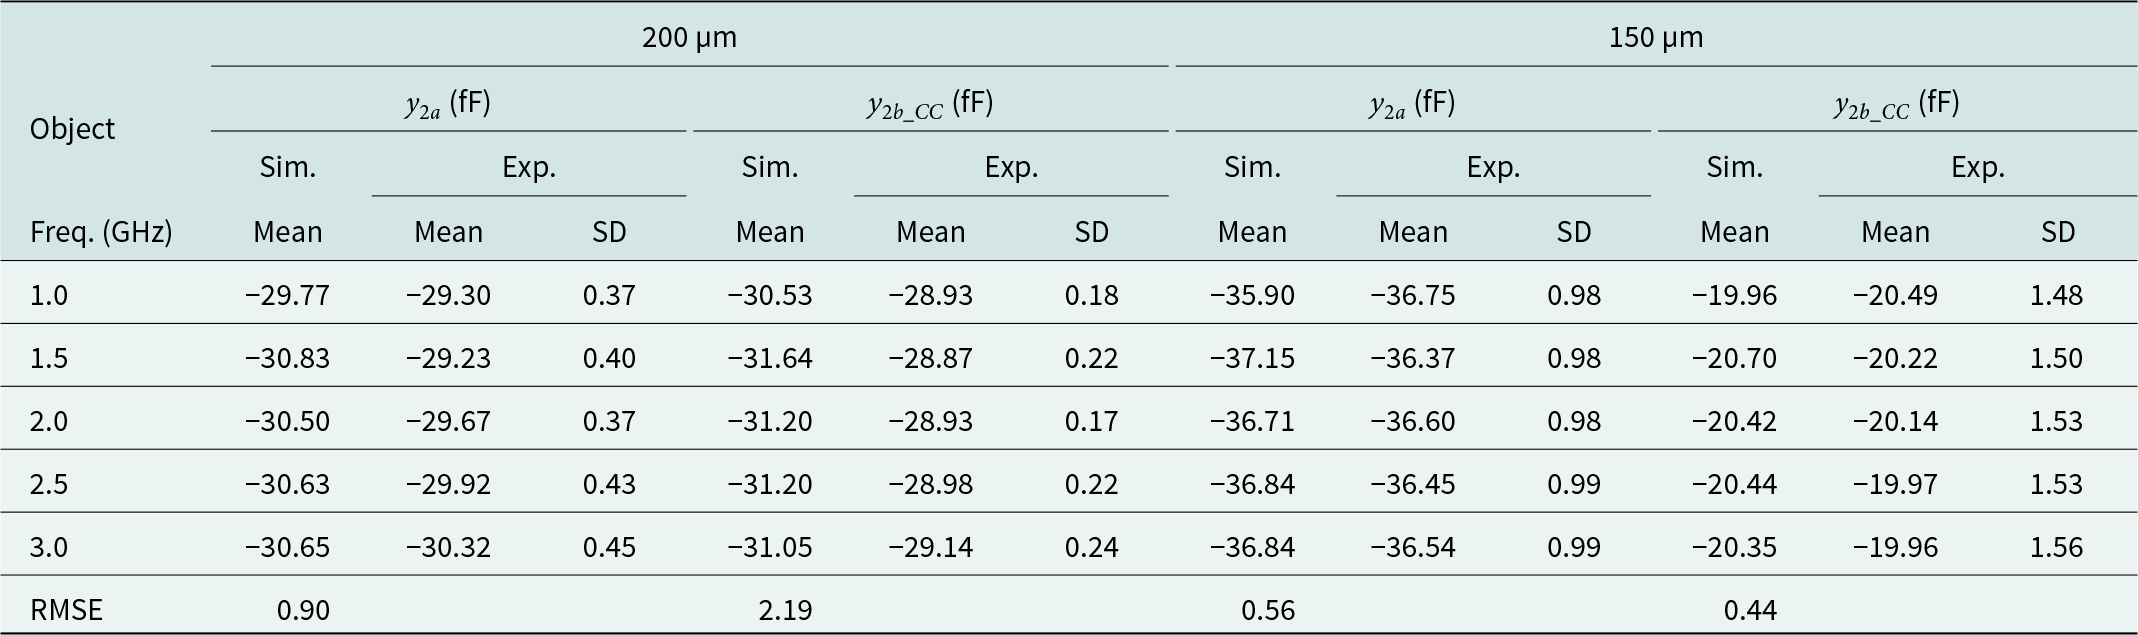
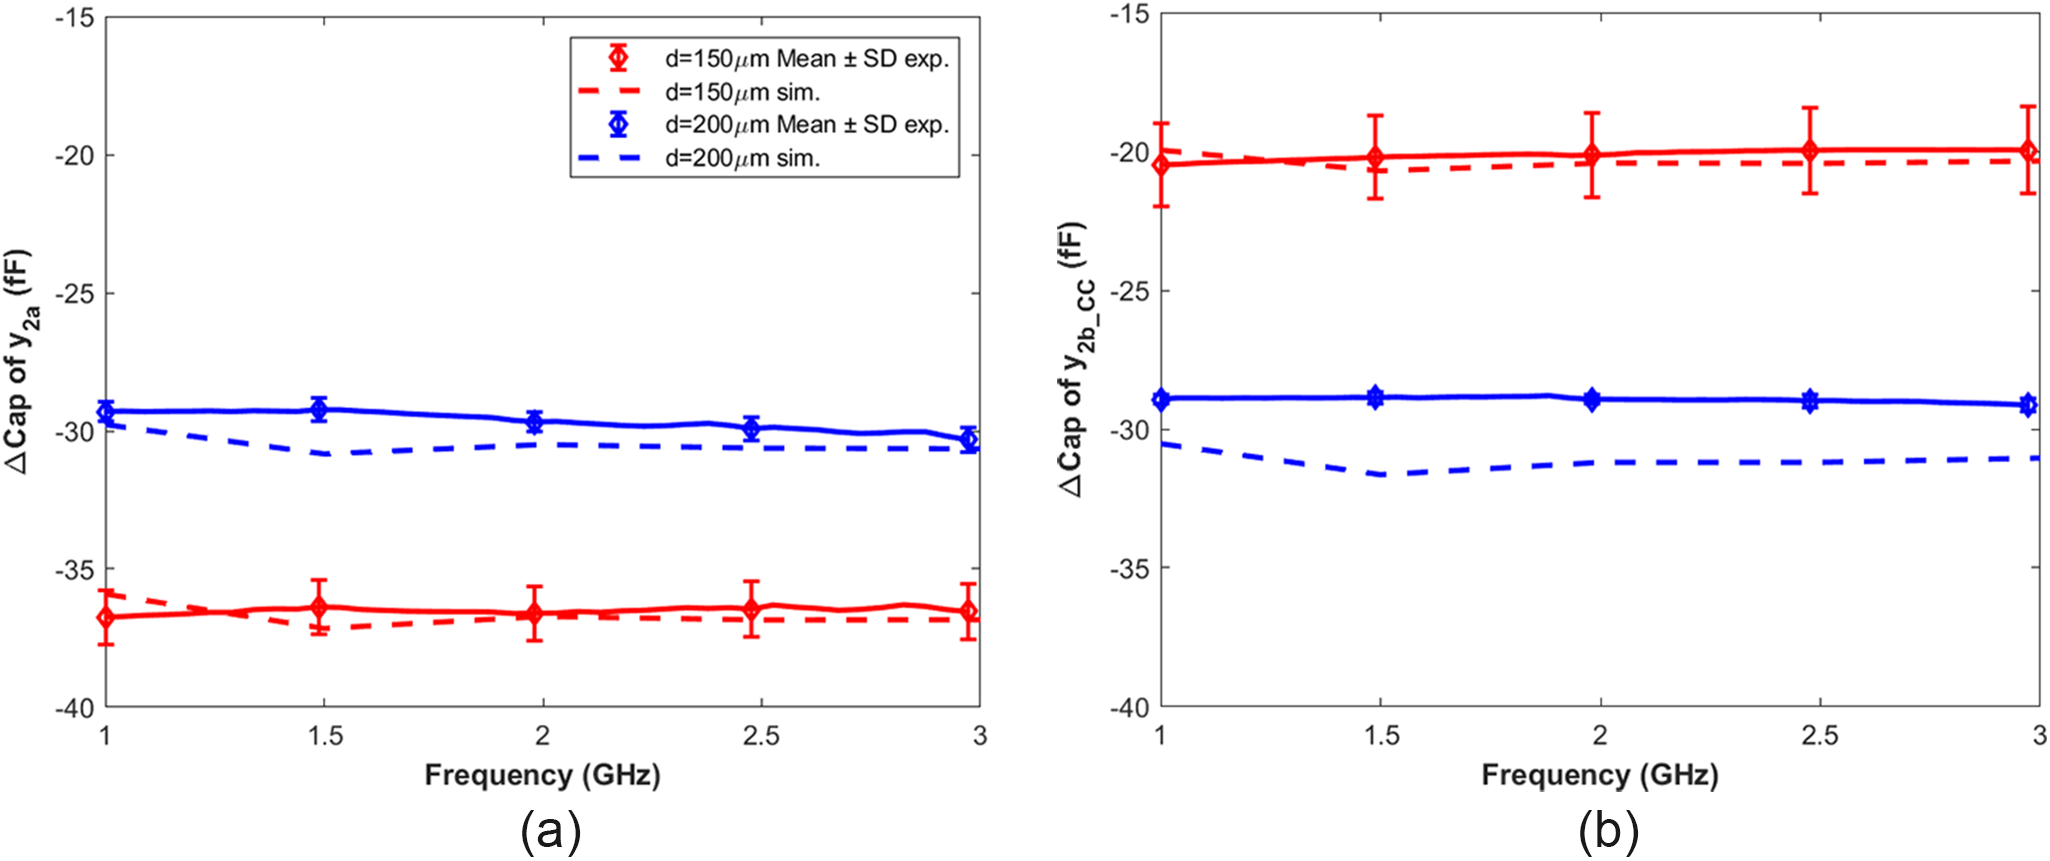
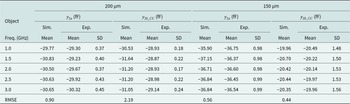
A comparison of both experimental and simulated results is given in Figure 9, whilst (a) is related to  ${y_{2a}}$, and (b) to $y_{2b\_CC}$. Data extracted from the measurements are given with solid lines, whereas those from simulations are shown with dotted ones. The blue color is used for beads with a diameter close to 200 µm, while the results for those of the order of 150 µm are plotted in red. Regarding the experimental data, the mean value of the measurements performed for 10 minutes is provided for each group of diameter size on the entire frequency range from 1 to 3 GHz, whereas the standard deviation is only given at five frequencies, 1, 1.5, 2, 2.5, and 3 GHz. All data are also listed in Table 2.
Measured and simulated capacitance contrasts for polystyrene beads presenting a diameter close to 150 µm in red and 200 µm in blue for (a)  ${y_{2a}}$ and (b) $y_{2b\_CC}$. Solid lines indicate the average values obtained from measurements. Standard deviations are indicated at 5 frequencies for the experimental data. The dotted lines represent the simulated results.
Mean values and standard deviations of the capacitive contrasts extracted from simulations and measurements for two sizes of polystyrene bead (200 and 150 µm diameters). The root mean square error (RMSE) is calculated from the mean values of  ${y_{2a}}$ and $y_{2b\_CC}$
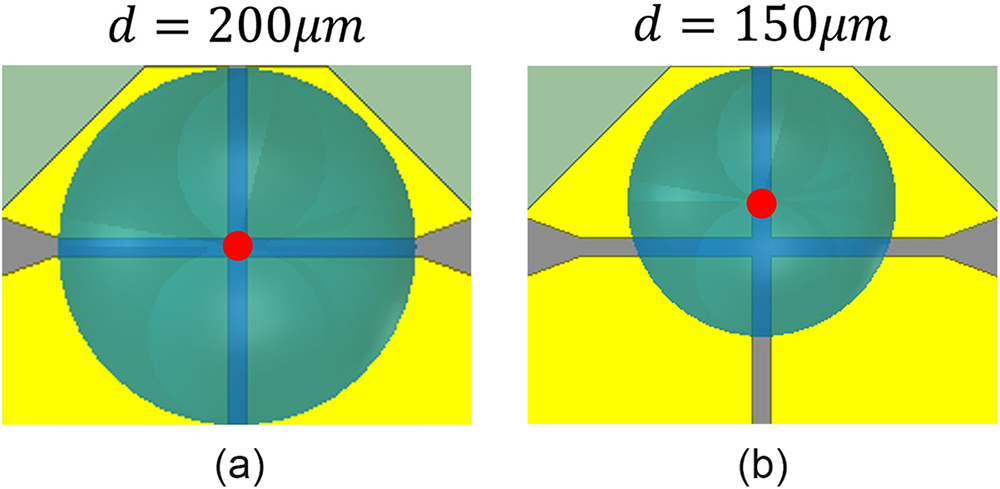
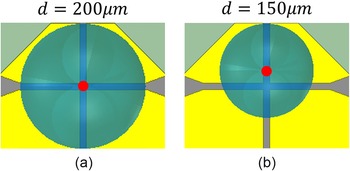
From Figure 9(a) and (b), one may notice that the capacitive contrasts exhibit a stable variation from 1 to 3 GHz. For beads with diameters close to 150 µm,  $\Delta Cap$ of ${y_{2a}}$ presents a value of −37 fF, which is nearly twice the extracted value of $y_{2b\_CC}$ (−20 fF). In the case of beads with diameters close to 200 µm, $\Delta Cap$ is almost equal for both ${y_{2a}}$ and $y_{2b\_CC}$, with a value of −30 fF approximately. This may be explained by the placement of the beads depending on their diameter, as depicted in Figure 10. Due to the size variation of the beads, whilst the trap remains at the same location compared to the microwave electrodes, a shift of the center of the beads may occur for small ones (cf. Figure 10(b)). A variation in the capacitive contrasts is then obtained for ${y_{2a}}$ and $y_{2b\_CC}$. On the contrary, beads exhibiting a diameter of 200 µm are well centered on the microwave electrodes (cf. Figure 10(a)), leading to an excellent symmetry of the bead on the microwave electrodes. The capacitive contrasts extracted for ${y_{2a}}$ and ${y_{2b_{CC}}}$ are therefore quasi-identical. In other words, the two sizes of Polystyrene (PS) beads lead to different dielectric distributions on the four electrodes. The 200 µm diameter beads are homogenously distributed on the four gaps and electrodes (as shown in Figure 10(a)), resulting in quasi-identical values of $\Delta Cap$ for both y2a and y2b_CC, as visible with blue curves in Figure 9. On the other side, noncentered beads with a diameter of 150 µm can be considered asymmetric on the sensor (as shown in Figure 10(b)), inducing radically different values of $\Delta Cap$ for both y2a and y2b_CC (cf. red curves in Figure 9). Even if PS beads exhibit a regular shape and as the sensing method considers the volume fraction of the element under test, one may assume that a similar behavior will be globally obtained with irregular samples, such as 3D biological microtissues.
Schematics of trapped polystyrene beads exhibiting (a) a 200 µm and (b) a 150 µm diameter, respectively. The red dot indicates the center of each polystyrene bead.
To complete this investigation and better compare the results obtained from simulations and experiments, the root mean square error (RMSE) is calculated in Table 2 based on the mean values of  ${y_{2a}}$ and $y_{2b\_CC}$. This analysis allows assessing the accuracy of the experiments compared to the simulated data for both bead sizes. Calculated RMSE values for ${y_{2a}}$ and $y_{2b\_CC}$ are ranging from 0.44 to 2.19 fF. These small values permit to quantify and verify the excellent agreement between simulated and experimental results.
These first results obtained with dielectrically homogeneous 3D models show the detection ability of the sensor based on the localization of the object on the different microwave electrodes.
Conclusions
In this paper, a microwave-based 4-port biosensor is introduced, and its electrical model is established to consider subdivisions of a 3D object. This study represents a first step toward the mapping of complex and heterogenous 3D biological microtissues. Based on a common-differential mode approach and the symmetry of the microwave device, the initial S parameters of the 4-port component are transformed and simplified into 2-port systems, leading to the extraction of an electrical model based on a capacitance in parallel with a conductance, both of which refer to the 3D object under test. Before being able to consider and analyze complex 3D biological elements, the sensor is tested with elementary solutions and solid elements. Ethanol-based aqueous solutions are first tested due to their constitutive homogeneity within the fluidic channel of the sensor. Depending on ethanol concentrations, a linear variation of the capacitance and conductance is obtained, which validates the detection capacity of the 4-port sensor. Polystyrene beads are then considered due to their known and uniform permittivity as well as their 3D shape. Both numerical and experimental investigations are carried out on such objects. Two different sizes of beads are considered, leading to the demonstration of locally dependent sensing in the 4-port device. Due to the size difference, the beads are not identically centered on the four microwave electrodes, resulting in different capacitive contrast values extracted from  ${y_{2a}}$ and $y_{2b\_CC}$ at different locations on the sensor. Finally, the RMSE between simulated and experimental results demonstrate the robustness of the approach. To conclude, this investigation demonstrates that the proposed and innovative 4-port sensor is able to consider 4 subdivisions of 3D objects. Homogeneous elements were considered up to now. Next steps should be performed on more and more complex elements to be characterized, including heterogenous ones, leading to 3D biological models such as microtissues. Extending the considered frequency range may also present interest in correlating the biological state and the microwave dielectric response. This multiport model opens attractive perspectives toward the intracellular and intra-tissular analyses of complex and heterogeneous biological models.
Acknowledgment
The work was partly supported by LAAS-CNRS micro and nanotechnologies platform of the French RENATECH network.
Competing interests
The authors declare none.
Yuwei Li received a degree in physics and microelectronics from the Lanzhou University of Technology (China) in 2020 and her M.S. degree in Physics, Photonics and nanotechnology from Université Bourgogne-Franche-Comté, France, in 2022. Currently, she is a Ph.D. student from the University of Toulouse, Toulouse, France, in the Laboratory of Analysis and Architecture of System of the National Scientific Research Center CNRS (LAAS-CNRS), Toulouse, France. She is working with microwave-based biosensors, specializing in modeling and mapping to characterize 3D biological objects, with a particular focus on 4-port biosensors.

Olivia Peytral-Rieu received M.S. degree in translational medicinal chemistry from University of Montpellier, Montpellier, France, in 2019; Engineering Degree in chemistry, biology and health from the Engineering Chemistry School of Montpellier, Montpellier, France, in 2019. She received the Ph.D. degree in Electromagnetic, Hyper Frequency systems from the University of Toulouse, Toulouse, France, in 2022. She is currently Associate Professor with the University of Toulouse, and a Researcher with the Laboratory of Analysis and Architecture of System of National Scientific Research Center, Toulouse, France. Her current research interests include the use of microwave based dielectric spectroscopy for the study and the characterization of 3D biological microtissues.
David Dubuc received the Agregation degree from the Ecole Normale Supérieure de Cachan, Paris, France, in 1996, and the M.S. and Ph.D. degrees in electrical engineering from the University of Toulouse, Toulouse, France, in 1997 and 2001, respectively. From 2002 to 2013, he was an Associate Professor with the University of Toulouse, and a Researcher with the Laboratory of Analysis and Architecture of System of National Scientific Research Center (LAAS-CNRS), Toulouse, France. From 2007 to 2009, he was a Visiting Senior Researcher at the Laboratory of Integrated Micromechatronic Systems (LIMMS-CNRS)/Institute of Industrial Science (IIS), University of Tokyo, Tokyo, Japan. Since 2013, he is Professor at the University of Toulouse. His research interests include the development of microwave circuits integrated with microtechnologies and their application to wireless telecommunication and biology. He has participated or organized several international events, including GAAS 2005 and 2020 MTT-S International Microwave Biomedical Conference (IMBioC 2020), where he acted as Topical Committee Chair. Prof. Dubuc is a member of the IEEE Microwave Theory and Technology Society (IEEE MTT-S) and the European Microwave Association (EuMA).
Katia Grenier received the M.S. and Ph.D. degrees in electrical engineering from the University of Toulouse (UT), Toulouse, France, in 1997 and 2000, respectively. After a Post-Doctoral Fellowship at Agere Systems (Bell Labs), Murray Hill, NJ, USA in 2001, she joined the Laboratory of Analysis and Architecture of Systems of the National Scientific Research Center (LAAS-CNRS), Toulouse, France. She was engaged in the development of microwave microelectromechanical systems (RF MEMS). From 2007 to 2009, she was with the Laboratory for Integrated Micromechatronic Systems (LIMMS-CNRS), CNRS/Institute of Industrial Science (IIS), University of Tokyo, Japan, where she was engaged in launching research activities on miniature microwave-based biosensors. Since then, her research interests at LAAS-CNRS are focused on the interaction of RF electromagnetic waves with complex fluids. It involves the development of microwave systems based on dielectric spectroscopy for biological sensing and healthcare applications as well as in vitro exposure systems for evaluating electromagnetic waves effects on cells and microtissues. She is the head of the High Frequency and Fluidic Micro-nanosystems research Group (MH2F) at LAAS-CNRS since 2009. She has participated or organized several international events, including the 2020 MTT-S International Microwave Biomedical Conference (IMBioC 2020), where she has acted as General Chair. Dr Grenier is a member of the European Microwave Association (EuMA) and URSI, as well as a senior member of the IEEE Microwave Theory and Technology Society (IEEE MTT-S) and a member of the IEEE MTT-28 Technical Committee on Biological effect and medical applications of RF and microwave.














 Open access

