


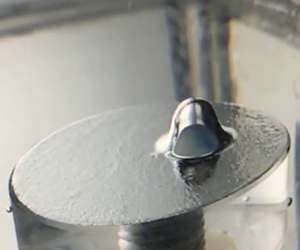





1. Introduction
The growth and release of gas bubbles in liquids is a key process in nature (Sparks Reference Sparks1978; McGinnis et al. Reference McGinnis, Greinert, Artemov, Beaubien and Wüest2006; Gonnermann & Manga Reference Gonnermann and Manga2007; Papadopoulou et al. Reference Papadopoulou, Eckersley, Balestra, Karapantsios and Tang2013) and technology (Rodríguez-Rodríguez et al. Reference Rodríguez-Rodríguez, Sevilla, Martínez-Bazán and Gordillo2015; Anna Reference Anna2016). Although most recent studies have focused on microbubbles due to their promising biomedical applications, there are still relevant open problems at the capillary length scale, where buoyancy and capillary forces are of comparable importance. These millimetre-sized bubbles appear in many natural processes and are of interest to industry, e.g. in water treatment, aeration processes in bioreactors and chemical reactors, mineral purification by flotation techniques or the removal of dissolved gas. Several techniques have been developed to produce large bubbles, such as gas trapping and release (Chu et al. Reference Chu, Finch, Bournival, Ata, Hamlett and Pugh2019), or the injection of large gas flow rates leading to bubble coalescence (Higuera Reference Higuera2005; Higuera & Medina Reference Higuera and Medina2006), but they lack precise control of the generated bubble size.
The injection of gas from a submerged orifice or nozzle into a quiescent liquid represents the easiest method to generate bubbles in a controlled way, and has been extensively studied (Longuet-Higgins, Kerman & Lunde Reference Longuet-Higgins, Kerman and Lunde1991; O $\tilde{{\rm g}}$uz & Prosperetti Reference Ouz and Prosperetti1993; Bolaños-Jiménez et al. Reference Bolaños-Jiménez, Sevilla, Martínez-Bazán and Gordillo2008). In the quasi-static regime, the volume of the detached bubble, $\bar {V}_f$, is determined by a balance between the buoyancy force, $O(\rho g \bar {V}_f)$, and the surface tension force, $O(\sigma \bar {a})$, providing $\bar {V}_f \sim (\sigma \bar {a})/(\rho g) \sim l_{\sigma }^2 \bar {a}$, where $l_{\sigma }=(\sigma /\rho g)^{1/2}$ is the capillary length, and $\bar {a}$ is the injector radius. Here, $\rho$, $\sigma$ and $g$ are the liquid density, the liquid–gas surface tension coefficient and the gravitational acceleration, respectively. Throughout the article, barred symbols denote dimensional variables. Note that, in the common case of air bubble injection in water, which is the only one considered in the present study, the capillary length $l_{\sigma }\approx 2.71\ \textrm {mm}$. The maximum bubble volume achieved with this technique is limited by the Rayleigh–Taylor instability, whose onset occurs for a critical injector radius of $\bar {a}_{c} = 1.84 \,l_{\sigma }$ (Plateau Reference Plateau1873; Maxwell Reference Maxwell1876). In this case the contact line is pinned to the injector rim, and the quasi-static shape of the bubble can be determined as a function of its volume using hydrostatics (Longuet-Higgins et al. Reference Longuet-Higgins, Kerman and Lunde1991; Chesters Reference Chesters1978).
The volume of the released bubble is affected by the wettability of the solid, measured by the static contact angle  $\theta$, which is defined from the liquid side, i.e. between the solid/liquid contact area and the contact line (Bonn et al. Reference Bonn, Eggers, Indekeu, Meunier and Rolley2009), as depicted in figure 1 for both a drop and a bubble. The advancing (receding) movement of the contact line is defined when the solid/liquid contact surface increases (decreases). Thus, the contact angle when the contact line advances (recedes) is known as advancing (receding) contact angle, $\theta _a$ ( $\theta _r$). Consequently, in the case of a bubble (figure 1b), the receding contact angle, $\theta _r$ is defined when the bubble base expands, while the advancing one, $\theta _a$, corresponds to the retraction of the contact line towards the air injection orifice. Since the contact line is pinned whenever $\theta _r<\theta <\theta _a$ (De Gennes Reference De Gennes1985), if $\theta$ becomes equal to or lower than its receding value, the bubble would spread over the surface, increasing $\bar {V}_f$ with respect to the case of a pinned contact line. When the bubble base expands (Byakova et al. Reference Byakova, Gnyloskurenko, Nakamura and Raychenko2003), the shape can be computed assuming a constant contact angle during the process (Gerlach et al. Reference Gerlach, Biswas, Durst and Kolobaric2005; Higuera Reference Higuera2005). These bubbling conditions have been investigated both experimentally (Lin, Banerji & Yasuda Reference Lin, Banerji and Yasuda1994; Gnyloskurenko et al. Reference Gnyloskurenko, Byakova, Raychenko and Nakamura2003; Corchero, Medina & Higuera Reference Corchero, Medina and Higuera2006; Vafaei & Wen Reference Vafaei and Wen2010; Mirsandi et al. Reference Mirsandi, Smit, Kong, Baltussen, Peters and Kuipers2020), and theoretically (Byakova et al. Reference Byakova, Gnyloskurenko, Nakamura and Raychenko2003; Gharedaghi et al. Reference Gharedaghi, Dousti, Eshraghi, Hanafizadeh and Ashjaee2017), demonstrating that $\bar {V}_f$ is substantially increased using hydrophobic surfaces with $90^{\circ } < \theta \lesssim 120^{\circ }$.
Sketch showing the definition of the contact angle, as well as the advancing (adv) and receding (rec) movement of the contact line in the cases of (a) a drop, and (b) a bubble. (c) Zoomed area indicated in red in (b) displaying the Cassie or fakir state in which the liquid does not penetrate into the irregular roughness of the surface.

Additionally, superhydrophobic surfaces (Feng et al. Reference Feng, Li, Li, Li, Zhang, Zhai, Song, Liu, Jiang and Zhu2002; Quéré Reference Quéré2005, Reference Quéré2008) realise extreme non-wetting states with  $\theta \gtrsim 150^{\circ }$ due to their ability to entrap air at the scale of their roughness. These air micro-layers, also known as plastrons (Thorpe Reference Thorpe1950; Flynn & Bush Reference Flynn and Bush2008), can be found in nature, with the self-cleaning property of lotus leaves as the prominent example (Marmur Reference Marmur2004; Cheng & Rodak Reference Cheng and Rodak2005; Wang et al. Reference Wang, Zheng, Nie, Zhai and Jiang2009). Although there are several bubble formation experiments conducted with superhydrophobic surfaces (Ling, Lu & Ng Reference Ling, Lu and Ng2011; Huynh et al. Reference Huynh, Zahidi, Muradoglu, Cheong and Ng2015), a systematic experimental and theoretical account of the maximum bubble base radius and its corresponding volume is still lacking, and constitutes the main objective of the present paper, where we experimentally perform the controlled inflation of a plastron until its stability limit is reached.
The paper is organised as follows. In § 2 the experimental set-up and the measurement techniques are presented, followed by a brief explanation of the quasi-static model in § 3. The main results of the paper are reported in § 4, and some concluding remarks are finally presented in § 5.
2. Experiments
In our experiments we injected air quasi-statically into still water at a constant flow rate  $\bar {Q}\ll \bar {Q}_c$, where $\bar {Q}_c={\rm \pi} (16 \sigma ^5 \bar {R}^5/3\rho ^5g^2)^{1/6}$ is the critical flow rate below which quasi-static conditions prevail (O $\tilde{{\rm g}}$uz & Prosperetti Reference Ouz and Prosperetti1993), and $\bar {R}$ is the bubble base radius. For completeness, let us briefly summarise the arguments used by O $\tilde{{\rm g}}$uz & Prosperetti (Reference Ouz and Prosperetti1993) to deduce the previous equation for $\bar {Q}_c$. Note first that, under purely hydrostatic conditions, $\bar {Q}\ll \bar {Q}_c$, the volume of the released bubble is determined, in a first approximation, by equating the buoyancy and the surface tension forces, $\rho g \bar {V}_F = 2 {\rm \pi}\sigma \bar {R}$, where $\bar {V}_F=2{\rm \pi} \sigma \bar {R}/(\rho g)$ is usually referred to as the Fritz volume. Under constant flow rate injection conditions, the instantaneous bubble volume is $\bar {V}(\bar {t})=\bar {Q} \,\bar {t}$, where $\bar {t}$ is the time, and the instantaneous vertical position of the bubble centroid measured from the injector exit is $\bar {z}(\bar {t})=g\bar {t}^2/2$ (for a detailed derivation, see O $\tilde{{\rm g}}$uz & Prosperetti (Reference Ouz and Prosperetti1993)). It is further assumed that, at the instant of bubble detachment $\bar {t}_f$, $\bar {z}(\bar {t}_f)=\bar {R}_f$, where $\bar {R}_f$ is the final bubble radius, whence $\bar {t}_f=(2/g)^{1/2}\bar {R}_f^{1/2}$. Thus, the final bubble volume is $\bar {V}_f=\bar {Q} \, \bar {t}_f=\bar {Q}(2/g)^{1/2}\bar {R}_f^{1/2}\Rightarrow \bar {V}_f=\bar {Q}(2/g)^{1/2}[3\bar {V}_f/(4{\rm \pi} )]^{1/6}\Rightarrow$ $\bar {V}_f=[6/({\rm \pi} g^3)]^{1/5}\bar {Q}^{6/5}$, where a spherical bubble shape is assumed. Equating $\bar {V}_f=\bar {V}_F$ for $\bar {Q}=\bar {Q}_c$, the desired equation for $\bar {Q}_c$ is finally deduced. In particular, the critical gas flow rate associated with the smallest bubble base radius used in this work, $\bar {R} =4\ \textrm {mm}$, is $\bar {Q}_c=413\ \textrm {ml}\,\textrm {min}^{-1}$, a value much higher than the maximum gas flow rate injected in the experiments, namely $\bar {Q}=10.5\ \textrm {ml}\,\textrm {min}^{-1}$.
The air was supplied from a pressurised line through an orifice of radius  $\bar {a} = 0.5\ \textrm {mm}$ drilled in a poly(methyl methacrylate) (PMMA) plate. To ensure a constant air flow feeding the bubble, a large pressure drop along the gas injection line was induced by means of a long and thin capillary just upstream of the orifice (O $\tilde{{\rm g}}$uz & Prosperetti Reference Ouz and Prosperetti1993; Gordillo, Sevilla & Martínez-Bazán Reference Gordillo, Sevilla and Martínez-Bazán2007). Indeed, it was carefully verified that the bubble volume increased linearly with time in all the cases reported hereinafter. The water free surface level, approximately 10 cm above the orifice, and the pool cross-section, $10 \times 10\ \textrm {cm}^2$, were both large enough to avoid any influence of the oscillations of the upper free surface and the walls, respectively. Finally, the gas flow rates used in all the experiments led to very small bubbling frequencies of approximately 0.5 Hz, thus assuring a negligible effect of the previously formed bubble on the reference one. The commercial product NeverWet® was applied to produce a superhydrophobic coating by creating a hierarchical texture and random multi-scale roughness (Quéré (Reference Quéré2008), see figure 1c). In agreement with the manufacturer's fact sheet, a static contact angle $\theta =166\pm 5^{\circ }$, was measured by gently depositing small single water droplets on the surface, as illustrated in figure 1(a), corroborating the superhydrophobic properties of the coated surface. Given that the scale of our measurements did not allow us to obtain the static contact angle at the scale of the microscopic roughness (Bonn et al. Reference Bonn, Eggers, Indekeu, Meunier and Rolley2009), the angle $\theta = 166 \pm 5^{\circ }$ measured with the drop deposition method described above may be referred to as the macroscopic static contact angle. However, it is important to point out that this angle is not the one that governs the bubbling process under study, where the superhydrophobic surface is submerged in water, forming an air plastron over the surface (Huynh et al. Reference Huynh, Zahidi, Muradoglu, Cheong and Ng2015). This situation is known as a Cassie state, in which the liquid does not penetrate into the gaps of the rough surface, since air gets trapped inside the surface cavities as a result of the formation of menisci over a multitude of three-phase contact points (see figure 1c). Consequently, when the contact line moves, it slips mostly over an air film rather than on a solid surface, and contact angles of nearly $180^{\circ }$ are found in this case. In addition, we tried to characterise the contact angle hysteresis when the contact line is mobile, $\Delta \,\theta =\theta _a-\theta _r$, finding that $\Delta \,\theta \approx 0$. Thus, hysteresis effects can be neglected in the present work, and we will assume that $\theta \simeq \theta _a \simeq \theta _r$ throughout the paper. This observation is in agreement with the low contact angle hysteresis reported in previous studies of textured superhydrophobic surfaces in the Cassie state (see for instance Cassie & Baxter Reference Cassie and Baxter1944; Lafuma & Quéré Reference Lafuma and Quéré2003; Patankar Reference Patankar2003).
To control the bubble base expansion, the coating layer was applied over a circular zone of radius  $\bar {R}_s \gg \bar {a}$ concentric with the orifice. The coating radius $\bar {R}_s$ was varied using 10 different injectors, which were fabricated by depositing the coating on PMMA surfaces with concentric masks whose radii varied from $\approx$4 to $\approx$11 mm in steps of 1 mm. Their exact values, measured with image processing, are reported in table 1.
Summary of the experimental cases, where  $V_{f}^e/{\rm \pi}$ and $V_{f}^m/{\rm \pi}$ represent the experimental volume of the released bubbles and that corresponding to the final equilibrium shape given by the model, respectively. In mode A, $R$ is prescribed, with $R=R_s$, while $\theta$ varies during the bubbling process. In mode B, the bubble base changes while the contact angle is fixed. There, the value of $\theta \approx 175^{\circ }$ was established comparing the experimental bubble shapes with the modelled ones.

Throughout the paper, the capillary length,  $l_{\sigma }=\sqrt {\sigma /\rho g}$, is used as the characteristic length to non-dimensionalise the problem. Thus, the dimensionless bubble base radius is $R=\bar {R}/l_\sigma =\sqrt {Bo}$, where $Bo=\rho g \bar {R}^2/\sigma$ is the usual Bond number, and the dimensionless bubble volume is $V=\bar {V}/l_\sigma ^3$. In addition, the constant injected flow rate, $\bar {Q}$, is used to define the dimensionless time as $t=\bar {t}\, \bar {Q}/l^3_{\sigma }$. Since $\bar {V}=\bar {Q}\bar {t}$, the dimensionless time coincides with the dimensionless instantaneous bubble volume, $V=t$. We recall here that barred symbols denote dimensional variables, while their dimensionless counterparts are denoted without bars. Table 1 summarises the main parameters of our experiments. Finally, note that all the numbers reported in the paper were computed using $\rho =1000\ \textrm {kg}\,\textrm {m}^{-3}$, $g = 9.81\ \textrm {m}\,\textrm {s}^{-2}$ and $\sigma =0.072\ \textrm {N}\,\textrm {m}^{-1}$.
Bubbling events were recorded with a high-speed camera (Photron SA1.1) operated between 250 and 1000 frames per second. A LED lamp and a cold fibre light source were used to obtain the bubble silhouette. Either a Sigma 105 mm microlens or an Edmund VZM-450 lens was used to get spatial resolutions ranging from 6 to  $20\ \mathrm {\mu }\textrm {m}\,\textrm {pixel}^{-1}$. Reproducibility of the experiments was ensured by recording many bubble formation cycles during different days, and the axisymmetry of the growing bubbles was visually confirmed. The dimensionless volume of the forming bubble was thus computed as $V^e(t) = {\rm \pi}/4 \int _{O}^{x_m} D^2(x,t)\,\textrm {d}\kern0.06em x$, where the superscript $e$ indicates the experimental bubble volume, $x_m$ is the maximum vertical coordinate, $D(x,t)$ is the bubble diameter at each vertical position. Hereinafter, the experimentally measured volume of the released bubble after its detachment will be denoted $V_f^e$ (see table 1). The values of $R$ and $V_f^e$ reported in the table are average values obtained from at least 10 different experimental runs in each case, with the corresponding error being the maximum between the standard deviation and the uncertainty associated with the measurements of $R$ and $V_f^e$. Although the gas flow rate always accomplished the quasi-static condition, $Q\ll Q_c$, it was varied in the different experiments performed for each set, allowing us to ensure that $Q$ had a negligible effect on the results.
The experiments performed showed the existence of two different behaviours of the contact line depending on the radius of the coated surface, hereinafter referred to as mode A and mode B, respectively. On the one hand, in mode A, the contact line was observed to be pinned at the rim of the coated surface, and the radius of the bubble base is equal to that of the coated surface,  $R=R_s$. Under these conditions, after the detachment of the previous bubble, the base radius of the forming one reaches the edge of the coated surface very quickly. Since $\theta$ depends on the instantaneous bubble shape, the contact angle varies with time during the bubble formation process in mode A, namely $\theta =\theta (t)$. Figure 2 shows a sequence of images of a bubble formation cycle of experimental case 5 (mode A), together with the relevant parameters of the problem in (a,b). The bubbling process is divided into three stages. In the first stage, once the previous bubble detaches, the injected air spreads quickly over the coated surface until the contact line reaches its rim, where it gets pinned (figure 2b). In the second stage, the bubble grows quasi-statically with a fixed base radius $R$ (figure 2b–e), so that the coated surface acts as a virtual nozzle of radius $R_s$. In the third stage, the buoyancy force overcomes the surface tension force, and the bubble is rapidly stretched in the vertical direction while the contact line retracts towards the orifice (figure 2f–h), until the bubble finally pinches off. This final stage, taking place between the last equilibrium state and the bubble detachment, is very short compared with the bubbling time, with a relative duration of less than 4.5 % in the experimental case 5. On the other hand, in mode B, which prevails for sufficiently large values of $R_s$ (see table 1), the bubble base does not reach the edge of the coated surface. Therefore, the contact line is not pinned to the surface rim and moves freely along the substrate, providing a time varying bubble base radius, $R(t)<R_s$, while the contact angle remains fixed. A noteworthy feature of mode B is the loss of axisymmetry during the bubbling process, a phenomenon reported also by Huynh et al. (Reference Huynh, Zahidi, Muradoglu, Cheong and Ng2015) for air plastrons.
Quasi-static growth and dynamic detachment of an air bubble in still water, corresponding to experimental case 5 in table 1. A constant air flow rate  $\bar {Q} = 10.5\ \textrm {ml}\,\textrm {min}^{-1}$ is injected from a submerged orifice of radius $\bar {a}=0.5\ \textrm {mm}$ placed on a superhydrophobic coating of radius $\bar {R}_s=8.12\ \textrm {mm}$. The white meniscus plotted in (f) is the quasi-static bubble of maximum volume when the contact line is pinned at the edge of the orifice. The time of maximum theoretical static volume is 2.046 s, and the pinch-off time is 2.142 s. Times are: (a) $\bar {t}=0.000\ \textrm {s}$; (b) $\bar {t}=0.500\ \textrm {s}$; (c) $\bar {t}=1.000\ \textrm {s}$; (d) $\bar {t}=1.500\ \textrm {s}$; (e) $\bar {t}=2.000\ \textrm {s}$; (f) $\bar {t}=2.124\ \textrm {s}$; (g) $\bar {t}=2.132\ \textrm {s}$; (h) $\bar {t}=2.140\ \textrm {s}$.

3. Theoretical model
The quasi-static and axisymmetric bubble growth in the second stage is modelled by defining a cylindrical coordinate system  $(x,y)$ with origin at the bubble apex $O$, as depicted in figure 2(e). The arclength $s$ from the origin is used to locate a generic point in the interface, with the angle $\alpha$ defined between the tangent at that point and the horizontal direction, such that $\mathrm {d}\kern0.7pt x/\mathrm {d}s = \sin \alpha$ and $\mathrm {d}y/\mathrm {d}s = \cos \alpha$. Assuming that the interface is an equilibrium shape resulting from the balance of buoyancy and capillary forces, the dimensionless Young–Laplace equation yields a pressure $p_B=p+(\kappa _1+\kappa _2)$ inside the bubble, where $p=p_0+x$ is the liquid pressure, $p_0$ is the pressure at $O$ and $\kappa _1=\mathrm {d}\alpha /\mathrm {d}s$ and $\kappa _2= \sin \alpha /y$ are the principal curvatures. Thus, the bubble shape solves the equation (Longuet-Higgins et al. Reference Longuet-Higgins, Kerman and Lunde1991)
 \begin{equation} \dfrac{\mathrm{d}\alpha}{\mathrm{d}s} + \dfrac{\sin \alpha}{y} + x = \dfrac{2}{R_c}, \end{equation}
where  $R_c$ is the radius of curvature at the apex. The numerical integration of (3.1) supplemented with suitable boundary conditions determines the bubble shape. The arclength at the point lying on the substrate, $s_m$, is obtained as part of the solution by imposing either $y(s_m)=R$ if the contact line is pinned, or $\alpha (s_m) = {\rm \pi}-\theta$ when the contact angle is prescribed. In the former case, the only parameter of the problem is the dimensionless base radius $R$, where the contact angle is obtained as part of the solution. However, if the contact angle $\theta$ is fixed, the value of $R$ is a function of the volume. In both cases, (3.1) was numerically solved using the highly efficient and freely available Matlab® package Chebfun (Driscoll, Hale & Trefethen Reference Driscoll, Hale and Trefethen2014).
4. Results
Figures 3(a) and 3(b) show the dimensionless bubble height,  $h = x_m$, as a function of the dimensionless volume, $V^m/{\rm \pi} = \int _{0}^{x_m} y^2 \,{\textrm {d}\kern0.06em x}$ given by the model described in § 3, as well as that obtained experimentally. It should be recalled here that, with our choice of characteristic scales, the dimensionless bubble volume $V$ is equal to the dimensionless time $t$, as explained in § 2. In particular, figure 3(a) compares the results obtained from the hydrostatic model with the experimental ones for cases 2 and 5 reported in table 1, corresponding to mode A. In these cases the bubble grows with a contact line pinned at the coating radius $R_s$, and the bubble base radius, $R=R_s$, is prescribed while the contact angle $\theta$, varies during the bubbling process. Initially, the height increases linearly with the volume as $h\approx (2V/{\rm \pi} R^2)$, up to a maximum value $V_f^m$ that depends on $R$, corresponding to the last stable equilibrium shape predicted by hydrostatics. For $V>V_f^m$ the static equilibrium is broken and the third dynamic stage takes over, with a fast increase of the experimental height and almost negligible volume variations. The model correctly reproduces the experimental evolution for $V\leq V_f^m$ (second stage), but cannot predict the dynamic bubble shapes for $V>V_f^m$ due to the fact that the dynamic pressure of the liquid flow induced by bubble growth is no longer negligible. In the second stage, the theoretical bubble profiles describe the experimental interface very accurately, as evidenced by figures 3(e) and 3(f), which correspond to the maximum stable volume for the experimental cases 2 and 5, respectively (see supplementary movies 1 and 2 available at https://doi.org/10.1017/jfm.2020.1098). It is interesting to note that the computed evolution of $\theta (V)$, shown in figure 3(c) for the experimental case 2, is also in fair agreement with the experiments. These results are in line with previous works on bubble formation in hydrophobic substrates (Gerlach et al. Reference Gerlach, Biswas, Durst and Kolobaric2005; Corchero et al. Reference Corchero, Medina and Higuera2006; Gharedaghi et al. Reference Gharedaghi, Dousti, Eshraghi, Hanafizadeh and Ashjaee2017; Mirsandi et al. Reference Mirsandi, Smit, Kong, Baltussen, Peters and Kuipers2020).
(a) Comparison of the calculated (lines) and the experimental (symbols) bubble height as a function of its volume for the experimental cases 2 (black) and 5 (blue), where  $R$ is fixed (mode A). (b) The same for the experimental case 9 (green), with $\theta =175^{\circ }$ (thick solid line), and $170^{\circ } \leq \theta \leq 180^{\circ }$ (coloured band). (c) Dependence of the contact angle on the bubble volume for the experimental case 2. (d) Dependence of the bubble base radius on the bubble volume for experimental case 9. (e–g) Theoretical bubble profiles represented on top of the experimental images for the experimental cases 2, 5 and 9, respectively, obtained at the maximum static volume $V=V_f$, indicated with red circles in (a,b). There, the last experimental point for each case corresponds to the bubble pinch-off. Scale bars correspond to 5 mm. Note that, for clarity, not all the experimental points have been plotted.

Bubble formation under mode B is different, in that the bubble base does not reach the edge of the coated surface, and thus  $R$ varies during the bubbling process, while the contact angle remains constant. The results corresponding to experimental case 9 are plotted in figure 3(b). In this case, although the contact angle could not be measured accurately, our observations suggest that a film of air, or plastron, filled the microscopic cavities generated by the surface roughness, and $\theta$ must then approach the limiting value of an ideal superhydrophobic surface, i.e. $\theta \approx 180^{\circ }$ (Huynh et al. Reference Huynh, Zahidi, Muradoglu, Cheong and Ng2015). To check this hypothesis, we imposed a prescribed contact angle as boundary condition to solve (3.1), as done e.g. in Gerlach et al. (Reference Gerlach, Biswas, Durst and Kolobaric2005). In particular, the experimental results are correctly reproduced imposing contact angles in the range $170^{\circ }\leq \theta \leq 180^{\circ }$, as evidenced by the coloured band in figure 3(b), corroborating that in mode B the surface behaves as an almost ideal non-wetting surface. It is also noticeable that the computed evolution of $R(V)$, shown in figure 3(d) agrees with the experimental results. Moreover, the bubble shape in the second stage is almost perfectly reproduced using $\theta =175^{\circ }$, as revealed by figure 3(g) and by supplementary movie 3. It is significant that the retraction of the contact line towards the end of the second stage is also well captured. In addition, the hydrostatic model accurately describes the experiments reported by Ling et al. (Reference Ling, Lu and Ng2011), contrary to their claim that the static theory is unable to account for their observations.
Our experiments revealed that mode A takes place for coated surfaces whose radii  $R_s \lesssim 3.21$ (experimental cases 1–6), while mode B is observed for $R_s \gtrsim 3.33$ (experimental cases 7–10). Thus, the transition between both modes occurs for $3.21 \lesssim R \lesssim 3.33$. The most plausible mechanism to explain this transition is related to the ability of the bubble base to reach the edge of the coating while it expands. If the coated surface area is sufficiently large, the contact line does not reach the coating radius, and the bubble growth takes place at constant contact angle and varying base radius. In contrast, for small enough coating radii, the bubble base reaches the rim, growing with a fixed base radius and varying contact angle. Hence, for a given macroscopic contact angle of the plastron created on the submerged superhydrophobic surface, it is possible to deduce a limiting radius above which the maximum bubble base radius is smaller than the coating radius. Indeed, simple computations performed with the hydrostatic model (not shown here for conciseness) reveal that the maximum radius reached by the bubble during its growth, $3.21 \lesssim R \lesssim 3.33$, corresponds to contact angles $171\lesssim \theta \lesssim 174^{\circ }$, in good agreement with our estimation of $\theta = 175^{\circ }$ for bubble formation in mode B.
Following the stability argument by Longuet-Higgins et al. (Reference Longuet-Higgins, Kerman and Lunde1991), the hydrostatic model can also be used to obtain the maximum stable bubble volumes for different values of the coating radius. In their own words, ‘when the bubble contains the maximum amount of air for the nozzle diameter, and further air is forced or allowed to enter, then it has no choice but to break off’. Thus, the onset of the dynamic bubble collapse stage coincides with the point of maximum volume, i.e. the turning point in the  $h-V$ curves shown in figure 3. Figure 4 shows the dependence of the maximum stable volume on the coating radius extracted from the model, $V_f^m$ (solid line), together with the volumes of the released bubbles obtained experimentally, $V_f^e$ (symbols), for the experimental cases corresponding to mode A, where $R=R_s$. Note that the model prediction is in fair agreement with the experiments (also given in table 1), with a maximum relative deviation of 6.6 %. In principle, one might expect that the model should underestimate the experimental results due to the volume added from the destabilisation point to the pinch-off instant, which is, for instance, approximately 4.5 % for the experimental case 5. However, it can be observed in figure 4 that the experimental values of $V_f^e$ are not systematically larger than those deduced from hydrostatics, $V_f^m$, indicating that there must be other effects, probably associated with experimental errors, that justify these small deviations. The different sources of errors could include uncertainties in the image analysis, deviations from ideally axisymmetric shapes or imperfections of the coated surface, among others. Nevertheless, it can be concluded from figure 4 that $V_f^{m}$ represents a good prediction of $V_f^e$.
Bubble volume as a function of coating radius. The solid line represents the maximum static bubble volume obtained theoretically,  $V_f^m$, while the symbols are the final volume measured experimentally, $V_f^e$. Static menisci with volumes above the dashed line are unstable under the asymmetric azimuthal mode $m=1$. The vertical dashed lines represent the critical radius for the onset of the Rayleigh–Taylor instability associated with a conventional nozzle, $R_{n}=1.84$, the calculated critical bubble base radius, $R_{cr}=3.22$, and the global maximum base radius $R_{max}=3.83$, which corresponds to a flat interface. Inside the shaded region, the equilibrium shapes are stable under axisymmetric disturbances, but unstable under non-axisymmetric ones. Note that the shaded region cannot be reached in our experiments, since it corresponds to contact angles $\theta >180^{\circ }$.

Furthermore, figure 4 reveals that the final bubble volume increases with  $R$ until reaching a maximum value of $V_{cr}=6.04 \, {\rm \pi}$ at the critical base radius $R_{cr}=3.22$, in agreement with previous results. In particular, Michael & Williams (Reference Michael and Williams1976) performed a theoretical study of the equilibrium and stability of axisymmetric pendent drops, showing the existence of a bifurcation of the equilibrium state due to an asymmetric mode. Specifically, these authors demonstrated that for $R>3.22$ this asymmetric instability, which has an associated azimuthal wavenumber $m=1$, is triggered when the profile of the drop flattens at the injector edge. Indeed, it should be noted that the pendant drop and the sessile bubble are equivalent configurations, since they are described by the same equations under purely hydrostatic conditions. Therefore, as in Michael & Williams (Reference Michael and Williams1976), the limiting volumes for $R>R_{cr}$ correspond to bubble profiles whose contact angle at the rim is $\theta =180^{\circ }$, and are thus expected to lose their stability through an asymmetric perturbation with azimuthal mode $m=1$. Consequently, the neutral curve presented in figure 4 was built based on two stability criteria: (i) the turning point in the $h-V$ curves for $R<R_{cr}$ (Longuet-Higgins et al. Reference Longuet-Higgins, Kerman and Lunde1991), and (ii) the condition that the contact angle is $\theta =180^{\circ }$ at the rim for $R>R_{cr}$ (Michael & Williams Reference Michael and Williams1976). Thus, the solid line in figure 4 represents the maximum stable bubble volume according to the criterion established by Longuet-Higgins et al. (Reference Longuet-Higgins, Kerman and Lunde1991), which has been extended to $R>R_{cr}$, and the dashed line indicates the volume at which the interface becomes flat at the rim, $\theta =180^{\circ }$. According to Michael & Williams (Reference Michael and Williams1976), this is also the critical bubble volume for the onset of asymmetric instabilities. It can be observed in figure 4 that the asymmetric instability occurs for smaller volumes than the axisymmetric one for $R>R_{cr}$ (shaded region of figure 4). When $R=R_{cr}$ both criteria are simultaneously met, and the corresponding volume is $V_{cr}$, which represents the absolute or global maximum of a bubble generated quasi-statically. Furthermore, notice that experimental case 6 ( $R=3.21$) lies almost on top of the neutral stability line for $m=1$, with a bubble volume that fairly agrees with the maximum value obtained from the model, $V_{cr}$. Note that, in figure 4, there are no experimental results for bubble base radii larger than the critical one because, in our particular configuration, the bubble base radius becomes variable and mode B takes place instead of mode A. For vales of $R>R_{cr}$, the maximum stable volume decreases, reaching the flat interface limit, $V^m_f=0$, for $R=R_{max}=3.83$. This maximum radius coincides with the value predicted by Plateau and Maxwell for the onset of the Rayleigh–Taylor instability for a planar interface pinned to the rim of a circular surface (Plateau Reference Plateau1873; Maxwell Reference Maxwell1876). It should be noticed that the maximum contact angle in our configuration is indeed $\theta =180^{\circ }$, since the bubble surface cannot penetrate the substrate. It is also noteworthy that the bubble detachment process was precisely observed to lose the axial symmetry when $R>R_{cr}$, as evidenced in supplementary movie 4, which was obtained using a very large superhydrophobic coating radius of $R_s \simeq 12$. The movie shows that the air plastron is not inflated symmetrically with respect to the axis of the orifice, i.e. the centre of the surface, but from apparently random locations along the surface. This behaviour illustrates our conjecture about the existence of non-axisymmetric instability modes, plausibly including the first azimuthal one, $m=1$.
It is important to emphasise that in continuous bubble formation processes, like those studied herein, the maximum stable radius of circular orifices or nozzles is in fact substantially smaller than  $R_{max}$. Indeed, after a bubble pinches off, the contact line typically recedes along the inner injector wall, leading to a configuration analogous to an interface confined by a vertical cylinder. Under these conditions, a planar interface becomes unstable for $R = R_{n}=1.84$ (Plateau Reference Plateau1873), which is the practical limit when using a conventional nozzle to continuously generate bubbles under quasi-static conditions. Interestingly, the configuration studied in the present work allows us to overcome such a limitation. Indeed, it is clear that the use of the superhydrophobic coatings allows us to continuously generate bubbles of volumes significantly larger than those produced from ordinary injectors under quasi-static conditions. Moreover, in contrast with Ling et al. (Reference Ling, Lu and Ng2011), where it is claimed that hydrostatics cannot properly describe the bubble profiles, here, we have clearly demonstrated that the profiles can indeed be calculated, up to their destabilisation, as equilibrium shapes attached to a virtual nozzle of radius $R=R_s$.
One of our major findings here is the experimental proof of the existence of an absolute global maximum in the volume of bubbles generated quasi-statically, which can never be exceeded irrespective of the coating surface radius due to stability reasons. To provide further confirmation of this fact, the value of  $V_f^m$ was computed for a prescribed value of the contact angle, as similarly done by Lee & Yang (Reference Lee and Yang2009). In this case, unlike in the results displayed in figure 4, $\theta$ is fixed and $R$ is an outcome of the model. As shown in figure 5, the model predicts a monotonic increase of $V_f^m$ with $\theta$. Note, in particular, that a superhydrophobic substrate allows us to generate bubbles with volumes up to three times larger than those reported in previous studies (see for example Lin et al. Reference Lin, Banerji and Yasuda1994; Gnyloskurenko et al. Reference Gnyloskurenko, Byakova, Raychenko and Nakamura2003; Corchero et al. Reference Corchero, Medina and Higuera2006). In addition, it is clear that the maximum volume of a static bubble with prescribed contact angle corresponds to an ideally non-wetting surface, i.e. $\theta =180^{\circ }$. This maximum volume, namely $V=6.04{\rm \pi}$, coincides with the maximum one shown in figure 4, $V_{cr}$, and is consistent with the theory of Michael & Williams (Reference Michael and Williams1976), in that the radius of the bubble base at detachment is the critical value $R=R_{cr}$. Indeed, in this case, the conditions $R=R_{cr}$ and $\theta =180^{\circ }$ are simultaneously accomplished at the point of maximum volume. Note that $V_{cr}$ is in close agreement with the experimental volume of the bubbles released under mode B, $V_f^e$, obtained from the experimental cases 7–10. As can be observed in figure 5, $V_f^e$ has nearly the same value for all the experiments in mode B, being very close to the maximum value obtained within mode A (experimental case 6). This fact is in agreement with the absolute maximum of the bubble volume predicted by the model. The large vertical error bars in our experiments within mode B are due to deviations from axisymmetry during the formation of these bubbles that were visually confirmed. In contrast, the significant deviations from the theoretical prediction of several experimental data extracted from previous studies that used hydrophobic surfaces can be attributed to the effect of contact angle hysteresis. Indeed, such hysteresis effects are generally non-negligible for contact angles smaller than those of the present study, as suggested by Gerlach et al. (Reference Gerlach, Biswas, Durst and Kolobaric2005). However, providing a general theoretical picture of the bubble formation process that includes the effect of contact angle hysteresis would require performing numerical simulations of the bubble growth and collapse coupled with a proper model of contact angle hysteresis, which is outside the scope of the present work.
Evolution of the maximum bubble volume with the contact angle obtained from the hydrostatic model. The figure also displays the final bubble volume,  $V^e_f/{\rm \pi}$ (bullets), obtained experimentally with different values of $R_s$ (experimental cases 7–10 from table 1) and the bubble volumes reported by Lin et al. (Reference Lin, Banerji and Yasuda1994), Gnyloskurenko et al. (Reference Gnyloskurenko, Byakova, Raychenko and Nakamura2003) and Corchero et al. (Reference Corchero, Medina and Higuera2006) for comparison.

5. Concluding remarks
The use of a superhydrophobic coating allowed us to study the continuous quasi-static generation of bubbles for contact angles approaching the limit of an ideally non-wetting surface,  $\theta \simeq 180^{\circ }$. We have shown that the detached bubble volume can be increased in a controlled way, simply by applying the coating to a circular region of a given radius. Interestingly, the technique presented herein makes it possible to avoid the Rayleigh–Taylor stability limit associated with conventional nozzles. With this method, the contact line can slip over the surface, but not in the vertical direction, as typically occurs in conventional injectors. In that case, after the detachment of the previous bubble, the contact line retracts and penetrates inside the nozzle, so that the interface shape is close to a circle. This configuration becomes unstable for $R=R_n=1.84$, which is the Rayleigh–Taylor stability limit associated with conventional injectors. This is precisely the limit avoided in the configuration described herein, which makes it possible to reach the global maximum of the bubble volume for a bubble base radius $R_{cr}=3.22$.
Our experimental results have been rationalised using a simple hydrostatic model which assumes static equilibrium shapes during most of the bubble growth process. The good agreement of the model with the experiments confirms that bubble formation can be described as a sequence of equilibrium states where the bubble is attached to a virtual nozzle of radius  $R_s$. A maximum bubble volume of $V_{cr}=6.04 {\rm \pi}$ has been found, corresponding to a critical bubble base $R_{cr}=3.22$. For $R>R_{cr}$, the growing bubble has been observed to become unstable to asymmetric disturbances, what constitutes the first experimental proof of the prediction made by Michael & Williams (Reference Michael and Williams1976).
Supplementary movies
Supplementary movies are available at https://doi.org/10.1017/jfm.2020.1098.
Acknowledgements
R.B.-J. is very grateful to J.M. Gordillo for his encouragement and fruitful discussions.
Funding
This work has been supported by the Spanish MINECO under Projects DPI2017-88201-C3-2-R and DPI2017-88201-C3-3-R, partly financed through European funds, and by Universidad de Jaén Project Ref. 1263528 funded by Programa Operativo FEDER Andalucía 2014–2020. Support from the Red Nacional para el Desarrollo de la Microfluídica, RED2018 102829 T, is also acknowledged.
Declaration of interests
The authors report no conflict of interest.


 Open access

