

In New Zealand (NZ), despite a decline of over 60 % in CVD mortality rates since its peak in the late 1960s, CVD remains one of the leading causes of death, contributing to over 28 % of overall mortality(1, Reference Tobias, Sexton and Mann2). While pharmacological interventions have made a substantial contribution to the decline in incidence since the 1990s, it is speculated that changes in dietary consumption behaviours may have made the biggest contribution before then(Reference Tobias, Taylor and Yeh3).
One of the changes in dietary patterns has been a steady increase in fruit consumption, but 45 % of NZ males still do not consume the recommended number of two fruit servings per d(4). Fruits are chemically complex foods that contain a range of nutrient and non-nutrient components that may contribute independently or synergistically to cardiovascular health(Reference Badimon, Vilahur and Padro5–7). These include soluble fibre, antioxidant vitamins, folate and phytochemicals(Reference Badimon, Vilahur and Padro5, Reference Voutilainen, Nurmi and Mursu6, Reference Brown, Rosner and Willett8–Reference Salas-Salvado, Bullo and Perez-Heras10).
In NZ, kiwifruit is a commonly consumed, nutrient-dense fruit. Green kiwifruits are unique, in that they contain significant levels of soluble fibre(Reference Schakel, Pettit, Himes and Spiller11) and have one of the highest concentrations of vitamin C of any readily available fruit(Reference Ferguson and Ferguson12). Kiwifruit has been shown to be a significantly better delivery vehicle to replenish depleted vitamin C tissue levels than a supplement, in a mouse model(Reference Vissers, Bozonet and Pearson13). Green kiwifruit also contains a significant amount of vitamin E, which is more commonly associated with green leafy vegetables than fruit (other than avocados), K, folate and other phytochemicals, including polyphenols and carotenoids(Reference Ferguson and Ferguson12, Reference Hunter, Greenwood and Zhang14). Many of the phenolics and flavonoids are yet to be identified, as to date they have been unextractable(Reference Tarascou, Souquet and Mazauric15). Few studies have investigated the effects of kiwifruit on CVD-related metabolic markers. Two previous studies investigating their effects on lipid profiles have shown conflicting results, and neither study included a control group(Reference Chang and Liu16, Reference Duttaroy and Jorgensen17). A recent study has shown beneficial effects on blood pressure(Reference Karlsen, Svendsen and Seljeflot18).
Genetic variation is known not only to contribute to >45 % of CVD risk(Reference Elder, Lichtenstein and Pittas19), but also to explain a large component of the highly heterogeneous response to interventions(Reference Corella and Ordovas20, Reference Masson, McNeill and Avenell21). An example is the common APOE epsilon variant, where, in a general population, up to a 50 % higher risk of CVD is associated with the APOE4 compared with the wild-type APOE3/E3 genotype(Reference Song, Stampfer and Liu22). Although recent evidence is suggestive of a pro-inflammatory and pro-oxidant impact of the APOE4 allele(Reference Jofre-Monseny, Minihane and Rimbach23), the higher risk has been traditionally attributed to higher total cholesterol (TC) and LDL-cholesterol (LDL-C) concentrations in this subgroup(Reference Bennet, Di Angelantonio and Ye24). Furthermore, although the literature is inconsistent, carriers of the APOE4 allele appear to show greater LDL-C-lowering responses in dietary fat manipulation studies(Reference Rimbach and Minihane25).
We hypothesised that the replacement of two fruit servings in a healthy diet with two green kiwifruits would have favourable effects on plasma lipids and other CVD-related markers of risk, and that carriers of different APOE genotypes may show differences in response to the intervention. We tested this hypothesis using a randomised controlled cross-over study design comparing a healthy diet including kiwifruit with a healthy diet with no kiwifruit. In addition to having a control group, unlike other dietary intervention studies of kiwifruit, the present study is the first to examine the beneficial impact of kiwifruit in addition to general recommended healthy eating guidelines. Thus, the beneficial effects of kiwifruit beyond the effects of a healthy diet containing fruit could be investigated.
Subjects and methods
Subjects
A total of eighty-seven men over 21 years of age were recruited from around Auckland, NZ, through a range of advertising strategies (emails to selected databases, such as the Massey University Albany Nutrition Research volunteer database, press releases and fliers). To be included in the study, the subjects needed to have a LDL-C concentration >3·0 mmol/l and a plasma TAG concentration < 3·0 mmol/l. Exclusion criteria included diagnosed chronic disease such as CHD, diabetes and cancer; smoking; and the use of any product that could affect serum lipid concentrations, including lipid-lowering medication (statins, fibrates and cholesterol absorption inhibitors), supplements such as nicotinic acid, fish oil capsules, fibre-containing laxatives or functional foods such as sterol-enriched spreads. Additionally, subjects were excluded if familial hypercholesterolaemia was determined using the diagnostic criteria for familial hypercholesterolaemia described in de Sauvage Nolting et al. (Reference de Sauvage Nolting, Buirma and Hutten26).
As one of the objectives of the study was to compare the effects of the intervention between carriers of the APOE4 allele and non-carriers, it was calculated that a minimum of eighty subjects would be required to ensure a sample size of twenty carrying the APOE4 allele. This was based on retrospective genotyping and an estimated prevalence of 25 % in Caucasian populations(Reference Jofre-Monseny, Minihane and Rimbach23). A sample size of twenty APOE4 carriers would provide 80 % power to detect a significant difference (α =0·05, two-tail) of 0·5 mmol/l ( ± 7–10 %) in TC and LDL-C between interventions. The power calculation was based on the evidence that a reduction of 0·5 mmol/l LDL-C is estimated to result in a 12–14 % reduction in CHD mortality risk, which is a clinically significant reduction(Reference Gould, Davies and Alemao27). More subjects (n 87) were recruited to allow for drop-outs from the study.
The present study was conducted according to the guidelines laid down in the Declaration of Helsinki, and all procedures involving human subjects were approved by the Massey University Human Ethics Committee: Southern A 09/76. Written informed consent was obtained from all subjects. Clinical trial registry: ACTRN12610000213044 www.ANZCTR.org.au
All subjects received nominal compensation for travel expenses and, at completion of the study, subjects received reports summarising their individual results including body composition, BP, blood results and dietary assessment, and additional dietary recommendations were provided.
Study design
The study was a randomised controlled cross-over study (Fig. 1). After completion of a 4-week run-in on a healthy diet, subjects were randomly assigned to one of two groups (dietary intervention sequences) using computer-generated random numbers (http://www.randomization.com). The study consisted of two 4-week intervention sequences of two green kiwifruits per d plus healthy diet (intervention) or healthy diet alone (control). The study was conducted between May and September 2010.
Study flow (A colour version of this figure can be found online at http://www.journals.cambridge.org/bjn).
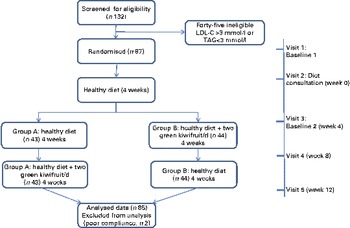
Subjects made five visits to the Massey University Human Nutrition Research Unit; baseline 1 – before their nutrition consultation (visit 1), at the time of their nutrition consultation (visit 2), baseline 2 – after completing their 4-week healthy diet run-in (visit 3) and at the end of each intervention (visits 4 and 5). Anthropometric measures, fasting blood samples and dietary data were gathered at all visits (excluding the nutrition consultation visit), as described later.
The primary outcome measures were lipid profiles (plasma TC, LDL-C, TAG, HDL-cholesterol (HDL-C), TC:HDL-C ratio, serum apoA1 and apoB) and small dense LDL (sLDL). The secondary outcome measures were markers of glucose metabolism (plasma glucose, serum insulin), blood pressure and serum high-sensitivity C-reactive protein (hs-CRP).
The study was conducted under free-living conditions. The subjects were asked to maintain their normal daily routine (including physical activity) while implementing the healthy diet guidelines, for the duration of the study. Compliance with these instructions, following the intervention, presence of illness and use of medication during the study was monitored by a weekly self-completed diary.
Diet and kiwifruit interventions
The healthy diet was based on the Heart Foundation of New Zealand's ‘9 steps to Eating for a Healthy Heart’ (see Appendix 1 of the Supplementary material, available online)(28). All subjects were required to attend a nutrition consultation with a nutritionist, who outlined the guidelines and suggested personal changes to each subject's present diet. Subjects were then requested to follow the healthy diet (control diet) for the 12 weeks of the study. The guidelines required subjects to consume at least two servings of fruits per d, and during the kiwifruit intervention, two of these servings were replaced with two Zespri® green kiwifruits (Actinidia deliciosa var Hayward) per d.
Before their nutrition consultation, subjects were required to complete a 3 d food record, and 24 h food records were collected at visits 3–5. During each visit, subjects met with a nutritionist, who instructed them on how to complete food records, checked the records for completeness and portion size accuracy and completed a quality-control checklist based on the subjects' achievement of the ‘healthy diet’ guidelines. A questionnaire to assess how subjects tolerated consuming two green kiwifruits per d was completed at the end of the kiwifruit intervention.
Nutrient analysis for the 3 d food record and subsequent 24 h food records was conducted using the computer program FoodWorks Professional Edition version 4.00 (Xyris Software, 2009). The three 24 h food records were combined to give an average dietary intake over the 8-week intervention period, which allowed comparison with the 3 d food record.
Anthropometric measurements
Height (visit 1 only) and waist and hip circumferences were measured at visits 1 and 3–5 using the International Society for the Advancement of Kinanthropometry anthropometry methods using a stadiometer and Lufkin tape. Weight and percentage body fat were measured using the BODPOD (air displacement plethysmography, COSMED USA, Inc.). BMI and waist:hip ratio were then calculated.
Blood pressure
An Omron HEM-907 Digital Automatic Blood Pressure Monitor (Omron Healthcare, Inc.) was used to measure brachial arterial BP. Subjects had to lie down quietly to relax for about 5 min before any measurements were taken. The right arm was used for all measurements. Two measurements were taken consecutively, 1 min apart, and the average calculated using the auto function of the monitor.
Sample collection and preparation
Venous blood samples were collected after fasting for 8 h into vacutainers buffered with EDTA, heparin or no anticoagulant (baseline 1, heparin vacutainers only, for plasma TC, TAG and HDL-C).
Serum samples were allowed to clot for 30 min before being processed. All other tubes were kept on ice and processed within 60 min of collection. Tubes were centrifuged for 15 min at 3000 rpm at 4°C. Aliquots were stored at − 80°C until the end of the study for analysis in one batch.
Biochemical analysis
Analysis was conducted by the Canterbury Health Laboratories, Christchurch, NZ (IANZ ISO 15 189) for all samples except the sLDL, which was analysed at the Biomedical Research Centre, University of East Anglia. Plasma TC and TAG concentrations were measured with enzymatic kits (Abbott Laboratories, catalogue no. 7D62-21 and catalogue no. 7D74-21, respectively). HDL-C was measured by accelerated reaction using selective detergent (Abbott Laboratories, Catalogue no. 3K33-21). LDL-C was calculated using the Friedewald algorithm (LDL-C = TC – HDL-C–(TAG/2·22) mmol/l)(Reference Friedewald, Levy and Fredrickson29). The interassay CV ranged from 1·7 to 2·0 % for total plasma cholesterol, 2·5 to 5·9 % for plasma TAG and 3·7 to 10·1 % for plasma HDL-C. Serum apoA1 and apoB were measured using Abbott Architect/Aeroset reagent kits (Abbott Laboratories, Catalogue no. 9D92-20 and catalogue no. 9D93-20, respectively), CV 3 and 4 %, respectively.
Plasma glucose was determined by enzymatic assay (Abbott Laboratories, Catalogue no. 3L82-41), CV 1·72–2·49 %, and plasma insulin by two-site sandwich after polyethylene glycol extraction (Roche, Catalogue no. 12017547), CV 3·8–8·7 %. The homeostasis model assessment (HOMA) 2 model was used to calculate insulin resistance, based on fasting insulin and glucose concentrations(Reference Wallace, Levy and Matthews30).
Serum hs-CRP was measured by Nephelometry assay (Siemens Healthcare Diagnostic Products GmbH, Catalogue no. 10446091), CV 4·5–5·1 %. APOE variants were genotyped by PCR(Reference Hixson and Vernier31). sLDL-C was measured by direct automated assay, sLDL-Ex ‘SEIKEN’ two-reagent kit (Randox Laboratories, Catalogue no. 56 216), intra-assay CV 0·99 % and inter-assay CV 1·24 %.
Nutrient analysis of kiwifruit samples
Kiwifruit samples were randomly selected from each batch (one batch per 4-week period) of kiwifruit and allowed to ripen at room temperature to the same level of ripeness as recommended to the subjects for consumption. Fruit was then peeled, sliced, vacuum packed and frozen before being freeze-dried. The macronutrients, vitamin C, vitamin E and dietary fibre (insoluble and soluble) were analysed as follows: protein – Leco, total combustion method, AOAC 968.06; fat – cold extraction using chloroform–methanol, AOAC 969.24; carbohydrate – by difference; sugars – phenol sulphuric(Reference Hall, Hoover and Jennings32); vitamin C – HPLC(Reference Lee and Coates33); vitamin E – AOAC Official methods 971.30, modified and dietary fibre – Megazyme total dietary fibre kit (Megazyme International Ireland Limited), method details: AOAC 991.43, AOAC 985.29, AACC32-07 and AACC 32-05.
Statistical analysis
Statistical analyses were performed using SPSS software version 18 (SPSS, Inc.). Normal distributions were tested using the Kolmogorov–Smirnov and Shapiro–Wilk tests and normality plots. Non-normally distributed data were transformed into approximately normal distributions, if possible, by logarithmic or square root transformations. The data are appropriately expressed as mean and 95 % CI, if normally distributed; geometric means and 95 % CI, if log-transformed; medians (25th and 75th percentiles), if non-normally distributed data; or as frequencies.
Changes in plasma lipids and anthropometric measures from baseline 1 to baseline 2 were examined using dependent Student's t tests. The data for the intervention were examined for any interaction effects due to the sequence of intervention (kiwifruit followed by control and vice versa) using two-way ANOVA. If an interaction was seen, only the data from the first 4 weeks of the intervention were analysed. If no interaction was seen, the data from the two intervention periods were combined. Comparisons between baseline 2 and end of the interventions (control and green kiwifruit interventions separately) and between control and kiwifruit interventions for changes in variables were made using dependent Student's t tests. Two-way ANOVA was also used to examine APOE genotype and treatment interactions. However, as the assumptions of homogeneity of variance for ANOVA were not satisfied, lipid results for the two interventions were analysed stratified for APOE4 carriers v. non-carriers using dependent Student's t tests and independent Student's t tests. Significance was set at P< 0·05. All tests were two-tailed.
Results
Characteristics of subjects
All eighty-seven men who met the inclusion criteria and were randomly assigned to the two intervention groups completed the 12-week intervention. However, based on their diaries kept during the intervention, two subjects were excluded from the analysis as a result of poor compliance ( < 80 %) for the kiwifruit intervention. The flow of subjects through the different phases of the study is illustrated in Fig. 1.
The baseline characteristics of the eighty-five subjects who completed the study are shown in Table 1.
Baseline characteristics of subjects (Mean values and 95 % confidence intervals (at baseline 1, unless otherwise indicated); geometric means, 95 % confidence intervals, percentages and ranges; n 85)
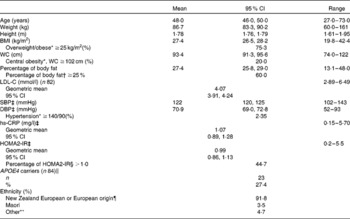
WC, waist circumference; LDL-C, LDL-cholesterol; SBP, systolic blood pressure; DBP, diastolic blood pressure; hs-CRP, high-sensitivity C-reactive protein; HOMA2-IR, homeostasis model assessment 2 model for insulin resistance.
* Recognised cut-offs for WC, BMI and hypertension(56).
† Recognised cut-off for excess body fat(Reference Lee and Nieman34, 35).
‡ Baseline 2 values.
§ Elevated insulin resistance(Reference Wallace, Levy and Matthews30).
∥ One subject requested not to be included in any gene analysis.
¶ European origin: United Kingdom, South Africa, Europe and Australia.
** Chinese, Philippines, Tonga and India.
The men were healthy (no diagnosed chronic disease) and predominantly normotensive, but three-quarters were overweight or obese (BMI ≥ 25 kg/m2) and more than 60 % were carrying excess body fat (percentage of body fat ≥ 25 %)(Reference Lee and Nieman34, 35). Analysis of the APOE genotype identified twenty-three men (27·4 %) who were carriers of the APOE4 allele (one E2/E4, twenty-one E3/E4 and one E4/E4) and sixty-one (72·6 %) non-carriers (six E2/E3 and fifty-five E3/E3). One subject requested not to be included in any gene analysis.
Effects of the intervention on dietary intake, body weight and blood pressure
An assessment of the group's mean energy intake and that of other selected dietary components was made before the nutrition consultation, based on the average intake from a 3 d food record and during the intervention by using the average of three 24 h records collected at visits 3–5 (Table 2). Significant differences were seen for all nutrients assessed (except percentage of energy from PUFA) between the two periods, with decreases in total energy and cholesterol intake and the percentage of energy from fat and saturated fat.
Composition of the diet pre-nutrition consultation and during the intervention* (Mean values, geometric means, 95 % confidence intervals, medians, 25th and 75th percentiles, n 85)
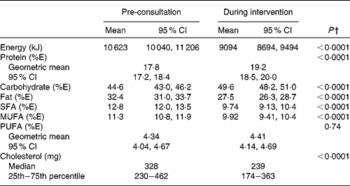
%E, percentage energy of total energy.
* Pre-consultation intake: average of 3 d food record. During intervention intake: average three 24 h food records from visits 3–5.
† Mean values were significantly different between pre-consultation and during intervention (P< 0·05) (dependent Student's t test), or Wilcoxon signed ranks test for non-parametric data (P< 0·05).
During the kiwifruit intervention, the men consumed half a fruit serving per d more (fresh, canned/stewed, dried and real fruit juice) compared with the control intervention. Significantly higher intakes were seen for vitamins C and E during the kiwifruit intervention compared with the control intervention (Table 3).
Fruit serving, dietary fibre and vitamin C intakes: baseline 1 to baseline 2 and after the two intervention periods* (Medians, geometric means, 95 % confidence intervals, 25th and 75th pecentiles, n 85)
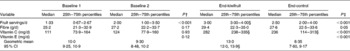
Baseline 1, before run-in period, average of 3 d food record; baseline 2, after run-in period and two treatment periods, 24 h food records.
* Subjects followed a cross-over design protocol for the two treatment periods.
† Mean values were significantly different from baseline 1 to baseline 2 (P< 0·05; dependent Student's t test).
‡ Mean values were significantly different between green kiwifruit v. control (P< 0·05; dependent Student's t test).
§ Mean values were significantly different from baseline 2 to end (P< 0·05; dependent Student's t test).
During the 4-week healthy diet run-in period, small but significant decreases were observed for all anthropometric measures (body weight, BMI, waist circumference, waist:hip ratio and percentage body fat). From the end of the run-in period (baseline 2) to the end of the 8-week intervention, there were no further changes in body weight, regardless of which intervention the subjects were receiving (green kiwifruit or control) (Table 4).
Anthropometric and blood pressure assessments: baseline 1 to baseline 2, and after the two intervention periods* (Mean values and 95 % confidence intervals, n 85)
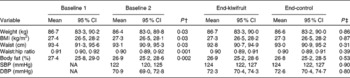
Baseline 1, before run-in period; baseline 2, after run-in period; SBP, systolic blood pressure; NA, not assessed; DBP, diastolic blood pressure.
* Subjects followed a cross-over design protocol for the two intervention periods.
† Mean values were significantly different from baseline 1 to baseline 2 (P< 0·05; dependent Student's t test).
‡ Mean values were significantly different between green kiwifruit v. control (P< 0·05; dependent Student's t test).
There were no significant changes in systolic or diastolic blood pressure (Table 4).
Tolerance to the kiwifruit intervention
The majority of subjects rated eating two green kiwifruits every day as easy or very easy at both the beginning (78·8 %) and end (89·4 %) of the intervention. A total of seventy-five subjects (88 %) reported no unwanted side effects from eating two green kiwifruits per d. The most commonly reported unwanted side-effect was more frequent or looser bowel motions (3·5 %).
Nutrient composition of the green kiwifruit
Two green kiwifruits, without their skin, weighed on average 167 g and provided on average 1·58 g of protein, 21·9 g carbohydrate, 14·9 g sugars, 130 mg of vitamin C, 1·00 mg vitamin E, 4·11 g insoluble fibre and 1·42 g soluble fibre.
Effects on plasma lipid and apo concentrations
Significant improvements were seen in lipid profiles following the 4-week run-in period (Table 5), with both plasma TC and LDL-C decreasing and HDL-C increasing significantly (P< 0·05). There was also a non-significant trend towards a decrease in plasma TAG.
Plasma lipid and apo concentrations at baseline 1 and 2, and after the two intervention periods* (Mean values, geometric means and 95 % confidence intervals, n 85)
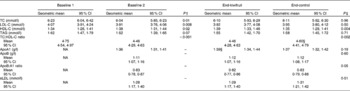
Baseline 1, before run-in period; baseline 2, after run-in period; TC: total cholesterol; LDL-C: LDL-cholesterol; HDL-C: HDL-cholesterol; NA: not assessed; sLDL, small dense LDL-C.
* Subjects followed a cross-over design protocol for the two intervention periods. No interaction effects were seen between sequence of intervention and intervention (two-way ANOVA).
† Mean values were significantly different from baseline 1 to baseline 2 (P< 0·05; dependent Student's t test).
‡ Mean values were significantly different between green kiwifruit v. control (P< 0·05; dependent Student's t test).
§ Mean values were significantly different from baseline 2 to end (P< 0·05; dependent Student's t test).
No significant differences between the two interventions were seen for plasma TC, LDL-C, TAG and sLDL. There was a significant increase in HDL-C concentrations while consuming green kiwifruit compared with the control (mean difference 0·04; 95 % CI 0·01, 0·07 mmol/l; P= 0·004), with TC:HDL-C ratio significantly lower after the green kiwifruit period (mean difference − 0·15; 95 % CI − 0·24, − 0·05 mmol/l; P= 0·002). Serum apoA1 concentrations increased significantly from baseline 2 to end of the green kiwifruit intervention (mean difference 0·03; 95 % CI 0·001 g/l, 0·06; P= 0·03), resulting in a decrease in the apoB:apoA1 ratio with green kiwifruit consumption compared with control (although not significant, P =0·05).
APOE genotype–kiwifruit treatment interaction
There were no significant differences between APOE4 carriers and non-carriers at baseline for any anthropometric measures, blood pressure, hs-CRP, HOMA2-insulin resistance (data not shown) or lipid concentrations (Table 6). Significant improvements in TC, LDL-C and HDL-C were seen in the non-carriers of APOE4 in response to the 4-week healthy diet period (P< 0·05). The same trends and magnitude of change were seen for the APOE4 carriers, but the changes were not significant, which is probably reflective of the smaller sample size in the APOE4 carriers' subgroup.
The impact of APOE genotype on lipid and apo concentrations at baseline 1 and 2, and after the two intervention periods* (Mean values, geometric means and 95 % confidence intervals; n 23 APOE4 carriers and n 61 APOE4 non-carriers)
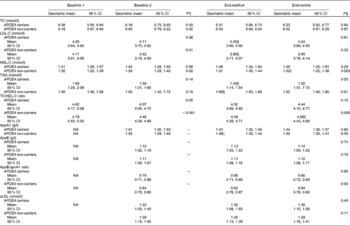
Baseline 1, before run-in period; baseline 2, after run-in period; TC, total cholesterol; LDL-C, LDL-cholesterol; HDL-C, HDL-cholesterol; NA, not assessed; sLDL, small dense LDL-C.
* Subjects followed a cross-over design protocol for the two intervention periods. No interaction effects were seen between sequence of intervention and intervention (two-way ANOVA).
† Mean values were significantly different from baseline 1 to baseline 2 (P< 0·05; dependent Student's t test).
‡ Mean values were significantly different between green kiwifruit v. control (P< 0·05; dependent Student's t test).
§ Mean values were significantly different between APOE4 carriers and non-carriers (P< 0·05; independent Student's t test).
∥ Mean values were significantly different from baseline 2 to end (P< 0·05; dependent Student's t test).
The most significant difference seen between APOE4 carriers and non-carriers in response to the two interventions was the effects on TAG concentrations. APOE4 carriers showed a significant decrease in TAG concentrations following the kiwifruit intervention compared with the control, resulting in a significant difference between the two interventions (mean difference − 0·18; 95 % CI − 0·34, − 0·02 mmol/l; P= 0·03). This also resulted in a significant difference in TAG concentrations between APOE4 carriers and non-carriers for the kiwifruit intervention (mean difference 1·34, 95 % CI 1·14, 1·54 mmol/l v. 1·66, 95 % CI 1·50, 1·85 mmol/l; P= 0·01).
In non-carriers, there was a significant difference between kiwifruit and control for plasma HDL-C and the TC:HDL-C ratio. This was largely due to the significant decrease in HDL-C and increase in the TC:HDL-C ratio for the control intervention from baseline 2. In contrast, while not significant, APOE4 carriers had an increase in HDL-C from baseline 2 (P= 0·14). Serum apoA1 concentration increased in the APOE4 non-carriers during the green kiwifruit period, which was reflected in the apoB:apoA1 ratio (P= 0·03).
Discussion
In the present study, consumption of two green kiwifruits a day for 4 weeks had favourable effects on plasma HDL-C and the TC:HDL-C ratio compared with a healthy control diet. The hypotriacylglycerolaemic impact of the intervention was only evident in APOE4 carriers.
A large proportion (60 %) of men did not meet the recommended two servings of fruit per d at the start of the study, compared with 45 % men from the latest (2008/2009) NZ Adult Nutrition survey, even when including dried fruit and real fruit juice (not included in the nutrition survey)(4). The median number of fruit servings per d increased from 1·3 (25th–75th percentiles 0·7–2·7) at baseline to 3·0 (25th–75th percentiles 3·0–4·0) during kiwifruit and 2·5 (25th–75th percentiles 2·0–4·0) during control interventions. Although the aim was to replace two fruit servings with two kiwifruits, half a serving more of fruit was consumed during the kiwifruit intervention compared with the control period. The five most commonly consumed other fruits were apples, bananas, oranges, pears and mandarins.
The 4-week run-in period on the healthy dietary recommendations resulted in significant improvements in all measured lipid parameters, except TAG, which approached significance. This confirms the efficacy of the present NZ Heart Foundation's guidelines.
Two green kiwifruits per d did not affect LDL-C compared with the control diet. Brown et al. (Reference Brown, Rosner and Willett8) showed that for every 1 g increase in soluble fibre, LDL-C decreased by 0·06 mmol/l. The 1·8 g/d difference in total fibre (including insoluble plus soluble fibre) intake between the kiwifruit and control interventions may not have been sufficient to affect LDL-C concentrations.
The green kiwifruit intervention resulted in a significantly improved mean HDL-C concentration and TC:HDL-C ratio compared with the control intervention. Adding strength to these findings, the green kiwifruit intervention significantly increased apoA1 (the main structural protein component of HDL) concentrations from baseline 2 and consequently contributed to the almost significantly lower apoB:A1 ratio (P= 0·05), compared with the control intervention. It has been suggested that for every 0·1 mmol/l increase in HDL-C, the CHD risk would reduce by between 8 and 15 %(Reference Gordon, Probstfield and Garrison36, Reference Turner, Millns and Neil37); therefore, the difference seen in the present study could be translated into a 3–6 % reduction in risk. These findings are in line with that of Chang & Liu(Reference Chang and Liu16), who showed that consumption of two green kiwifruits per d for 8 weeks significantly increased HDL-C concentration and decreased the TC:HDL-C ratio compared with the baseline levels. In contrast, Duttaroy & Jorgensen(Reference Duttaroy and Jorgensen17) found no effect on HDL-C. Similar to kiwifruit, berries contain vitamins C and E and folic acid, and are a good source of carotenoids and other polyphenols(Reference Basu, Rhone and Lyons38). An 8-week randomised, controlled berry intervention has also shown significant improvements in HDL-C concentrations compared with control products(Reference Erlund, Koli and Alfthan39).
The most likely constituent to exert the observed effects are polyphenols. Flavonoid-rich juices such as orange juice(Reference Kurowska, Spence and Jordan40), grape juice(Reference Albers, Varghese and Vitseva41) and cranberry juice(Reference Ruel, Pomerleau and Couture42) have all been shown to increase plasma HDL-C. While components other than polyphenols, such as vitamin C in fruit and juices, cannot be discounted, polyphenols from cocoa have also shown HDL-C-raising effects(Reference Khan, Monagas and Andres-Lacueva43, Reference Mellor, Sathyapalan and Kilpatrick44). Various mechanisms have been proposed, but in one recent cell study it was shown that cocoa polyphenols increased apoA1 production(Reference Yasuda, Natsume and Osakabe45).
Circulating TAG is metabolically intimately linked with HDL, with elevated TAG levels resulting in increased hepatic lipase-mediated HDL hydrolysis and decreased HDL-C concentration(Reference Lamarche, Rashid and Lewis46). Lowering TAG concentrations have been shown to increase HDL-C in both normo- and hypertriacylglycerolaemic subjects(Reference Miller, Langenberg and Havas47). Chang & Liu(Reference Chang and Liu16) showed a trend towards a decrease in TAG, as did some of the flavonoid-rich juice studies mentioned earlier(Reference Albers, Varghese and Vitseva41, Reference Ruel, Pomerleau and Couture42). The present study showed no significant change in TAG concentrations for the complete group. However, in APOE4 carriers, plasma TAG concentrations were significantly lowered after consumption of green kiwifruit.
Duttaroy & Jorgensen(Reference Duttaroy and Jorgensen17) showed that plasma TAG were significantly reduced by 15 % compared with the baseline values following kiwifruit consumption, as did a more recent study examining the effects of kiwifruit on biomarkers of oxidative status(Reference Brevik, Gaivao and Medin48). Both publications offered little explanation beyond that such effects have been seen before with fruits and vegetables.
A recent placebo-controlled trial in subjects who received 120 mg gamma delta tocotrienols per d showed a 28 % reduction in serum TAG(Reference Zaiden, Yap and Ong49). Despite the dose being higher than is found naturally in fruit, it does hint at the possibility that a component such as this, working synergistically with other bioactive components, may affect TAG concentrations. Polyphenols could also explain the decrease, with studies with red grapefruit and tomatoes also showing positive effects on plasma TAG concentrations(Reference Shen, Chen and Wang50, Reference Gorinstein, Caspi and Libman51). Interestingly, in the tomato study, the positive effects were seen with tomato juice and whole fruit, but not with the lycopene drink(Reference Shen, Chen and Wang50).
APOE4 carriers appear to be the most responsive to reduced SFA, total fat and cholesterol intake, with reductions seen in TC and LDL-C(Reference Masson, McNeill and Avenell21). One study showed a greater responsiveness of APOE4 carriers to the TAG-lowering effect of fish oils(Reference Caslake, Miles and Kofler52). To the best of our knowledge, the present study is the first to show a different response to eating fruit on TAG in APOE4 carriers. It has been suggested that APOE4 represents a ‘lipid-thrifty’ variant, which allows better intestinal absorption of lipids, including fat-soluble vitamins (and polyphenols)(Reference Corbo and Scacchi53–Reference Huebbe, Nebel and Siegert55). Thus, it could be speculated that the absorption of vitamin E, carotenoids and polyphenols from kiwifruit may be enhanced in APOE4 carriers, resulting in a TAG-lowering effect.
Given the chemically complex composition of kiwifruit and the opportunity for both independent and/or synergistic contributions of constituents in biological processes, the complete elucidation of the mechanism to explain the observed increase in HDL-C and decrease in TAG in APOE4 carriers remains to be determined.
Considering that benefits on plasma TAG and HDL-C were evident, which represent core components of the dyslipidaemia associated with obesity and loss of insulin sensitivity, further work to identify the bioactive constituents and the mechanisms underlying their observed benefits is merited.
An unavoidable limitation of the present study is that the use of a fruit intervention precludes the use of a double-blind study design. A further limitation is that the results cannot be extrapolated to women. Strengths include the randomised cross-over design with the 4-week run-in period, wide age and BMI ranges, the inclusion of APOE4 subgroup analysis and a large sample size with sufficient statistical power for APOE4 subgroup analysis.
In conclusion, we found that consuming two green kiwifruits per d showed improvement (although modest) in the CVD risk profile against an overall healthy diet background, with some indication that the APOE4 (approximately 25 % of the population) subgroup may be most responsive.
Supplementary material
To view supplementary material for this article, please visit http://dx.doi.org/10.1017/S0007114512004400
Acknowledgements
The present study was funded by an unrestricted grant from Zespri® International Limited, NZ. The authors have no conflicts of interest to declare. W. S., R. K., C. A. C., P. R. v. H. and C. S. G. were involved in study design and data collection; C. S. G. and W. S. carried out the statistical analysis; A. M. M. analysed APOE data and conducted sLDL analysis; C. S. G. wrote the initial draft of the manuscript, which was modified after feedback from all co-authors. We would like to thank the subjects who participated in the study and the IFNHH research team, with special thanks to Olivia Green, Regina Wypych and Simon Bennett for their help with data collection and Professor John Birkbeck for counselling men identified with the APOE4 genotype.


