

INTRODUCTION
Several studies have investigated atrophic changes of the corpus callosum (CC) in degenerative disease (Biegon et al., 1994; Doraiswamy et al., 1991; Hampel et al., 1998, 2002; Janowsky et al., 1996; Murray et al., 2006; Teipel et al., 2003; Thomann et al., 2006; Vermersch et al., 1993; Wang et al., 2005; Wang & Su, 2006; Wiltshire et al., 2005; Yamauchi et al., 1993). Atrophic changes in the CC in Alzheimer's disease (AD) are more severe than changes seen in healthy older adults, with reduced total callosal area and accentuated regional degeneration seen mostly in the anterior and posterior regions (Biegon et al., 1994; Hampel et al., 1998, 2002; Teipel et al., 1999). Atrophic changes in the CC in normal aging and dementia appear to be analogous to patterns of cortical degeneration in Alzheimer's disease, where atrophy of posterior and anterior tertiary cortex is most marked, and primary sensory and motor cortices are spared until the later stages of the disease (Braak & Braak, 1991; Cummings, 1998; Jellinger, 1998). Given that the CC is topographically organized consisting largely of projections between bilateral homotopic cortical regions (de Lacoste et al., 1985; Pandya & Seltzer, 1986), the regional distribution of degeneration of callosal fibers appears to have implications for the pattern of cognitive decline. A relationship between regional callosal atrophy and cortical degeneration has been noted in other degenerative diseases such as frontotemporal dementia, progressive supranuclear palsy, and corticobasal degeneration (Yamauchi et al., 1993, 1997, 1998, 2000; Kaufer et al., 1997).
Vascular dementia (VaD) is the progressive worsening of memory and other cognitive functions due to chronic, reduced blood flow in the brain. VaD is associated with progressive brain atrophy and white matter changes, often ischemic in origin (Tatemichi et al., 1994). Several studies found callosal atrophy in VaD patients (e.g., Lyoo et al., 1997; Yamanouchi et al., 1990). Lyoo et al. (1997) reported a decrease in overall CC area for VaD patients, when compared to controls, with the most significant degeneration found in the anterior CC region. Yamanouchi et al. (1990) found a significantly smaller number of nerve fibers per unit area of the anterior CC in VaD patients when compared to age matched controls.
Mild cognitive impairment (MCI) is a current term that implies subjective memory complaints or other cognitive dysfunction in the absence of significant functional impairment (Petersen, 2004; Petersen et al., 1997; Storandt et al., 2006) but may be a prodromal stage of degenerative disease (Goodkind et al., 2006; Tabert et al., 2006). Prior to the acceptance of the MCI classification, various terms were used for individuals with cognitive impairment but not yet meeting diagnostic criteria for dementia (Petersen & O'Brien, 2006). One such classification was the term mild-ambiguous (MA; Breitner et al., 1994). Regardless of the nomenclature, there is a group of aging adults who display cognitive problems that are suggestive of an early stage dementia but symptoms are not severe enough to interfere with daily functioning. As might be expected, the few studies that have examined CC surface area in MCI have shown intermediate amounts of atrophy in comparison to age-matched controls and those meeting clinical criteria for dementia (Wang & Su, 2006; Wang et al., 2005).
Morphology of the Corpus Callosum
In attempts to characterize the size and shape of the corpus callosum, several methodologies have been proposed to measure the midsagittal surface area and regional divisions of the CC. Probably the most widely used methodology was developed by Witelson (1985). This method divides the CC linearly into six regions: genu, rostral midbody, anterior midbody, posterior midbody, isthmus, and splenium. However, other methodologies have divided the CC into two regions (Pozzilli et al., 1991), three regions (genu, body, splenium; Janowsky et al., 1996), five regions (Clarke et al., 1993; Teipel et al., 1999), and seven regions (Lyoo et al., 1997). Methodological differences have made it difficult to compare callosal morphology findings across studies. Furthermore, since these studies have used geometric partitioning, none offer clear anatomically justifiable explanations for the number or exact boundaries of these regional divisions.
In contrast to geometric subdivisions, Cowell and colleagues (Cowell et al., 1994) developed a methodology in which the CC is divided into regions according to a factor analysis of local CC measures. This methodology derived 99 callosal widths based on an algorithm that divided the dorsal and ventral CC perimeters each into 100 equidistant points and connected the correspondingly numbered points between the dorsal and ventral surfaces of the CC. Regions are then identified by a factor analysis of these widths, allowing contiguous regions to be identified based upon correlated cross-subject variation in size (Denenberg et al., 1991b). Such regions may better preserve the neuroanatomical relations within the CC and, thus, provide measures that are more salient for investigating regional callosal atrophy in various patients with cognitive impairment, or for observing structure-function relationships.
In the first study using the 99 widths methodology, a seven-factor solution was identified in a sample of healthy adults (Cowell et al., 1994). This factor solution was highly congruent with a second sample of patients who underwent MRI to rule-out structural brain abnormalities. A seven-factor solution was also replicated by Peters and colleagues (2002) with a larger number of healthy young adults, with some methodological refinements in the analysis of the traced MRI images of the CC.
Though some studies have examined the morphology of the corpus callosum across the life span, no studies have conducted a factor analysis of CC widths within a sample of dementia patients. Given that callosal atrophy is noted in dementia, it is reasonable to expect that the factor structure of the CC in a sample of dementia patients with various degrees of CC atrophy might reveal otherwise indistinguishable CC regions, thus providing more regional specificity (i.e., more than the seven factors as previously documented in other studies).
The Cache County Study
Individuals with AD, VaD, and MA and normally aging controls used in this study were participants in the Cache County Study (Breitner et al., 1999). The significance of this data set is twofold. First, residents of Cache County, UT have fewer chronic diseases, longer life spans, and lower rates of mortality before age 85 as compared to the rest of the nation (Breitner et al., 1999; Tschanz et al., 2004). Second, because the data are drawn from an epidemiological, population-based sample (n = 5,092), the findings are more representative of the broad range of neurocognitive changes seen across normal aging and brain disease, as opposed to samples from a hospital or mental health center setting which frequently include higher rates of pathology. Furthermore, the high response rate in the study also assured a representative sample of aging disorders. Approximately 90% of all eligible individuals from the county who were 65 years of age or older participated in the study. Over 60% of those approached for MRI imaging studies (primarily subjects with symptoms suggesting possible dementia) were able and willing to participate.
Research Aims
There were two major aims of this study. The first was to identify the factor structure of the CC in a population based study of dementia. Given the inevitability of increased variance in callosal size due to the heterogeneity of this population, factor analysis of callosal regions should yield more regional specificity than found in previous studies (Cowell et al., 1994). The second aim was to investigate the degree of regional change in CC size with respect to different forms and severities of dementia. It was predicted that CC size would be significantly smaller than controls in participants with dementia. It was expected that the degree of CC degeneration would be related to diagnostic groups and severity of dementia (as indicated by the group average MMSE), such that the CC would be minimally smaller than normal in MA, show moderate atrophy in the VaD group, and decrease in size more severely in AD. Finally, it was expected that callosal regions comprised of fibers interconnecting frontal and temporal-parietal cortex would show the greatest degree of dementia-related atrophy.
METHOD
Participants
This study analyzed archived data from 209 older adult individuals (>65 years) enrolled in the Cache County Memory Study, a population based study. Individuals believed to be incident cases of Alzheimer's disease or other forms of dementia (n = 189) underwent MRI imaging as part of a diagnostic work-up for these disorders. Twenty non-incident cases of dementia were recruited separately from the Cache County Memory Study as controls. With the intent to conduct case-control studies, control subjects were matched to AD patients from the Cache County Study. Because of funding restrictions for neuroimaging, only a small number of controls could be recruited for the study.
Thirty of the 209 participants were eliminated due to poor MRI resolution (such that an accurate tracing of the CC could not be obtained). The remaining 179 individuals represented a range of cognitive functioning. Their clinical diagnoses based on all available medical information were possible and probable AD (n = 78), VaD (n = 53), and MA (n = 28). Neuroimaging was used to ensure that there was no tumor or other space occupying lesion present that could account for the cognitive dysfunction, but there was no clinical rating of the imaging for the purpose of diagnosing dementia.
Diagnostic procedures and cognitive screening to establish diagnoses are described in detail by Breitner et al. (1999). In brief, all prevalent dementia cases from the Cache County older adult population were administered the Modified Mini-Mental State Examination (MMSE; Teng & Chui, 1987; Folstein et al., 1975) and Jorm's Informant Questionnaire on Cognitive Decline in the Elderly (IQCODE; Jorm, 1994). When the respondent's MMSE scores were below 87 (the 25th percentile) or their IQCODE scores were above the recommended cutoff of 3.27, cognitive functioning was investigated with the Dementia Questionnaire (DQ). Individuals with DQ ratings of 4 or 5 were considered to have suspected dementia and were asked to undergo a clinical assessment involving a clinical interview, collateral information, medical and family history, neurological examination, neuropsychological testing, physical examination, and a modified Hachinski ischemia score/evaluation. Follow-up laboratory testing and neuroimaging were requested for all individuals with the initial classification of possible or probable AD, dementia of undetermined etiology, or non-AD dementia.
Participants were administered the Consortium to Establish a Registry for Alzheimer's Disease (CERAD) battery and other selected neuropsychological tests. The CERAD established a standard neuropsychological battery to measure cognitive impairments in AD patients (Morris et al., 1989; Morris, Mohs, Rogers, Fillenbaum, & Heyman, 1988; Welsh et al., 1994). The battery has been documented as being sensitive to the early stages of dementia with substantial inter-rater agreement (0.92 to 1.0), high test-retest reliability, and longitudinal validity (Welsh et al., 1994).
The results of all clinical assessments and collateral information were reviewed at diagnostic conferences including a neuropsychologist, a board-certified geriatric psychiatrist, and the examining nurse and technician. Diagnoses were assigned from a list of more than 30 categories. AD diagnoses followed NINCDS-ADRDA criteria (McKhann et al., 1984). VaD diagnoses followed the NINDS-AIREN criteria (Tatemichi et al., 1994). MA diagnoses followed those outlined by Breitner et al. (1994, 1999). At the time of the study, the newer MCI diagnostic criteria (Petersen, 2004) were not yet published.
Imaging and Morphometric Procedures
Sagittal images were acquired at 0.5 Telsa with a Philips scanner with a quadrature head coil. Scans were T1-weighted with parameters of 500/15/2 (TR/TE/excitations), an acquisition matrix of 256 × 256 pixels, a field of view of 24 cm, and a section thickness of 5 mm with a 1 mm gap (see Bigler et al., 2000 for detailed discussion). The two-dimensional cross section of the CC was identified and measured from the midsagittal view, in accordance with procedures outlined by Denenberg and colleagues (1991a). The midline image was selected according to the clear presence of the fourth ventricle and cerebral aqueduct. To reduce the effect of head tilt on imaging orientation, participants received a routine scout film to insure typical head orientation. Any minor lateral tilt or positioning effects would have been minimal and random due the fact that all scans were conducted on one machine with the same trained technicians. However, any differences in front-back head tilt would not affect CC tracing procedures or the subsequent division of the CC into 99 widths. Total intracranial volumes (TICV) were obtained by summing the measurements of grey matter, white matter, and cerebral spinal fluid obtained from the SPARC workstation-based ANALYZE program (Biomedical Imaging Resources, 1994).
The digital MR images were imported into the National Institute of Health Scion Image software program in order to trace the CC from the midsagittal slice. CC outlines were manually traced with a mouse pen and digitizer pad. All images were traced by two different individuals. Tracers were blind to patient age, gender, and diagnoses. Inter-tracer reliability was .96, p < .001, and intra-tracer reliability was .90, p < .001 with respect to total CC size.
For further analysis, Cartesian coordinates of CC tracings were imported into KSS Stereology, a program originally developed by Denenberg et al. (1991a) and rewritten in Java for research at the Travis Research Institute. The 99 width divisions were obtained by the procedures of Denenberg et al. (1991b), as illustrated in Figure 1. This methodology was developed to accommodate the irregular shape of the midsagittal CC, particularly the bulbosity at either end points (genu and splenium). Because CC regions in dementia patients have not been previously reported, the 99 CC width divisions from all participants (n = 179) in this study were subjected to factor analysis to identify regions of the CC appropriate for a dementia population. Controls were included in the factor analysis to increase the variance of the data in order to not violate assumptions of multivariate normality. The 99-width measurements of the CC were subjected to a Principal Component factor analysis (Cowell et al., 1994). A scree test was used to determine the number of factors present (Bentler & Yuan, 1996). Given the likelihood of correlation among the factors representing callosal regions, factors were obliquely rotated with the promax procedure. CC width variables with factor loadings of .500 or greater were selected to define the regions (factors). Widths meeting this criterion for more than one factor were assigned to the factor with the largest factor loading score. For each participant, the size of each CC region was expressed as the sum of the widths composing the particular factor.
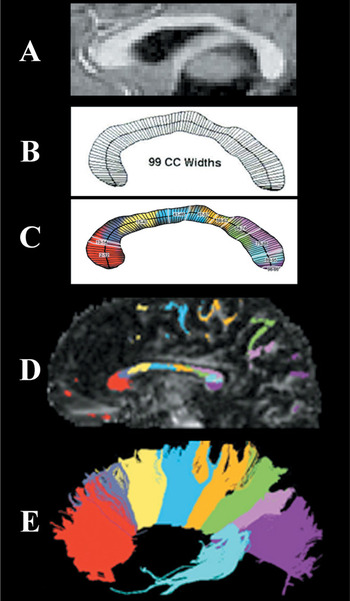
Illustration of the 99-width methodology compared to origins of fibers crossing in the corpus callosum: (A) A sample MRI midsagittal slice with clear view of the corpus callosum. (B) The corpus callosum outline divided into 99 widths based on KSS Stereology algorithm. (C) The 10 regions identified from this study's factor analysis beginning with the rostral region of the CC. (D) Color coding represents white matter projections from diffusion tensor imaging as identified in D with fiber projections being illustrated in E. (Note that C and D have been added to illustrate white matter projections but are not from the same participant image shown in A and B).
Methods and procedures for this study were originally approved in conjunction with the Cache County Memory Study. The Human Subjects' Review Board at the Fuller Graduate School of Psychology also approved the additional analysis of these archival data. De-identified data were made available for the analyses reported herein.
Data analyses
Four-way analyses of variance (ANOVAs) with diagnosis as the fixed factor were conducted to compare group differences for variables of interest such as age, gender, education, and TICV (alpha level of .05 for two-tailed p-values). ANOVAs were first used to compare overall CC size, with significant group descriptive variables entered as co-variates. Multivariate ANOVA's by diagnosis comparing all regional CC measures were conducted. When an overall F-test demonstrated significance, Bonferroni post-hoc t-tests were conducted to investigate differences amongst specific means between groups while correcting for multiple comparisons.
RESULTS
Comparison of Group Descriptives
Table 1 compares the age, education, male/female ratio, MMSE, and TICV for each of the four participant groups. The groups differed in age (F = 6.05, df =3/175, p < .001). Pairwise comparisons revealed that the control group was significantly younger than each of the 3 patient groups (p < .02 in all cases). The 3 patient groups did not differ significantly from each other in age. Therefore, age was used as a covariate in all between-group comparisons involving callosal size. The groups did not differ in education or with respect to male/female ratios. The groups differed significantly in MMSE scores, as would be expected given these diagnostic categories (F = 25.73, df = 3/167, p < .001). Pairwise comparisons revealed that MMSE score was significantly different between the control group and the AD group (p < .001) and the VaD group (p < .001), but not the MA group (p = .221). The patient groups differed significantly from each other for MMSE score (p < .002 in all cases). Finally, there were no group differences in TICV (F = 1.23, df = 3/175, p = .30).
Means and standard deviations of descriptive variables for each participant group

Factor Analysis
In a factor analysis of the 99 widths from individuals of all 4 groups, the scree test suggested a 10-factor solution. The 10 factors accounted for 86% of the variance. Using the criterion of a .500 factor loading, all factors were composed of contiguous widths. Four widths loaded on more than one factor (.500 or greater), but each could be clearly attributed to the factor with the higher factor score. All CC widths except 1 were included in the 10-factor solution. Table 2 presents the outcome of the factor analysis. An anatomical representation of these regions of the CC and the fibers passing through these callosal regions can be seen in Figure 1.
Morphological data and factor loading by callosal region

Total Callosal Size
Table 3 reports an estimate of total callosal size derived from the sum of all 99 widths. There was a pattern of group differences that reflected degree of dementia or cognitive impairment as indicated by the group average MMSE. We first compared the AD group with the control group, which we had hypothesized to have the most extreme differences in CC size. The sum of widths in the AD group was significantly smaller than the controls when controlling for age (F = 4.39, df = 1/95, p < .04). Univariate ANOVA between all 4 groups revealed that average sum of the widths was not significantly different when covarying age (F = 1.76, df = 43/174, p = .158).
Means and standard deviations of callosal measurements (sum of widths in mm) for each region for each participant group

Size of Callosal Regions
Multivariate analysis of variance of all CC regions in all 4 groups (controlling for the effects of age) indicated a significant overall group difference (F = 19.46, df = 10/165, p < .001). Significant group differences were found for the following regions: W2-12 (F = 3.5, df = 3/174, p < .02), W75-88 (F = 3.58, df = 3/174, p < .02), and W89-95 (F = 2.97, df = 3/174, p < .04).
Post-hoc pair-wise comparisons, with Bonferroni corrections for multiple comparisons, were conducted to investigate group differences in the size of callosal regions with age as a covariate in all analyses. The results of these analyses for all CC regions are reported in Table 3 for completeness. It can be seen from Table 3 that the results of these post-hoc tests are consistent with the MANOVA in that significant differences were found in the anterior and posterior CC. The CC of the AD group was smaller than the control group in both anterior (W2-12 and W13-14) and posterior (W75-88 and W89-95) CC regions, with preservation of the midbody. The CC of the VaD group was smaller than the control group only for the foremost anterior portion (W2-12) with preservation of both the midbody and posterior regions. There were no CC regional differences between the MA group and controls, though there was a trend for the foremost region (W2-12) to again be smaller in this patient group (p = .05). There were no significant CC regional differences between patient groups after correcting for multiple comparisons. Effect sizes (partial Eta squared:

) for the differences between the patient groups and the control group for each region are shown in Figure 2 (controlling for age).

Effect sizes (partial Eta squared: ) for the difference in callosal size (sum of widths) between each group and the control group after controlling for age.
DISCUSSION
The results of this study confirm the existence of callosal degeneration in various forms of dementing illnesses using a method allowing for greater regional specificity in CC measurement. First, the results revealed significant callosal atrophy in the AD group. Second, it was clear that the degeneration in AD occurred in the anterior regions of the genu/rostrum, and posteriorly in the anterior and middle portions of the splenium. Third, it was shown that the anterior CC is subject to degeneration in VaD, with some tendency for a similar outcome in the MA group. The size of the anterior CC (rostrum/genu) for both of these groups was midway between that of the AD and control groups. Finally, while this same between-group pattern of CC size was also seen in posterior callosal regions, the effect here was only significant for the AD group.
Factor Analysis of Callosal Widths
Factor analysis of the 99-width measurements of the corpus callosum using our sample of patients with neurodegenerative disease and healthy older adults yielded a 10-factor solution. Thus, our factor analysis offered greater regional specificity as compared to previous callosal factor studies conducted with younger adults (Cowell et al., 1994; Peters et al., 2002). One would expect greater variability in callosal morphology in this sample due to both the thinning of the corpus callosum with age (which is particularly marked for the rostrum, anterior body, and splenium; Peterson et al., 2001) and changes to the CC in neurodegenerative disease. The specific form of atrophy of the CC in an individual with a dementing illness is likely to occur in a manner that is a reflection of the particular areas and degrees of cortical degeneration (Biegon et al., 1994). Accordingly, the CC's of the subjects of this study likely would have had increased morphological variability, which would be expected to result in greater sensitivity of the factor analysis to detect discreet pathways within the CC and therefore more factors than are typically seen in populations of younger, non-demented individuals. That is, the variety of patterns of cortical degeneration in dementing illness created a greater variety of forms of CC degeneration and thus permitted detection of more discrete callosal regions.
However, whether all 10 factors represent important differences in interhemispheric pathways cannot be determined from this form of analysis. The factor accounting for the least variance (W13-14; 1.39% of the variance) was also the smallest in area, constituted by only 2 widths. Thus, this factor may, in reality, have been a part of a region on either side. This region was significantly smaller in AD than controls, but this may not have been independent of the same difference found for the more anterior adjacent region (W2-12).
Callosal Atrophy in Alzheimer's Disease
A number of previous studies have found overall atrophy of the corpus callosum in AD (Biegon et al., 1994; Cuenod et al., 1993; Janowsky et al., 1996; Lyoo et al., 1997; Teipel et al., 1998; Vermersch et al., 1993). However, results from previous studies describing atrophy of specific CC regions in AD have varied from finding all regions significantly smaller than the control group (Janowsky et al., 1996), to finding either the anterior region (Biegon et al., 1994) or the posterior region (Lyoo et al., 1997) significantly smaller. Whereas it can be seen in Table 3 that all widths but one in our study are smaller in AD than controls, it is also quite clear that the differences are entirely negligible in the middle third of the CC (roughly W41-74). Statistically significant differences were clearly apparent in the rostrum/genu and the splenium (with the exception of W96-99, see comment below).
Considering that the parietal, temporal, and frontal lobes display the most cortical atrophy in AD (Binetti et al., 1996; Brun & Englund, 2002; Erkinjuntti et al., 1993; Jobst et al., 1992, 1994; Kesslak et al., 1991; Killiany et al., 1993; Murphy et al., 1993; Scott et al., 1991; Shear et al., 1995; Whitehouse et al., 1981), it would be expected that the CC pathways interconnecting these areas would evidence the most significant atrophy, which was the case in the results of this study. As can be seen in Figure 1D, the axonal pathways from the frontal cortex project through the genu region, while the pathways from the parietal cortex pass through the posterior regions of the isthmus and axons from the temporal cortex loop backward and pass through the anterior splenium (Pandya & Seltzer, 1986).
This study did not find that the entire splenium atrophies in AD; the most posterior region (W96-99) was not significantly smaller in the AD group when compared to the control group. This finding is reasonable when considering that the most posterior region of the splenium contains interhemispheric pathways between the occipital lobes (Pandya & Seltzer, 1986). The occipital lobes do not show notable cortical atrophy within the range of dementia severity manifest in the AD participants of this study. Thus, one would not expect that the callosal pathways between the occipital lobes would show significant atrophy.
CC Atrophy in Vascular Dementia
Statistically significant regional CC difference between the control group and VaD group was only noted in the anterior (rostrum/genu) region. For this region, the mean for the VaD group was very similar to the AD group, and the difference between these groups was not significant. Thus, anterior CC atrophy appeared to be very similar in these two forms of dementing illness. This result is consistent with previous studies of callosal size in VaD that found significant callosal atrophy in the anterior region (Lyoo et al., 1997; Yamanouchi et al., 1990).
Though mean CC size in posterior regions in VaD looked very similar to that seen in AD, comparison with the control group did not yield significant differences. Several factors may have accounted for the absence of statistical significance. First, this may have been because of differences in dementia severity, which were more severe in the AD sample as evident by a significantly lower mean MMSE score (see Table 1). Second, there were fewer participants in the VaD sample than the AD sample, thus decreasing statistical power with respect to controls. Finally, it may be that VaD has lesser impact on the posterior CC. In fact, Lyoo et al. (1997) and Yamanouchi et al. (1990) did not find statistically significant indication of atrophy in the posterior CC.
In summary, our results suggest that there is a similar regional pattern of callosal degeneration in VaD as occurs in AD. However, it is unclear whether the lesser degree of posterior CC atrophy in VaD as compared to the AD group was more attributable to statistical power, distinct disease processes, or dementia severity.
Callosal Atrophy in Mild Ambiguous Cognitive Impairment
For the MA group, regional callosal atrophy was not detectable. Overall callosal area in MA was smaller than in the control group, but the difference was not statistically significant. Generally, a pattern of callosal degeneration was evident in three of the same regions (W2-12, W13-14, and W89-95) that evidenced callosal atrophy in AD and VaD. There was a statistical trend (p = .05) for MA participants suggesting atrophy in the anterior region of the CC, similar to the pattern noted in AD and VaD participants. The lack of significance my have reflected reduced power, since the number of subjects in the MA group was only 28 while the AD (N = 78) and VaD (N = 53) groups were larger. Another possible reason for this outcome is the lesser severity of cognitive impairment in the MA group, suggesting that some of the individuals diagnosed with MA may have been at an earlier stage of degenerative disease.
Callosal Atrophy and Cortical Regions
Given the topographical organization of the corpus callosum, it has been suggested that a midsagittal view of the CC on MRI may be an indirect but sensitive index of cortical neuronal loss associated with degenerative dementia (Yamauchi et al., 2000). At least in some studies, a relationship between regional callosal atrophy and cortical degeneration has been noted in frontotemporal dementia, progressive supranuclear palsy, and corticobasal degeneration (Yamauchi et al., 1993, 1997, 1998, 2000; Kaufer et al., 1997). One limitation of the current study is that measures of gray matter volume in various cortical regions were not available for comparison with regional CC size. As such, it was not possible to examine whether callosal regions degenerated in relationship to loss of volume in cortical regions subserved. Despite this, patterns of regional callosal atrophy (anterior and posterior) were consistent with the expected regional cortical volume loss in dementia.
Callosal Atrophy and Cognitive Impairment
The lack of a comprehensive neuropsychological battery did not allow for a thorough investigation of structure-function correlates. However, the relationship between global mental status and callosal regions was explored. Specifically, step-wise multiple regression, removing the effects of age, revealed significant semipartial correlation between the anterior portion of the splenium (W75-88) and total MMSE score for all subjects. No other callosal region correlated significantly with global mental status in the regression. Previous studies investigating CC degeneration in Alzheimer's disease report either anterior (Biegon et al., 1994) or posterior (Lyoo et al., 1997) regional degeneration. Our findings suggest that posterior atrophy of the CC in Alzheimer's disease, the largest patient group within our sample, is likely to be more predictive of global mental status.
There are two possibilities regarding the relationship between callosal atrophy and the cognitive impairments of these individuals with dementia. First, it is possible that atrophy of the CC is entirely secondary with respect to their cognitive impairments. That is, the cognitive impairment may be entirely caused by degeneration of the temporal, parietal, and frontal cortical tissue giving rise to the particular callosal fibers. Therefore, reduced interhemispheric communication (presumably the implication of CC atrophy) would not appreciably contribute to the cognitive status of the individual. Alternatively, it is possible that at least some aspects of the cognitive impairments in these groups relates to reduced callosal size, and therefore to reduced interhemispheric interactions.
Neither correlations between regional CC size and areas of cortical degeneration, nor correlations between regional CC size and domains of cognitive impairment can differentiate between these possibilities. However, the cognitive outcome in individuals with congenital callosal absence (agenesis of the corpus callosum, or ACC) can at least suggest the domains of cognition that may be affected by the status of the CC. Studies of on neuropsychological and psychosocial outcomes in high-functioning (FSIQ > 80) individuals with ACC by Brown and colleagues (e.g., Brown & Paul, 2000) have suggested a syndrome of cognitive deficiencies in the following areas that are associated with callosal absence (described in detail in Badaruddin et al., 2007): interhemispheric transfer of complex sensory information and learning; bimanual motor coordination; complex novel problem-solving; comprehension of second-order meanings of language; speed of cognitive processing; and psychosocial understanding and behavior. Whereas there are many differences between ACC and dementing illnesses, it is not unreasonable to expect that degeneration of the CC in dementia would contribute to the outcome in these same cognitive domains. However, more work will be necessary to resolve this issue, perhaps work involving fMRI functional interhemispheric coherence during specific cognitive tasks in individuals with various forms of dementia.
ACKNOWLEDGMENTS
This research was supported in part by National Institutes of Health Grants AG-11380 and MH-14592 and the Ira Fulton Foundation. Patricia Cowell is gratefully acknowledged for providing us with a copy of KSS Stereology, and David Wright for rewriting the source code for a Java based application. Lastly, the technical assistance of Tracy J. Abildskov and the support of the entire Cache County, Utah, Memory and Aging research team are gratefully acknowledged.


