


Introduction
Poaching for their horn remains a significant threat to the five rhinoceros species (CITES, 2022), with broader adverse consequences for ecosystem health (Cromsigt & te Beest, Reference Cromsigt and te Beest2014), tourism (Lubbe et al., Reference Lubbe, du Preez, Douglas and Fairer-Wessels2019) and human well-being (through violent contacts between rangers and poachers; Duffy, Reference Duffy2014). Conservation practitioners, NGOs and governments have for decades invested in numerous strategies to tackle this threat, from militarized anti-poaching patrols and advanced technologies such as drones and detection cameras, to community-based conservation and demand reduction campaigns (Hilborn et al., Reference Hilborn, Arcese, Borner, Hando, Hopcraft and Loibooki2006; Challender & MacMillan, Reference Challender and MacMillan2014; t’Sas-Rolfes et al., Reference t’Sas-Rolfes, Challender, Hinsley, Veríssimo and Milner-Gulland2019).
Despite these efforts, poaching has continued at high rates in many source countries (CITES, 2022), including in the Greater Kruger region of South Africa (Eikelboom & Prins, Reference Eikelboom and Prins2024). This has led to an increasing number of protected areas implementing a drastic potential solution: dehorning (Chimes et al., Reference Chimes, Beytell, Muntifering, Kötting and Neville2022; Kuiper et al., Reference Kuiper, Hausmann, Whitfield, Polakow, Dreyer and Ferreira2025). Rather than increase the risk to poachers (like the dominant law enforcement interventions seek to do), dehorning acts by reducing the opportunity for and reward from poaching (Bulte & van Kooten, Reference Bulte and van Kooten1999; Lemieux, Reference Lemieux2014). Evidence is gathering for its notable effectiveness in reducing poaching (Kuiper et al., Reference Kuiper, Hausmann, Whitfield, Polakow, Dreyer and Ferreira2025). Dehorning is, however, seldom implemented in isolation and is most effective when combined with other interventions (Kuiper et al., Reference Kuiper, Hausmann, Whitfield, Polakow, Dreyer and Ferreira2025).
Dehorning is drastic and invasive, and it needs to be repeated as rhinoceros horn naturally regrows. Furthermore, dehorning can be costly and complicated to implement collaboratively across connected systems of private and state managed protected areas such as the Greater Kruger (Kuiper et al., Reference Kuiper, Hausmann, Whitfield, Polakow, Dreyer and Ferreira2025). Implementing dehorning effectively, especially in larger populations, requires a good understanding of rhinoceros distribution and behaviour as well as significant professional capacity (Duthé et al., Reference Duthé, Odendaal, Van der Westhuizen, Church, Naylor and Boshoff2023). In addition, anecdotal evidence suggests dehorning can be unpopular among tourists. Given these costs, complexities and trade-offs, dehorning remains a contested intervention. As such, there is a clear need for more research to guide conservation policy around dehorning. It is essential that conservation scientists seek to evaluate adverse effects of the intervention on rhinoceros reproduction, ecology and sociality.
Building on previous works on the impacts of dehorning on rhinoceros biology (Chimes et al., Reference Chimes, Beytell, Muntifering, Kötting and Neville2022; Duthé et al., Reference Duthé, Odendaal, Van der Westhuizen, Church, Naylor and Boshoff2023; Pfannerstill et al., Reference Pfannerstill, Härdtner, Maboga, Balkenhol, Bennitt and Scheumann2023), this study aimed to help inform conservation policy and debates around dehorning as an anti-poaching intervention. We used 11 years (2013–2023) of intensive monitoring data for rhinoceroses in Balule Nature Reserve, South Africa, to test whether individuals altered their spatial behaviour after dehorning.
We tested two hypotheses: (1) An individual will contract its home range after dehorning to minimize interactions with other rhinoceroses because its ability to defend its home range is compromised as a result of the lack of a horn (Berger & Cunningham, Reference Berger and Cunningham1998; Linklater & Hutcheson, Reference Linklater and Hutcheson2010; Duthé et al., Reference Duthé, Odendaal, Van der Westhuizen, Church, Naylor and Boshoff2023). (2) An individual will shift its home range to a new area after it has been dehorned because of a negative association with the dehorning event, or because of altered social dynamics with neighbouring rhinoceros individuals as per hypothesis 1.
To test these hypotheses, we used comparable location data before and after dehorning, balancing the length of time and number of data points in each period, and then measured changes in home range size and location. To provide context to this analysis, we present data on rhinoceros poaching rates before and after widespread dehorning in Balule.
Study area, rhinoceros population and dehorning
The privately managed 475km2 Balule Nature Reserve forms part of the Greater Kruger conservation landscape, along with several other private reserves and the state-managed Kruger National Park (Fig. 1). Balule lies entirely within the savannah biome and comprises a mixture of open savannah, open and closed woodlands, and riverine forest (Mucina & Rutherford, Reference Mucina and Rutherford2006). Precipitation is characteristic of semi-arid savannah and the mean annual rainfall is 441 mm (long-term reserve records). Two species of rhinoceros occur in this area: the black rhinoceros Diceros bicornis (categorized as Critically Endangered on the IUCN Red List; Emslie, Reference Emslie2020b) and the white rhinoceros Ceratotherium simum (categorized as Near Threatened; Emslie, Reference Emslie2020a). The population size of the black rhinoceros in Balule, based on intensive monitoring of known individuals, was 16 in 2017 (3.4 per 100 km2), increasing to 32 in 2023 (6.7 per 100 km2). The white rhinoceros population has remained stable during 2017–2023, at 50–60 individuals (10.5–12.6 per 100 km2). Widespread dehorning was implemented in Balule starting in April 2019, with maintenance dehorning approximately every 18 months (Fig. 2). A specialized veterinarian conducts the dehorning procedures, together with an operational team. The rhinoceros is sedated via a specialized dart gun, usually fired from a helicopter. After sedation, vital signs are monitored while the horns are painlessly removed, above the growth plate, using a chainsaw. An antidote is then administered to reverse sedation.
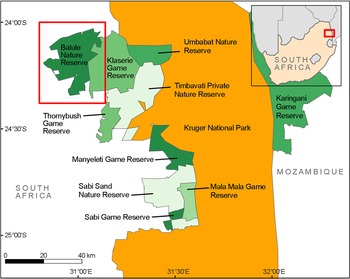
The location of Balule Nature Reserve in the Greater Kruger landscape (note there are no fences between reserves).

Fig. 1 Long description
The map illustrates the Greater Kruger landscape, highlighting the location of Balule Nature Reserve. The map includes various reserves and game reserves such as Klaserie, Umbabat, Timbavati, Thornybush, Manyeleti, Sabi Sand, Mala Mala, and Sabie Game Reserve. Kruger National Park is prominently featured in orange. The map also shows Karingani to the east. There are no fences between the reserves, indicating a connected wildlife habitat. The map uses different shades of green and orange to distinguish between the various reserves and the national park. The inset in the top right corner shows the location of the Greater Kruger landscape within South Africa.
For example individual rhinoceroses, (a) the method for computing any change in home range size before and after dehorning (notice the balanced samples for before and after), and (b) the method used to determine a home range shift after dehorning.
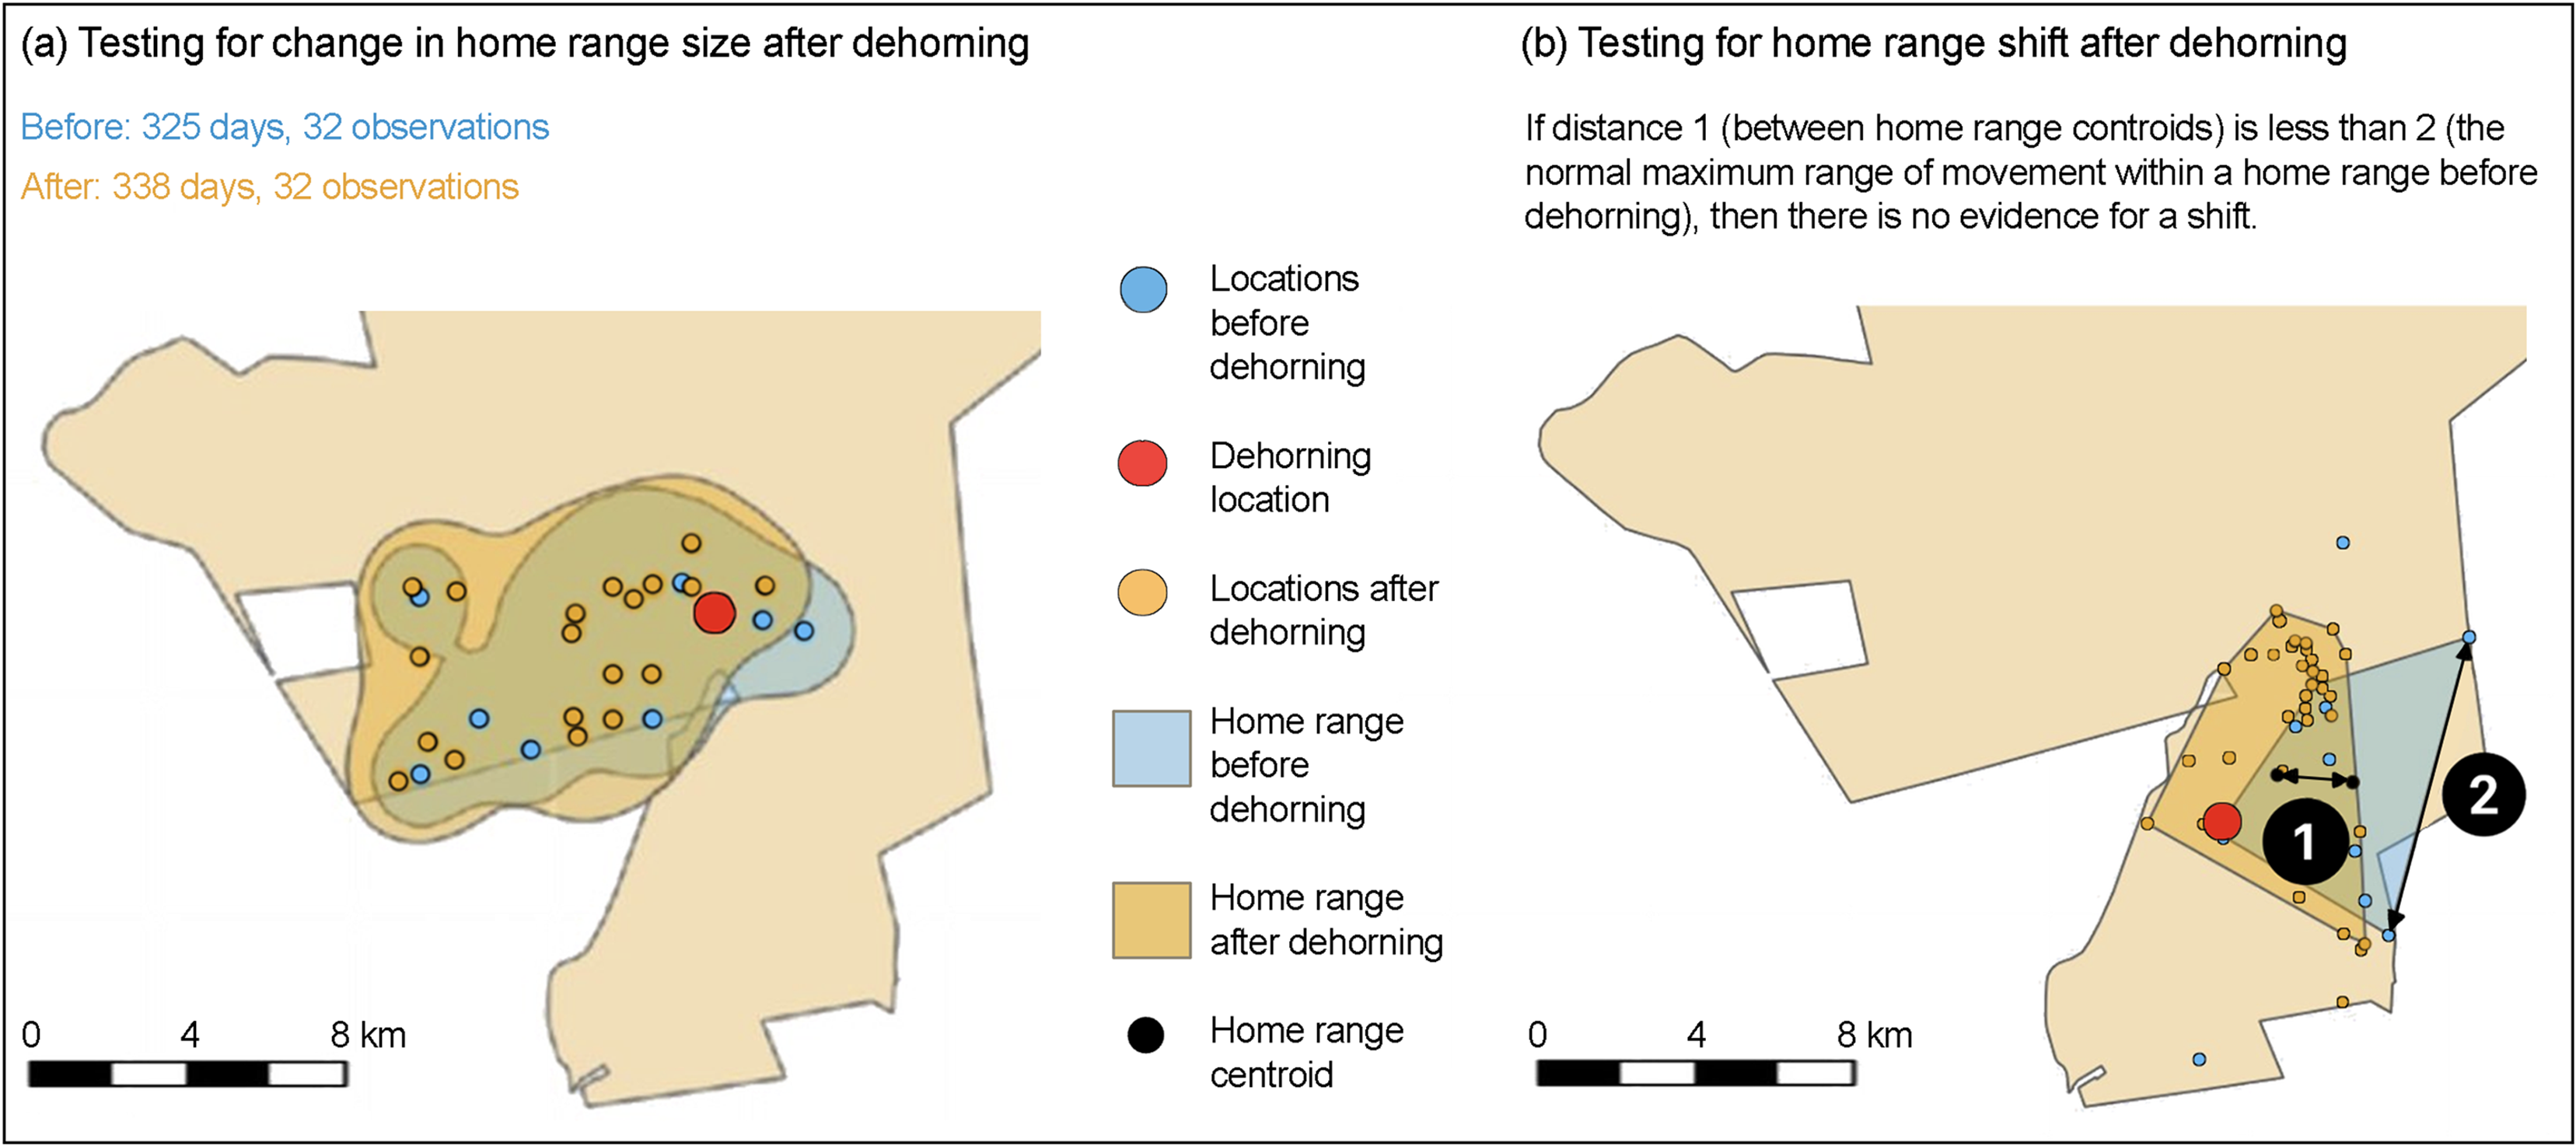
Fig. 2 Long description
The diagram consists of two parts. Part (a) illustrates the method for computing changes in home range size before and after dehorning. It shows locations before dehorning in blue, the dehorning location in red, and locations after dehorning in orange. The home range before dehorning is outlined in light blue, and the home range after dehorning is outlined in light orange. The home range centroid is marked with a black dot. Part (b) demonstrates the method used to determine a home range shift after dehorning. It compares the distance between home range centroids (distance 1) with the normal maximum range of movement within a home range before dehorning (distance 2). If distance 1 is less than distance 2, there is no evidence for a shift.
Methods
Rhinoceros monitoring and observational data
Rhinoceros location data consisted mainly of GPS locations of visual observations. Black rhinoceros individuals in Balule have been monitored closely since the reintroduction of 19 individuals in 2011, and are individually identifiable by ear notches (Barichievy et al., Reference Barichievy, Altwegg, Balfour, Brett, Gordon and Henry2021). Individual identity data for white rhinoceroses was more limited, as only a small number of white rhinoceroses were individually identifiable before dehorning, but most were identifiable and individually monitored after their first dehorning event, at which their ears were notched. Between 2020 and 2023, both species were individually and intensively monitored by a full-time rhinoceros monitor, mostly by direct observation from a vehicle but also by an array of camera traps (starting with three in 2018 and up to 760 in 2021), and from the air during aerial surveys. Black rhinoceros observations began in 2011 (when first introduced) and extended to May 2023, and white rhinoceros observations date from April 2019 (when dehorning was initiated, and white rhinoceroses were individually notched) to May 2023.
Rhinoceros dehorning and poaching data
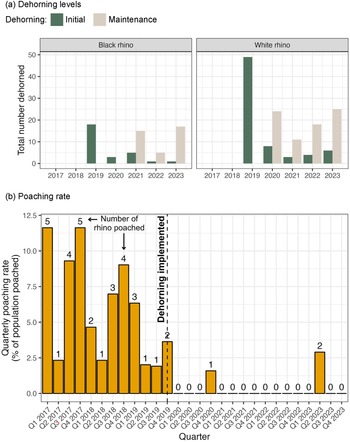
In addition, we present data on the number of black and white rhinoceroses dehorned each year (2017–2023) and the quarterly rhinoceros poaching rate before (2017–2019) and after (2019–2023) widespread dehorning was implemented in Balule (Fig. 2). These data were collated as part of a broader analysis that found dehorning resulted in abrupt reductions in poaching across numerous reserves in the Greater Kruger (Kuiper et al., Reference Kuiper, Hausmann, Whitfield, Polakow, Dreyer and Ferreira2025).
Home range analysis
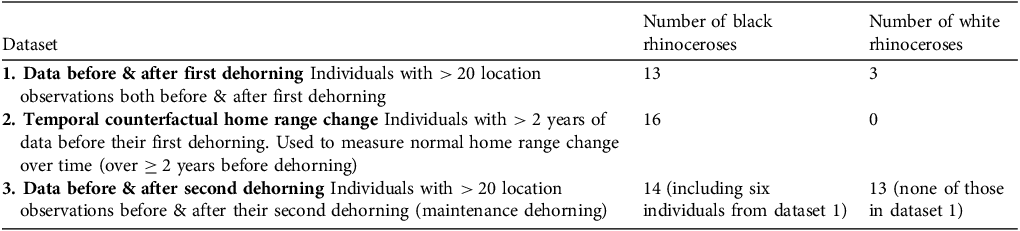
We divided location data into three datasets for each species for testing our hypotheses around change in space use in relation to dehorning (Table 1). We include a counterfactual data set in which we examine changes in home ranges over time in the absence of dehorning, to compare against changes observed before and after dehorning (also over time). This is important as home ranges may change naturally over time (for example, increasing in size as a rhinoceros ages; Plotz et al., Reference Plotz, Grecian, Kerley and Linklater2016), so any change in response to dehorning must be considered in light of this.
Categorizing individual black Diceros bicornis and white rhinoceroses Ceratotherium simum from Balule Nature Reserve, South Africa, into datasets based on the availability and quality of observational data before and after dehorning. Dataset 1 was the most valuable, with data before and after the first dehorning event; dataset 2 was less powerful as any behavioural effect may have occurred at the first dehorning.

Table 1 Long description
The table categorizes individual black and white rhinoceroses into three datasets based on the availability and quality of observational data before and after dehorning. Dataset 1 includes individuals with over 20 location observations both before and after their first dehorning, with 13 black rhinoceroses and 3 white rhinoceroses. Dataset 2 focuses on temporal counterfactual home range change, including Balule individuals with over 2 years of data before their first dehorning, with 16 black rhinoceroses and 0 white rhinoceroses. Dataset 3 includes individuals with over 20 location observations before and after their second dehorning, with 14 black rhinoceroses (including six individuals from dataset 1) and 13 white rhinoceroses (none of those in dataset 1). The table highlights the differences in the number of black and white rhinoceroses across the datasets and the specific criteria for each dataset.
To test hypothesis 1, we computed home range polygons with both 95% minimum convex polygon and kernel density estimate both before and after dehorning for each individual rhinoceros that had sufficient data (> 20 locations before and after dehorning; Table 1) and then computed the change in home range size (Fig. 2a). To ensure a fair comparison of home range sizes before and after dehorning, we ensured a balanced sample of data, such that both the number of observations and the length of time that the observations covered were similar (Fig. 2a). We did this by sampling randomly from the larger set (before or after) to match the number of observations in the smaller set, and then excluding further observations so that the time periods of the two sets were similar (within c. 10% of each other). We limited data to an 18-month period both before and after dehorning, to avoid including data that were distant in time from the dehorning event and therefore could include home range changes for reasons unrelated to dehorning. To test for significant differences in home range size after compared to before dehorning, we used a two-sample t-test after confirming normality and homogeneity of variance (Faraway, Reference Faraway2004). For the temporal counterfactual scenario (Table 1, Dataset 2), we split black rhinoceros location data from the period prior to the first dehorning into two consecutive 1-year periods and quantified change from the first to the second.
To test hypothesis 2, we first assumed that, had a home range shift occurred, the home range centroids before and after dehorning would be sufficiently distant from each other to be considered a shift. To quantify this, we compared the distance between the home range centroids before and after dehorning and compared this to the maximum width of the two home range polygons (Method 1 in Fig. 2b). If the inter-centroid distance is larger than the maximum width of the home range polygon, this indicates a shift in home range beyond the normal range of movement. This is a high threshold for shift detection, which we deemed appropriate given the higher variability associated with our generally small sample sizes, which could lead to false positives in shift detection.
Results
Initial dehorning (starting in April 2019) and ongoing maintenance dehorning were correlated with a large and abrupt reduction in poaching rates in Balule (Fig. 3).
Dehorning and poaching rates in Balule Nature Reserve, South Africa. (a) The number of individual black Diceros bicornis and white Ceratotherium simum rhinceroses dehorned each year (2017–2023), indicating both initial and maintenance dehornings (dehorning repeated on each individual c. every 18 months as the horn regrows). (b) The mean quarterly poaching rate and total number of rhinoceroses poached each quarter during 2017–2023.
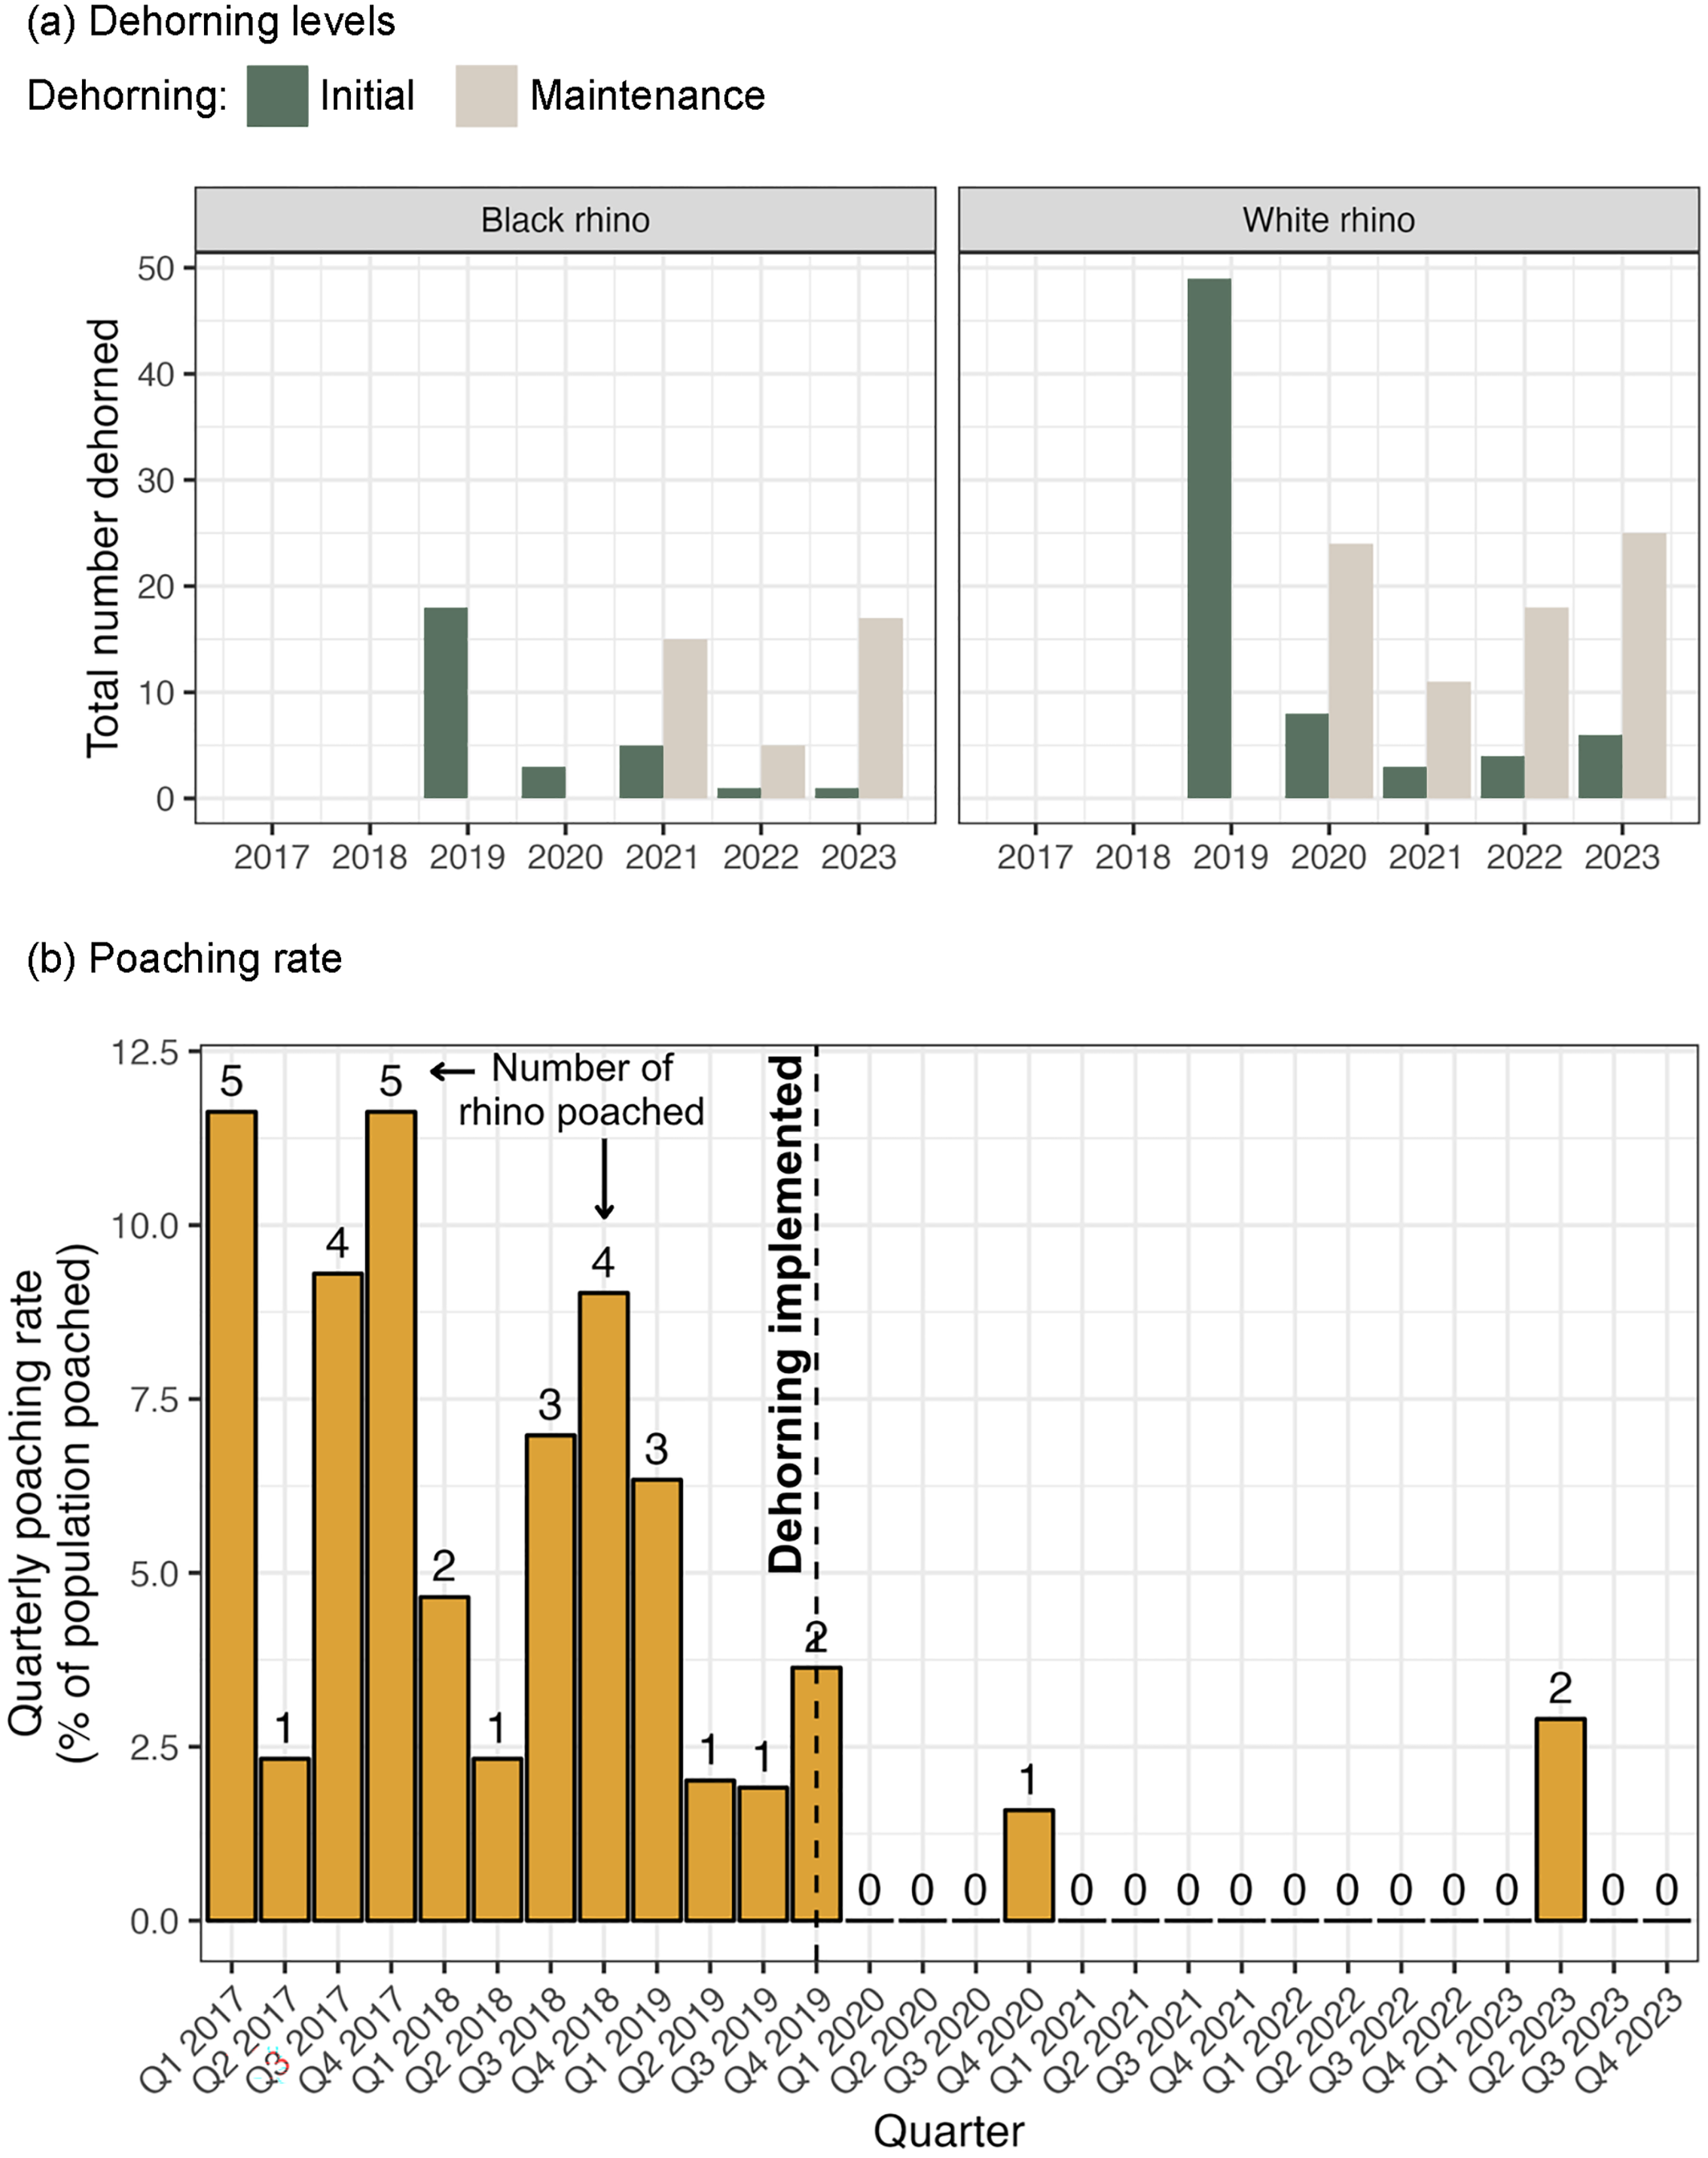
Fig. 3 Long description
The bar graph consists of two main sections: (a) Dehorning levels and (b) Poaching rate. Section (a) displays the total number of black and white rhinos dehorned each year, with separate bars for initial and maintenance dehorning. The x-axis represents the years from 2017 to 2023, and the y-axis represents the total number dehorned. For black rhinos, initial dehorning peaks in 2019 and maintenance dehorning shows fluctuations. For white rhinos, initial dehorning is highest in 2019, with maintenance dehorning showing a steady increase. Section (b) shows the quarterly poaching rate as a percentage of the population poached, with the number of rhinos poached indicated above each bar. The x-axis represents the quarters from Q1 2017 to Q4 2023, and the y-axis represents the quarterly poaching rate. The poaching rate is highest in Q1 2017 and Q4 2017, with a significant drop after the implementation of dehorning in Q2 2019. The color scheme uses green for initial dehorning, gray for maintenance dehorning, and yellow for poaching rates. All values are approximated.
Change in home range size after dehorning
Thirteen individual black rhinoceroses had sufficient (> 20 observations) and balanced observational data (similar number of days) before and after their first dehorning event. We found no evidence that there was a change in their home range sizes after dehorning, with individuals showing a mix of increases and reductions in range size, approximately centred around zero change (Fig. 4a, Fig. 5). The median change in home range size was an increase of 8% for kernel density estimate and a decrease of 3% for minimum convex polygon home range estimates, with wide variation around these medians (Fig. 4a). There was no significant difference in home range sizes after compared to before dehorning for either the kernel density estimate (t 26 = 0.07, P = 0.95) or minimum convex polygon (t 26 = 0.10, P = 0.92) home range method. The counterfactual dataset with > 2 years of data exclusively before dehorning for 16 black rhinoceros individuals showed a similar mix of increases and decreases in home range size over time (Fig. 4; average change overlaps zero). Given that home range sizes did not, on average, increase over time in the counterfactual scenario, the zero average change observed after dehorning is consistent with what one would expect in the absence of dehorning. Only three white rhinoceroses had robust data before and after their first dehorning; all three showed an increase in their home range size after dehorning (median 61% increase; Supplementary Fig. 1).
(a) Box plots showing the change in home range size (using the 95% kernel density estimate (KDE) and 95% minimum convex polygon (MCP) methods) for 13 black rhinoceroses with robust and comparable data before and after their first dehorning event, expressed as per cent change and absolute change. (b) The change in home range size over time before the first dehorning event among 16 black rhinoceroses (temporal counterfactual; see Methods). (c) As in (a), but for 14 black and 13 white rhinoceroses after their second dehorning. Boxes represent the interquartile range, and the black horizontal lines the median. Note the different y-axis scales.

Fig. 4 Long description
The box-and-whisker plot illustrates the change in home range size for 13 black rhinoceroses after their first dehorning. The plot includes two sets of vertical box plots: one for percentage change and one for absolute change. Each set contains two box plots representing the 95% kernel density estimate (KDE) and the 95% minimum convex polygon (MCP) methods. The x-axis labels are 95% KDE and 95% MCP, while the y-axis for the percentage change plot ranges from -50 to 100 percent change in home range size, and the y-axis for the absolute change plot ranges from -50 to 50 square kilometers. The median, lower quartile (Q1), and upper quartile (Q3) are marked within each box, with whiskers extending to the minimum and maximum values. Outliers are depicted as individual points outside the whiskers. The data shows a mix of increases and reductions in range size, approximately centered around zero change. All values are approximated.
The size and location of the home ranges of the 13 individual black rhinoceroses with sufficient and balanced data before and after their first dehorning event, calculated with the 95% kernel density estimate method. Days indicate the period over which each home range was determined, with the number of observations (obs.) from which the home range was calculated also indicated.

Fig. 5 Long description
The image contains 13 diagrams showing the size and location of home ranges for individual black rhinoceroses before and after their first dehorning event. Each diagram includes data on the range of dates and the number of observations used to calculate the home ranges. The diagrams use color-coded locations and home range areas to indicate changes before and after dehorning. The scale bar in each diagram represents 8 kilometers.
For both species, we found no evidence for a change in individual home range sizes in relation to the second dehorning event, with spread of increases and decreases in home range size after dehorning centred around zero (Fig. 4b). For both species and regardless of home range method (minimum convex polygon or kernel density estimate), we failed to detect any significant difference in home range size after vs before the second dehorning event (P > 0.05). The lack of any consistent change in home range size after the second dehorning is evident visually in the form of kernel density estimate home range polygons for black and white rhinoceroses before and after their second dehorning (Supplementary Figs 2 & 3).
For black rhinoceroses, we checked whether the pattern of individuals increasing or decreasing their home range size was systematically related to the age or sex of the rhinoceros. If this were the case, it could be masking any dehorning effects on home range size. However, there was a mix of ages and sexes among both the individuals increasing their home range over time, and those decreasing their home range size (Supplementary Table 1).
Home range shift after dehorning
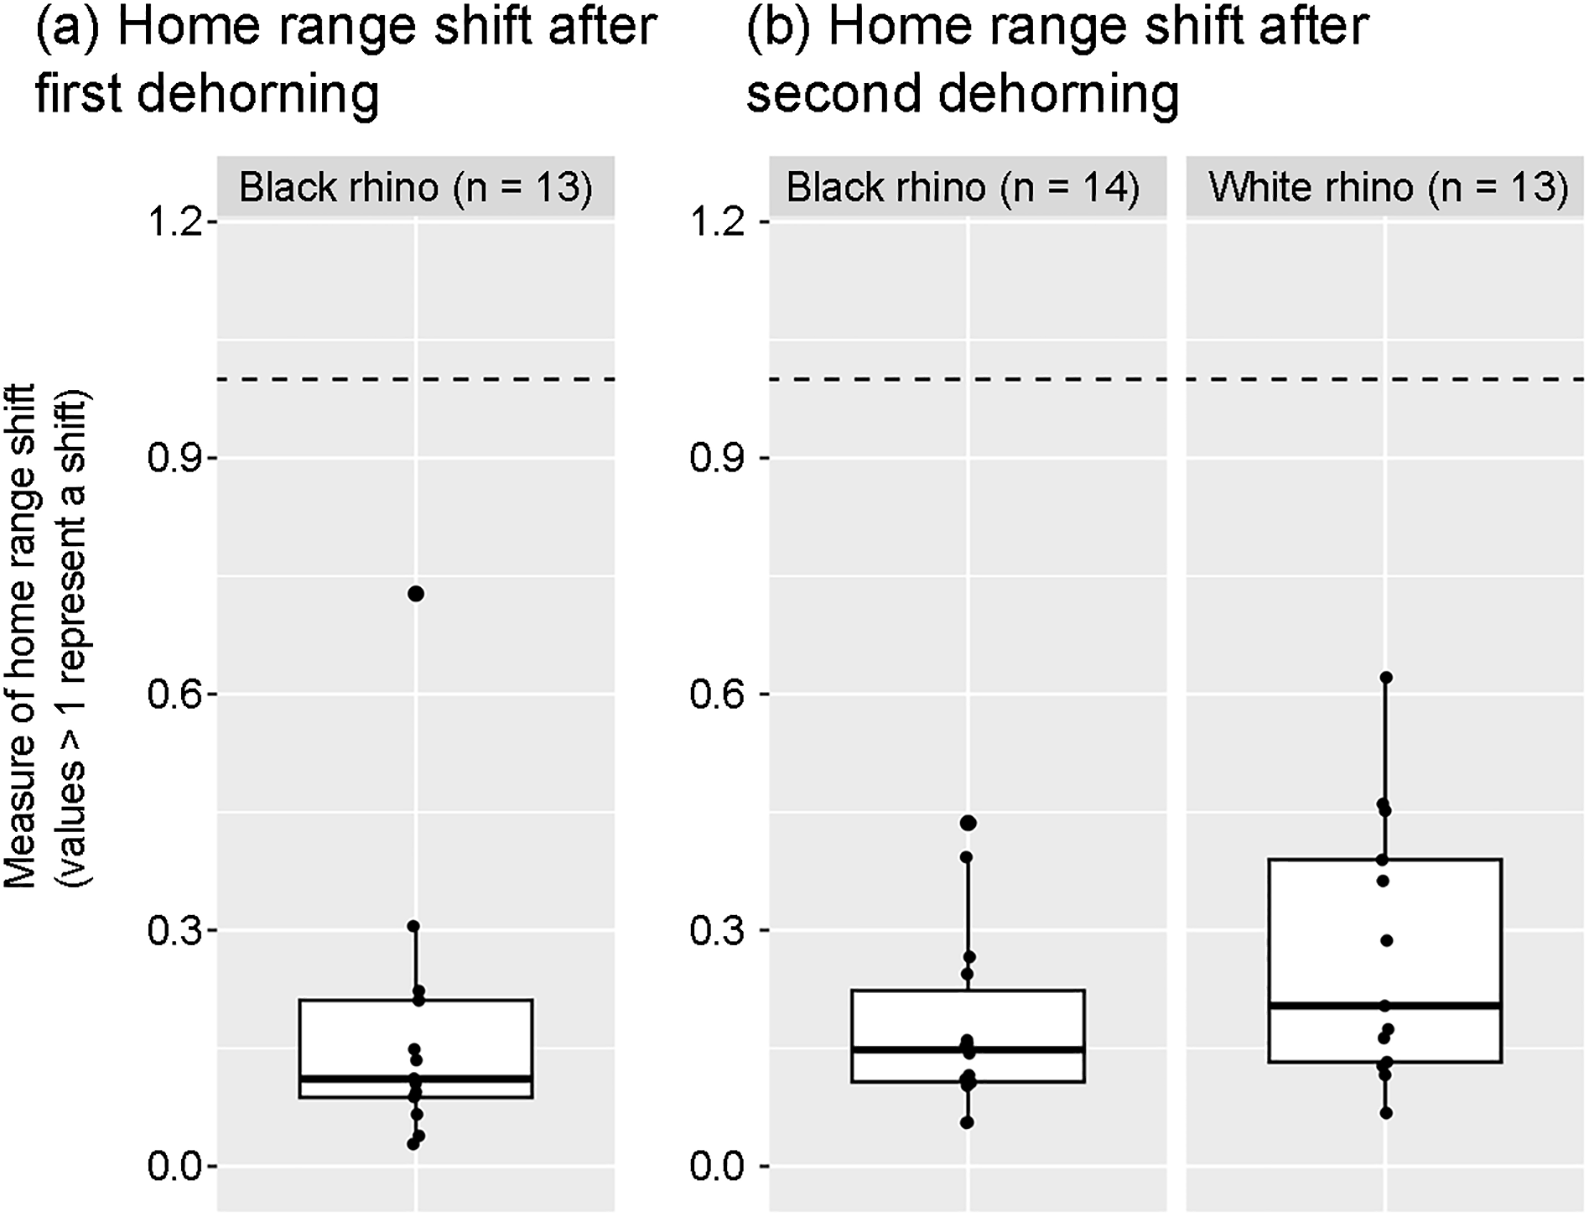
We found no evidence that black rhinoceroses shifted their home ranges in response to their first dehorning: the median distance between the centroids of home ranges before and after dehorning was 0.70 km for (8% of the median home range width). For both black white rhinoceroses we found no evidence for a home range shift after their second dehorning (Fig. 6b).
(a) Box plots showing the home range shifts before and after dehorning for 13 black rhinoceroses that had adequate and balanced data (data were only available for three white rhinoceroses), and (b) the same information for both black and white rhinoceroses after their second dehorning. Boxes represent the interquartile range, and the black horizontal lines the median. Values lower than 1 indicate no shift in home range: specifically, that the home range centroids before and after dehorning were closer to each other than the normal range of movement (see Methods for details).

Fig. 6 Long description
The image contains two box-and-whisker plots comparing home range shifts for black and white rhinoceroses after dehorning. The first plot (a) shows data for 13 black rhinoceroses after their first dehorning, while the second plot (b) shows data for 14 black rhinoceroses and 13 white rhinoceroses after their second dehorning. The y-axis measures home range shift, with values greater than 1 indicating a shift. The x-axis labels the species: black rhinoceros and white rhinoceros. Each box plot displays the median, upper quartile, lower quartile, and outliers. In plot (a), the black rhinoceroses show a median home range shift below 0.3, with some outliers reaching up to 1.2. In plot (b), both black and white rhinoceroses show similar median shifts below 0.3, with outliers extending up to 0.75 . The dashed line at 1 indicates no shift in home range. All values are approximated.
Discussion
Across various data sets of black and white rhinceros observations before and after dehorning, and across various metrics of home range change, we found no evidence that either species altered their ranging behaviour in response to dehorning. Our findings contrast with those of Duthé et al. (Reference Duthé, Odendaal, Van der Westhuizen, Church, Naylor and Boshoff2023), who analysed > 15 years of observations of black rhinoceroses across 10 South African reserves, finding that individuals reduced their home range size by an average of 45% in response to dehorning and were c. 37% less likely to engage in social interactions. The authors suggest these effects may be because the horns are used for self-defence and signalling of social status, and so dehorned individuals may retreat into smaller areas to avoid confrontations with conspecifics (Berger & Cunningham, Reference Berger and Cunningham1998; Linklater & Hutcheson, Reference Linklater and Hutcheson2010; Duthé et al., Reference Duthé, Odendaal, Van der Westhuizen, Church, Naylor and Boshoff2023). Black rhinoceroses are solitary, with the home ranges of both sexes determined by resource availability and social/territorial interactions between and within sexes (Lent & Fike, Reference Lent and Fike2003; Plotz et al., Reference Plotz, Grecian, Kerley and Linklater2016; Duthé et al., Reference Duthé, Odendaal, Van der Westhuizen, Church, Naylor and Boshoff2023).
A key factor explaining why we did not observe any of these effects may be the different habitat types and contexts. Firstly, the reserves analysed by Duthé et al. (Reference Duthé, Odendaal, Van der Westhuizen, Church, Naylor and Boshoff2023), all of which are in the KwaZulu Natal province of South Africa, are notably smaller (42–340 km2) than Balule (475 km2). Balule is also part of a much larger open system (the Greater Kruger), with free movement of rhinoceroses across a landscape > 20,000 km2. Secondly, although both Balule and the 10 reserves included in Duthé et al. (Reference Duthé, Odendaal, Van der Westhuizen, Church, Naylor and Boshoff2023) are in the savannah biome, the vegetation productivity and herbivore densities in the latter KwaZulu Natal region tend to be higher than in the semi-arid Greater Kruger because of differing rainfall and soils (Gertenbach, Reference Gertenbach1983; Mucina & Rutherford, Reference Mucina and Rutherford2006; MacFadyen et al., Reference MacFadyen, Hui, Verburg and Van Teeffelen2016; Cromsigt et al., Reference Cromsigt, Archibald and Owen-Smith2017). Rhinoceroses in this region may thus be better able to reduce their home ranges for social reasons, while still being able to access adequate resources, compared to more arid regions where rhinoceroses may need to cover wider areas to access sufficient resources.
The latter point may partly explain why the density of the black rhinoceros in Balule (3–6 individuals per 100 km2) is notably lower than rhinoceros densities in the reserves studied by Duthé et al. (Reference Duthé, Odendaal, Van der Westhuizen, Church, Naylor and Boshoff2023; up to 20 individuals per 100 km2). The lower densities in Balule may also be explained by the fact that the black rhinoceros was introduced only in 2011 (19 individuals), and their numbers have been increasing since then (up to 32 individuals in 2023), suggesting space and resources are not yet limiting. In addition, although Duthé et al. (Reference Duthé, Odendaal, Van der Westhuizen, Church, Naylor and Boshoff2023) found decreases in home range size on average, data from one of the 10 reserves analysed showed an average increase in home range size after dehorning, and two showed no significant change. Considering these three reserves and our results together, it is apparent that the responses of black rhinoceroses to dehorning is context-specific.
Studies on the behavioural responses of the white rhinoceros to dehorning are also limited. Pfannerstill et al. (Reference Pfannerstill, Härdtner, Maboga, Balkenhol, Bennitt and Scheumann2023) observed no difference between horned and dehorned individuals in various feeding, resting and social avoidance behaviours, and Penny et al. (Reference Penny, Withey, White, Scott, MacTavish and Pernetta2022) found that dominance hierarchies within a small group of subadult white rhinoceroses became less pronounced after dehorning. Our study is the first that we are aware of to test the effects of dehorning on white rhinoceros space use. The white rhinoceros is more gregarious than the black rhinoceros, with subadult and adult individuals often congregating in small groups that may be temporary or more persistent (Shrader & Owen-Smith, Reference Shrader and Owen-Smith2002; Pfannerstill & Maboga, Reference Pfannerstill and Maboga2021). The lack of home range change in response to dehorning amongst white rhinoceroses may partly be explained by this gregariousness counterbalancing the inclination to retreat into the home range core to minimize social interactions after dehorning (as observed by Duthé et al., Reference Duthé, Odendaal, Van der Westhuizen, Church, Naylor and Boshoff2023, for the black rhinoceros). This absence of a home range response, despite occurring at higher densities compared to the black rhinoceros in Balule (10–12 individuals per 100 km2 for the white rhinoceros vs 3–6 per 100 km2 for the black rhinoceros during the study), suggests that higher densities may not exacerbate the reduced home range effect as is suggested to be the case for black rhinoceroses. However, white rhinoceroses can thrive at densities of up to 30 per km2 in good habitat (Balfour et al., Reference Balfour, Shaw, Emslie, le Roex and Rusch2019).
Our study had several limitations. Firstly, data for white rhinoceroses were not available before their first dehorning, so our ability to detect responses to dehorning was limited to testing changes in home range size after the second dehorning. Secondly, the number of observations per individual was low for both species (< 200 observations for most individuals), so that only a small subset of black and white rhinoceros individuals had sufficiently robust data for estimating home range sizes. Also, given the limited data before dehorning, we were only able to construct a limited counterfactual (no dehorning) subset of 16 individuals for black rhinoceroses, and none for the white rhinoceros. Nonetheless, our results add to the growing research on the effects of dehorning on rhinoceros behaviour, which will allow for generalizations to be made collectively across studies.
Application to conservation policy
Although our analysis focused on the side effects of a single intervention to protect two related species, it is relevant to debates around effective and just approaches to protecting high-value species from international trade. In particular, dehorning represents a departure from a strong focus on law enforcement (e.g. militarized anti-poaching patrols, advanced surveillance technologies and intelligence investigations), which has dominated global funding to curb the illegal wildlife trade (Challender & MacMillan, Reference Challender and MacMillan2014; World Bank, 2016).
In Africa and Asia, law enforcement has similarly dominated approaches to protecting rhinoceroses (Paudel et al., Reference Paudel, Potter and Phelps2020; CITES, 2022; Kuiper et al., Reference Kuiper, Hausmann, Whitfield, Polakow, Dreyer and Ferreira2025). Increasingly, however, the effectiveness and justice of such approaches are being questioned (Duffy, Reference Duffy2014; Masse & Margulies, Reference Masse and Margulies2020). Dehorning offers a radically different approach that seeks to reduce opportunities and motivations for crime rather than deter crime though punishment (Lemieux, Reference Lemieux2014). Although the removal of valued body parts may not be applicable to other species that are illegally traded in other regions, the contrast between opportunity reduction to reduce wildlife crime versus increasing punitive measures is widely generalizable. However, dehorning without other security measures may be insufficient as poachers will likely still target horn stumps remaining after dehorning (lower reward) if the risks are also low (reduced security measures). Whatever the approach, the unintended consequences of conservation interventions must be assessed, akin to research in climate change adaptation that suggests well-meaning interventions can make current threats more severe or even introduce new risks (Simpson et al., Reference Simpson, Mach, Constable, Hess, Hogarth and Howden2021).
A question for policy makers is whether the social side effects of law enforcement (such as possible alienation of local communities, or rangers and poachers losing their lives in armed altercations; Biggs et al., Reference Biggs, Cooney, Roe, Dublin, Allan, Challender and Skinner2016; Galliers et al., Reference Galliers, Cole, Singh, Ohlfs, Aisha and Benoit Koutoua2022) are comparable to the potential biological side effects of dehorning for rhinoceroses. Research into the effectiveness and behavioural side effects of dehorning, to guide conservation policy around rhinoceros protection, is of particular importance as dehorning is costly to implement (Kuiper et al., Reference Kuiper, Hausmann, Whitfield, Polakow, Dreyer and Ferreira2025), requires significant specialist expertise (Duthé et al., Reference Duthé, Odendaal, Van der Westhuizen, Church, Naylor and Boshoff2023), and needs to be repeated for individuals every 1–2 years (Lindsey & Taylor, Reference Lindsey and Taylor2011). Our results support growing evidence that well-managed dehorning is less disruptive to rhinoceros biology, welfare and conservation than the high poaching rates that are likely to persist in the absence of dehorning (Nhleko et al., Reference Nhleko, Ahrens, Ferreira and McCleery2022).
Supplementary material
The supplementary material for this article is available at doi.org/10.1017/S0030605325101981
Author contributions
Conceptualization, TK, IN; data collection: MA, ZH; analysis: TK; writing: TK; revision: IN, ZH, MA.
Acknowledgements
We thank the conservation staff of Balule Nature Reserve for their efforts in protecting black and white rhinoceroses on the reserve and for their contribution of observational data to this project. TK was supported by a National Research Foundation Postdoctoral fellowship during this research (UID: 132725).
Conflicts of interest
None.
Ethical standards
This research abided by the Oryx guidelines on ethical standards. No human subjects were involved in this research. Veterinarian work conducted during the collaring and dehorning of rhinoceros individuals in Balule complied with the highest standards for animal safety, in accordance with ethical standards stipulated by the South African Veterinary Council (Government gazette, No. 39380, November 2015).
Data availability
The rhinoceros location data are highly sensitive given the poaching risk and are protected by a non-disclosure agreement. The visual representation of the data in the figures included in this article has been judged to be sufficiently secure.




 Open access

