

INTRODUCTION
Antarctic ice sheet dynamics and sensitivity to climate change is of current interest because Antarctica's ice sheets could raise sea level by several meters over timescales of a few centuries (Joughin and Alley, Reference Joughin and Alley2011). Mass is discharged from the land-based part of Antarctica into ice shelves through glaciers and ice streams (e.g., Bentley and others, Reference Bentley1979; Bindschadler and others, Reference Bindschadler2011; Rignot and others, Reference Rignot, Mouginot and Scheuchl2011). Buttressing from these ice shelves influences the rate at which mass is discharged from the ice sheet (e.g., DuPont and Alley, Reference Dupont and Alley2005; Fürst and others, Reference Fürst2016). Ocean tides induce stress perturbations that influence the vertical and horizontal motion of ice sheets near their marine margins (Padman and others, Reference Padman, Siegfried and Fricker2018). For example, flow speeds near the grounding zone of the Ross Ice Shelf have a predominately diurnal modulation that is similar to the dominant frequency of the Ross Sea tides (Anandakrishnan and others, Reference Anandakrishnan, Voigt, Alley and King2003; Marsh and others, Reference Marsh, Rack, Golledge, Lawson and Floricioiu2014). In contrast, near the grounding zone of Rutford Ice Stream on the Ronne Ice Shelf, where the ocean tides are predominantly semi-diurnal, the velocity response is strongest at fortnightly periods (Gudmundsson, Reference Gudmundsson2007). Models used to explain this diverse behavior include non-linear basal sliding (Gudmundsson, Reference Gudmundsson2007; Walker and others, Reference Walker2013; Lipovsky and Dunham, Reference Lipovsky and Dunham2017), hydrologic feedbacks (Rosier and others, Reference Rosier and Gudmundsson2016) and variable grounding throughout the tidal cycle (Robel and others, Reference Robel, Tsai, Minchew and Simons2017).
Failure of near-surface crevasses is a dominant source of seismic activity near grounding zones (e.g., Barruol and others, Reference Barruol2013) and tidal modulation of velocity has the potential to induce seismic activity through influencing horizontal and vertical strain rates (Anandakrishnan and Alley, Reference Anandakrishnan and Alley1997). Previous work has shown that falling tides correspond with peak seismicity due to brittle failure and changes in strain rate. For example, on Bowdoin Glacier in Greenland, seismicity located a few kilometers upstream of the grounding zone also peaks on falling tides when extensional strain rates are highest (Podolskiy and others, Reference Podolskiy2016). Likewise, near-surface extensional stress near the grounding zone peaks during falling tides as a result of ice-shelf flexure (Barruol and others, Reference Barruol2013; Hulbe and others, Reference Hulbe2016; Lombardi and others, Reference Lombardi2016). Flow speed and seismicity are both sensitive to tidal perturbations, which makes it possible for simultaneous geodetic and seismic observations to elucidate the mechanical behavior of ice shelves near grounding zones.
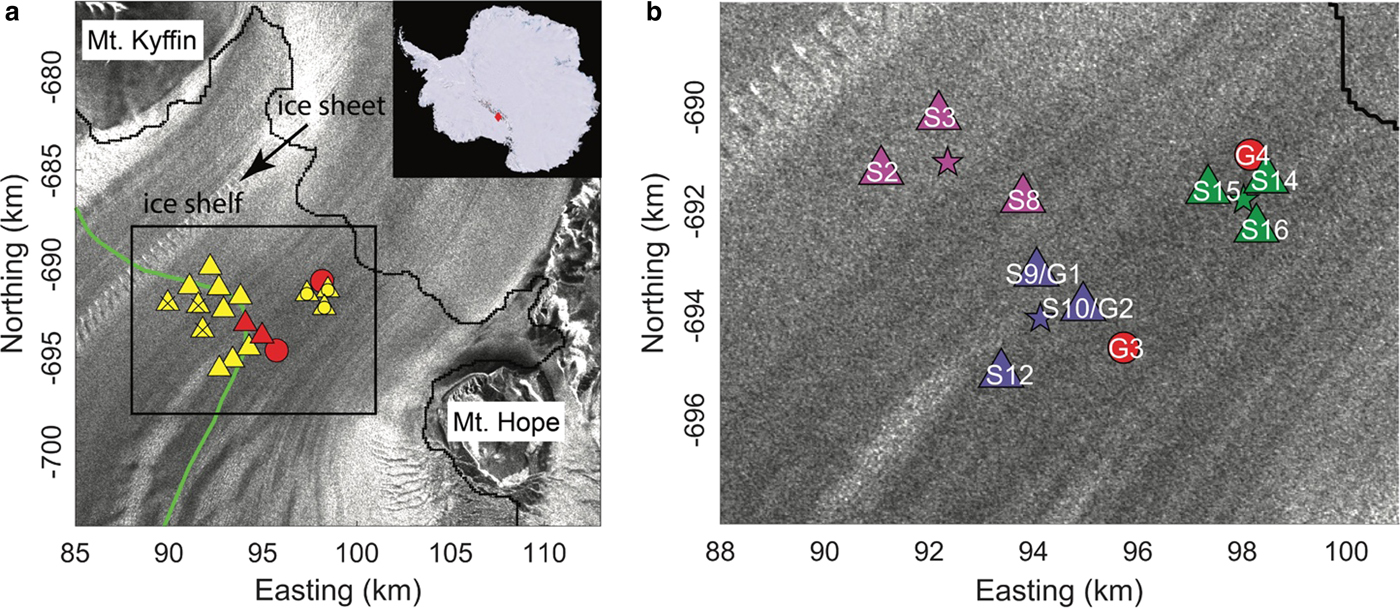
Beardmore Glacier is a major outlet glacier that transports ice from the East Antarctic Ice Sheet through the Transantarctic Mountains into the Ross Ice Shelf. It drains a catchment area of ~90 000 km2 and reaches surface speeds of ~400 m a−1 near the grounding zone (Rignot and others, Reference Rignot, Mouginot and Scheuchl2011; Marsh and others, Reference Marsh, Rack, Golledge, Lawson and Floricioiu2014). After Beardmore Glacier crosses the grounding zone, it is constrained by Mount Hope and Mount Kyffin (Fig. 1). Flow speed is modulated by the diurnal Ross Sea tides with peak velocities occurring during falling tides (Marsh and others, Reference Marsh, Rack, Golledge, Lawson and Floricioiu2014). We combine geodetic and passive seismic observations that were collected simultaneously at the Beardmore Glacier grounding zone. Our geodetic observations show a spatially variable response of both vertical and horizontal motions in response to tidal forcing. Seismic activity also exhibits spatio-temporal variability that can be linked to tidal forcing of ice-shelf deformation.
Study area and station locations, black line is 2004 MOA grounding line (Haran and others, Reference Haran, Bohlander, Scambos, Painter and Fahnestock2005). (a) Yellow triangles denote seismic-station locations and red circles denote GPS station locations. Stations marked with ‘×’ were moved to locations marked with ‘o’ on 30 December. Two GPS stations were located near seismometers and their locations are combined as red triangles. Green line is the freely-floating boundary, or ‘hydrostatic line’ (Bindschadler and others, Reference Bindschadler2011). (b) Zoom of black box in (a), showing station locations in subarrays; seismometers denoted by ‘S-’; GPS stations denoted by ‘G-’. Array A1 (S2, S3, S8) is marked in pink, A2 (S9, S10, S12) in purple and A3 (S14, S15, S16) in green, with subarray centers marked by stars. Background image is the Radarsat Antarctic Mapping Project (RAMP) mosaic (Jezek and others, Reference Jezek, Curlander, Carsey, Wales and Barry2013).
DATA AND METHODS
Satellite-derived estimates of average velocity and longitudinal strain rate
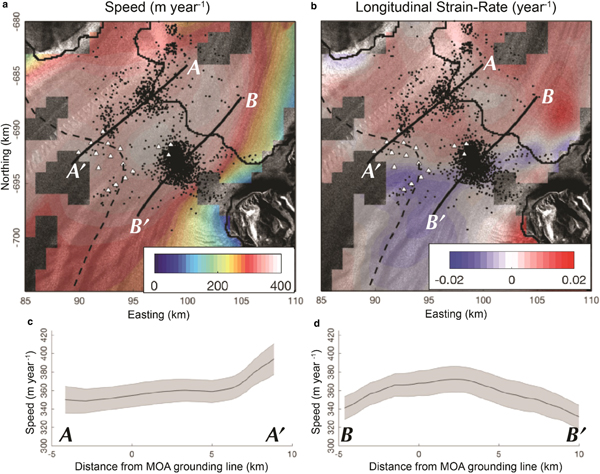
To provide insight into the spatial structure of glacial behavior of the study region, we use a 2008–2009 annual velocity mosaic derived from the NASA Making Earth System Data Records for Use in Research Environments (MEaSURES) Interferometric Synthetic Aperature Radar (InSAR) data (Mouginot and others, Reference Mouginot, Rignot, Scheuchl and Millan2017) (Fig. 2a). We use this velocity field to calculate the spatial distribution of longitudinal strain rates using the methods and codes of Alley and others (Reference Alley2018) (Fig. 2b). While a spatially continuous mosaic comprised of data from several epochs is available, artifacts from mosaicking proved it to be unsuitable for the calculation of strain rates in our study region. For calculation of strain, we use a length scale of 4 km (several ice thickness) that is a compromise between noise suppression and resolution. Additionally, prior to calculating strain rates, we remove all pixels for which velocity errors exceed 25 m a−1.
(a) Ice speed from MEaSUREs (Mouginot and others, Reference Mouginot, Rignot, Scheuchl and Millan2017). (b) Longitudinal strain rates (Alley and others, Reference Alley2018). In both (a) and (b) well-located event epicenters are black dots, station locations are indicated by white transects, solid black line is 2004 MOA grounding line (Haran and others, Reference Haran, Bohlander, Scambos, Painter and Fahnestock2005), dashed black line is ASAID hydrostatic line (Bindschadler and others, Reference Bindschadler2011). (c) and (d) show velocity transects along profiles in (a) and (b) with error from MEaSUREs in grey.

GPS stations
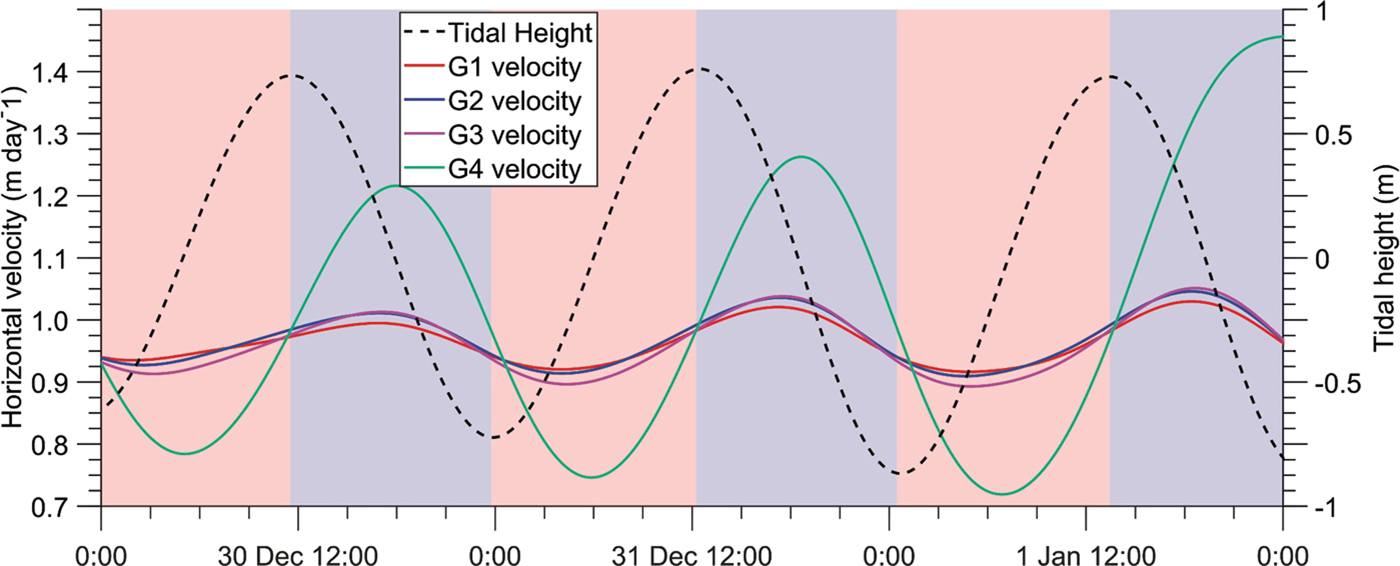
We deployed a network of four GPS stations to monitor ice motion from 16 December 2013 to 7 January 2014. The network consisted of geodetic Trimble NetR9 receivers deployed 2–7 km downstream of the grounding line with each antenna affixed to a ~1.5 m metal conduit. Three stations were spaced ~1 km apart, in a line perpendicular to flow. The fourth station was located ~5 km upstream from this line (Fig. 1). Station positions were calculated using Precise Point Positioning methods (PPP; Zumberge and others, Reference Zumberge, Heftin, Jefferson, Watkins and Webb1997) with the Natural Resource Canada's Canadian Spatial Reference System (CSRS-PPP) web service. We examined both horizontal and vertical positions of these GPS stations over time to determine ice-shelf response to tidal velocity. Vertical motion is assumed to be due to tidal motion, and one GPS station was used to define the tidal range. Horizontal and vertical motions were calculated from the time series of positions smoothed using a 1 d low-pass Butterworth filter (Fig. 3).
Tidal variation in horizontal velocity measured by GPS stations. Tidal height is estimated from the vertical motion of station G2. Stations move slower during rising tides (shaded in red), and faster during falling tides (shaded in blue).
Passive seismic observations and seismicity
At the same time period of the geodetic observations, we recorded seismic data from 13 passive seismic stations arranged in two geometries; the first operating for 14 d (16 December–30 December 2013) and the second operating for the remaining 8 d (31 December 2013–7 January 2014). The design and geometry of these arrays were constrained by the heavily crevassed surface of the study region. Trillium 120 Q/QA broadband seismometers connected to Trimble REFTEK data loggers sampling at 500 Hz were used for seismic data collection. The first set up was a tightly spaced rectangle ~6 km downstream from the grounding line, and the second set up was designed by moving three stations to an area ~5 km from the first rectangle, within 2 km of the grounding line (Fig. 1). Station spacing was ~1 km, which is the approximate ice thickness in this region (Fretwell and others, Reference Fretwell2013).
Events recorded by the array typically had particle motions that indicate predominately Rayleigh surface waves. These characteristics are indicative of shallow sources, most likely generated by fracturing associated with near-surface crevasses (Deichmann and others, Reference Deichmann2000; Mikesell and others, Reference Mikesell2012). All data were bandpass filtered between 3 and 15 Hz, the dominant frequency range of seismic events recorded by the network. We then generate a catalogue of seismic events using the short-term average moving window divided by the long-term average moving window (Allen, Reference Allen1978) (Fig. 4). We used a 2 s short-term and 120 s long-term average window. Event start times were selected when the short-term average divided by the long-term average value exceeded 2.7, and event termination was defined to be when the ratio fell below 1.7. This high termination ratio minimizes counting multiple events occurring close together as a single event.
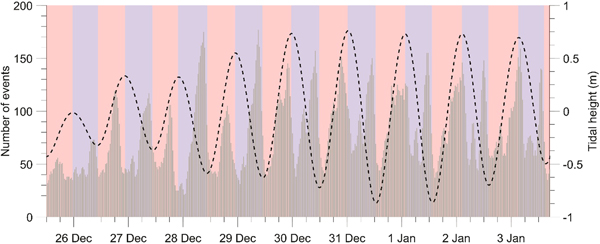
Temporal pattern of seismicity, displayed in 30 min bins using a 3 h moving average. Rising tide is highlighted in red, falling tide in blue. Tidal height is estimated from the vertical motion of station G2.

Event location
The lack of well-defined body waves for most events recorded by the network made it difficult to use a traditional seismic-event-location method, such as travel-time inversion of well-picked seismic phases (i.e., P and/or S waves). For a given event, however, waveforms exhibit similarity at neighboring stations (Figs 5a–c), which allows the use of the beamforming method to estimate event locations (e.g., Rost and Thomas, Reference Rost and Thomas2002; Winberry and others, Reference Winberry, Anandakrishnan and Alley2009; Richardson and others, Reference Richardson, Waite, FitzGerald and Pennington2010; Köhler and others, Reference Köhler2016). We estimated the source-direction and propagation speed of an incoming wave by calculating waveform coherency after iteratively shifting each waveform in the time domain by the time lags associated with a range of slowness values (slowness is defined as the inverse of velocity) and azimuths. If an event is well recorded by multiple arrays, the source location can be estimated by the intersection of vectors that describe the azimuth estimate of each array. Our method is similar to that employed in solid-earth studies (e.g., Almendros and others, Reference Almendros, Chouet and Dawson2001).
Example of one seismic event (# 20 032 on 2 January 2014 at 2:08 pm, near the end of a rising tide) and the corresponding beamforming result. (a–c) Normalized bandpass filtered waveforms as they arrived at each station in the subarray. (d–f) Probability maps from searching through azimuths for all discrete values of a range of slownesses.
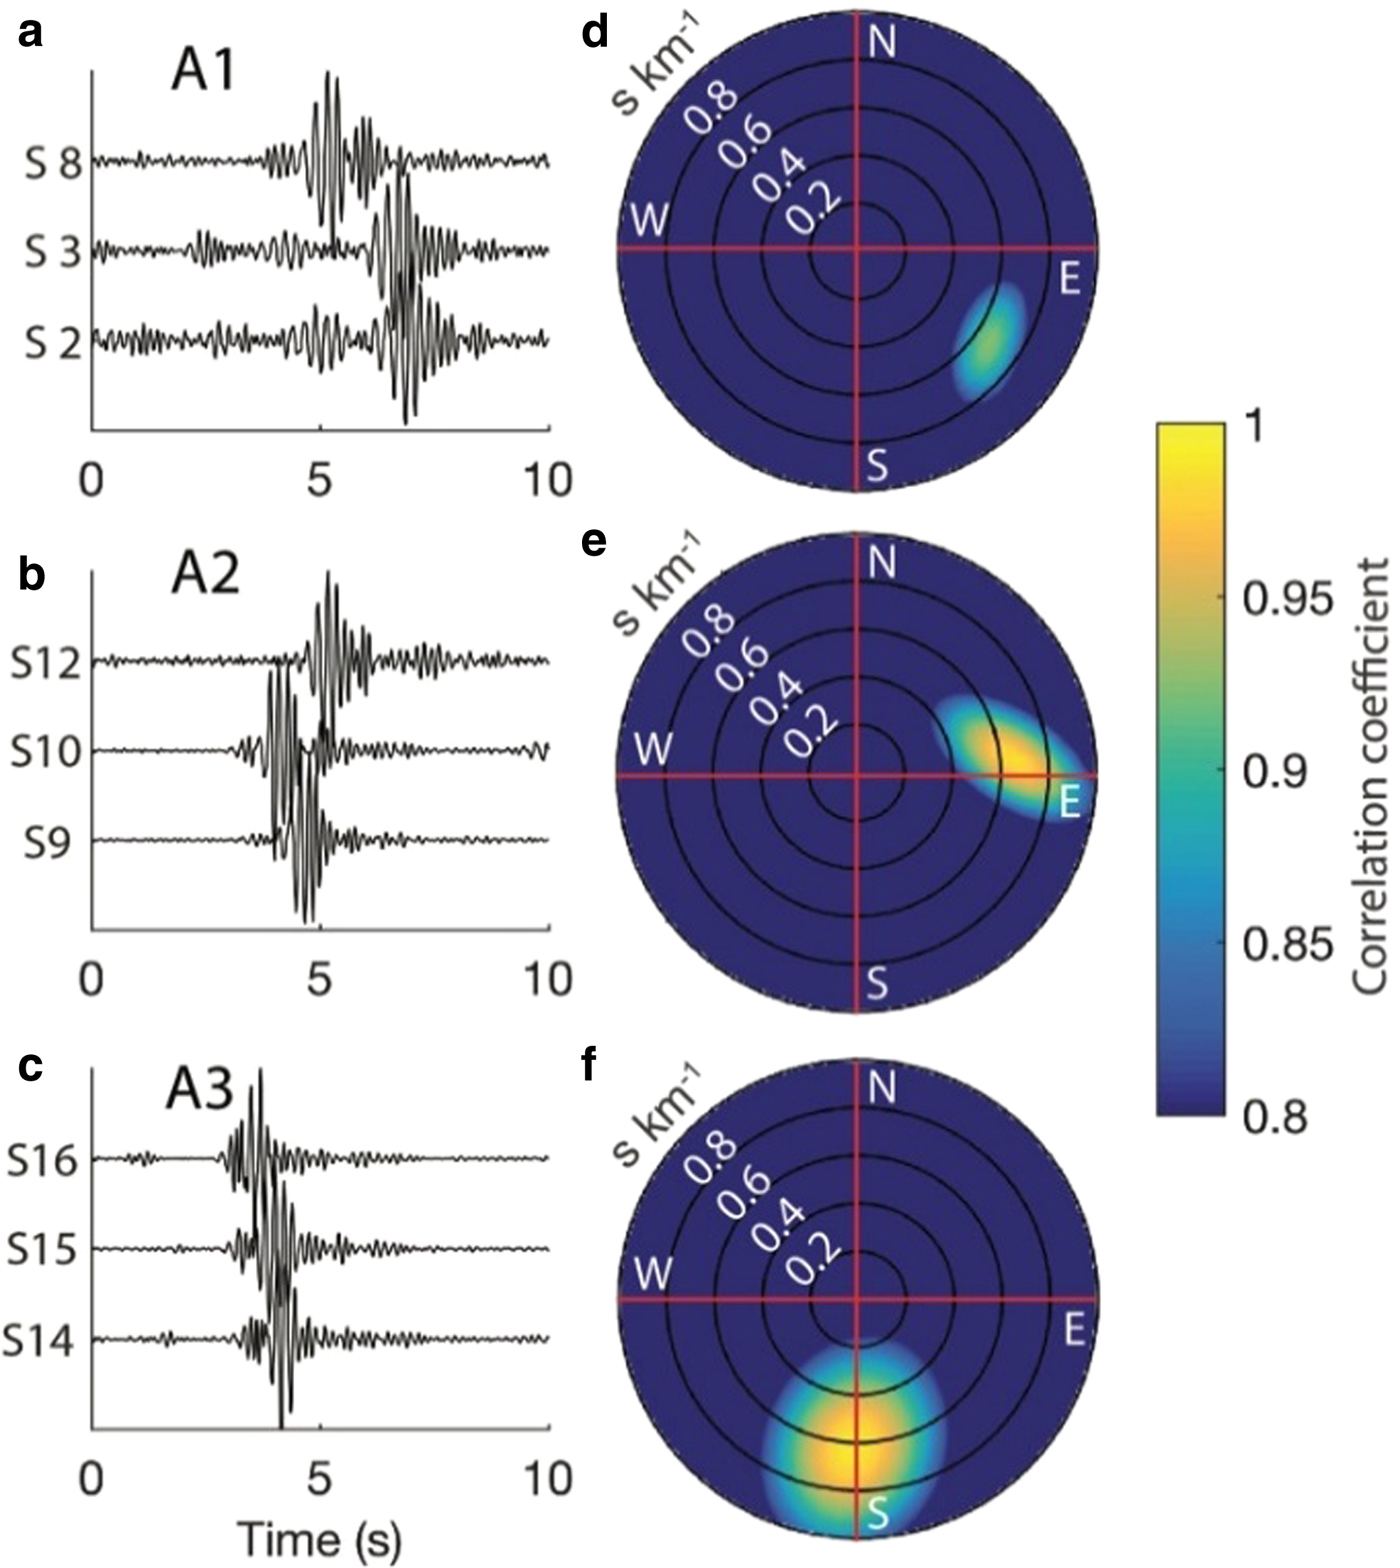
For beamforming and event location, three subarrays consisting of three seismometers each were created. Subarray A1 consisted of seismometers S2, S3, S8; A2 of seismometers S9, S10, S12; and A3 of seismometers S14, S15, S16. The centers of these arrays are shown in Figure 1b. We ignore changes in our network geometry during the course of the deployment, as total motion (~20 m) is small relative to the accuracy of our locations (several hundred meters). While events can be located using only two subarrays, events that originate along the trajectory connecting the two arrays will have azimuth estimates that are parallel to sub-parallel, leading to poor location estimates. Thus, we restrict the beamforming analysis to the period from 31 December 2013 to 7 January 2014 when sites S14–S16 were active. Coherence of the shifted waveforms was measured using the smoothed energy envelope function (0.5 s) of each waveform (Fig. 5).
Subsequent to beamforming for each subarray, a probabilistic estimate of the source location is made that takes into account conservative error estimates in azimuth (±20°). We first construct wedges that reflect the azimuthal probability distributions for each subarray (Figs 6a–c). A value of 1 is assigned along the estimated azimuth with values decreasing linearly to 0 as azimuths approach ±20° of the estimated azimuth. The azimuthal probability estimate of each subarray is then averaged at each gridpoint to create a spatial-source probability (Fig. 6d). When all three wedges overlap and a geographic point has a probability value close to one, the location is a possible source for the event.
Well-located event # 20 032 shown in Figure 5. Spatial probability distribution wedges for azimuth at arrays (a) A1 (pink), (b) A2 (purple) and (c) A3 (green). (d) Spatial source probability with outlines of wedges that define azimuth estimate ±20° for each subarray.
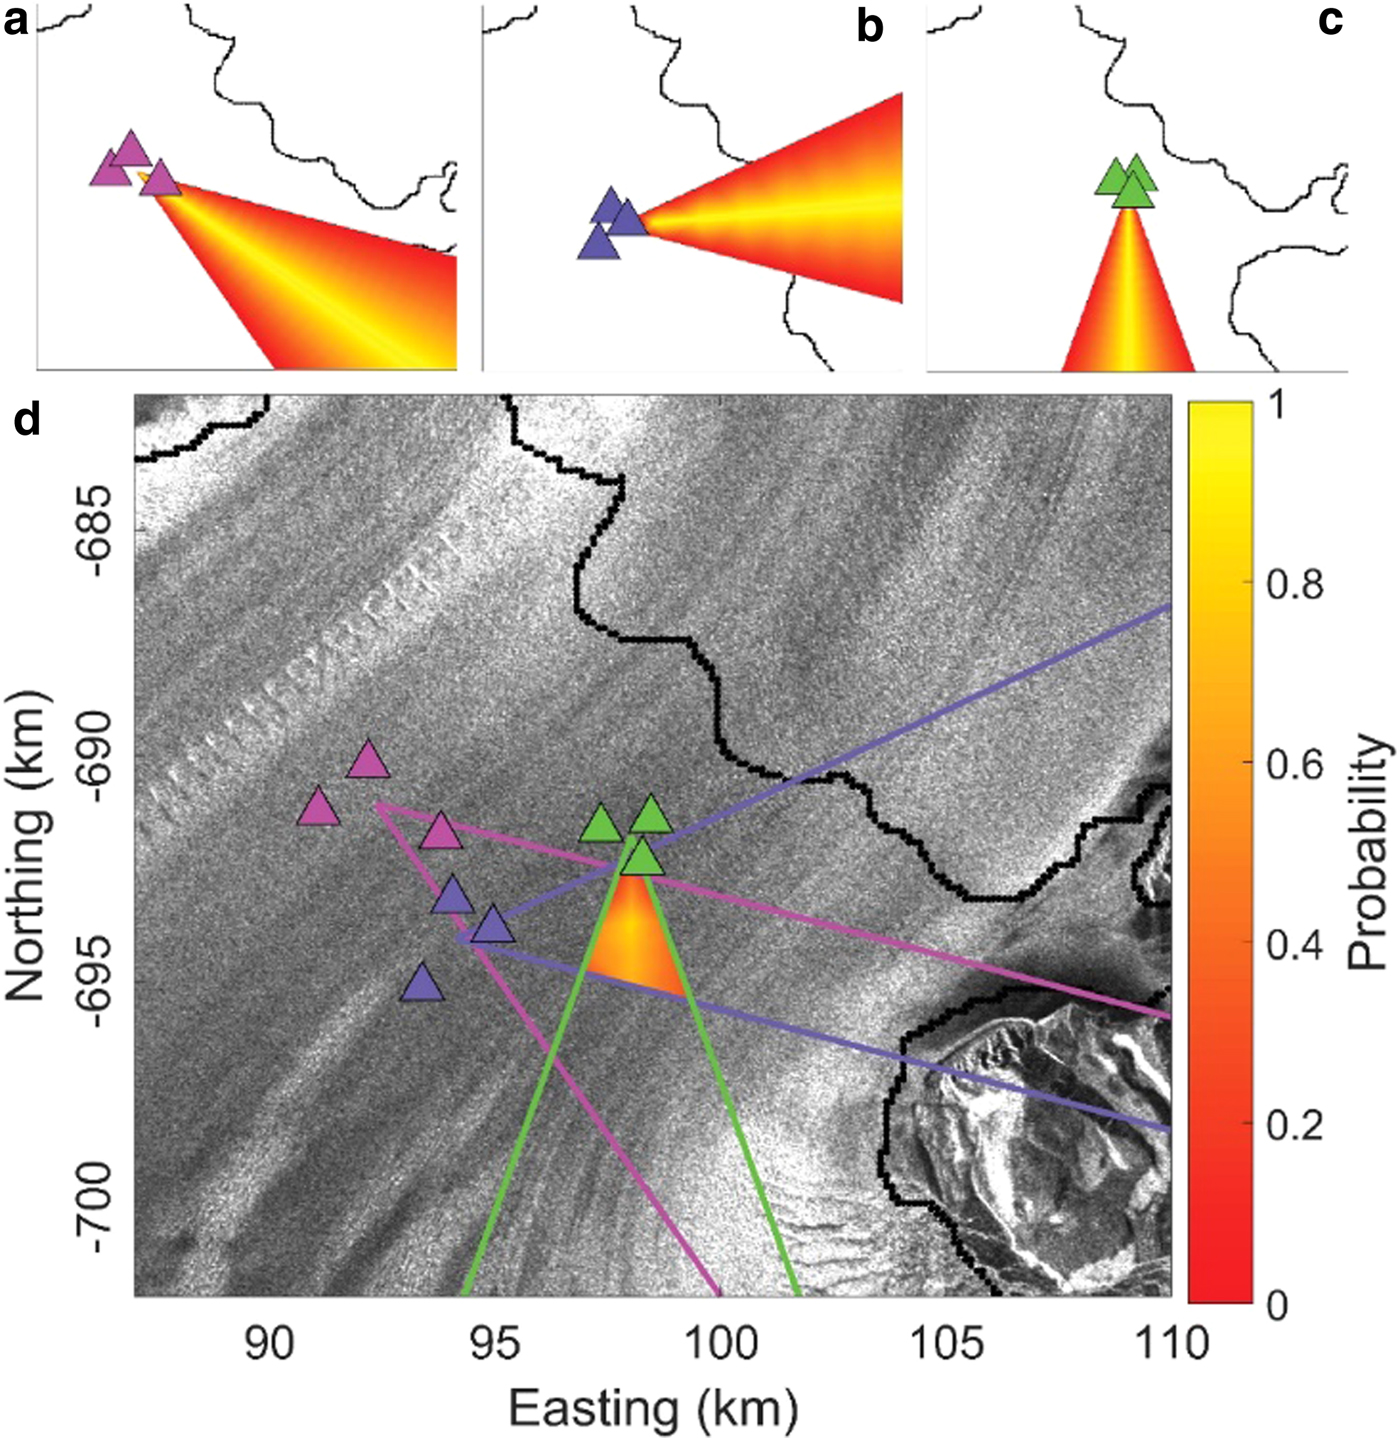
Locating events precisely can be hampered by several factors, such as low signal-to-noise ratios, two events occurring very close in time relative to their duration or spatial variations in seismic wave speed. In addition, for events that originate from outside the network, the wedges that define the azimuthal probability estimate for each subarray become increasingly parallel, and at a certain distance, no minimum will exist in the spatial source probability. A resolution test indicates that this transition occurs ~10 km from the center of the network (Cooley, Reference Cooley2017). We discard events with poor locations by imposing two conditions: (i) ensuring the spatial-source probability wedges from all three subarrays overlap and (ii) excluding all events with the origin more than 10 km from the center of the network. To satisfy the first condition, we require that the averaged maximum of spatial source probability exceeds 0.67. Events that satisfy both conditions are considered well-located, and used for further investigation in this study.
RESULTS
Spatial structure of ice motion
The spatial structure of velocity and strain rate show that within a few kilometers downstream of the grounding zone, the ice-shelf can be divided into distinct regions: an extensional regime for ice exiting the grid-north side of the glacier, and a zone of net compression for ice exiting the grid-south side of the glacier (Fig. 2). There is no indication of pinning points in this region, which implies this region of compression arises from the redirection of flow as the glacier merges with the Ross Ice Shelf (LeDoux and others, Reference LeDoux, Hulbe, Forbes, Scambos and Alley2017).
GPS observations of ice motion
As previously observed on the Ross Ice Shelf, all sites exhibit tidal modulation of their flow speed (Anandakrishnan and others, Reference Anandakrishnan, Voigt, Alley and King2003; Marsh and others, Reference Marsh, Rack, Floricioiu, Golledge and Lawson2013). While all GPS stations were deployed on the ice shelf, the observed vertical motion associated with the ocean tides varies according to proximity to the grounding zone. The smallest vertical range of ~1 m was observed at G4, while the downstream sites G1, G2 and G3 display larger vertical range (~1.8 m). This larger range is within a few centimeters of the modeled tidal ranges in the region for this time period (Padman and others, Reference Padman, Fricker, Coleman, Howard and Erofeeva2002). Annual horizontal velocities of the three downstream locations are ~348 m a−1, while the upstream site G4 moves at a slightly faster rate of 355 m a−1, consistent with the long-term net compression (Fig. 2). We observe a slight phase difference in the modulation of flow speeds, with G4 reaching its highest and lowest velocity slightly later than stations farther downstream. Unlike previous surveys, our network displays less tidal modulation of the mean flow speed at the downstream locations (~5%) relative to upstream location (~20%).
Seismic event analysis
Event characteristics and timing
Events recorded by the network were typical of short duration (~3 s) with magnitudes between −2 and 0. We detected 24 028 events over the 23 d of 16 December 2013–7 January 2014, detecting 44 events per hour on average. Seismicity rate is not constant, however, but shows variations that correlate with the Ross Sea tides. At daily timescales, peaks in seismic activity are observed during both falling and rising tides (Fig. 4), while at the fortnightly timescale, neap tides (25–27 December) result in lower rates of seismic activity relative to the spring tides (30 December 2013–1 January 2014).
Event locations
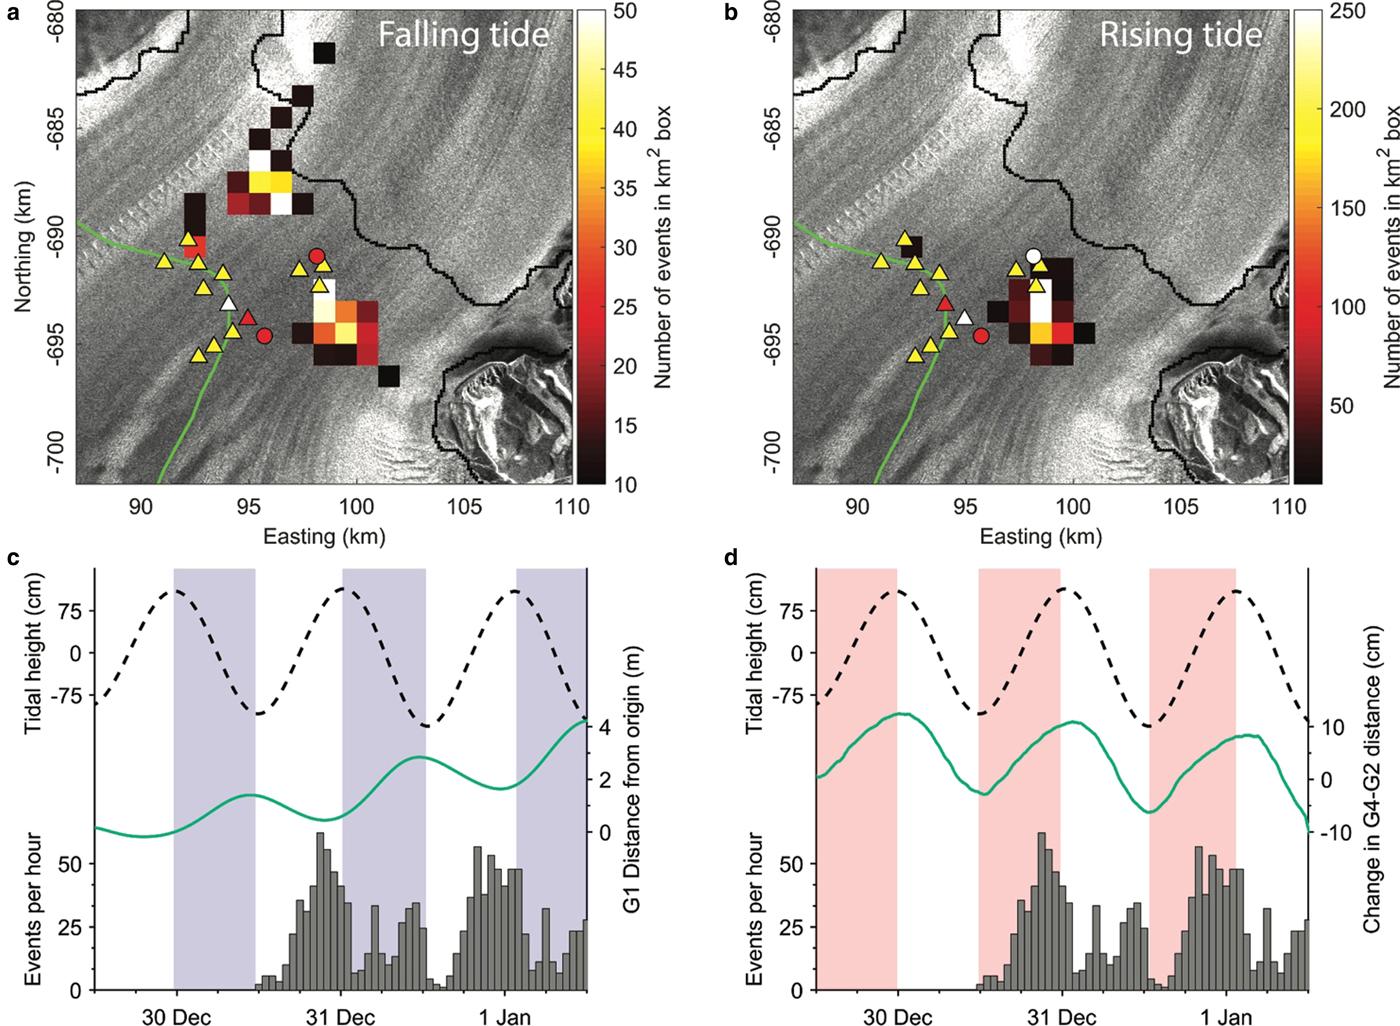
Of the 8028 events detected during the 8 d period when all three subarrays were operating (31 December 2013–7 January 2014), approximately one-quarter of the events (2304) were well-located. We expect these event locations are representative of the entire event catalogue, as the events from this period have a similar tidally modulated pattern. Although events are located throughout the study area, there are two regions of more concentrated seismicity, one on the grid-north side of the region and one on the grid-south side. The seismicity in the grid-north part of the study area spans the grounding line and appears to be predominately associated with a train of crevasses that initially forms from an icefall within 5 km of the grounding zone (located at ~98–682 km). Seismicity on the south side of the region is concentrated downstream from the grounding line and is approximately centered over the transition between extensional and compressional flow regime observed on in the strain-rate maps (100–694 km) (Fig. 2b). Additionally, the temporal pattern of seismicity is distinct between the grid-north side and grid-south side of the study region. While a relatively low level of seismicity is always present (Fig. 4), seismicity on the north side of the study region peaks only during the falling tide (Fig. 7a). In contrast, seismic activity on the south side of the region has elevated the rates on both the falling and rising tides (Fig. 7b).
Locations of events occurring during (a) falling tide and (b) rising tide. Boxes with less than ten events are not pictured. For (c) and (d) histograms of well-located events in grey (no well-located events on 30 December as A3 was not in place), black dashed line is tidal height (from G2), falling tide shaded in blue and rising tide shaded in red. (c) Line in green is the change in location of station G1, the white triangle in (a). The speed of G1 is tidally modulated, and the station moves slowly downstream, ~4 m over the 4 d pictured. (d) Line in green is horizontal distance between stations G2 and G4, the white triangle and circle respectively in (b).
DISCUSSION
Tidal modulation of ice motion
At each of our GPS locations, peak horizontal velocities occur on the falling tide, with the magnitude of velocity fluctuations scaling with the daily tidal amplitude (Fig. 3). However, unlike other studies of tidally modulated ice-shelf flow (e.g., Brunt and others, Reference Brunt, King, Fricker and MacAyeal2010; Makinson and others, Reference Makinson, King, Nicholls and Gudmundsson2012), we observe decreased horizontal velocity modulation at our three downstream locations (G1, G2, G3) compared with the one upstream location (G4). The physical mechanisms that control both the phasing and magnitude of tidally modulated flow remain an active area of research (e.g., Robel and other, Reference Robel, Tsai, Minchew and Simons2017). Tidal perturbations to the force budget are often small (a few kPa), and the magnitude of the velocity modulation is highly dependent on the tidally modulated force budget.
As ice crosses the Beardmore Glacier grounding line and merges with the Ross Ice Shelf, it must turn direction. This results in the zone of convergence observed along flow paths exiting the grid-south side of the glacier (Fig. 2b). Our GPS observations are concentrated near this region of net compression. Thus, the smaller magnitude of velocity modulation at the downstream sites (G1, G2, G3) relative to the upstream site (G4) is likely the result of increased buttressing in this portion of the ice-shelf, minimizing the influence of tidal perturbations on the flow field. A consequence of this behavior is that while the area on the grid-south side of the study area is a region of net compression, this region oscillates between horizontal extension and compression on daily timescales. At this location, horizontal extension occurs on rising tides as the velocity of locations closer to the grounding zone (such as G4) drops below that of the downstream locations (G1, G2, G3) (Fig. 3). This can be seen in the motion between stations G2 and G4, which move farther apart during rising tide (Fig. 7d).
Tidal modulation of seismicity
Elevated rates of fracture-related seismicity correspond to time periods of enhanced extensional strain rates. Near grounding zones, two main processes modulate strain rates on tidal timescales. Vertical flexure across the transition from a fully grounded ice sheet to a fully floating ice-shelf results in peak rates of extensional strain (e.g., Vaughan, Reference Vaughan1994), and thus elevated rates of seismicity during the falling tide (Hulbe and others, Reference Hulbe2016). The second dominant process is tidal modulation of horizontal flow speeds (e.g., Anandakrishnan and others, Reference Anandakrishnan, Voigt, Alley and King2003), such as those observed in the Beardmore Glacier grounding zone.
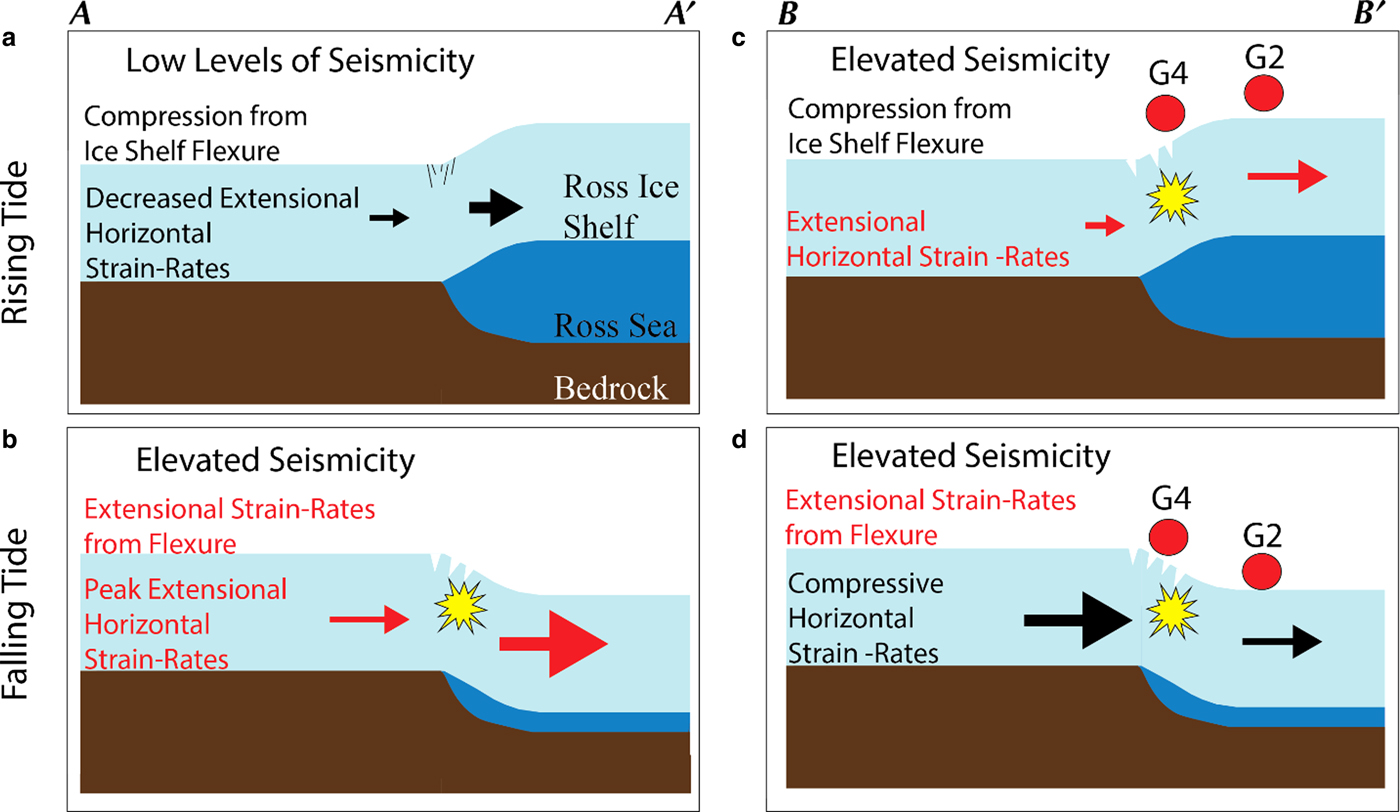
Both mechanisms modulate the seismicity near the grounding zone of the Beardmore Glacier. However, there is a distinct temporal pattern in tidally modulated strain rates for the grid-north and grid-south portions of the region; this is illustrated in Figure 8. Average flow speeds increase monotonically for ice exiting the grid-north side of the glacier (Figs 2a and c), a characteristic that most likely indicates that peak horizontal strain rates will occur on the falling tide (Fig. 7c), similar to regions with simpler grounding-zone geometries (e.g., Barruol and others, Reference Barruol2013; Podolskiy and others, Reference Podolskiy2016). Thus, on the grid-north side of the glacier, extensional strain rates from both flexure and horizontal velocity perturbations will promote lower levels of seismicity during rising tides (Fig. 8a), while the opposite is the case during falling tides (Figs 7 and 8b). In contrast, for the grid-south side of the study area, peaks in seismic activity are observed during both rising and falling tides (Figs 7a and b). The drop in ice flow speed near this section of the Beardmore grounding zone, relative to regions of ice-shelf a few kilometers downstream, results in peak horizontal strain rates during the rising tide, promoting increased seismic activity (Figs 7d and 8c). The opposite occurs on the falling tide as horizontal strain rates will tend to suppress seismic activity while positive strain rates drive flexure of the ice-shelf (Fig. 8d). Thus, the differing tidal modulation of seismic activity reflects the variable modulation of glacier flow due to the geometry of the study region.
Schematic of how the two main mechanisms influencing seismicity near grounding zones, vertical ice-shelf flexure and variable horizontal strain rates, vary during the tidal cycle for the two transects shown in Figure 2a and b. The vertical direction is exaggerated for clarity. Processes promoting increased levels of seismicity are in red, those promoting decreased levels of seismicity are in black. Explanation in section ‘Tidal modulation of seismicity’.
CONCLUSIONS
Structural features that influence rift and stability of large ice shelves often originate from grounding zones (e.g., LeDoux and others, Reference LeDoux, Hulbe, Forbes, Scambos and Alley2017). Our work highlights how observations of seismic activity near the grounding zone can be used to constrain the relationship between compression/extension of the ice-shelf due to tides and due to crevasse formation and propagation. The change in ice-flow trajectory as the Beardmore Glacier exits onto the Ross Ice Shelf makes it unique compared with outlet glaciers with small or non-existent ice shelves. The spatial variation in tidally modulated flow speed provides physical mechanisms to understand the links between the spatio-temporal pattern of strain rates and observed seismicity.
In addition to these findings, we present the successful application of the beamforming method for locating the epicenters of seismic events related to ice sheet motion. Our study area has two distinct regions of seismic activity that display unique temporal patterns. Investigating this reveals the complex interplay between glacier flow in the grounding zone, buttressing from the ice-shelf and tidal interactions. Future cryoseismic or geodetic studies could focus on the extension zone of the Beardmore Glacier, or on other glaciers with similarly complex grounding-zone flow. Simultaneous seismic and geodetic studies of grounding-zone deformation have the potential to provide information about the ice-shelf structure that regulates seismic activity, which will lead to improved understanding of ice-shelf stability.
Acknowledgements
This work was supported by US NSF grants 1141889 and 1246666 to JPW and grant 1141866 to HC and MK. We thank Antarctic Support Contract, the US Air National Guard, and Ken Borek Air for logistical support. Equipment for this study was provided by the IRIS-PASSCAL and UNVACO instrument facilities. We thank Max Stevens and Maurice Conway for help with data collection. We thank Audrey Huerta and Walter Szeliga for comments on an early version of the manuscript, and Hester Jiskoot for comments on a late version of the manuscript. The authors thank reviewer Anja Diez and Scientific Editor Brad Lipovsky for comments that improved the manuscript.


 Open access