


Introduction
Silurian rocks exposed in classic localities of northeastern United States contain abundant fossils, including bryozoans. However, the last major studies of Silurian Bryozoa from these localities were conducted more than 100 years ago. Whereas bryozoans from the Silurian of Ohio and Indiana were described in an impressive series of monographs and journal articles (e.g., Hall and Whitfield, Reference Hall and Whitfield1875; Hall, Reference Hall1876, Reference Hall1882; Foerste, Reference Foerste1887, Reference Foerste1888, Reference Foerste1893, Reference Foerste1919; Perry and Hattin, Reference Perry and Hattin1960), bryozoan faunas of western New York received little attention (e.g., Hall, Reference Hall1852; Bassler, Reference Bassler1906). In addition, the majority of literature on American Silurian bryozoans predates the present-day standards of taxonomic descriptions.
Silurian bryozoans are known from many local areas worldwide; however, their paleontological record is not as remarkable as for Ordovician and Devonian faunas. Tuckey (Reference Tuckey, McKerrow and Scotese1990) stated that a low level of endemism exists for Silurian bryozoans and postulated a correlation between provinciality and bryozoan diversity. Controversially, McCoy and Anstey (Reference McCoy and Anstey2010) concluded that bryozoans showed a high level of endemism in the Silurian, much higher than other organism groups. Buttler et al. (Reference Buttler, Wyse Jackson, Ernst, McKinney, Harper and Servais2013) showed that the provinciality was heterogeneous during the Silurian. During the Llandovery, bryozoans began to show distinct provincialism; this declined during the Wenlock, only to reemerge during the Ludlow.
Bryozoans are a very important fossil group. Because their skeletons consist of carbonate material (usually low-magnesium calcite in Paleozoic clades), bryozoans show high potential for preservation. Because of their modular organization, bryozoan colonies can be identified even from small fragments. The wide distribution of bryozoans in marine habitats and their ecological flexibility make them important for use in various fields of the life sciences. The present paper documents a little-known Aeronian bryozoan fauna from New York. In all, 13 species, including three new species, are described, and the paleoecologic and biogeographic implications of this fauna are discussed.
Geological and paleontological setting
This bryozoan fauna derives from the Reynales Formation (lower Silurian, Llandovery, Aeronian) at Hickory Corners, Lockport Junction Road (Route 93), near the city of Lockport, Niagara County, New York (Fig. 1). The studied section comprises about two meters of interbedded shale and limestones represented by biosparite (grainstones) and biomicrite (wackestones and packstones) with a carbonate hardground capping the unit (Fig. 2). Kilgour (Reference Kilgour1963) named these rocks the Hickory Corners Member of the Reynales Formation. LoDuca and Brett (Reference LoDuca and Brett1994) demonstrated that the unit at this outcrop is actually a composite western extension of the Brewer Dock and Wallington members of the Reynales of the Rochester area (Gillette, Reference Gillette1947) and that those names would have priority over Hickory Corners Member. Nonetheless, the boundary between these units is difficult to recognize at Lockport. The name Hickory Corners is officially recognized by U.S. Geological Survey GEOLEX, and this name will be used herein.
(1) Locality map showing position of the Hickory Corners (Lockport Junction Road, Route 93) outcrop; (2, 3) external view of the outcrop showing limestones of the Reynales Formation.
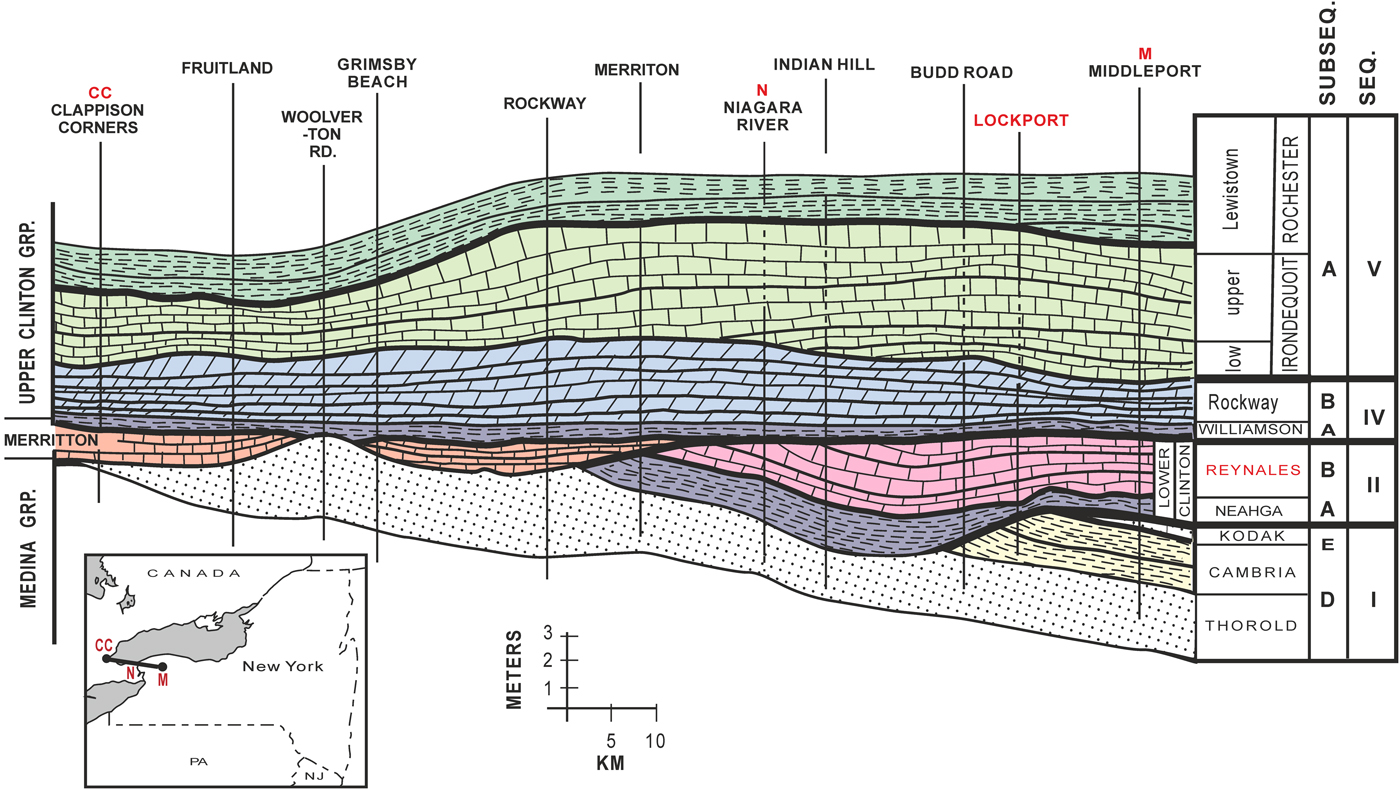
Stratigraphy of the Reynales Formation from west (left) to east (right) along the Niagara Escarpment, about 145 km in western New York; locations of the sections are as follows: 1 = Niagara Gorge at Lewiston, Niagara County, New York (43.1479°N, 79.0410°W); 3 = Budd Road, Cambria, Niagara County, New York (43.1843°N, 78.7804°W); 5 = study section: Hickory Corners, Lockport Junction Road (NY 93); Pekin/Lockport, Niagara County, New York (43.1844°N, 78.7539°W); 7 = Genesee River Gorge at Seth Green Drive, Rochester, Monroe County, New York (43.1861°N, 77.6247°W); 8 = Glen Edyth Drive, Webster, Monroe County, New York (43.2044°N, 77.5137°W); these and the omitted localities are discussed in LoDuca and Brett (Reference LoDuca and Brett1994), from which this figure is adapted.
The Reynales Formation has long been known to be of mid-Llandovery and probably Aeronian age (Berry and Boucot, Reference Berry and Boucot1970). Recently, Waid and Over (Reference Waid and Over2015) discovered conodonts in the lower Reynales Formation (basal Budd Road phosphate bed of LoDuca and Brett, Reference LoDuca and Brett1994) from Budd Road about 2.5 km west of Hickory Corners, representing the Pranognathus tenuis Zone (lower to middle Aeronian). The Reynales Formation is at the top of Silurian third-order sequence S-II of the lower Clinton Group (Brett et al., Reference Brett, Goodman and LoDuca1990; Cramer et al., Reference Cramer2011). In western New York, the Hickory Corners Member interval is represented by an erosional remnant, which pinches out westward in Ontario beneath the Telychian Merritton Formation (Kilgour, Reference Kilgour1963; Fig. 3). It passes eastwardly into the Brewer Dock and lower portion of the Wallington Member of the Reynales Formation, and that in turn a distinctive fossiliferous hematitic ironstone, the Furnaceville Member, is associated with the basal Brewer Dock Member at the Genesee Gorge in Rochester, New York (Fig. 3). No hematitic bed occurs in the equivalent lower Hickory Corners Member in Niagara County (Fig. 3).
Regional cross section of the condensed interval of the Silurian rocks in western New York; note the several sequence-bounding unconformities and westward taper and pinchout of the Aeronian Reynales Formation. Sequence II, subsequence B, the study interval, is highlighted in pink. CC, N, and M refer to positions marked on the cross section on the inset map. Modified from LoDuca and Brett (Reference LoDuca and Brett1994).
The Reynales Formation was formed in the northern portion of the elongated Appalachian Foreland Basin during the early Silurian Aeronian Age. Deposits extended northeast–southwest in the New York region. During Reynales deposition, the basin center is inferred to have lain to the west of the study area, but western facies have been largely removed by regional erosion in the later Telychian. To the east, the Reynales Formation shows a gradual change to somewhat shallower facies near Rochester, New York (LoDuca and Brett, Reference LoDuca and Brett1994; Eckert and Brett, Reference Eckert and Brett2001). This portion of the Laurentian continent (ancestral North America) was subtropical, situated about 30° south of the equator (Witzke, Reference Witzke, McKerrow and Scotese1990; Scotese, Reference Scotese2001; Blakey, Reference Blakey2005).
The Hickory Corners Member comprises a thin interval of interbedded, sparsely fossiliferous greenish gray shale and fossiliferous wackestones and packstones with minor crinoidal grainstones near the top. Beds are thin and commonly lenticular; some show evidence of grading suggestive of storm processing of skeletal material and silty carbonate muds. The basal few centimeters (Budd Road beds) contain abundant shiny black phosphatic nodules suggestive of very slow rates of sediment and prolonged reworking and time averaging, as well as a source of phosphatic material; this is possibly associated with the deposition of the Furnaceville hematite bed, which contains abundant bryozoan fragments (Phaenopora? and small ramose bryozoans) coated with hematite. A majority of the brachiopods are disarticulated whole valves without much fragmentation, and the bryozoans are partially intact, branched colonies. This evidence suggests a predominantly low-energy setting with frequent storm agitation and an overall low rate of sediment accumulation. However, layers about 30–50 cm above the base of the Hickory Corners yield evidence of rapid redeposition; these include rare obrution beds that enclose complete crinoids buried in thin mud layers (Eckert and Brett, Reference Eckert and Brett2001). The diverse fauna and primarily matrix-supported limestones indicate that the Reynales Formation in this locality represents the shallow (30–60 m depth) outer shelf environment of Benthic Assemblage 4 of Brett et al. (Reference Brett, Boucot and Jones1993).
Associated fauna
The Hickory Corners Member is rich in bryozoans, crinoids, bivalves, gastropods, brachiopods, and trilobites (Fig. 4). Small, solitary rugose corals (Enterolasma? sp.) are common in this limestone. Brachiopods are relatively diverse and include Hyattidina, Platystrophia, Dalejina, Coolinia, and rare Eocoelia; disarticulated sclera of the trilobites Liocalymene and Encrinurus are relatively common in the Hickory Corners Member.
(1) Surface of fossil-rich limestone of the Reynales Formation; (2) thin section across bedding. (1) Scale bar = 10 mm; (2) scale bar = 5 mm.
Eocoelia, often considered to be a nearshore indicator, is typical of the ‘Eocoelia Community’ (Ziegler, Reference Ziegler1965) or benthic assemblage (BA) 2 of Boucot (Reference Boucot1975; see Boucot and Lawson, Reference Boucot and Lawson1999 for numerous examples). However, this brachiopod is rare in the Niagara County area. The upper portion of the Hickory Corners Member passes eastward (up-ramp) into the Wallington Limestone, which is rich in robust pentamerid brachiopods (Pentamerus oblongus Sowerby, Reference Sowerby and Murchison1839), as well as favositids and small stromatoporoids, a typical BA3 assemblage (Boucot, Reference Boucot1975; Boucot and Lawson, Reference Boucot and Lawson1999). Overall, the moderate diversity of brachiopod, bryozoan, and echinoderm fauna of the Hickory Corners Member is indicative of a BA3 to BA4 position.
The Reynales Formation in Niagara County, including the Hickory Corners study locality, has yielded a small but distinctive crinoid fauna (Eckert and Brett, Reference Eckert and Brett2001), including the small disparid crinoid Haptocrinus calvatus Eckert and Brett, Reference Eckert and Brett2001, long known for its distinctive pentalobate columnals, which make up a high proportion of the Hickory Corners grainstones. Hall (Reference Hall1852) figured these under an incompletely known species ‘Glyptocrinus plumosus.’ These small crinoids are associated with the coiled columns of perhaps three species of Eomyelodactylus, notably E. sparteus Eckert, Reference Eckert1990, the camerate Dynamocrinus robustus Eckert and Brett, Reference Eckert and Brett2001, and the flexible crinoid Prolixocrinus anellus Eckert and Brett, Reference Eckert and Brett2001.
The Hickory Corners faunas, especially the crinoids, show affinities to those described from the uppermost Brassfield Formation (‘Red Brassfield’) in Ohio and Kentucky (e.g., Ausich, Reference Ausich1984, Reference Ausich1986a, Reference Ausichb; Ausich and Dravage, Reference Ausich and Dravage1988). On the basis of conodonts and the brachiopods Microcardinalia and Triplecia, this unit has been suggested to be of mid-Aeronian age and thus equivalent to the Oldham Limestone of Kentucky and ‘Packer Shell’ of the Ohio Subsurface, both of which are correlated with the Reynales Formation in New York. All of these units yield moderately abundant ramose and reticulate bryozoans that have not received recent study (see Foerste, Reference Foerste1887, Reference Foerste1893, Reference Foerste1919) and warrant further comparative work.
Materials and methods
The bryozoans described here were collected from a small weathered roadcut outcrop approximately 2 m high on the east side of State Route 93 (Lockport Junction Road) just south of the Lower Mountain Road overpass in the hamlet of Hickory Corners, part of the town of Cambria, Niagara County, New York, USA (43.18464°N, 78.75394°W). Here the Reynales Formation (lower Silurian, Aeronian) is exposed for several meters along the highway. Most material was obtained from loose slabs that can only be from the Hickory Corners Member; these are mainly from above the basal Budd Road phosphatic beds, but the exact horizon could not be determined.
Bryozoans were studied in thin section using a binocular microscope in transmitted light. In total, 87 thin sections were prepared from rock samples. Morphological character terminology is partly adopted from Anstey and Perry (Reference Anstey and Perry1970) for trepostomes and cystoporates, Hageman (Reference Hageman1991) for fenestrates, and Hageman (Reference Hageman1993) for cryptostomes. The spacing of structures is measured as the distance between their centers. Statistics were summarized using arithmetic mean, sample standard deviation, coefficient of variation, and minimum and maximum values.
Repositories and institutional abbreviations
The studied material is deposited at the Senckenberg Museum, Frankfurt am Main, Germany (SMF). Other repositories include the National Museum of Natural History (formerly United States National Museum), Paleobiology Department (USNM PAL), Washington, D.C., USA, and the Geological Survey of Canada (GSC), Ottawa, Canada.
Systematic paleontology
Phylum Bryozoa Ehrenberg, Reference Ehrenberg1831
Class Stenolaemata Borg, Reference Borg1926
Order Cyclostomata Busk, Reference Busk and MacGillivray1852
Family Diploclemidae Gorjunova, Reference Gorjunova1992
Genus Diploclema Ulrich in Miller, Reference Miller1889
- 1889
Diploclema Ulrich in Miller, p. 300.
- 1890
Diploclema; Ulrich, p. 368.
- 1906
Diploclema; Bassler, p. 17.
- 1964
Diploclema; Ross, p. 28.
- 1971
Diploclema; Kopajevich, p. 253.
- 1975
Diploclema; Brood, p. 109.
- 2012
Diploclema; Ernst and Carrera, p. 722.
Type species
Diploclema trentonense Ulrich in Miller, Reference Miller1889. Middle Ordovician (‘Trenton Group’), USA
Diagnosis (emended)
Branched dichotomous colonies. Autozooecia pyriform, growing in biradial pattern from the median lamina through simple exterior skeletal wall, separated by interzooecial space in endozone. In some species, interzooecial space protrudes into the exozone between autozooecia giving an impression of tubes. Autozooecial apertures rounded to oval, with low peristomes, opening distally on all sides of subcylindrical stems, arranged in quincunx order on the colony surface, surrounded by peripheral structures and nodes. The exterior skeletal walls thin, continuous except for autozooecial apertures, covering both autozooecial chambers and small portions of colony-wide extrazooecial space, consisting of prismatic material. Autozooecial diaphragms rarely occurring. Interior autozooecial walls thickly laminated, with distinct zooecial boundaries, often undulating in proximal parts of autozooecia. Communication pores absent. Pseudopores absent. Heterozooecia not known.
Occurrence
Middle Ordovician of United States. Upper Ordovician of western Argentina. Lower to middle Silurian of United States, Canada, and Europe.
Remarks
The genus Diploclema Ulrich in Miller, Reference Miller1889 is unique among cyclostome bryozoans because of its exterior wall, which has a prismatic structure and is completely different from the laminated interior wall. Diploclema can be compared with Kukersella Bassler, Reference Bassler1911 in possessing similar colony form and autozooecial shape, but Diploclema lacks axial tubes, communication pores, and pseudopores. Furthermore, the microstructure of the frontal walls of Kukersella is finely laminated whereas the frontal wall of Diploclema is prismatic.
Diploclema argutum Bassler, Reference Bassler1906 Figures 5.1–5.9, 6.1–6.3; Table 1
- 1906
Diploclema sparsum var. argutum Bassler, p. 17, pl. 5, figs. 8, 9.
- 1971
Diploclema regulariforme Kopajevich, Reference Kopajevich1971, p. 121, fig. 3.
Descriptive statistics of Diploclema argutum Bassler, Reference Bassler1906. N = number of measurements; X = mean; SD = sample standard deviation; CV = coefficient of variation; Min = minimum value; Max = maximum value; units = mm.
Holotype
USNM PAL 35557. Rochester Shale, Wenlock, lower Silurian; New York, USA.
Occurrence
Lower Silurian, Llandovery-Wenlock of USA (New York). Lower Silurian, Wenlock of Estonia.
Description
Branched dichotomous colonies, cylindrical and belt shaped, bifoliate, arising from encrusting bases. Cylindrical branches 0.30–0.46 mm in diameter, belt shaped 0.37–0.43 mm thick and 0.75–1.43 mm wide. Autozooecia drop shaped, narrow proximally and broadened distally, 0.40–0.60 mm long and 0.13–0.20 mm wide, separated by interzooecial space in endozone. Interzooecial space protruding to the exterior wall between autozooecia producing rounded separations 0.04–0.08 mm in diameter. Autozooecial apertures oval, 0.07–0.10 mm wide, spaced 0.34–0.44 mm from center to center longitudinally. Interior autozooecial walls thickly laminated, undulating near the surface, with distinct zooecial boundaries, 0.013–0.040 mm thick. Exterior zooecial walls granular, 0.005–0.008 mm thick.
Materials
SMF 23.318–SMF 23.376.
Remarks
Bassler (Reference Bassler1906, p. 18, pl. 5, figs 8, 9) described “a distinct pore in front of zooecial aperture.” These pores were sometimes regarded as heterozooecia. Kopajevich (Reference Kopajevich1971, p. 120, text-figs. 1, 2) described ‘upper’ and ‘lower’ partitions in the autozooecia of Diploclema. This model implies zooecia with long peristomes and arched zooecia. A shallow section that cuts the peristome (upper partition) and the arched part of the zooecium (lower partition) produces the appearance of heterozooecia. A similar model was suggested by Brood (Reference Brood1975, p. 64, fig. 12). He suggested the existence of a “vertically placed tabula, which divides the zooecium in two compartments.” The outer compartment is supposed to have contact with the surface, whereas the inner compartment would be connected by pores to the outer one. However, such a morphology is not obvious from observation of the presently described abundant material from the Silurian of North America. The morphology of Diploclema is difficult to describe because its outer wall is extremely thin and cannot be observed in tangential sections. Transverse and longitudinal sections show that zooecia are rather flat, and they have neither distinct peristomes nor compartments (Fig. 6.1). Any openings of the ‘heterozooecia’ or ‘pores’ could not be observed in the tangential section. Diploclema has a kind of an interzooecial space, which separates autozooecia in endozone, and in distal parts it protrudes from the exozone and reaches the exterior wall (but does not protrude into it). This space is filled by calcite spar, which means that it had no direct contact with seawater. By contrast, autozooecial space is filled by micrite, assuming contact with the sediment via the aperture (after death and decay of the bryozoan). The impression of ‘partitions’ or ‘compartments’ inside of the autozooecia of Diploclema appears in oblique sections (Fig. 5.4), whereas strictly longitudinal sections cut only the autozooecia (Fig. 6.1).
(1–9). Diploclema argutum Bassler, Reference Bassler1906: (1, 2) longitudinal section of a basal part of a colony encrusting Moyerella n. sp., SMF 23.327; (3) basal part of a colony encrusting sediment, SMF 23.344; (4) oblique longitudinal section showing autozooecia and interzooecial space (arrows), SMF 23.342; (5, 6) shallow tangential section showing autozooecial apertures, internal walls, and interzooecial space (arrows); (5) SMF 23.353; (6) SMF 23.354; (7) oblique section showing internal walls and interzooecial space, SMF 23.323; (8, 9) shallow tangential section showing autozooecial apertures, internal walls, and interzooecial space (arrows), SMF 23.323. (1) Scale bar = 1 mm; (2, 3, 7, 8) scale bars = 0.5 mm; (4–6, 9) scale bars = 0.2 mm.
(1–3) Diploclema argutum Bassler, Reference Bassler1906: (1) longitudinal section showing autozooecial chambers, external walls, internal walls, and protruded interzooecial space in proximal part of autozooecia (arrows), SMF 23.333; (2) branch transverse section showing autozooecial chambers, external and internal walls, SMF 23.351; (3) branch transverse section showing autozooecial chambers, external and internal walls, SMF 23.358. (4–8) Cheilotrypa aff. C. variolata (Hall, Reference Hall1876): (4) transverse section of a hollow cylindrical colony, SMF 23.436; (5) transverse section of a hollow cylindrical colony, SMF 23.402; (6) longitudinal section of a tubular colony, SMF 23.423; (7, 8) transverse section of a hollow cylindrical colony with sheets budding “base to base” (arrow), SMF 23.428. (1–3) Scale bars = 0.2 mm; (4, 5, 7, 8) scale bars = 0.5 mm; (6) scale bar = 1 mm.
Diploclema argutum Bassler, Reference Bassler1906 is identical to D. regulariforme Kopajevich, Reference Kopajevich1971 from the Silurian (Wenlock) of Estonia. The two species coincide in their size (e.g., aperture width 0.07–0.10 mm versus 0.05–0.11 mm in D. regulariforme; autozooecial width 0.13–0.20 mm versus 0.13–0.18 mm in D. regulariforme; autozooecial length 0.40–0.60 mm versus 0.49–0.63 mm in D. regulariforme). Diploclema argutum is similar to D. sparsum (Hall, Reference Hall1852) from the Silurian (Wenlock) of New York but differs from the latter in coarser branches that are often flat and contain mesotheca instead of median axis.
Superorder Palaeostomata Ma, Buttler, and Taylor, Reference Ma, Buttler, Taylor, Rosso, Wyse Jackson and Porter2014
Order Cystoporata Astrova, Reference Astrova1964
Family Fistuliporidae Ulrich, Reference Ulrich1882
Genus Cheilotrypa Ulrich, Reference Ulrich1884
[ = Chilotrypa Miller, Reference Miller1889, incorrect subsequent spelling]
Type species
Cheilotrypa hispida Ulrich, Reference Ulrich1884. Carboniferous, Mississippian, Viséan-Serpukhovian; USA.
Cheilotrypa aff. C. variolata (Hall, Reference Hall1876)
Figures 6.4–6.8, 7.1–7.5; Table 2
- 1876
Trematopora variolata Hall, p. 113, pl. 11, figs. 9, 10.
- 1882
Trematopora variolata; Hall, p. 234, pl. 10, figs. 9, 10.
Descriptive statistics of Cheilotrypa aff. C. variolata (Hall, Reference Hall1876). N = number of measurements; X = mean; SD = sample standard deviation; CV = coefficient of variation; Min = minimum value; Max = maximum value.
Occurrence
Reynales Formation, Hickory Corners Member, Aeronian, Llandovery, lower Silurian; Hickory Corners, New York, USA.
Description
Cylindrical colonies formed by encrusting unpreserved objects, 1.25–2.50 mm in diameter, with a lumen 0.42–1.35 mm in diameter. Encrusting sheets 0.26–1.10 mm in thickness, locally budding ‘base to base’ (Fig. 6.7, 6.8). Encrusted objects represent apparently dichotomizing rigid cylindrical objects (algae?) with regular narrow portions (Fig. 6.6). Autozooecia growing from 0.005–0.010 mm thick epitheca, bending sharply at their bases toward colony surface. Autozooecial apertures circular to oval. Basal diaphragms rare to absent. Lunaria well developed, horseshoe shaped. Vesicles abundant, five to eight surrounding each autozooecial aperture, irregularly shaped, medium in size, often large at the base, polygonal in tangential section, box-like to hemispheric, with plane or concave roofs in exozone. Autozooecial walls granular, 0.003–0.005 mm thick. Extensive extrazooecial material in exozone developed, 0.20–0.33 mm thick. Maculae consist of vesicular skeleton covered by laminated calcitic material, 0.38–0.70 mm in diameter.
Materials
SMF 23.377–SMF 23.461.
Remarks
Three species of Cheilotrypa are known from the Silurian of North America: C. varia (Hall, Reference Hall1876), C. variolata (Hall, Reference Hall1876), and C. ostiolata (Hall, Reference Hall1852) (all from the Wenlock of Indiana and New York). Whereas the former two species were described without use of thin sections, Cheilotrypa ostiolata was identified and described internally by Perry and Hattin (Reference Perry and Hattin1960) from the Osgood Formation (Wenlock) of Indiana. According to the descriptions and illustrations of C. varia and C. variolata in Hall (Reference Hall1882), the present species appears most similar to C. variolata. Hall (Reference Hall1882, p. 234) gives branch diameters of 2–7 mm and aperture diameters of 0.25 mm for C. varia and branch diameters of 1–1.5 mm and aperture width of 0.20 mm for C. variolata. The aperture width is still larger than in the present species (0.09–0.15 mm). Cheilotrypa sp. differs from C. ostiolata from the Silurian of New York in smaller autozooecia (autozooecia width 0.09–0.15 mm versus 0.15–0.20 mm in Cheilotrypa ostiolata).
Family Xenotrypidae Utgaard, Reference Utgaard and Robison1983
Genus Hennigopora Bassler, Reference Bassler1952
Type species
Callopora florida Hall, Reference Hall1852. Niagaran Group, Rochester Shale, Sheinwoodian, Wenlock, Silurian; Lockport, New York, USA.
Hennigopora apta Perry and Hattin, Reference Perry and Hattin1960
Figure 7.6–7.9; Table 3
- 1960
Hennigopora apta Perry and Hattin, p. 704, pl. 88, figs. 1, 3, 4.
Holotype
Specimen 5572 (Indiana University Paleontological Collection). Osgood Formation (Telychian-Sheinwoodian), Silurian; Indiana, USA.
(1–5) Cheilotrypa aff. C. variolata (Hall, Reference Hall1876): (1) oblique section of a hollow cylindrical colony, SMF 23.423; (2) shallow tangential section showing autozooecial apertures with lunaria, SMF 23.379; (3) deep tangential section showing autozooecial apertures with lunaria and vesicles, SMF 23.423; (4) tangential section of autozooecial aperture, SMF 23.423; (5) oblique section of a hollow cylindrical colony, SMF 23.425. (6–9) Hennigopora apta Perry and Hattin, Reference Perry and Hattin1960: (6) oblique section of a colony, SMF 23.466; (7) longitudinal section showing autozooecia and vesicles, SMF 23.466; (8, 9) tangential section showing autozooecia, acanthostyles, and vesicles; (8) SMF 23.462; (9) SMF 23.465. (1–3, 8) Scale bars = 0.5 mm; (4) scale bar = 0.1 mm; (5–7) scale bars = 1 mm; (9) scale bar = 0.2 mm.
Descriptive statistics of Hennigopora apta Perry and Hattin, Reference Perry and Hattin1960. N = number of measurements; X = mean; SD = sample standard deviation; CV = coefficient of variation; Min = minimum value; Max = maximum value; units = mm.
Occurrence
Osgood Formation (Telychian-Sheinwoodian), Silurian; Indiana, USA. Reynales Formation, Hickory Corners Member, Aeronian, Llandovery, lower Silurian; Hickory Corners, New York, USA.
Description
Encrusting colony, 1.25 mm thick. Autozooecia growing from thin epitheca, bending in the early exozone to the colony surface. Autozooecial diaphragms rare; straight, thin. Autozooecial apertures rounded polygonal, strongly petaloid due to indenting acanthostyles. Vesicles generally large, separating autozooecia in one row, 8–11 surrounding each autozooecial aperture, with rounded roofs, polygonal in tangential section. Acanthostyles abundant, relatively large, often deeply indenting autozooecial chambers, three to five surrounding each autozooecial aperture. Autozooecial walls displaying obscure granular microstructure, 0.005–0.015 mm thick. Maculae not observed.
Materials
SMF 23.462–SMF 23.469.
Remarks
Hennigopora apta Perry and Hattin, Reference Perry and Hattin1960 differs from H. florida (Hall, Reference Hall1852) in having smaller autozooecial apertures (0.17–0.25 mm versus 0.28–0.35 mm in H. florida).
Order Trepostomata Ulrich, Reference Ulrich1882
Suborder Halloporina Astrova, Reference Astrova1965
Family Monticuliporidae Nicholson, Reference Nicholson1881
Genus Homotrypa Ulrich, Reference Ulrich1882
[ = Homotrypella Ulrich, Reference Ulrich1882]
Type species
Homotrypa curvata Ulrich, Reference Ulrich1882. Upper Ordovician (Cincinnatian); North America.
Homotrypa niagarensis new species
Figures 8.1–8.9, 9.1; Table 4
Holotype
SMF 23.470–SMF 23.473 (four thin sections), SMF 23.474 (rock sample).
(1–9) Homotrypa niagarensis n. sp.: (1) colony in rock, holotype SMF 23.474; (2) branch oblique section, holotype SMF 23.470; (3) rock thin section with transverse and oblique sections of branches, holotype SMF 23.472; (4) branch oblique section, paratype SMF 23.488; (5, 6) longitudinal section of exozone showing autozooecia with diaphragms and cystiphragms, holotype SMF 23.470; (7) longitudinal section of outer exozone showing autozooecial chambers with series of cystiphragms, paratype SMF 23.483; (8, 9) tangential section showing autozooecial apertures and acanthostyles (arrow), holotype SMF 23.473. (1) Scale bar = 10 mm; (2) scale bar = 3 mm; (3, 4) scale bars = 5 mm; (5, 8) scale bars = 1 mm; (6, 9) scale bars = 0.5 mm; (7) scale bar = 0.2 mm.
Descriptive statistics of Homotrypa niagarensis n. sp. N = number of measurements; X = mean; SD = sample standard deviation; CV = coefficient of variation; Min = minimum value; Max = maximum value; units = mm.
Paratypes
SMF 23.475–SMF 23.502.
Diagnosis
Ramose branched colonies with narrow exozones; autozooecia long, bending at intermediate angles in exozone, having rounded polygonal apertures; basal diaphragms in exozone; cystiphragms large, abundant in exozone; mesozooecia rare to common, small; acanthostyles rare to common, large; autozooecial walls thick, laminated with distinct medial lining.
Occurrence
Osgood Formation (Telychian-Sheinwoodian), Silurian; Indiana, USA. Reynales Formation, Hickory Corners Member, Aeronian, Llandovery, lower Silurian; Hickory Corners, New York, USA.
Description
Branched colonies, branch diameter 2.20–6.10 mm. Exozone 0.27–1.10 mm wide, endozone 1.56–3.94 mm wide, distinct. Secondary overgrowths uncommon. Autozooecia long in the endozone, having larger diameters than in exozone, polygonal in transverse section of endozone, bending gently and intersecting branch surface at angles of 57°–62°. Autozooecial apertures rounded polygonal. Autozooecial diaphragms rare to absent in the endozone, concentrated mostly in transitional region between endo- and exozone, common to abundant in outer exozone. Cystiphragms occurring throughout the exozone, occupying about half of the autozooecial diameter. Mesozooecia rare, locally common, small, short, restricted to the outermost part of exozone, polygonal, containing no diaphragms. Acanthostyles rare to common, large, prominent, restricted to exozone, with narrow hyaline cores and wide laminated sheaths. Autozooecial walls straight, locally weakly undulating, displaying granular microstructure, 0.002–0.003 mm thick in endozone; finely laminated with distinct medial lining, 0.05–0.11 mm thick in exozone.
Etymology
The species name refers to the Niagara River, in which vicinity the type locality is situated.
Remarks
Homotrypa niagarensis n. sp. differs from H. anticostiensis Bassler, Reference Bassler and Twenhofel1928 from the Upper Ordovician of Canada in larger autozooecial apertures (aperture width 0.13–0.20 mm versus 0.09–0.14 mm in H. anticostiensis) and in absence of maculae consisting of mesozooecia. Homotrypa niagarensis n. sp. differs from H. ramulosa Bassler, Reference Bassler1903 from the Upper Ordovician of Indiana, USA, in larger acanthostyles and larger autozooecial apertures (aperture width 0.13–0.20 mm versus 0.10–0.13 mm in H. ramulosa).
Family Halloporidae Bassler, Reference Bassler1911
Genus Hallopora Bassler, Reference Bassler1911
Type species
Callopora elegantula Hall, Reference Hall1852, lower Silurian (Niagaran); USA.
Hallopora aff. H. elegantula (Hall, Reference Hall1852)
Figure 9.2–9.6; Table 5
Occurrence
Reynales Formation, Hickory Corners Member, Aeronian, Llandovery, lower Silurian; Hickory Corners, New York, USA.
(1) Homotrypa niagarensis n. sp.: part of branch transverse section showing thin-walled autozooecia in endozone and thick-walled autozooecia in exozone, holotype SMF 23.471. (2–6) Hallopora aff. H. elegantula (Hall, Reference Hall1852): (2) oblique section of branch with secondary overgrowth, SMF 23.504; (3) longitudinal section of exozone showing secondary overgrowth, autozooecia with diaphragms, and mesozooecia, SMF 23.504; (4) oblique section of branch showing long zooecia in endozone, SMF 23.531; (5) tangential section showing autozooecial apertures and mesozooecia, SMF 23.530; (6) longitudinal section showing autozooecia and mesozooecia, SMF 23.532. (7) Leioclema adsuetum n. sp.: longitudinal section of a branched colony with secondary overgrowth, paratype SMF 23.553. (1, 3, 6) Scale bars = 1 mm; (2, 7) scale bars = 2 mm; (4) scale bar = 3 mm; (5) scale bar = 0.5 mm.
Descriptive statistics of Hallopora aff. H. elegantula (Hall, Reference Hall1852). N = number of measurements; X = mean; SD = sample standard deviation; CV = coefficient of variation; Min = minimum value; Max = maximum value.
Description
Ramose colonies, branch diameter 2.60–6.60 mm. Exozone distinct, 0.45–1.40 mm wide, endozone 1.70–4.62 mm wide. Secondary overgrowths common, 0.8–1.3 mm thick. Autozooecia long, growing parallel to branch axis for a long distance in endozone, having rounded polygonal shape in transverse section in endozone, in exozone bending sharply and intersecting branch surface at angles of 60°–90°. Autozooecial apertures rounded to oval. Autozooecial diaphragms thin, planar, rare to common in endozone, becoming common in exozone, planar, rarely inclined, developed as extension of wall cortex. Cap-like apparati and mural spines absent. Mesozooecia arising in endozone, polygonal in cross section, often separating autozooecia completely from each other in the exozone, 5–13 surrounding each autozooecial aperture. Mesozooecial diaphragms planar, densely spaced. Autozooecial walls indistinctly laminated, 0.005–0.010 mm thick in endozone; displaying distinct reverse V-shaped structure with dark autozooecial border, having well-developed wall cortex continued in diaphragms, 0.04–0.08 mm thick in exozone. Maculae consisting of macrozooecia, 1.1–1.5 mm in diameter.
Materials
SMF 23.503–SMF 23.534.
Remarks
The present species is very similar to H. elegantula (Hall, Reference Hall1852). However, it differs in having smaller autozooecial apertures (0.27–0.32 mm versus 0.30–0.35 mm in H. elegantula) and smaller distances between aperture centers (0.30–0.47 mm versus 0.45–0.65 mm in H. elegantula). Hallopora aff. H. elegantula (Hall, Reference Hall1852) is very similar to H. baltica (Hennig, Reference Hennig1908) from the Silurian (Wenlock) of Gotland but differs in rare diaphragms in endozone and in closely spaced autozooecial apertures (approximately six apertures per 2 mm distance versus four in H. baltica).
The present species is also similar to the species Hallopora magnopora Foerste, Reference Foerste1887, which was originally described from the lower Silurian of Ohio and redescribed by Bassler (Reference Bassler1906) from the Rochester Shale (Wenlock) of New York. Both authors referred to “zooecia larger than is usual in species of this genus” (Foerste, Reference Foerste1887, p. 173; Bassler, Reference Bassler1906, p. 43). However, they did not provide exact measurements of the apertures. Foerste (Reference Foerste1887, p. 173) provided spacing of apertures as eight in 3 mm, and Bassler (Reference Bassler1906, p. 43) gave the value of four apertures per 2 mm. Aperture width measured from the illustrations by Bassler (Reference Bassler1906, pl. 15, fig. 1) are estimated as 0.35–0.40 mm, and these values are larger than in the present species (0.27–0.32 mm). Furthermore, according to illustrations in Bassler (Reference Bassler1906, pl. 15, figs. 1–8), H. magnopora has fewer mesozooecia than the present species.
Family Heterotrypidae Ulrich, Reference Ulrich1890
Genus Leioclema Ulrich, Reference Ulrich1882
[ = Lioclema Ulrich, Reference Ulrich1882]
Type species
Callopora punctata Hall, Reference Hall1858. Mississippian; Iowa, USA.
Leioclema adsuetum new species
Figures 9.7, 10.1–10.5; Table 6
Holotype
SMF 23.535.
Descriptive statistics of Leioclema adsuetum n. sp. N = number of measurements; X = mean; SD = sample standard deviation; CV = coefficient of variation; Min = minimum value; Max = maximum value.

Paratypes
SMF 23.536–SMF 23.558.
Diagnosis
Ramose branched colonies with narrow distinct exozones; secondary overgrowth occurring; autozooecia long, bending at mediate angles in exozone, having rounded polygonal apertures; basal diaphragms rare to absent in exozone; mesozooecia abundant, four to nine surrounding each autozooecial aperture; acanthostyles moderately large and abundant, two to five surrounding each autozooecial aperture; autozooecial walls laminated, moderate in thickness.
Occurrence
Osgood Formation (Telychian-Sheinwoodian), Silurian; Indiana, USA. Reynales Formation, Hickory Corners Member, Aeronian, Llandovery, lower Silurian; Hickory Corners, New York, USA.
Description
Ramose branched colonies, branch diameter 2.55–5.88 mm. Exozone distinct, 0.34–0.72 mm wide, endozone 1.48–4.44 mm wide. Secondary overgrowth common, 0.3–0.4 mm thick. Autozooecia long, growing parallel to branch axis for a long distance in endozone, having larger diameters than in exozone, polygonal in transverse section of endozone, in exozone bending sharply and intersecting branch surface at angles of 80°–90°, having polygonal shape in cross section in endozone. Autozooecial apertures polygonal. Autozooecial diaphragms rare to absent, thin, straight or slightly deflected proximally. Mesozooecia abundant, four to nine surrounding each aperture, polygonal in cross section, strongly beaded, containing abundant planar diaphragms. Acanthostyles moderately large, abundant, two to five surrounding each aperture, originating in the distal part of exozone, often indenting autozooecia, having distinct calcite cores and dark laminated sheaths. Walls granular, 0.005–0.008 mm thick in endozones; distinctly laminated, 0.040–0.045 mm thick in the exozone.
Etymology
The species name refers to the average appearance of this species (from Latin adsuetus meaning normal, usual).
Remarks
Leioclema adsuetum n. sp. differs from L. ramulosum (Bassler, Reference Bassler1906) from the Rochester Shale of New York in more abundant acanthostyles surrounding autozooecial apertures (2–5 versus 1–2 in L. ramulosum) and in having abundant diaphragms in mesozooecia. Leioclema adsuetum n. sp. differs from L. densiporum Owen, Reference Owen1965 from the lower Silurian of England in having less abundant acanthostyles surrounding autozooecial apertures (2–5 versus 8–12 in L. densiporum).
Order Cryptostomata Vine, Reference Vine1884
Suborder Rhabdomesina Astrova and Morozova, Reference Astrova and Morozova1956
Family Arthrostylidae Ulrich, Reference Ulrich1882
Genus Moyerella Nekhoroshev, Reference Nekhoroshev1956
Type species
Moyerella stellata Nekhoroshev, Reference Nekhoroshev1956. Llandovery, lower Silurian; Russia (Siberia).
Diagnosis (emended)
Thin ramose colonies, usually articulated. Axial region consisting of well-defined median axis or planar budding surface. Autozooecia shortened tubular, triangular in cross section in endozone, inflated at their bases, diverging from median axis in spiral pattern, bending abruptly in exozones. Diaphragms rare or absent. Hemisepta absent. Autozooecial apertures oval or rounded, arranged regularly in diagonal rows, commonly having peristomes. Zooecial boundaries well defined, narrow. Single large four-sided acanthostyle between longitudinally successive autozooecial apertures present. Paired heterozooecia (tectitozooecia after Kopajevich, Reference Kopajevich1975) present between successive autozooecial apertures. Tubules often present in peristomes.
Occurrence
Upper Ordovician of Argentina and Estonia; lower Silurian (Llandovery) of Siberia and Estonia and United States.
Remarks
Moyerella Nekhoroshev, Reference Nekhoroshev1956 is similar to Nematotrypa Bassler, Reference Bassler1911 in autozooecial shape and presence of acanthostyles and heterozooecia with diaphragms (tectitozooecia). However, Moyerella differs from Nematotrypa in the regular arrangement of paired heterozooecia between autozooecia and absence of hemiphragms.
Blake (Reference Blake and Robison1983, p. 561) mentioned paurostyles in the diagnosis of Moyerella. However, this kind of style is characterized by simple hyaline cores, whereas Moyerella has tubules that are deflections of the laminated skeletal material. Nekhoroshev (Reference Nekhoroshev1956, p. 47, pl. 11, fig. 3a) mentioned the presence of granules on ridges between apertures that are indeed tubules.
Moyerella parva new species
Figures 10.6, 11.1–11.10; Table 7
Holotype
SMF 23.559.
Descriptive statistics of Moyerella parva n. sp. N = number of measurements; X = mean; SD = sample standard deviation; CV = coefficient of variation; Min = minimum value; Max = maximum value.
Paratypes
SMF 23.560–SMF 23.633.
Diagnosis
Articulated colonies consisting of segments with pointed bases and widened proximal parts, apparently flexibly connected; segments cylindrical with narrow exozones; autozooecia moderately long, budding at low angles from the medial axis, triangular in endozone, bending abruptly in exozone; autozooecial diaphragms rare; paired heterozooecia regularly arranged between longitudinally successive autozooecial apertures; single acanthostyle between heterozooecia present; low ridges between apertures containing tubules.
Occurrence
Osgood Formation (Telychian-Sheinwoodian), Silurian; Indiana, USA. Reynales Formation, Hickory Corners Member, Aeronian, Llandovery, lower Silurian; Hickory Corners, New York, USA.
Description
Articulated colonies consisting of segments with pointed bases and widened proximal parts, apparently flexibly connected; segments cylindrical, 0.4–1.0 mm in diameter, with 0.1–0.3 mm wide exozones and 0.2–0.4 mm wide endozones. Branching unknown. Medial axis well developed. Autozooecia moderately long, inclined at angles of 16°–25° to the medial axis, having triangular shape in cross section in endozone, bending abruptly in exozone and intersecting the branch surface at angles of 49°–68°. Autozooecial diaphragms rare. Autozooecial apertures oval, arranged in distinct diagonal rows. Paired heterozooecia (tectitozooecia) arranged regularly between longitudinally successive autozooecial apertures, short, forming conical tubes, having triangular to pentagonal shape in cross section, 0.025–0.045 mm in width. Diaphragms in heterozooecia not observed. Autozooecial walls hyaline, 0.008–0.010 mm thick in endozone; reverse V-shaped laminated, 0.045–0.063 mm thick in exozone. Single acanthostyle between longitudinally successive autozooecial apertures present, 0.020–0.025 mm in diameter. Low ridges on the colony surface between autozooecial apertures producing four-sided pattern at junctions where acanthostyles are present. Dark tubules on ridges, 0.008–0.010 mm in diameter.
Etymology
The species name refers to the small size of this species (from Latin parva meaning small).
Remarks
Moyerella parva n. sp. is similar to M. stellata Nekhoroshev, Reference Nekhoroshev1956 from the lower Silurian (Llandovery) of Siberia but differs in possessing smaller diameter segments (0.40–1.00 mm versus 0.45–1.65 mm in M. stellata) and smaller autozooecial apertures (aperture width 0.06–0.09 mm versus 0.09–0.10 mm in M. stellata). Moreover, tectitozooecia of M. stellata have two to four diaphragms, whereas no diaphragms were observed in tectitozooecia of M. parva n. sp. Species Helopora formosa Billings, Reference Billings1866 from the Jupiter Formation (Llandovery) of the Anticosti Island is superficially similar to M. parva n. sp. in the shape of segments; however, no further details are known about this species.
Suborder Ptilodictyina Astrova and Morozova, Reference Astrova and Morozova1956
Family Ptilodictyidae Zittel, Reference Zittel1880
Genus Phaenopora Hall, Reference Hall1851
[ = Fimbriapora Astrova, Reference Astrova1965]
Type species
Phaenopora explanata Hall, Reference Hall1852. Silurian; Canada.
Phaenopora multifida (Hall, Reference Hall1883)
Figures 11.11–11.14, 12.1–12.3; Table 8
- 1883
Stictopora multifida Hall, p. 268, pl. 14, fig. 4.
- 1887
Phaenopora multifida (Hall, Reference Hall1883); Foerste, p. 160.
- 1888
Phaenopora multifida (Hall, Reference Hall1883); Foerste, pl. 16, fig. 3.
- 1893
Phaenopora multifida (Hall, Reference Hall1883); Foerste, p. 599, pl. 29, fig 3.
Descriptive statistics of Phaenopora multifida (Hall, Reference Hall1883). N = number of measurements; X = mean; SD = sample standard deviation; CV = coefficient of variation; Min = minimum value; Max = maximum value; units = mm.
Occurrence
Reynales Formation, Hickory Corners Member, Aeronian, Llandovery, lower Silurian; Hickory Corners, New York, USA. Clinton Group, Silurian; Ohio, USA.
Description
Broad and flattened bifoliate branches, 1.0–4.5 mm wide and 0.35–1.15 mm thick. Mesotheca zigzag folded in transverse section, three layered, 0.013–0.020 mm thick. Autozooecia short, rectangular in deep tangential section. Autozooecial apertures oval to rectangular with rounded corners, arranged in 8–13 rows. Superior and observer hemisepta present, long. Metazooecia small, shallow, having triangular to pentagonal apertures, arranged regularly in pairs between apertures. Autozooecial walls finely laminated, 0.010–0.013 mm thick in endozones; laminated, fused, thick in exozones. Wide longitudinal crests on colony surface present.
Materials
SMF 23.634-SMF 23.689.
Remarks
Phaenopora multifida (Hall, Reference Hall1883) differs from P. markhensis Nekhoroshev, Reference Nekhoroshev1961 from the lower Silurian (Llandovery) of Siberia in its smaller autozooecial apertures (aperture width 0.08–0.10 mm versus 0.10–0.13 mm in P. markhensis). Phaenopora multifida differs from P. contracta Astrova, Reference Astrova1959 from the Wenlock of Tuva (Russia) in thinner and narrower colonies and larger autozooecial apertures (aperture width 0.08–0.10 mm versus 0.06–0.07 mm in P. contracta).
Genus Ptilodictya Lonsdale, Reference Lonsdale and Murchison1839
Type species
Flustra lanceolata Goldfuss, Reference Goldfuss1829. Lower Silurian (Wenlock); Great Britain.
Ptilodictya sulcata Billings, Reference Billings1866
Figure 12.4–12.8; Table 9
- 1866
Ptilodictya sulcata Billings, p. 35.
- 1911
Ptilodictya gladiola; Bassler, p. 114, fig. 43.
- 1928
Ptilodictya sulcata; Bassler, p. 162, pl. 10, figs. 9–11.
- 1962
Ptilodictya gladiola; Kiepura, p. 405, pl. 9, fig. 1.
Descriptive statistics of Ptilodictya sulcata Billings, Reference Billings1866. N = number of measurements; X = mean; SD = sample standard deviation; CV = coefficient of variation; Min = minimum value; Max = maximum value; units = mm.
Lectotype
GSC 2501. Jupiter Formation (Aeronian-Telychian), Llandovery, lower Silurian; Anticosti, Canada.
Occurrence
Reynales Formation, Hickory Corners Member, Aeronian, Llandovery, lower Silurian; Hickory Corners, New York, USA. Upper Ordovician to lower Silurian; Anticosti, Canada. Porkuni Stage (Hirnantian); Estonia.
Description
Bifoliate branched colony with pointed base, 0.72–1.35 mm wide and 0.49–0.52 mm thick in its distal part. Mesotheca zigzag folded, three layered, 0.015–0.020 mm thick; median rods lacking. Autozooecia moderately long, rectangular in deep tangential section. Autozooecial apertures rectangular with rounded corners, arranged in eight or nine rows. Short hemisepta present. Occasional thin diaphragms occurring. Heterozooecia and styles absent. Autozooecial walls in endozone laminated with dark dividing layer, 0.018–0.023 mm thick; in exozone coarsely laminated. Maculae not observed.
Materials
SMF 23.690–SMF 23.694.
Remarks
The present material is similar to Ptilodictya sulcata Billings, Reference Billings1866. Ross (Reference Ross1960b) redescribed and depicted the lectotype as well as extensive additional material from the Upper Ordovician and lower Silurian of Anticosti. The present material differs in having narrower branches (branch width 0.72–1.35 mm versus 1.2–3.3 mm in the Canadian material). However, internal characteristics and aperture dimensions are identical; therefore, we identify the material from the Reynales Formation as P. sulcata.
Two more species of Ptilodictya were established from the Ordovician–Silurian deposits of North America that are quite close in their characteristics to P. sulcata: P. ensiformis (Hall, Reference Hall1852) and P. gladiola Billings, Reference Billings1866. Ross (Reference Ross1960b, p. 1068) studied the holotype of P. gladiola and supposed it being a synonym of P. ensiformis. This holotype was in bad condition, so Ross (Reference Ross1960b) could not find any morphological features for the species determination. She noted also that the majority of the material referred by Bassler (Reference Bassler and Twenhofel1928) to P. gladiola is in fact Stictoporella (Phaenopora) excellens (Billings, Reference Billings1866).
A general problem in the study of the lower Paleozoic cryptostomes is that many genera possess similar growth forms and dimensions but differ in their internal morphology. Inadequate descriptions and illustrations of original publications produce additional difficulty in discrimination of species. In some cases, study of the type material (or adequate material from type areas) has been possible. Material found at the National Museum of Natural History, Washington, D.C., contained three sets of specimens referred to Ptilodictya ensiforms (USNM PAL 35752, USNM PAL 69042, and USNM PAL 71560) and one set referred to P. gladiola (USNM PAL 57210). The latter material was referred by Bassler (Reference Bassler1911) from the Upper Ordovician of Estonia. This specimen is accompanied by a tangential thin section that reveals characteristic features of Ptilodictya. Dimensions and internal morphology of this specimen are close to those of the material from the Reynales Formation (width of autozooecial apertures 0.09–0.10 mm versus 0.07–0.08 mm in P. sulcata; spacing of apertures alongside the branch 0.21–0.29 mm versus 0.22–0.31 mm P. sulcata).
Study of photographs of the hypotype USNM PAL 69042 at the National Museum of Natural History, Washington, D.C., referred by Bassler (Reference Bassler and Twenhofel1928) to Ptilodictya ensiformis (Ordovician–Silurian of Anticosti), revealed the presence of two metazooecia between successive autozooecial apertures; therefore, this material is regarded as being Phaenopora. This species developed similar growth form with a pointed base, and it has dimensions similar to Ptilodictya sulcata and P. ensiformis.
The hypotype USNM PAL 35752 for Ptilodictya ensiformis (Hall, Reference Hall1852), referred by Bassler (Reference Bassler1906) from the Rochester Shale (Wenlock) of New York, shows typical features of Ptilodictya, but this material differs from the present species in larger autozooecial apertures (width of autozooecial apertures 0.13–0.17 mm versus 0.07–0.08 mm in P. sulcata) and wider spacing of apertures alongside the branch (0.43–0.53 mm versus 0.22–0.31 mm P. sulcata).
The specimen USNM PAL 71560, referred to by Butts (Reference Butts, Adams, Butts, Stevenson and Cook1926) as Ptilodictya ensiformis (Hall, Reference Hall1852) from the Paleozoic of Alabama, is indeed Phaenopora. This specimen has wide branches and two metazooecia between autozooecial apertures.
The species described by Kiepura (Reference Kiepura1962) as Ptilodictya gladiola Billings, Reference Billings1866 from erratic boulders of Poland shows similarities with the present material. It has branches of 0.8 mm width and apertures of ~0.08 mm width (measured from fig. 1 on pl. 9 in Kiepura, Reference Kiepura1962), which are close to present species. Internal morphology of the Polish material is unknown.
Ptilodictya sulcata is similar to P. exiliformis Suttner and Ernst, Reference Suttner and Ernst2007 from the Upper Ordovician of India (Pin Formation). The latter species has narrower branches (branch width 0.41–0.81 mm versus 0.72–1.35 mm in present material [up to ~3 mm given by other authors]). Ptilodictya differs from P. exilis Lavrentjeva in Gorjunova and Lavrentjeva, Reference Gorjunova and Lavrentjeva1993 from the Upper Ordovician (Katian) of Estonia in having smaller autozooecial apertures (aperture width 0.07–0.08 mm versus 0.10–0.13 mm in P. exilis).
Family Rhinidictyidae Ulrich, Reference Ulrich1893
Genus Metadictya Kopajevich, Reference Kopajevich1975
Type species
Hemipachydictya copiosa Kopaevich, 1970. Ordovician–Silurian (Ashgill, Llandovery); Estonia.
Metadictya sp.
Figures 12.9, 12.10, 13.1–13.3; Table 10
Occurrence
Reynales Formation, Hickory Corners Member, Aeronian, Llandovery, lower Silurian; Hickory Corners, New York, USA.
Descriptive statistics of Metadictya sp. N = number of measurements; X = mean; SD = sample standard deviation; CV = coefficient of variation; Min = minimum value; Max = maximum value; units = mm.
Description
Bifoliate branched colony, 1.5–2.5 mm wide and 0.60–0.65 mm thick. Mesotheca straight, three layered, 0.02–0.03 mm thick; median rods present. Autozooecia moderately long, rectangular in deep tangential section. Autozooecial apertures oval to rectangular with rounded corners, arranged in 9–13 rows. Hemisepta absent. Occasional thin diaphragms occur. Heterozooecia and styles absent. Autozooecial walls in endozone laminated with dark dividing layer, 0.015–0.020 mm thick; in exozone coarsely laminated, containing numerous spherules in autozooecia walls, regularly arranged in transverse bands. Spherules 0.010–0.015 mm in diameter.
Materials
SMF 23.695–SMF 23.704.
Remarks
Metadictya sp. differs from M. bifurcata (Hall, Reference Hall1883) from the lower Silurian (Llandovery) of Indiana in narrower and thinner branches (branch width 1.5–2.5 mm versus 4–5 mm in M. bifurcata; branch thickness 0.60–0.65 mm versus 2–3 mm in M. bifurcata). Foerste (Reference Foerste1887, p. 163) described material M. bifurcata from the lower Silurian of Ohio, and he gave longitudinal spacing of 5–5.5 apertures per 2 mm distance, which would closely fit with the present species (distance between aperture centers 0.34–0.40 mm [measured] versus 0.37–0.40 mm [converted] in M. bifurcata). Metadictya bifurcata (Hall, Reference Hall1883) has never been described and illustrated with use of thin sections from the type area, but this species was identified in some Ordovician localities in Europe (e.g., Bassler, Reference Bassler1911; Kiepura, Reference Kiepura1962; Spjeldnaes, Reference Spjeldnaes1984). However, the relationship of these materials to Metadictya bifurcata (Hall, Reference Hall1883) is questionable. Metadictya sp. differs from M. striatipora (Kopajevich, Reference Kopajevich, Astrova and Chudinova1970) from the lower Silurian (Llandovery) of Estonia in narrower and thinner branches as well as in smaller autozooecial apertures (aperture width 0.06–0.08 mm versus 0.11–0.28 m in M. striatipora).
Genus Trigonodictya Ulrich, Reference Ulrich1893
[ = Astreptodictya Karklins, Reference Karklins1969]
Type species
Pachydictya conciliatrix Ulrich, Reference Ulrich1886. Middle Ordovician (Decorah Shale); Minnesota, USA.
Trigonodictya sp.
Figure 13.4–13.7; Table 11
Occurrence
Reynales Formation, Hickory Corners Member, Aeronian, Llandovery, lower Silurian; Hickory Corners, New York, USA.
Descriptive statistics of Trigonodictya sp. N = number of measurements; X = mean; SD = sample standard deviation; CV = coefficient of variation; Min = minimum value; Max = maximum value; units = mm.
Description
Branched bifoliate, dichotomous colonies. Branches flattened, with sharp edges, 3.5 mm wide and 0.97 mm thick. Mesotheca three layered, straight both in longitudinal and transverse sections, containing abundant median rods, 0.02–0.03 mm thick. Median rods densely spaced, 0.01–0.02 mm in diameter, continuous in dark zones separating longitudinal rows of autozooecia. Autozooecia regularly arranged in 10 alternating longitudinal rows, semicircular to trapezoid in transverse section in endozone, rectangular in deep tangential section, becoming oval on the colony surface. Autozooecial boundaries distinct, delineated laterally by continuous dark zones. Basal diaphragms rare or absent, straight. Extrazooecial skeletal deposits well developed, consisting of laminar and vesicular portions. Vesicular structures small, having flat to rounded roofs, rare to common in inner exozones. Laminar stereom with dark zones, longitudinally aligned, separating autozooecia in exozones. Monticules absent.
Materials
SMF 23.705–SMF 23.709.
Remarks
Trigonodictya sp. is most similar to T. bifurcata instabilis (Foerste, Reference Foerste1887) from Llandovery of Ohio and to T. ambiqua (Ross, Reference Ross1961) from the Upper Ordovician and lower Silurian of Canada. Foerste (Reference Foerste1887, p. 164) provided the following measurements for his species: branch width 3–5 mm, branch thickness 1–2 mm, and six to seven apertures in 2 mm longitudinally. The latter value is larger than in the present species: six to seven versus four to five apertures per 2 mm. Ross (Reference Ross1961, p. 340) provided a comprehensive description of T. ambiqua accompanied by a large set of measurements. Trigonodictya sp. differs from T. ambiqua in larger autozooecial apertures (0.18–0.24 mm versus. 0.08–0.20 mm in T. ambiqua). Furthermore, T. ambiqua possesses few and small vesicular structures in endozone, which are larger and more abundant in the present species.
Order Fenestrata Elias and Condra, Reference Elias and Condra1957
Suborder Phylloporinina Lavrentjeva, Reference Lavrentjeva1979
Family Enalloporidae Lavrentjeva, Reference Lavrentjeva1985
Genus Chasmatopora Eichwald, Reference Eichwald1855
Type species
Retepora tenella Eichwald, Reference Eichwald1855. Upper Ordovician, Ashgill; Vormsi, Estonia.
Chasmatopora foerstei McKinney and Wyse Jackson, Reference McKinney and Wyse Jackson2010a
Figures 13.8, 14.1–14.3; Table 12
- non 1852
Retepora angulata Hall, p. 49, pl. 19, fig. 3a–h.
- ?1875
Retepora angulata?; Hall and Whitfield, p. 111, pl. 5, figs. 2–4.
- 1887
Phylloporina angulata (Hall, Reference Hall1852); Foerste, p. 151, pl. 15, figs. 1, 2.
- 1893
Phylloporina angulata (Hall); Foerste, p. 600, pl. 28, fig. 1.
- 1919
Chasmatopora angulata (Hall); Foerste, p. 369.
- 2010a
Chasmatopora foerstei McKinney and Wyse Jackson, p. 444, text-fig. 1A–F.
- 2010b
Chasmatopora foerstei McKinney and Wyse Jackson, p. 41.
Descriptive statistics of Chasmatopora foerstei McKinney and Wyse Jackson, Reference Suárez-Andrés and McKinney2010a. N = number of measurements; X = mean; SD = sample standard deviation; CV = coefficient of variation; Min = minimum value; Max = maximum value; units = mm.
Holotype
USNM 84851 (Foerste, Reference Foerste1893, fig. 1). Clinton Group, Silurian; Soldiers’ Home Quarries, Dayton, Ohio, USA.
Occurrence
Silurian (Llandovery); Ohio and New York, USA.
Description
Reticulate colony consisting of anastomosing branches with regular oval to lens-shaped fenestrules. Branches rounded to triangular in transversal section, 0.25–0.45 mm wide. Autozooecia long, having oblong-rectangular shape in deep tangential section, well-developed vestibules, arranged in three to four alternating rows on branches. Hemisepta absent. Diaphragms common, usually situated near the bend of autozooecia in exozone. Terminal diaphragms not observed. Autozooecial apertures oval, having distinct peristomes, surrounded by 8–10 nodes. Apertural nodes 0.010–0.015 mm in diameter. Keels absent. Nodes moderately large, regularly spaced on the obverse side. Internal granular skeleton well developed, 0.015–0.020 mm thick, continuous with medial laminae, peristomes, and microstyles. Outer laminated skeleton well developed, 0.08–0.09 mm thick. Reverse side striated, containing abundant microstyles. Microstyles 0.015–0.030 mm in diameter. Heterozooecia not observed.
Materials
SMF 23.710–SMF 23.733.
Remarks
Chasmatopora foerstei McKinney and Wyse Jackson, Reference McKinney and Wyse Jackson2010a differs from C. silurica (Kopajevich, Reference Kopajevich1975) from the Silurian (Llandovery) of Ukraine in its narrower branches (branch width 0.25–0.40 mm versus 0.59–0.63 mm in C. silurica). Chasmatopora foerstei is similar to C. granistriata (Ulrich, Reference Ulrich1890) from the Ordovician of the United States and Canada but differs from it in narrower branches (branch width 0.25–0.40 mm versus 0.30–0.50 mm in C. granistriata). Moreover, C. granistriata possesses keels on the obverse colony surface, which are absent in the present species.
Family Fenestellidae King, Reference King1849
Genus Fenestella Lonsdale, Reference Lonsdale and Murchison1839
Type species
Fenestella subantiqua d'Orbigny, Reference d'Orbigny1850. Lower Silurian (Wenlockian); England.
Fenestella jupiterensis Bassler, Reference Bassler and Twenhofel1928
Figure 14.4–14.7; Table 13
- 1928
Fenestella jupiterensis Bassler, p. 157, pl. 11, fig. 14, pl. 13, figs. 2, 3.
Descriptive statistics of Fenestella jupiterensis Bassler, Reference Bassler and Twenhofel1928. N = number of measurements; X = mean; SD = sample standard deviation; CV = coefficient of variation; Min = minimum value; Max = maximum value; units = mm.

Holotype
USNM PAL 69057. Jupiter Formation, Llandovery, Silurian; Anticosti, Canada.
Occurrence
Jupiter Formation, Llandovery, lower Silurian; Canada. Reynales Formation, Hickory Corners Member, Aeronian, Llandovery, lower Silurian; Hickory Corners, New York, USA.
Exterior description
Reticulate colony formed by straight branches joined by wide dissepiments. Fenestrules oval to rectangular. Autozooecia arranged in two rows on branches. Autozooecial apertures circular, with low peristome; 10–12 nodes in peristome, 0.008–0.010 mm in diameter; three to four apertures spaced per fenestrule length. Keel low, without nodes. Reverse side bearing nodes.
Interior description
Autozooecia relatively long, roughly rectangular in mid-tangential section with moderately long vestibule in longitudinal section. Axial wall between autozooecial rows straight; aperture positioned at distal end of chamber. Hemisepta absent. External laminated skeleton well developed on both obverse and reverse sides traversed by microstyles. Microstyles 0.010–0.015 mm in diameter. Heterozooecia not observed.
Materials
SMF 23.734–SMF 23.755.
Remarks
Fenestella jupiterensis Bassler, Reference Bassler and Twenhofel1928 differs from F. elegans Hall, Reference Hall1852 from the Rochester Shale (New York) in absence of nodes on the keel and spacing of three to four apertures per fenestrule instead four to five as in the latter species. Fenestella jupiterensis is similar to another species from the Jupiter Formation, F. anticostiensis Bassler, Reference Bassler and Twenhofel1928. Unfortunately, all these species are described very briefly, without thin sections and detailed measurements. F. anticostiensis also possesses medial keel without nodes but differs in slightly larger dimensions. Bassler (Reference Bassler and Twenhofel1928, p. 156–157) gave only the numerical parameter for the spacing of fenestrules: “3 fenestrules in 3 mm longitudinally and 4 in the same space transversely.” These measurements produce estimates for average values of the distance between dissepiment centers (1 mm versus 0.73 mm in the present species) and of the distance between branch centers (0.75 mm versus 0.46 mm in the present species).
Discussion
Ecological interpretation of the fauna
The bryozoan fauna from the Reynales Formation (lower Silurian, Aeronian) at Hickory Corners, near Lockport, New York, contains 13 species: one cyclostome (Diploclema argutum Bassler, Reference Bassler1906), two cystoporates (Cheilotrypa aff. C. variolata [Hall, Reference Hall1876] and Hennigopora apta Perry and Hattin, Reference Perry and Hattin1960), three trepostomes (Homotrypa niagarensis n. sp., Hallopora aff. H. elegantula [Hall, Reference Hall1852], and Leioclema adsuetum n. sp.), five cryptostomes (Moyerella parva n. sp., Phaenopora multifida [Hall, Reference Hall1883], Ptilodictya sulcata Billings, Reference Billings1866, Metadictya sp., and Trigonodictya sp.), as well as two fenestrates (Chasmatopora foerstei McKinney and Wyse Jackson, Reference McKinney and Wyse Jackson2010a and Fenestella jupiterensis Bassler, Reference Bassler and Twenhofel1928). This fauna is distinguished by the dominance of erect growth forms of different sizes and configurations. Hennigopora apta is the only strictly encrusting species, whereas Leioclema adsuetum is observed to have produced both encrusting and erect branched colonies, often with secondary overgrowths (Fig. 10.2, 10.3). Hallopora aff. H. elegantula (Hall, Reference Hall1852) is an erect branched species that also developed secondary overgrowths (Fig. 9.2, 9.3). Homotrypa niagarensis produced robust branched colonies with extremely rare secondary overgrowths.
(1–5) Leioclema adsuetum n. sp.: (1) longitudinal section of exozone showing autozooecia, mesozooecia, and acanthostyles, paratype SMF 23.553; (2, 3) oblique section showing autozooecia in endozone and exozone and mesozooecia, holotype SMF 23.535; (4, 5) tangential section showing autozooecial apertures, mesozooecia, and acanthostyles, holotype SMF 23.535. (6) Moyerella parva n. sp.: branch transverse section, paratype SMF 23.616. (1, 3, 4) Scale bars = 0.5 mm; (2) scale bar = 1 mm; (5, 6) scale bars = 0.2 mm.
Cheilotrypa aff. C. variolata produced erect hollow, pseudotubular colonies. Separate encrusting sheets of this bryozoan are extremely rare, apparently present only in its basal parts. However, it can be assumed that this species is not truly tubular but represents an encrustation of a soft-bodied, erect branching organism (likely algae) by bioimmuration. After decay of the encrusted organism, the rigid bryozoan colony retained its shape. The interiors of wider tubes are usually filled by micrite (Figs. 6.4, 6.5, 6.7, 6.8, 7.1, 7.5), whereas narrower tubes are commonly filled by sparry calcite (Fig. 6.6). Presence of micrite implies access to the seawater with sediment particles, which means that the larger tubes were not completely encrusted by bryozoans. By contrast, smaller individuals of the soft-bodied organism were probably completely encrusted by bryozoans. Locally, contact between the bases of the encrusting sheets and the substrate is observed (Figs. 6.7, 6.8, 7.5). Longitudinal sections reveal regularly narrowing portions, which apparently display the form of the encrusted organism. This encrustation may have been obligatory because no other objects (except a few sheets on the substrate) are encrusted by this bryozoan.
The nature of the bioimmured organism remains unclear. Regular narrowings are typical of algae and sponges. In both cases, the bioimmuration must have been detrimental as access to seawater and light would have been interrupted. The majority of tube lumens are rounded or oval, but many are also narrowly ovoid (Figs. 6.8, 7.1). That may represent the original shape of the soft-bodied organism or could have occurred due to collapse of the bryozoan tube after the decomposition of the encrusted host.
Hollow tubular or hollow cylindrical growth forms were called ‘pseudoviniculariform’ by Stach (Reference Stach1936) and are typically the result of encrusting forms that completely surround the stem of a host plant or animal substrate (Hageman et al., Reference Hageman, Bock, Bone and McGowran1998). Mature colonies are able to continue their growth as erect arborescent forms with hollow branches (Hageman et al., Reference Hageman, Bock, Bone and McGowran1998). Bryozoans encrust various soft-bodied organisms of cylindrical shape, such as algae, sponges, ascidians, and octocorals. Encrustation of ephemeral substrates is very common in modern cool-water carbonates but apparently less common in pre-Cretaceous bryozoan-rich environments (Hageman et al., Reference Hageman, James and Bone2000). However, hollow cylindrical colonies repeatedly occurred among Paleozoic bryozoans, notably in cystoporates and trepostomes, which potentially develop encrusting colonies. Representatives of the orders Fenestrata and Cryptostomata developed mainly arborescent colonies of various configurations. However, exceptions are known in both of these orders. For example, cryptostome genus Rhabdomeson developed obligatory cylindrical colonies, with a central cylinder that is considered to be a polymorph (Blake,Reference Blake1976, Reference Blake and Robison1983). In fenestrates, the genus Bigeyina is known to form hollow conical colonies (Suárez-Andrés and McKinney, Reference Suárez-Andrés and McKinney2010).
Hollow cylindrical colonies of Cheilotrypa ostiolata (Hall, Reference Hall1852) are abundant in the younger Rochester Shale (Wenlock) of New York (Bassler, Reference Bassler1906). Longitudinal sections of this bryozoan show regular narrowings similar to those in material from the Reynales Formation (Bassler Reference Bassler1906, pl. 9, fig. 4). However, the voids in the Rochester Shale bryozoan are narrower than those in Cheilotrypa aff. C. variolata: 0.22–0.35 mm versus 0.42–1.35 mm. Cheilotrypa ostiolata (Hall, Reference Hall1852) from the Rochester Shale also appears to have been an obligatory encruster of its host substrates, with minor development of freely encrusting sheets. Arborescent colonies have advantages over encrusting bryozoans in their higher tiering (and consequently, better feeding and reproductive capacity) and escape from competition for substrate (McKinney and Jackson, Reference McKinney and Jackson1989). Otherwise, it has been observed that sessile animals tend to avoid erect growth in the presence of predators and switch to encrusting mode of growth (e.g., Guida, Reference Guida1976; McKinney and Jackson, Reference McKinney and Jackson1989). Absence of predation in the Silurian, in addition to other ecological factors, may also have favored development of hollow cylindrical colonies instead of simply encrusting ones. The flexibility of bryozoans in developing various growth forms depending on their ecological situation (e.g., Harmelin, Reference Harmelin1976) is also a strongly confusing factor for taxonomists who can misinterpret growth form as taxonomic character, which could be utilized for discrimination of species or even genera.
Cryptostome bryozoans are represented by one rhabdomesid species and four ptilodictyines. Moyerella parva developed an articulated colony consisting of flexibly connected segments. Separate segments have tapered bases and widened apical parts representing ‘sockets.’ Such colonies are ubiquitous among arthrostylid cryptostomes (e.g., Wyse Jackson et al., Reference Wyse Jackson, Ernst and Suárez Andrés2017) and even more common in Cenozoic cyclostomes and cheilostomes (Taylor and James, Reference Taylor and James2013). Stach (Reference Stach1936) named such colonies ‘cellariiform,’ after the cheilostome bryozoan Cellaria. This type of the colony form was initially assumed to be adapted for the life in agitated, rather shallow waters; however, such forms have also been found in depths up to 250 m in the modern (e.g., Bone and James, Reference Bone and James1993; Moissette, Reference Moissette2000; Amini et al., Reference Amini, Adabi, Burrett and Quilty2004).
Four ptilodictyine species developed bilaminate (bifoliate) colonies in which zooecia open on both sides of a flat, lenticular branch (e.g., Figs. 11.13, 12.7, 12.9, 13.4). Ptilodictyines were an extremely successful group in the Ordovician and to a similar extent in the Silurian, but they declined in the middle Paleozoic and disappeared in the early Permian (Karklins, Reference Karklins and Robison1983; Gorjunova and Lavrentjeva, Reference Gorjunova and Lavrentjeva1993; Ernst and Nakrem, Reference Ernst and Nakrem2007). Ptilodictya sulcata from the described fauna developed a lanceolate colony with a tapering proximal segment (Fig. 12.4) that was apparently flexibly joined to a socket-shaped base, which is usual in Ptilodictya (Hennig, Reference Hennig1905; Ross, Reference Ross1960a, b). Three other ptilodictyine species seem to have been firmly attached to the substrate.
(1–10) Moyerella parva n. sp.: (1–3) longitudinal section of a colony segment with a pointed base and widened proximal part showing medial axis and autozooecia, holotype SMF 23.559; (4) tangential section showing autozooecial apertures, tubules, and tectitozooecia, holotype SMF 23.559; (5) longitudinal section of a colony showing medial axis and autozooecia, paratype SMF 23.580; (6) longitudinal section of a colony showing shape of autozooecia, paratype SMF 23.575; (7) tangential section showing autozooecial apertures, tubules, and metazooecia (arrows), paratype SMF 23.578; (8) tangential section showing autozooecial apertures, tubules, and acanthostyles (arrows), paratype SMF 23.621; (9, 10) tangential section showing autozooecial apertures and acanthostyles, paratype SMF 23.602. (11–14) Phaenopora multifida (Hall, Reference Hall1883): (11, 12) tangential section showing autozooecial apertures and metazooecia divided by longitudinal crests, SMF 23.671; (13, 14) branch transverse section showing mesotheca, autozooecia, and metazooecia, SMF 23.670. (1–3, 5, 6, 9, 12, 13) Scale bars = 0.5 mm; (4, 7, 8, 10, 14) scale bars = 0.2 mm; (11) scale bar = 1 mm.
(1–3) Phaenopora multifida (Hall, Reference Hall1883): (1, 2) tangential section showing autozooecial apertures and metazooecia, SMF 23.671; (3) longitudinal section showing superior and inferior hemisepta, SMF 23.638. (4–8) Ptilodictya sulcata Billings, Reference Billings1866: (4, 5) branch oblique section showing autozooecial chambers, SMF 23.693; (6) tangential section showing autozooecial apertures, SMF 23.694; (7, 8) branch transverse section showing autozooecial chambers and mesotheca, SMF 23.691. (9, 10) Metadictya sp.: branch oblique section showing autozooecial chambers and mesotheca, SMF 23.703. (1–3, 5, 8) Scale bars = 0.2 mm; (4, 6, 7, 9, 10) scale bars = 0.5 mm.
(1–3) Metadictya sp.: (1) branch oblique section showing autozooecial chambers and mesotheca with tubules (arrow), SMF 23.695; (2, 3) branch oblique section showing autozooecial apertures and spherules (arrow), SMF 23.695. (4–7) Trigonodictya sp.: (4, 5) branch transverse section showing autozooecial chambers, vesicles, and mesotheca with tubules (arrow), SMF 23.706; (6, 7) tangential section showing autozooecial apertures and vesicles, SMF 23.708. (8) Chasmatopora foerstei McKinney and Wyse Jackson, Reference McKinney and Wyse Jackson2010a: tangential section showing branches with autozooecia, SMF 23.730. (1) Scale bar = 0.2 mm; (2, 4, 8) scale bars = 1 mm; (3, 5–7) scale bars = 0.5 mm.
(1–3) Chasmatopora foerstei McKinney and Wyse Jackson, Reference McKinney and Wyse Jackson2010a: tangential section showing autozooecial chambers and apertures with nodes, nodes between autozooecial apertures, and microstyles on the reverse side of branches, SMF 23.710. (4–9) Fenestella jupiterensis Bassler, Reference Bassler and Twenhofel1928: (4–7) tangential section showing autozooecial chambers and apertures with nodes (arrow) and keel without nodes, SMF 23.740; (8) branch transverse section, SMF 23.745; (9) tangential section showing reverse side of branch with nodes (arrows) and microstyles, SMF 23.740. (1, 4) Scale bars = 1 mm; (2, 5, 6, 9) scale bars = 0.5 mm; (3, 7, 8) scale bars = 0.2 mm.
The majority of studies devoted to the distribution of bryozoan growth forms with depth have been conducted on modern faunas. These interpretations may not be precisely analogous to similar Paleozoic growth forms, but the general trends may be similar (Taylor, Reference Taylor2005). The modern bryozoan faunas, for example, show an increasing ratio of erect species with depth (e.g., Schopf, Reference Schopf1969; Schopf et al., Reference Schopf, Collier and Bach1980; McKinney and Jackson, Reference McKinney and Jackson1989; Moissette, Reference Moissette2000; Amini et al., Reference Amini, Adabi, Burrett and Quilty2004).
The common usage of the term ‘fenestrate’ appears confusing in regard to reticulate, net-like colonies produced by branches jointed by dissepiments or fused together (anastomosing). In the taxonomic sense, ‘fenestrate’ means belonging to the order Fenestrata, which includes a variety of forms and is restricted to the Paleozoic. For the description of such colonies, the terms ‘reticulate’ or ‘net-like’ are more appropriate and concern rather the form than the taxonomic assignment. Reticulate colonies appeared convergently in various bryozoan groups in both stenolaemate and gymnolaemate clades, presumably because they are efficient for filtering (e.g., Cowen and Rider, Reference Cowen and Rider1972; McKinney, Reference McKinney1977; McKinney and Jackson, Reference McKinney and Jackson1989; Taylor and James, Reference Taylor and James2013). Bryozoans with reticulate colony shapes are regarded as being adapted to various types of environments, although generally avoiding shallow high-energy biotopes (e.g., McKinney and Gault, Reference McKinney and Gault1980; Kelly and Horowitz,Reference Kelly, Horowitz and Ross1987; Nelson et al., Reference Nelson, Hyden, Keane, Leask and Gordon1988; Amini et al., Reference Amini, Adabi, Burrett and Quilty2004).
Bryozoans of the Reynales Formation show medium robustness of their colonies. They can be divided into delicate (< 2 mm in thickness/diameter) and robust (> 2 mm) forms. The former category includes six species: Diploclema argutum, Hennigopora apta, Moyerella parva, Ptilodictya sulcata, Chasmatopora foerstei, and Fenestella jupiterensis. The latter category includes seven species: Cheilotrypa aff. C. ariolate, Homotrypa niagarensis, Hallopora aff. H. elegantula, Leioclema adsuetum, Phaenopora multifida, Metadictya sp., and Trigonodictya sp. The robustness can be considered as a factor of depth. In general, deeper faunas contain species with more delicate colonies (e.g., Thomsen, Reference Thomsen1977; Schopf et al., Reference Schopf, Collier and Bach1980; Amini et al., Reference Amini, Adabi, Burrett and Quilty2004).
Summarizing the colony shapes and their robustness, we conclude that the fauna from the Reynales Formation at Hickory Corners existed on stable substrate under moderate wave energy conditions. Scarcity of encrusting forms as far as relatively high proportion of delicate colonies indicates a relatively deeper and quiet environment. The low level of fragmentation of organic remnants (Figs. 4.1, 8.1) supports the absence of strong currents. However, the presence of thick-branched trepostomes and such lithological characteristics as well-washed sparry grainstones (Fig. 4.2) points to relatively high wave activity. Flexibly jointed colonies (Moyerella, Ptilodictya) are adapted for both kinds of biotopes. The presence of large branched trepostomes and lenticular cryptostomes suggests significant stability of the substrate. In general, the bryozoan fauna correlates well with the interpretation made by Brett et al. (Reference Brett, Boucot and Jones1993) for this area as belonging to Benthic Assemblage 4 situated in the shallow (30–60 m depth) outer shelf environment.
Species richness within samples
Paleozoic bryozoans have an immense advantage over many other fossils in that they can be identified even as small fragments because of their modularity and specific skeletal material (mainly low-magnesium calcite). Their study must be undertaken with use of thin sections. In case the isolation of separate colonies from solid rock is impossible, preparation of serial thin sections appears the best method for study. Collected material from the Reynales Formation included ~40 fist-sized (~10 × 10 cm) rock samples from which 20 samples were used for preparation of thin sections (11 thin sections of 24 × 48 mm size and 67 thin sections of 50 × 50 mm size). All samples were taken from the same stratigraphical and ecological level alongside the outcrop. Thin sections were oriented both in plane of bedding and perpendicular to it. The number of thin sections varied from 1 to 11 per sample. On average, 6 bryozoan species occurred per large thin section (50 × 50 mm object glass, roughly 16 square cm of rock surface), varying from 3 to 8. The number of species per sample varied from 6 to 11, averaging 8 species per sample (Table 14). The richness of bryozoans generally increased with the number of thin sections per sample, but not in all cases. Sample HC-23 includes 3 thin sections that contain a total of 11 species, whereas the sample HC-19 contains 8 species in 8 thin sections.
Species distribution in the studied material (78 thin sections of 20 rock samples). 1 = Diploclema argutum; 2 = Cheilotrypa aff. C. variolata; 3 = Hennigopora apta; 4 = Homotrypa niagarensis; 5 = Hallopora aff. H. elegantula; 6 = Leioclema adsuetum; 7 = Moyerella parva; 8 = Phaenopora multifida; 9 = Ptilodictya sulcata; 10 = Metadictya sp.; 11 = Trigonodictya sp.; 12 = Chasmatopora foerstei; 13 = Fenestella jupiterensis.
Diploclema argutum, Cheilotrypa aff. C. variolata, Moyerella parva, and Phaenopora multifida occur in almost every thin section. Chasmatopora foerstei and Fenestella jupiterensis are also very common, occurring in more than 90% of thin sections. Hallopora aff. H. elegantula occurs in 70% of samples, and Leioclema adsuetum is present in 50% of samples. Hennigopora apta, Ptilodictya sulcata, Metadictya sp., and Trigonodictya sp. are uncommon, occurring in less than 25% of samples.
Moyerella parva is the most abundant species by the number of fragments found in the thin sections. This can be explained as a taphonomic effect. Moyerella parva possessed an articulated colony, which apparently consisted of several segments connected by flexible organic joints. After death and decomposition of organic material of joints, the segments were disseminated in the sediment. Therefore, the number of segments should be higher than the number of individual colonies.
Biogeography
The studied bryozoan fauna contains mainly cosmopolitan genera such as Hallopora, Homotrypa, Leioclema, and Phaenopora. Outside North America, Diploclema is known in Europe (Gotland, Great Britain, and Estonia). This genus might have a wider distribution, however, as it can be easily overlooked because of its small size. Silurian species of Cheilotrypa are mainly restricted to North America. By contrast, Moyerella was previously known only from Estonia and Russia. Hennigopora is temporally restricted to the Silurian; geographically, however, the lower Silurian species of Hennigopora are known from North America, China, and Russia. Metadictya is known from the Silurian of North America and Europe (Sweden and Estonia). Silurian species of Trigonodictya are restricted to North America, whereas the Silurian Ptilodictya species are known from North American and European localities as well as from Siberia.
The identified species have rather local relations except Diploclema argutum (Bassler, Reference Bassler1906), which was also identified in Europe (Sweden and Estonia). Hennigopora apta Perry and Hattin, Reference Perry and Hattin1960 was originally described from the Osgood Formation (Telychian-Sheinwoodian) of Indiana, USA. Phaenopora multifida (Hall, Reference Hall1883) is known from the Clinton Group of Ohio. Chasmatopora foerstei McKinney and Wyse Jackson, Reference McKinney and Wyse Jackson2010a is known from different localities of the Clinton Group in Ohio and New York. Fenestella jupiterensis Bassler, Reference Bassler and Twenhofel1928 was originally described from the Jupiter Formation (Llandovery, Telychian, lower Silurian) of Anticosti, Canada. Ptilodictya sulcata Billings, Reference Billings1866 is known from the Upper Ordovician to lower Silurian succession of Anticosti. Furthermore, this species is present in the Upper Ordovician of Estonia (Bassler, Reference Bassler1911) and in erratic boulders of Poland (Kiepura, Reference Kiepura1962).
Conclusions
Bryozoan fauna from the Brewer Dock (Hickory Corners) Member of the Reynales Formation (lower Silurian, Aeronian) at the type locality, Hickory Corners on Lockport Junction Road, in western New York, USA, is abundant and moderately diverse. The studied assemblage contains 13 species, from which 3 are new: trepostomes Homotrypa niagarensis n. sp. and Leioclema adsuetum n. sp. and the rhabdomesine cryptostome Moyerella parva n. sp. This fauna is clearly dominated by erect growth forms of various shapes and robustness. The minority of encrusting forms (one obligatory species) and equal ratio of delicate and robust forms suggest a moderately agitated environment with a stable substrate. Bryozoans are abundant and diverse within separate samples, with an average of six species occurring within a single thin section of ~16 cm2 surface area. The species composition reveals paleobiogeographic connections to other Silurian localities of New York as well as Ohio and Indiana (USA) and Anticosti (Canada), whereas the generic composition suggests connections with bryozoan faunas of Laurentia and Baltica.
Acknowledgments
A. Ernst thanks the Deutsche Forschungsgemeinschaft (DFG) for financial support (grant ER 278/7.1) and J. Sanner, Washington, for kind help with photographing of the type material at the National Museum of Natural History. P.D. Taylor, London, helped with valuable comments on bryozoan morphology. M. Wilson thanks the Luce Fund at The College of Wooster for supporting the fieldwork. C. Brett acknowledges work with former students C. Clement, J.D. Eckert, S.T. LoDuca, and D. Tetreault, and well as his long-term friend and colleague, the late M.A. Pearce, who grew up in nearby Pekin, New York, and introduced him to the Lockport region and to W. Kilgour. These experiences fueled CB's interests in the Silurian of the Niagara Escarpment. C. Buttler, Cardiff, and an anonymous reviewer are thanked for their helpful and constructive reviews.


 Open access