

Introduction
From a physiological standpoint, selenium (Se) is an essential trace element for both humans and aquatic animals, including fish, playing a critical role in cellular defence against oxidative damage caused by free radicals. This protective function is largely attributed to its involvement as a key component of the enzyme glutathione peroxidase (Watanabe et al., Reference Watanabe, Kiron and Satoh1997). Although natural geomorphological processes can contribute to Se presence in aquatic ecosystems, human-induced activities such as wastewater discharge, emissions from coal-fired power plants, processing of metal ores, aquaculture runoff, and associated sludge are major contributors to elevated Se levels in these environments (Lemly, Reference Lemly2002). While a moderate amount of Se may support immune function in fish by protecting neutrophils from oxygen-derived radicals (Arthur et al., Reference Arthur, McKenzie and Beckett2003), excessive exposure can lead to oxidative stress and increased superoxide production (Spallholz and Hoffman, Reference Spallholz and Hoffman2002). Toxicologically, reactive oxygen species (ROS) are a major concern due to their strong association with the harmful effects of various environmental contaminants. The cellular anti-oxidant defence mechanisms that counteract these disturbances operate primarily within intracellular compartments (Ates et al., Reference Ates, Orun, Talas, Durmaz and Yilmaz2008; Orun et al., Reference Orun, Talas, Ozdemir, Alkan and Erdogan2008; Talas et al., Reference Talas, Orun, Ozdemir, Erdogan, Alkan and Yılmaz2008).
Superoxide dismutase (SOD), as a primary line of defence against oxidative stress, particularly against superoxide anion radicals, catalyses the dismutation of superoxide anions into hydrogen peroxide (H₂O₂) and molecular oxygen, thereby preventing potential cellular damage (McCord and Fridovich, Reference McCord and Fridovich1969; Das et al., Reference Das, Lewis-molock and White1997). Glutathione (GSH), a thiol-containing tripeptide and one of the most abundant intracellular anti-oxidants, plays a vital role as a redox buffer and participates in multiple cellular processes, including scavenging free radicals, enhancing immune function, DNA synthesis, and detoxification through conjugation reactions that are facilitated by glutathione S-transferases (GSTs) (Nordberg and Arnér, Reference Nordberg and Arnér2001; Xue et al., Reference Xue, Chen, Ge, Guan and Han2022). Catalase (CAT; EC 1.11.1.6), which decomposes H₂O₂ to water and oxygen and thereby reduces oxidative pressure, is predominantly localized in peroxisomes and is essential for detoxifying ROS under stress conditions (Aebi, Reference Aebi1984; Chiappero et al., Reference Chiappero, Del Rosario Cappellari, Palermo, Giordano, Khan and Banchio2021).
Although Se is known to offer neuroprotective benefits in the presence of neurotoxic agents (Panter et al., Reference Panter, Hartley, James, Mayland, Stegelmeier and Kechele1996), it can become neurotoxic itself when present at elevated concentrations, potentially leading to damage within the nervous system (Imam et al., Reference Imam, El-yazal, Newport, Itzhak, Cadet, Slikker and Ali2001; Zafar et al., Reference Zafar, Siddiqui, Sayeed, Ahmad, Salim and Islam2003). Acetylcholine (ACh) is a key neurotransmitter that facilitates neuromuscular communication in the peripheral nervous system and enhances sensory processing in the central nervous system. In fish, the enzyme acetylcholinesterase (AChE) serves as the main regulatory component of the cholinergic system, ensuring proper transmission and modulation of nerve signals at cholinergic synapses. Numerous studies have reported a marked reduction in AChE activity in fish exposed to environmental pollutants such as organophosphates, heavy metals, and other chemicals, despite the enzyme’s high activity in the fish nervous system (Modesto and Martinez, Reference Modesto and Martinez2010). As a result, suppression of AChE activity is widely recognized as a reliable biomarker for evaluating neurotoxic effects in aquatic organisms (Manzo et al., Reference Manzo, Castoldia, Coccinia, Rossia, Nicoteraa and Costaa1995).
When present in concentrations exceeding safe thresholds, Se can adversely affect immune responses, particularly those associated with oxidative stress (Fairbrother and Fowles, Reference Fairbrother and Fowles1990; Fairbrother et al., Reference Fairbrother, Fix, O’hara and Ribic1994). In fish, lysozyme functions as a key component of the innate immune system, acting as an effective bacteriolytic agent against microbial pathogens (Yousif et al., Reference Yousif, Albright and Evelyn1994). The activity of lysozyme can be influenced by several factors, including the physiological condition of the fish, exposure to stress, sex, temperature fluctuations, and the presence of environmental contaminants, particularly heavy metals in the water (Balfry and Iwama, Reference Balfry and Iwama2004; Saurabh and Sahoo, Reference Saurabh and Sahoo2008). Peroxidase activity is another important immunological marker, commonly used to assess leukocyte activation, which reflects the immune system’s status under different conditions (Tapia-Paniagua et al., Reference Tapia-Paniagua, Reyes-becerril, Ascencio-valle, Esteban, Clavijo, Balebona and Moriñigo2011). Additionally, measuring antiprotease levels is considered an effective method for evaluating the innate immune response and assessing how environmental stressors may impair the fish’s ability to resist pathogens (Ellis, Reference Ellis2001; Saurabh and Sahoo, Reference Saurabh and Sahoo2008).
This study was based on the hypothesis that elevated levels of Se in aquatic environments would influence the physiological functions and immune responses of the fish species Sparidentex hasta. To test this, the effects of varying Se concentrations on oxidative stress markers, neurotoxic responses, and non-specific immunity were investigated over two exposure durations: 2 weeks and 4 weeks.
Materials and methods
Fish maintenance and conditions
Juvenile specimens of S. hasta were sourced from a marine aquaculture facility in Hormozgan Province, located in southern Iran. Prior to experimental exposure, the fish were acclimated under controlled laboratory conditions for a duration of 15 days. During this period, they were maintained on a 12-hour light/12-hour dark cycle at ambient temperature and fed twice daily using a commercial feed (Biomar). Following acclimatization, 120 healthy individuals (mean length: 14.6 ± 1.7 cm; mean weight: 87.4 ± 5.6 g) were randomly distributed into glass aquaria (20 L each), with six fish per tank. Water quality parameters were monitored throughout the experimental period and are summarized in Table 1. The experimental groups were exposed to selenium in the form of sodium selenite (Sigma, St. Louis, MO, USA) at concentrations of 0 (control), 40, 80, 160, 320, and 400 µg L−1. While the upper concentrations (320 and 400 µg L−1) exceed typical environmental levels, they were included to assess potential toxic effects of high Se exposure. Each day, 50% of the aquarium water was renewed with freshly prepared saltwater (salinity: 38ppt) containing the same Se concentration to ensure consistent exposure levels. At the end of the 2- and 4-week exposure periods, the fish were anesthetized using buffered 3-aminobenzoic acid ethyl ester methanesulfonate for sample collection.
Water and environmental quality parameters in different experimental treatments

Table 1 Long description
The table summarizes water and environmental quality measurements, listing each parameter with a typical value or range. Water temperature is about 30 degrees C with small variation, and air temperature ranges from 30.5 to 31.2 degrees C. Acidity is slightly alkaline, with pH from 7.63 to 7.91, and salinity is about 38 parts per thousand. Nitrogen waste indicators are low: nitrite is at or below 0.07 parts per million, nitrate is at or below 5 parts per million, and ammonia is approximately zero. Chemical oxygen demand is low at about 1.22 milligrams per liter with modest variability. Dissolved oxygen is high, ranging from 8.5 to 9.4 milligrams per liter. Some entries are reported as approximate values or upper limits, so they indicate typical conditions rather than exact single measurements.
Anti-oxidant enzyme analysis
Liver and gill tissues collected from euthanized juvenile fish were processed by homogenizing each sample in a tenfold volume of ice-cold homogenization buffer using a tissue homogenizer. The homogenates were subsequently centrifuged at 10,000 × g for 30 minutes at a refrigerated temperature, and the resulting supernatants were stored at −80 °C until further analysis. To determine SOD activity, a colorimetric SOD Assay Kit was employed. The assay measured enzyme activity based on the inhibition of the WST-1 reduction reaction by superoxide anions. One unit of SOD activity was defined as the enzyme quantity present in 20 µL of sample that results in a 50% inhibition of this reaction. Final SOD activity values were expressed as units per milligram of protein (U mg−1 protein).
GST activity was measured using a modified version of the protocol originally described by Habig (Reference Habig, Pabst and Jakoby1974). The reaction mixture included 0.2 M phosphate buffer at pH 6.5, 10 mM reduced GSH, and 10 mM 1-chloro-2,4-dinitrobenzene, all obtained from Sigma (St. Louis, USA). The enzymatic activity was determined by monitoring the change in absorbance at 340 nm at a constant temperature of 25 °C. GST activity was calculated and reported as nanomoles of product formed per minute per milligram of protein (nmol min−1 mg protein−1).
To evaluate the reduction of GSH level, 0.2 mL of the tissue supernatant was first diluted with 1.8 mL of distilled water. This mixture was then combined with 3.0 mL of a precipitation solution containing 1.67 g of metaphosphoric acid, 0.2 g of ethylenediaminetetraacetic acid, and 30 g of NaCl dissolved in 100 mL of distilled water. Following thorough mixing, the sample was centrifuged at 10,000 × g for 5 minutes. From the resulting supernatant, 1.0 mL was transferred to 4.0 mL of 0.3 M sodium phosphate (NaHPO₄) buffer, and 0.5 mL of DTNB (5,5′-dithiobis-2-nitrobenzoic acid) was added. The absorbance difference between DTNB-treated and untreated samples was measured at 412 nm to determine GSH level. Final results were expressed as micromoles of GSH per milligram of protein (µmol mg−1 protein).
CAT activity was assessed following the procedure outlined by Cohen et al. (Reference Cohen, Dembiec and Marcus1970). The assay involved tracking the breakdown of H₂O₂ by monitoring the reduction in absorbance at 240 nm over time. The enzymatic activity was calculated based on the rate of H₂O₂ decomposition and expressed as U mg−1 protein.
Inhibition of AChE activity
Brain and muscle tissues were homogenized in 0.1 M phosphate buffer (pH 7.4) and then centrifuged at 10,000 × g for 30 minutes at 4°C, with Triton X-100 included in the mixture. The resulting supernatants were collected for the measurement of AChE activity, following the modified protocols outlined by Chhajlani et al. (Reference Chhajlani, Derr, Earles, Schmell and August1989) and Rosenfeld (Reference Rosenfeld2001).
AChE activity was quantified using an adapted version of the method described by Ellman et al. (Reference Ellman, Courtney, Andres and Featherstone1961). Results were normalized to the protein content, expressed as nmol min−1 mg protein−1. The assay was performed in a final volume of 300 µL, which contained 33 µL of 0.1 M phosphate buffer (pH 7.5), 2 mM DTNB, and 0.88 mM acetylthiocholine iodide (ACSCh) as the substrate. The reaction was initiated by the addition of ACSCh, and the rate of hydrolysis was monitored by measuring absorbance at 412 nm for 2–3 minutes, with readings taken every 30 seconds using a 96-well microplate reader.
Protein concentrations in the samples were determined using the Bradford method (1976), with bovine serum albumin (Sigma, St. Louis, USA) serving as the standard.
Non-specific immune responses
Plasma was separated from whole blood samples by centrifugation, while kidney tissues were dissected with care and homogenized using a WT130 handheld homogenizer in ice-cold 0.004 M phosphate buffer (pH 6.6) at a tissue-to-buffer ratio of 1:10. The resulting homogenates were subjected to centrifugation at 10,000 × g for 10 minutes at low temperature. The supernatants were then collected and stored at –70 °C using an MDF-U53V freezer (SANYO Electric Co. Ltd., Japan) for later biochemical analyses.
Protein concentrations in the samples were determined using the Bio-Rad Protein Assay Kit (Bio-Rad Laboratories GmbH, Munich, Germany), which relies on the Bradford dye-binding method. Bovine serum albumin served as the standard for calibration.
Lysozyme activity
Lysozyme activity in kidney tissue and plasma was evaluated using a turbidimetric assay, which measures the lysis of the Gram-positive bacterium Micrococcus lysodeikticus (Sigma, St. Louis, USA), according to the procedure outlined by Ellis (Reference Ellis2001). The bacterial substrate was prepared at a concentration of 0.2 mg/mL in 0.05 M phosphate buffer – adjusted to pH 6.6 for kidney assays and pH 7.4 for plasma assays. The reduction in turbidity, indicating lysozyme activity, was monitored at 530 nm over a time interval ranging from 0.5 to 4.5 minutes. A standard calibration curve was generated using lyophilized egg white lysozyme (Sigma), and results were expressed as egg white lysozyme equivalents: µg/mL for plasma samples and µg/g for kidney tissue.
Peroxidase activity
Peroxidase activity, a widely recognized indicator of leukocyte activation (Quade and Roth, Reference Quade and Roth1997), was determined using a colorimetric assay. In this method, 5 μL of plasma was added to 50 μL of Hank’s Balanced Salt Solution in each well of a 96-well microplate. Subsequently, a peroxidase substrate mixture – comprising 80 µM 3,3′,5,5′-tetramethylbenzidine hydrochloride (Sigma Aldrich) and 2.5 mM H₂O₂ – was introduced. The enzymatic reaction was allowed to proceed for 2 minutes, after which it was halted by adding 50 μL of 2 M sulphuric acid. The resulting colour change was quantified by measuring absorbance at 420 nm using a microplate reader (FLUOstar Omega, BMG). A blank sample lacking plasma served as the control. One unit of peroxidase activity was defined as the enzyme quantity required to produce a change of 1.0 in optical density at 420 nm.
Assay of anti-protease activity
Anti-protease activity was assessed following a modified protocol based on Ellis (Reference Ellis1990), as described by Magnadóttir et al. (Reference Magnadóttir, Jónsdóttir, Helgason, Björnsson, Jørgensen and Pilström1999). In this method, 20 μL of plasma was combined with 20 μL of a standard-grade trypsin solution and incubated for 10 minutes at room temperature (approximately 24 °C). Subsequently, 200 μL of 0.1 M phosphate buffer (pH 7.0) and 250 μL of 2% azocasein were added to the mixture, which was then incubated for 1 hour at the same temperature. Following the incubation period, 500 μL of 10% trichloroacetic acid was added, and the mixture was left to stand for 30 minutes at room temperature. The samples were centrifuged at 6000 × g for 5 minutes. From the supernatant, 100 μL was transferred into a 96-well flat-bottom microplate, followed by the addition of 100 μL of 1 N NaOH to each well. Absorbance was read at 450 nm using a UV-Vis spectrophotometer. For controls, the blank consisted of phosphate buffer without the addition of plasma or trypsin, while the reference sample replaced plasma with phosphate buffer. The inhibition percentage of trypsin activity was determined by comparing the absorbance values of plasma-treated samples to the reference. All reagents and chemicals were obtained from Sigma Aldrich.
Statistical analysis
The experimental procedure consisted of two exposure durations, 2 and 4 weeks, each conducted in triplicate to ensure reproducibility. Statistical evaluations were carried out using SPSS software (version 26.0). Two-way analysis of variance was employed to identify significant differences among treatment groups, followed by Duncan’s multiple range test or Student’s t-test for specific pairwise comparisons. A significance threshold of P < 0.05 was applied to determine the statistical relevance of the findings.
Results
Anti-oxidant enzymes activity
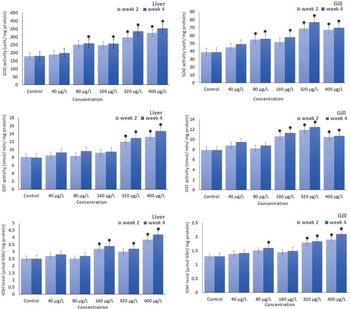
Based on the results, SOD activity levels in the liver and gills at concentrations of 80 µg L−1 and above were significantly different from the control group. Hepatic GST activity showed a significant difference from the control group only at the two highest tested concentrations (320 and 400 µg L−1), while gill GST activity demonstrated a statistically significant increase at 160 µg L−1 and above. Despite a gradual upward trend in hepatic GSH levels, a significant increase in GSH activity was observed only at 160 µg L−1 at the end of week 4 and at 400 µg L−1 Se in weeks 2 and 4, compared to the control group. Gill GSH activity levels also showed an increasing trend following Se exposure, with the most significant differences from the control group observed at concentrations of 320 and 400 µg L−1 at the end of weeks 2 and 4 (refer to Figure 1 for details).
SOD, GST, and GSH level in liver and gill of juvenile S. hasta exposed to different Se concentrations. Vertical bar denotes a standard error. Significant differences from the control group are denoted by *p < 0.05.

Figure 1 Long description
The image contains six bar graphs labeled A to F, showing SOD, GST and GSH activity in liver and gill of juvenile S. hasta exposed to different Se concentrations. The horizontal axis for all graphs is labeled Concentration with categories: Control, 40, 80, 160, 320 and 400 microgram per liter. The vertical axis for each graph varies. Graph A shows liver SOD activity (milliunit per milligram protein) ranging from 0 to 450. Graph B shows gill SOD activity (milliunit per milligram protein) ranging from 0 to 90. Graph C shows liver GST activity (milliunit per milligram protein) ranging from 0 to 18. Graph D shows gill GST activity (milliunit per milligram protein) ranging from 0 to 14. Graph E shows liver GSH level (micromole per milligram protein) ranging from 0 to 5. Graph F shows gill GSH level (micromole per milligram protein) ranging from 0 to 2.5. Each graph includes bars for week 2 and week 4, with error bars indicating standard error. Asterisks denote significant differences from the control group (p < 0.05). Key trends: - SOD activity increases with concentration in both liver and gill, with notable peaks at higher concentrations. - GST activity shows significant increases at higher concentrations, particularly in the liver at 320 and 400 microgram per liter. - GSH levels rise with concentration, with significant increases in the liver at 160 microgram per liter and in the gill at 320 and 400 microgram per liter. Comparative insights: - Liver generally shows higher activity levels than gill across all metrics. - Week 4 consistently shows higher activity levels compared to week 2, indicating a time-dependent response to Se exposure.
Brain and muscle AChE activity
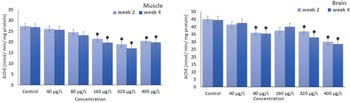
A clear negative correlation was identified between waterborne Se concentration and AChE activity in both brain and muscle tissues (Figure 2). As Se levels increased, AChE activity decreased significantly. Following 4 weeks of exposure to 80 µg L−1 Se, a statistically significant decrease in brain AChE activity was observed compared to the control group. This declining trend became more pronounced with increasing Se concentrations. The most substantial decrease in AChE activity was recorded at the end of week 4 in fish exposed to 400 µg L−1 Se, where enzyme activity was reduced by approximately 36% relative to the control group. A similar pattern was observed in muscle tissue, where AChE activity also decreased significantly by week 4 following exposure to 80 µg L−1Se. The maximum inhibition of muscle AChE activity was observed at Se concentrations of 320 µg L−1 at the end of week 4, with an approximate 38% reduction in activity compared to the control group.
Changes of AChE activity in the brain and muscle of juvenile S. hasta, exposed to different Se concentrations. Vertical bar denotes a standard error. Significant differences from the control group are denoted by *p < 0.05.

Figure 2 Long description
The image A showing Muscle. The title reads Muscle. A note reads: Vertical bar denotes a standard error. Significant differences from the control group are denoted by asterisk p less than 0.05. The horizontal axis label reads Concentration. Categories, in order: Control, 40 microgram per liter, 80 microgram per liter, 160 microgram per liter, 320 microgram per liter, 400 microgram per liter. The vertical axis label reads AChE (nanomole per minute per milligram protein). The vertical axis range is 0 to 35. Each category has two bars labeled week 2 and week 4, with vertical error bars. Across the categories, the bar heights decrease from Control toward 320 microgram per liter, then increase at 400 microgram per liter. Week 4 bars are lower than week 2 bars at 160 microgram per liter, 320 microgram per liter and 400 microgram per liter. Asterisks appear above the week 4 bars at 160 microgram per liter, 320 microgram per liter and 400 microgram per liter. The image B showing Brain. The title reads Brain. The horizontal axis label reads Concentration. Categories, in order: Control, 40 microgram per liter, 80 microgram per liter, 160 microgram per liter, 320 microgram per liter, 400 microgram per liter. The vertical axis label reads AChE (nanomole per minute per milligram protein). The vertical axis range is 0 to 50. Each category has two bars labeled week 2 and week 4, with vertical error bars. Across the categories, the bar heights decrease from Control toward 400 microgram per liter. Week 4 bars are lower than week 2 bars at 80 microgram per liter, 160 microgram per liter, 320 microgram per liter and 400 microgram per liter. Asterisks appear above the week 4 bars at 80 microgram per liter, 160 microgram per liter, 320 microgram per liter and 400 microgram per liter. Week 2 and week 4 are shown as two different bar styles in each category. Compared across the two graphs, asterisks appear at more concentration categories in Brain than in Muscle.
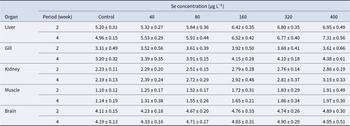
Significant differences in CAT activity were observed across various organs, with these variations becoming more pronounced as Se concentrations increased (Table 2). The liver and brain exhibited the highest levels of CAT activity, with a marked increase in activity corresponding to both higher Se concentrations and longer exposure durations. In contrast, the muscle and kidney showed the lowest levels of CAT activity.
Changes of catalase activity (U mg−1 protein) in body organs of juvenile S. hasta, exposed to different Se concentrations after exposer 4-week period

Table 2 Long description
The table reports catalase activity per milligram protein (mean with standard error) in juvenile S. hasta organs after 2 or 4 weeks of exposure to selenium in water (control, 40, 80, 160, 320, 400 micrograms per liter). Liver shows the clearest dose-related increase: at week 2 it rises from 5.20 in control to 6.95 at 400, and at week 4 from 4.96 to 7.31. Muscle also increases steadily with selenium, from about 1.10 to 1.91 at week 2 and from 1.14 to 1.97 at week 4. Kidney increases more moderately, from 2.23 to 2.86 at week 2 and from 2.19 to 3.15 at week 4. Brain values are relatively high and change modestly, from 4.11 to 4.89 at week 2 and from 4.19 to 4.95 at week 4. Gill shows smaller and less consistent changes, with week 2 peaking at 3.92 at 160 then dipping slightly, while week 4 increases to 4.38 at 400. Across organs, higher selenium generally corresponds to higher catalase activity, but overlap implied by standard errors suggests some differences may be small or variable.
Data are expressed as mean ± SE.
After exposing the fish to 80 µg of Se for 4 weeks, both plasma and kidney lysozyme levels showed a significant increase compared to the control group (Table 3). The highest plasma lysozyme levels, 7.41 ± 0.59 and 7.93 ± 0.67 µg mL−1, were recorded at the end of week 4 for exposures to 320 and 400 µg L−1 Se, respectively. The highest kidney lysozyme activity, 93.7 ± 4.4 and 98.6 ± 5.7 µg mL−1, was observed at the end of week 4 for exposures to 320 and 400 µg L−1 Se, respectively.
Changes in plasma and kidney lysozyme levels in S. hasta following treatment with different Se concentrations after exposer 4-week period

Table 3 Long description
The table reports mean lysozyme levels with standard error in plasma (micrograms per milliliter) and kidney (micrograms per gram) after 2 and 4 weeks across a control and selenium treatments from 40 to 400 micrograms per liter. In plasma at week 2, values increase from 5.24 in the control to 7.95 at 400, with intermediate doses rising stepwise (5.6 at 40, 6.49 at 80, 6.81 at 160, 7.35 at 320). Plasma at week 4 shows a similar pattern, from 5.31 in the control to 7.93 at 400 (6.21 at 40, 6.72 at 80, 6.93 at 160, 7.41 at 320). Kidney lysozyme is much higher than plasma and also increases with selenium: at week 2 it goes from 62.5 in the control to 95.5 at 400 (67.4 at 40, 73.4 at 80, 82.5 at 160, 89.7 at 320). At week 4, kidney values rise from 63.2 in the control to 98.6 at 400 (70.5 at 40, 75.8 at 80, 85.8 at 160, 93.7 at 320). Differences between week 2 and week 4 within the same dose are small compared with the dose-related increases. Because results are presented as means with standard errors and no significance markers, the table supports a dose-related upward trend but does not by itself confirm which differences are statistically significant.
Data are expressed as mean ± SE.
Peroxidase and anti-peroxidase activity levels were initially recorded at baseline values in the control group. However, as Se concentration increased, a gradual decline in the activity of both parameters was observed (Table 4). A significant reduction in peroxidase and anti-peroxidase activity levels was noted after the fish were exposed to 160 µg L−1 of Se. This decreasing trend continued through to the end of week 4, reaching a concentration of 400 µg L−1.
Changes in peroxidase and anti-protease activity in S. hasta following treatment with different Se concentrations after exposer 4-week period

Table 4 Long description
The table reports mean values with standard errors for two immune-related measures in S. hasta after 2 and 4 weeks across selenium treatments from control to 400 micrograms per liter. Peroxidase activity declines as selenium concentration increases at both time points: at week 2 it drops from 6.21 units per milliliter in the control to 4.26 at 400, and at week 4 from 6.23 in the control to 4.11 at 400. Intermediate doses show a stepwise decrease, for example at week 2 values move from 6.11 at 40 to 5.72 at 80, 5.10 at 160, and 4.61 at 320. Anti-protease activity, reported as percent inhibition, shows a similar downward pattern: at week 2 it decreases from 38.5 in the control to 33.5 at 400, and at week 4 from 38.4 in the control to 33.1 at 400. Differences between week 2 and week 4 within the same dose are small compared with the overall dose-related decline. Interpretation should consider that the table provides means with standard errors and does not indicate statistical significance testing.
Data are expressed as mean ± SE.
Discussion
This research explored the physiological responses of juvenile S. hasta to varying concentrations of Se under controlled laboratory conditions. The results provide valuable information regarding the potentially harmful impacts of Se exposure on juvenile fish health. Oxygen is essential for aerobic life forms, including aquatic species, due to its central role in metabolic pathways. However, exposure to heavy metals such as Se can trigger the formation of ROS, initiate redox reactions, and generate free radicals, all of which can seriously damage cellular components (Ahmad et al., Reference Ahmad, Pacheco and Santos2004; Spallholz et al., Reference Spallholz, Palace and Reid2004; Brucka-Jastrzębska, Reference Brucka-Jastrzębska2010). In response, fish activate various anti-oxidant defence mechanisms. One of the most important of these is the enzyme SOD, which catalyses the conversion of superoxide anions into H₂O₂ (Öztürk-Ürek et al., Reference Öztürk-Ürek, Bozkaya and Tarhan2001; Kim and Kang, Reference Kim and Kang2015), thereby mitigating oxidative stress. Research has highlighted the liver and gills as highly responsive tissues for assessing anti-oxidant defence activity under oxidative stress conditions (Kim and Kang, Reference Kim and Kang2016; Kim et al., Reference Kim, Park, Kim and Kang2017), making them reliable biomarkers in toxicity evaluations. Our recent findings demonstrated that SOD activity in liver and gills of S. hasta increased significantly in response to elevated waterborne Se levels. This pattern aligns with numerous prior studies indicating that exposure to heavy metals often triggers elevated SOD activity in fish (Farombi et al., Reference Farombi, Adelowo and Ajimoko2007). For example, Kim and Kang (Reference Kim and Kang2015) observed a marked rise in SOD levels in black sea bream (Acanthopagrus schlegelii) following zinc exposure. They also reported a similar trend in juvenile red sea bream (Pagrus pagrus) subjected to different concentrations of Se in aquatic environments. Likewise, Misra and Niyogi (Reference Misra and Niyogi2009) found that rainbow trout (Oncorhynchus mykiss) exposed to 50 and 100 µM sodium selenite showed increased SOD activity. In another study, Pacini et al. (Reference Pacini, Elia, Abete, Dörr, Brizio, Gasco, Righetti and Prearo2013) reported a boost in SOD activity in both liver and kidney tissues of Siberian sturgeon (Acipenser baeri) upon Se exposure (Chaâbane et al., Reference Chaâbane, Bejaoui, Trabelsi, Telahigue, Chetoui, Chalghaf, Zeghal, El Cafsi and Soudani2020). Supporting these findings, Gopi et al. (Reference Gopi, Rekha, Vijayakumar, Liu, Monserrat, Faggio, Nor and Vaseeharan2021) noted heightened SOD levels in Oreochromis mossambicus following Se contamination. Furthermore, Lee et al. (Reference Lee, Kim, Lee, Lim and Kang2022) identified significantly enhanced SOD activity in the liver and gills of olive flounder (Paralichthys olivaceus) after exposure to chromium. These observed increases in SOD activity are widely considered a key adaptive response, functioning to mitigate oxidative damage by neutralizing the excess ROS generated under conditions of metal stress.
GST is a pivotal enzyme involved in the conjugation of GSH with various electrophilic substances. It plays a significant role in defending the organism against ROS and contributes extensively to the detoxification of harmful xenobiotic compounds, such as environmental pollutants (Keen and Jakoby, Reference Keen and Jakoby1978; White et al., Reference White, Viernes, Krejsa, Botta and Kavanagh2003). Exposure to cadmium-contaminated water has been shown to markedly elevate GST activity in the liver and kidneys of O. mossambicus (Basha and Rani, Reference Basha and Rani2003). This heightened enzyme activity is interpreted as a protective response against oxidative damage (Marí and Cederbaum, Reference Marí and Cederbaum2001). Our recent investigation demonstrated a substantial increase in GST activity in S. hasta following exposure to different concentrations of waterborne Se, particularly at higher doses. Likewise, a study by Kim and Kang (Reference Kim and Kang2015) observed a dose-dependent rise in GST activity in Pagrus major after Se exposure, suggesting an adaptive detoxification mechanism, particularly in liver and gill tissues. Conversely, exposure to copper caused a significant decrease in GST activity in Oreochromis niloticus (Kanak et al., Reference Kanak, Dogan, Eroglu, Atli and Canli2014), possibly indicating that other components of the anti-oxidant system may compensate to neutralize ROS. A similar reduction in GST was reported in Acanthopagrus schlegelii following zinc exposure (Kim et al., Reference Kim, Park, Kim and Kang2017). In another instance, Se exposure led to over a 50% decline in GST activity in the gills of topmouth gudgeon (Pseudorasbora parva) (Ma et al., Reference Ma, Zeng, Chen, Geng, Yan, Luo, Xie and Zhang2018). Our findings are in agreement with those of Gobi et al. (Reference Gobi, Vaseeharan, Rekha, Vijayakumar and Faggio2018), who also noted a dose-dependent increase in GST activity in the liver and gills of O. mossambicus under Se exposure. Similarly, Gopi et al. (Reference Gopi, Rekha, Vijayakumar, Liu, Monserrat, Faggio, Nor and Vaseeharan2021) reported elevated GST levels in the same species in response to Se contamination.
GSH, a thiol-based tripeptide, is essential for cellular defence mechanisms against xenobiotics, including heavy metals, and also functions as a key substrate in GST-mediated detoxification pathways (Lange et al., Reference Lange, Ausseil and Segner2002). One of the primary cellular responses to metal exposure involves a reduction in GSH levels, reflecting its role in metal chelation and detoxification, thereby offering protection against metal-induced toxicity (Sanchez et al., Reference Sanchez, Palluel, Meunier, Coquery, Porcher and Aït-aïssa2005). Selenite, when metabolized in the presence of GSH, can be transformed into hydrogen selenide, a compound that can produce ROS through interaction with molecular oxygen; if not neutralized by anti-oxidants, these ROS may cause oxidative cellular damage (Seko et al., Reference Seko, Saito, Kitahara and Imura1989; Miller, Reference Miller2006; Misra and Niyogi, Reference Misra and Niyogi2009). Empirical studies have shown variable responses in GSH level following Se exposure. For instance, Oncorhynchus mykiss exposed to waterborne selenite displayed reduced GSH level (Miller et al., Reference Miller, Wang, Palace and Hontela2007), while Channa punctata showed a similar trend when subjected to multiple trace metals (Pandey et al., Reference Pandey, Parvez, Ansari, Ali, Kaur, Hayat, Ahmad and Raisuddin2008). In contrast, Kim and Kang (Reference Kim and Kang2015) observed increased GSH concentrations in both liver and gill tissues of P. major under Se stress. Supporting these findings, Li et al. (Reference Li, Zhang, Wang, Luo, Zhou and Jiang2008) reported elevated GSH level in Oryzias latipes treated with Nano-Se. However, Se exposure also led to a reduction in gill GSH level in P. parva, with at least a 35% decrease after 28 days (Ma et al., Reference Ma, Zeng, Chen, Geng, Yan, Luo, Xie and Zhang2018). Our current study showed a trend similar to that of Gobi et al. (Reference Gobi, Vaseeharan, Rekha, Vijayakumar and Faggio2018) and Gopi et al. (Reference Gopi, Rekha, Vijayakumar, Liu, Monserrat, Faggio, Nor and Vaseeharan2021), who documented increased GSH level in the liver and gills of O. mossambicus following Se treatment. These variations in GSH level across different studies highlight Se’s dual role in modulating oxidative stress and suggest that Se, when present in water at certain concentrations, can significantly influence anti-oxidant responses and potentially lead to oxidative damage in fish.
CAT is a key anti-oxidant enzyme that plays an essential role in protecting cells from oxidative damage by neutralizing ROS, and is widely recognized as a biomarker of oxidative stress (McFarland et al., Reference McFarland, Inouye, Lutz, Jarvis, Clarke and McCant1999). In the current investigation, CAT activity in S. hasta was found to increase in response to both rising Se concentrations and prolonged exposure times. Similar trends have been reported in earlier studies; for instance, Nagaraju and Rathnamma (Reference Nagaraju and Rathnamma2014) documented a significant elevation in CAT activity across different tissues of Ctenopharyngodon idella following exposure to chlorantraniliprole. Likewise, Kumari et al. (Reference Kumari, Khare and Dange2014) observed heightened CAT activity in Labeo rohita after 48–72 hours of chromium exposure. In a dietary study on Sparus aurata, Mechlaoui et al. (Reference Mechlaoui, Dominguez, Robaina, Geraert, Kaushik, Saleh, Briens, Montero and Izquierdo2019) reported a marked increase in liver CAT activity after 63 days of Se supplementation. This enzymatic response is believed to reflect the organism’s attempt to counteract elevated levels of H₂O₂ and superoxide radicals (John et al., Reference John, Kale, Rathore and Bhatnagar2001). Furthermore, enhanced CAT activity is often interpreted as an adaptive mechanism to mitigate oxidative stress by preventing ROS accumulation (Regoli et al., Reference Regoli, Gorbi, Fattorini, Tedesco, Notti, Machella, Bocchetti, Benedetti and Piva2006). However, contrasting evidence has been presented by Gobi et al. (Reference Gobi, Vaseeharan, Rekha, Vijayakumar and Faggio2018), who found suppressed CAT activity in both liver and gill tissues of O. mossambicus after 96 hours of Se exposure, indicating that the anti-oxidant response may vary depending on species, tissue type, and exposure conditions.
The generation of ROS is known to trigger programmed cell death, which can contribute to the development of neurodegenerative conditions and immune system dysfunction in humans (Franco et al., Reference Franco, Sánchez-olea, Reyes-reyes and Panayiotidis2009). ACh, a key neurotransmitter in both central and peripheral nervous systems, is regulated by AChE, and inhibition of this enzyme is widely recognized as a sensitive biomarker for neurotoxicity (Manzo et al., Reference Manzo, Castoldia, Coccinia, Rossia, Nicoteraa and Costaa1995). In fish, exposure to environmental toxins frequently results in reduced AChE activity (Modesto and Martinez, Reference Modesto and Martinez2010), leading to excessive accumulation of ACh, which may interfere with critical behaviours such as escape responses and reproduction (Bretaud et al., Reference Bretaud, Toutant and Saglio2000). Previous studies, including that of Kim and Kang (Reference Kim and Kang2015), have documented AChE inhibition in P. major following Se exposure. Similarly, Gülsemin and Karaytuğ (Reference Gülsemin and Karaytuğ2017) found that high levels of lead inhibited AChE activity in O. niloticus, although a combination of Se and lead enhanced the enzyme’s activity. In addition, Gopi et al. (Reference Gopi, Rekha, Vijayakumar, Liu, Monserrat, Faggio, Nor and Vaseeharan2021) observed decreased AChE levels in the brain tissue of fish treated with Se, while Ma et al. (Reference Ma, Zeng, Chen, Geng, Yan, Luo, Xie and Zhang2018) reported increased enzyme activity in both brain and muscle tissues of P. parva after prolonged exposure. In our study, S. hasta exhibited a significant decline in AChE activity in both brain and muscle tissues following Se exposure, with brain tissue showing higher enzyme activity than muscle, consistent with previous findings. These results confirm that Se exposure may induce neurotoxic effects in fish, primarily through cholinesterase inhibition.
In this study, exposure to elevated Se concentrations resulted in increased lysozyme activity in the plasma and kidney of S. hasta. The innate immune system provides valuable indicators that can be used to assess the impacts of environmental contaminants. Among these, lysozyme is a key enzyme involved in nonspecific immune defence, making it a reliable marker for evaluating immune function in fish under stress. Monitoring changes in lysozyme levels is particularly useful in detecting alterations caused by environmental pollutants such as heavy metals, which can disrupt immune regulation. Due to its strong bactericidal properties, lysozyme plays an essential role in the primary defence system of fish. Previous studies have reported elevated lysozyme activity in P. major and Channa argus following Se exposure via water, findings that align with the present results (Kim and Kang, Reference Kim and Kang2015; Li et al., Reference Li, Gao, Du, Zhao, Niu, Wang and Zhang2020). The observed increase in lysozyme activity in S. hasta may therefore reflect an adaptive immune response to counteract the stress induced by Se.
In this study, S. hasta exhibited increased lysozyme activity in both plasma and kidney tissues following exposure to higher concentrations of Se. Lysozyme is recognized as a fundamental element of the innate immune system and is frequently used as an indicator to assess the physiological responses of fish to environmental challenges, especially pollutant exposure (Bainy and Marques, Reference Bainy and Marques2003). According to Saurabh and Sahoo (Reference Saurabh and Sahoo2008), evaluating lysozyme levels provides a reliable approach for examining how environmental stressors influence innate immune mechanisms in aquatic organisms. The activity of this enzyme is known to be sensitive to contaminants like heavy metals, which can interfere with the proper functioning and regulation of immune responses (Bols et al., Reference Bols, Brubacher, Ganassin and Lee2001). Owing to its antimicrobial function, lysozyme contributes significantly to the host defence system in fish (Grinde and Jollès, Reference Grinde and Jollès1988). Comparable results have been documented in previous investigations, where waterborne Se exposure led to increased lysozyme activity in P. major (Kim and Kang, Reference Kim and Kang2015) and C. argus (Li et al., Reference Li, Gao, Du, Zhao, Niu, Wang and Zhang2020). The observed elevation in lysozyme levels in the present study may therefore represent a compensatory immune response by S. hasta to counteract Se -induced stress.
Peroxidase is a key enzyme in the innate immune system, contributing to pathogen defence by producing hypochlorous acid through oxidative radical activity. Previous research by Kim and Kang (Reference Kim and Kang2015) demonstrated that increased Se exposure reduced peroxidase activity in P. major. Conversely, Abdullah et al. (Reference Abdullah, Naz and Abbas2019) observed elevated peroxidase levels in Catla catla under lead exposure, particularly in brain tissue, followed by liver, gills, kidney, heart, and muscle. Similarly, Lahori et al. (Reference Lahori, Ullah, Baig, Khan, Shoukat, Liaqat, Hassan and Ghafoor2021) found enhanced liver peroxidase activity in Cyprinus carpio exposed to copper nanoparticles. In the present study, a dose-dependent decline in peroxidase activity was noted in S. hasta with rising Se levels, suggesting that Se may exert an immunosuppressive effect at higher concentrations. These results imply that excessive Se can impair immune function in fish and highlight the utility of anti-oxidant enzymes as reliable biomarkers of oxidative stress in aquatic organisms.
Protease inhibitors play an important role in the vertebrate innate immune system, where they contribute to general immune defence mechanisms (Ellis, Reference Ellis2001). In fish, blood plasma is known to contain various inhibitors that likely act to limit bacterial infections and control pathogen spread (Magnadóttir et al., Reference Magnadóttir, Jónsdóttir, Helgason, Björnsson, Jørgensen and Pilström1999). Previous studies have shown that environmental stressors can impact these immune components; for example, Thilagam et al., Reference Thilagam, Gopalakrishnan, Bo and Wang2009) observed reduced levels of protease inhibitors in Japanese sea bass after exposure to 17β-estradiol. Likewise, research by Kim and Kang (Reference Kim and Kang2015) reported a significant drop in these inhibitors in P. major when exposed to different concentrations of Se. Consistent with these findings, our study also recorded a clear decline in anti-protease activity at elevated Se levels, suggesting a potential weakening of the immune regulation of protease activity, which may interfere with protein stability and immune defence mechanisms.
In conclusion, this study demonstrates that waterborne selenium exposure induces significant physiological stress in juvenile S. hasta, triggering both anti-oxidative and neurotoxic responses. The observed increases in SOD, GST, GSH, and CAT activities reflect an adaptive defence mechanism against Se-induced oxidative damage, particularly in liver and gill tissues. Concurrently, the marked inhibition of AChE activity in brain and muscle tissues confirms the neurotoxic potential of elevated Se concentrations. Furthermore, alterations in immune parameters, including enhanced lysozyme activity and suppressed peroxidase and anti-protease responses, indicate immunomodulatory effects. Collectively, these findings underscore Se’s dual role as both an oxidative stressor and a neurotoxic agent, highlighting the utility of these biomarkers for environmental monitoring and risk assessment in aquatic ecosystems.
Acknowledgements
The authors would like to like to thank Dr Predrag Simonović (University of Belgrade), for carefully reading the manuscript and for valuable contribution to improving the scientific writing.
Author contributions
M.M.-V.: Writing – review and editing, visualization, software, methodology, investigation, data analysis, data curation, and conceptualization. K.W.: Writing – review and editing, methodology, conceptualization. P.W.F: Writing – review and editing and conceptualization.
Data availability statement
The authors confirm that the data supporting the findings of this study are available within the article.
Ethics and approach
All applicable international, national, and/or institutional guidelines for the care and use of animals were followed.
Funding.
The authors state that they did not receive any funds, grants, or other support while preparing this manuscript. If you require the full scope of data, this can be available from the corresponding author, M.M.-V., upon reasonable request.
Competing interests
The authors state that there is no conflict of interest.