


Fermentation is one of the oldest forms of food preservation(Reference Hutkins1), with dairy products being some of the most common substrates used. Fermented dairy products, such as yogurt and kefir, have long been associated with health benefits and longevity in those who consume them(Reference Metchnikoff2). Of these fermented dairy products, kefir in particular has been associated with a large amount of health benefits that have been ascribed to whole kefir, kefir micro-organisms, lactic acid and/or exopolysaccharides(Reference Bourrie, Willing and Cotter3,Reference Garrote, Abraham and Rumbo4) . These health benefits include serum and plasma cholesterol-lowering abilities(Reference Bourrie, Cotter and Willing5–Reference Liu, Wang and Chen7), angiotensin-converting enzyme inhibitory activity(Reference Quiros, Hernández-Ledesma and Ramos8), improved cardiac function(Reference Silva-Cutini, Almeida and Nascimento9), immunomodulatory characteristics(Reference Vinderola, Duarte and Thangavel10) and an ability to improve non-alcoholic fatty liver disease (NAFLD) and obesity(Reference Bourrie, Cotter and Willing5,Reference Chen, Tsai and Tsai11–Reference Ostadrahimi, Taghizadeh and Mobasseri15) . These characteristics have led to a surge in the popularity of kefir as a functional probiotic food with the ability to improve one’s health.
One overlooked factor in the health benefits associated with kefir is that significant differences exist between the microbial composition of individual examples of kefir(Reference Dobson, O’Sullivan and Cotter16,Reference Marsh, O’Sullivan and Hill17) and that these differences impact the final flavour development and fermentation by-products(Reference Walsh, Crispie and Kilcawley18). For example, commercial examples do not typically contain acetic acid bacteria, which are ubiquitous among traditional kefirs(Reference Dobson, O’Sullivan and Cotter16–Reference Walsh, Crispie and Kilcawley18). Additionally, while commercial products may contain Leuconostoc and Lactococcus similar to those present in traditional kefir, the Lactobacillus species contained in many commercial examples are different than those present in kefir grains and grain-fermented milk. This is especially important as Lactobacillus kefiranofaciens and Lactobacillus kefiri, both species unique to kefir, have been shown to have beneficial effects on host health(Reference Carasi, Racedo and Jacquot19–Reference Chen, Hsiao and Hong22). Kefiran, an exopolysaccharide produced by L. kefiranofaciens, has also proven beneficial in vivo (Reference Vinderola, Perdigón and Duarte23–Reference Hamet, Medrano and Perez25). Another major difference between traditional kefir and commercial varieties is the lack of a complex yeast community in many commercial products. While some commercial kefir may contain a single species of Saccharomyces, traditional kefir generally contains Saccharomyces cerevisiae, Pichia fermentans, Kazachstania unispora, Kluyveromyces marxianus and Kluyveromyces lactis as well as a multitude of other yeast species at lower quantities(Reference Marsh, O’Sullivan and Hill17). We have recently shown that the impact of these microbial differences extends to the ability of kefir to improve circulating cholesterol levels and markers of NAFLD in obese mice and that traditional kefir was better able to improve these phenotypes than a commercial example(Reference Bourrie, Cotter and Willing5). This is especially important given the number of commercially available products labelled as kefir that do not contain the micro-organisms described as core members of traditional kefir microbial communities(Reference Bourrie, Willing and Cotter3,Reference Bourrie, Cotter and Willing5) .
Although our group has shown kefir grain-fermented milk to be more beneficial in improving cholesterol and lipid metabolism in mice than a commercial kefir product(Reference Bourrie, Cotter and Willing5), the manufacturing of industrial scales of such milks using kefir grains is challenging. This is due to multiple factors such as the need to store and maintain the necessary volume of grains as well as natural variability in microbial composition, and indeed fermentation by-products, over time. It was also notable that fermented milk produced from different kefir grains differed in their ability to improve these metabolic markers, with some performing significantly better than others(Reference Bourrie, Cotter and Willing5). Due to these factors, our objective was to make a kefir product better suited to commercial scale up using bacteria and yeast isolated from a kefir grain previously shown to improve plasma cholesterol and liver TAG levels(Reference Bourrie, Cotter and Willing5) and determine if these health benefits could be recapitulated using this pitched culture method. In order to examine how the microbial composition of kefir impacts its ability to impart health benefits, we also made pitched culture kefir that lacked either the Lactobacillus or yeast population while containing all the other organisms present in the pitched kefir. As our previous study had shown that traditional kefir significantly improved plasma and liver lipid profiles when compared with both a high-fat diet (HFD) control and commercial kefir, we aimed to determine how these three pitched kefir examples impacted weight gain, plasma cholesterol profiles and markers of NAFLD in a mouse model of obesity. Pitched kefir examples were compared with a commercial kefir and traditional kefir made with the grain from which the pitch organisms were isolated. We hypothesised that complete pitched kefir would recapitulate the health effects of traditional kefir, but that the removal of either the Lactobacillus or yeast populations would result in decreased beneficial impact on the host.
Methods
Kefir grain sourcing, microbial composition and production
Kefir grains were characterised in a previous study(Reference Marsh, O’Sullivan and Hill17), and fermentation was carried out as previously described(Reference Bourrie, Willing and Cotter3). Pitched kefir was prepared by inoculating 2 % fat milk with a mixture of microbes consisting of Acetobacter pasteurianus, Lactococcus lactis, Leuconostoc mesenteroides, L. kefiri, L. kefiranofaciens, P. fermentans, S. cerevisiae, K. unispora and K. marxianus. Overnight cultures were inoculated at a starting concentration of 104 colony-forming units (CFU)/ml of bacteria and 103 CFU/ml of yeast. Fermentation occurred under the same conditions as grain fermentation, and microbial density of the pitched kefir was 2·4 (sd 0·7) × 108 CFU/ml for bacteria, and 6·8 (sd 2·8) × 106 CFU/ml for yeast. The microbial density of ICK kefir was 3·0 (sd 1·0) × 108 CFU/ml for bacteria, and 5·2 (sd 2·2) × 106 CFU/ml for yeast. The microbial density of PNL was 1·9 (sd 1·0) × 108 CFU/ml and 7·0 (sd 2·0) × 106 CFU/ml for bacteria and yeast, respectively, while the PNY kefir had a bacterial density of 2·5 (sd 0·6) × 108 CFU/ml while having zero yeast present. The commercial kefir (Liberte) used a microbial composition of Lactobacillus lactis, Lactobacillus rhamnosus, Streptococcus diacetylactis, Lactobacillus plantarum, Lactobacillus casei, Saccharomyces florentinus, L. mesenteroides subsp. cremoris, Bifidobacterium longum, Bifidobacterium breve, Lactobacillus acidophilus, Bifidobacterium lactis and Lactobacillus reuteri, totalling 8·0 × 106 CFU/ml. The ICK kefir grain used in this study was previously sequenced by our group(Reference Marsh, O’Sullivan and Hill17,Reference Walsh, Crispie and Kilcawley18) and contains the major bacterial and fungal genera Lactobacillus, Acetobacter, Leuconostoc, Gluconobacter, Kluyveromyces, Kazachstania and Dekkera, along with a multitude of other low abundance genera.
Animals and treatments
Forty 8-week-old wild-type C57BL/6 female mice were obtained from Jackson Labs. Mice were randomly grouped into ten cages with four mice per cage by a blinded laboratory animal technician, and groups were balanced for average body weight. Female mice were chosen for this trial to maintain consistency with the previous experiment from our group examining kefir in a mouse model of obesity(Reference Bourrie, Cotter and Willing5). Mice received a diet consisting of 40 % energy content from fat supplemented with 1·25 % cholesterol by weight (Research Diets D12108C; composition in online Supplementary Table S1). Kefir was mixed into the food daily at a ratio of 2 ml kefir:20 g of food, which equates to approximately ¼ cup of kefir for a human on a 8368 kJ/d (2000 kcal/d) diet. All mice were housed on aspen wood chip bedding in filter-topped cages with nestlets, tunnels and nesting material as enhancements. Room conditions and access to food and water were carried out as previously described(Reference Bourrie, Cotter and Willing5). Cages were allocated to one of five groups (n 8) consisting of HFD + commercial kefir (COM), HFD + traditional kefir (ICK), HFD + pitched kefir (Pitch), HFD + pitched kefir without the inclusion of Lactobacillus species (PNL) and HFD + pitched kefir without the inclusion of yeast species (PNY). Body weights were taken weekly for the duration of the study, and faecal samples were collected weekly for the first 4 weeks of kefir treatment. After 8 weeks, the animals were euthanised by CO2 asphyxiation and tissues and caecal content collected, snap-frozen and stored at –80°C until further analysis. All experiments were carried out following Canadian Council on Animal Care guidelines with approval from the Animal Care and Use Committee at the University of Alberta (AUP 00000671).
Fungal faecal plating
Faecal samples were collected and weighed prior to being homogenised in PBS. Homogenised samples were then serially diluted and plated on yeast extract glucose chloramphenicol media. Fungal colonies were counted and quantified as CFU/g faeces. To determine survival of all kefir yeasts through the tract, DNA was extracted from representative colonies and internal transcribed spacers (ITS) sequences determined to identify isolates using NCBI BLAST.
Plasma cholesterol measurements
Plasma was prepared, and total cholesterol and HDL were determined as previously described(Reference Bourrie, Cotter and Willing5). Non-HDL-cholesterol was determined by subtracting HDL-cholesterol from total cholesterol.
Liver TAG analysis
Liver lipids were extracted, and TAG were quantified as previously described(Reference Bourrie, Cotter and Willing5).
Liver histopathology
Each mouse had the left lobe of the liver collected for histological analysis. Liver tissue was cut and fixed in 10 % neutralised formalin buffer for downstream histological analysis. All histological assessments were performed by a single investigator (C. S.) who was blinded to treatment. As manual measurement and counting of vacuoles can be error-prone, hepatocyte of zone 2 according to Rappaport was assessed using an operator-interactive, semi-automated method for quantification of data as previously reported(Reference Amella, Cappello and Kahl26). The parameters measured from haemotoxylin and eosin (H&E) stained sections were the variation of area, perimeter and width of the vacuoles as well as the variation of their angle, circularity, and Feret, skewness and kurtosis. The Feret diameter is the longest distance between any two points along the selection boundary.
Gene expression
Total RNA was isolated from liver tissue, and gene expression analysis was carried out as previously described(Reference Bourrie, Cotter and Willing5). Primers for host genes are listed in online Supplementary Table S1.
Microbiota analyses
Total DNA was extracted from caecal content as previously described(Reference Willing, Vacharaksa and Croxen27). 16S rRNA gene amplicon sequencing and data analysis was performed as previously described(Reference Bourrie, Cotter and Willing5).
Statistical analyses
All data are presented as mean values with their standard errors. The level of significance for all analyses was set at P < 0·05, and P values between 0·05 and 0·1 were considered as indications of effects and mentioned as trends. Sample size was determined by power analysis with a statistical power of 80 % and a two-sided significance level of 0·05 using an effect size of a 20 % reduction in plasma total cholesterol, as this was approximately half the effect size observed in a previous trial(Reference Bourrie, Cotter and Willing5). This analysis resulted in a total population of forty mice with a sample size of eight mice per group. Data were tested for normality using the Shapiro–Wilk test, while homogeneity of variance was tested using Bartlett’s test. Plasma cholesterol, liver TAG and gene expression data were analysed using ANOVA with Tukey post hoc for multiple comparisons utilising the R packages multcompView, ggplot2, plyr and lmPerm. Effect of treatment on microbiota was determined using permutational MANOVA (ADONIS), while relative abundance from phylum to genus taxonomic levels was determined using the Kruskal–Wallis test.
Results
Kefir composition did not impact weight gain
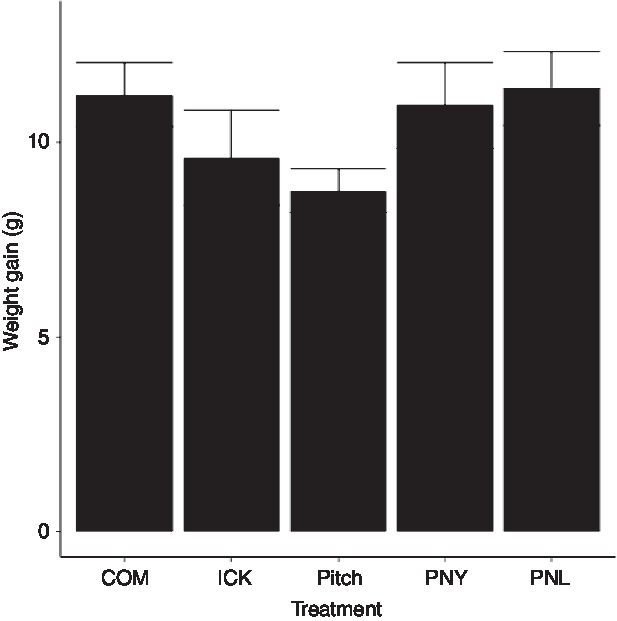
As our group had previously observed a reduction in weight gain in HFD mice fed a traditional kefir (ICK), here we investigated the relative ability of a pitch culture containing key ICK strains, and PNL and PNY variants thereof, to reduce weight gain in mice fed a HFD over an 8-week feeding period, relative to ICK and commercial kefir controls. After 8 weeks, there was no difference in body weight gain between groups (P > 0·05; Fig. 1).
Weight gain of mice fed a high-fat diet supplemented with different examples of kefir for 8 weeks. Data are mean values with their standard errors (n 8). COM, mice fed a high-fat diet supplemented with commercial kefir for 8 weeks; ICK, mice fed a high-fat diet supplemented with traditional kefir ICK for 8 weeks; Pitch, mice fed a high-fat diet supplemented with pitched culture kefir for 8 weeks; PNY, mice fed a high-fat diet supplemented with pitched kefir containing no yeast population; PNL, mice fed a high-fat diet supplemented with pitched kefir containing no lactobacilli.
Kefir yeast survived passage through the gastrointestinal tract
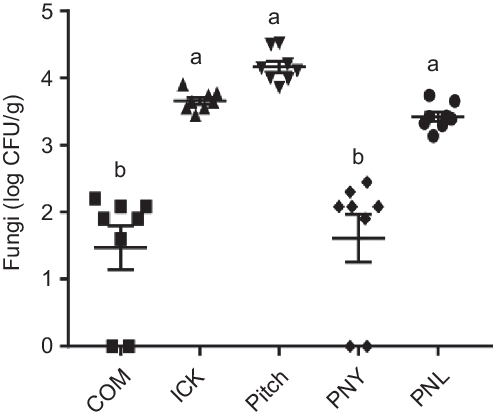
As individual yeasts present in kefir have been associated with decreases in cholesterol(Reference Liu, Xie and Xiong6,Reference Yoshida, Yokoi and Ohishi28) , we determined how kefir yeast was able to survive transit through the mouse gut. Following kefir feeding, the ICK, Pitch and PNL mice had significantly higher quantities of faecal fungal colonies than both the commercial and PNY fed mice, with approximately a 2 log difference being observed (Fig. 2). Additionally, the faecal-derived colonies from each of the ICK, Pitch and PNL-treatment groups were made up of representatives of each of the major species of yeast present in the kefir (P. fermentans, S. cerevisiae, K. unispora and K. marxianus), while all colonies isolated from the COM and PNY groups belonged to the genus Rhizopus.
Enumeration of fungi from faeces of mice fed a high-fat diet supplemented with different examples of kefir for 8 weeks. Data are mean values with their standard errors (n 8). a,b Means that do not share a letter are significantly different (P < 0·05). CFU, colony-forming units; COM, mice fed a high-fat diet supplemented with commercial kefir for 8 weeks; ICK, mice fed a high-fat diet supplemented with traditional kefir ICK for 8 weeks; Pitch, mice fed a high-fat diet supplemented with pitched culture kefir for 8 weeks; PNY, mice fed a high-fat diet supplemented with pitched kefir containing no yeast population; PNL, mice fed a high-fat diet supplemented with pitched kefir containing no lactobacilli.
Certain kefir improved plasma cholesterol levels and profiles
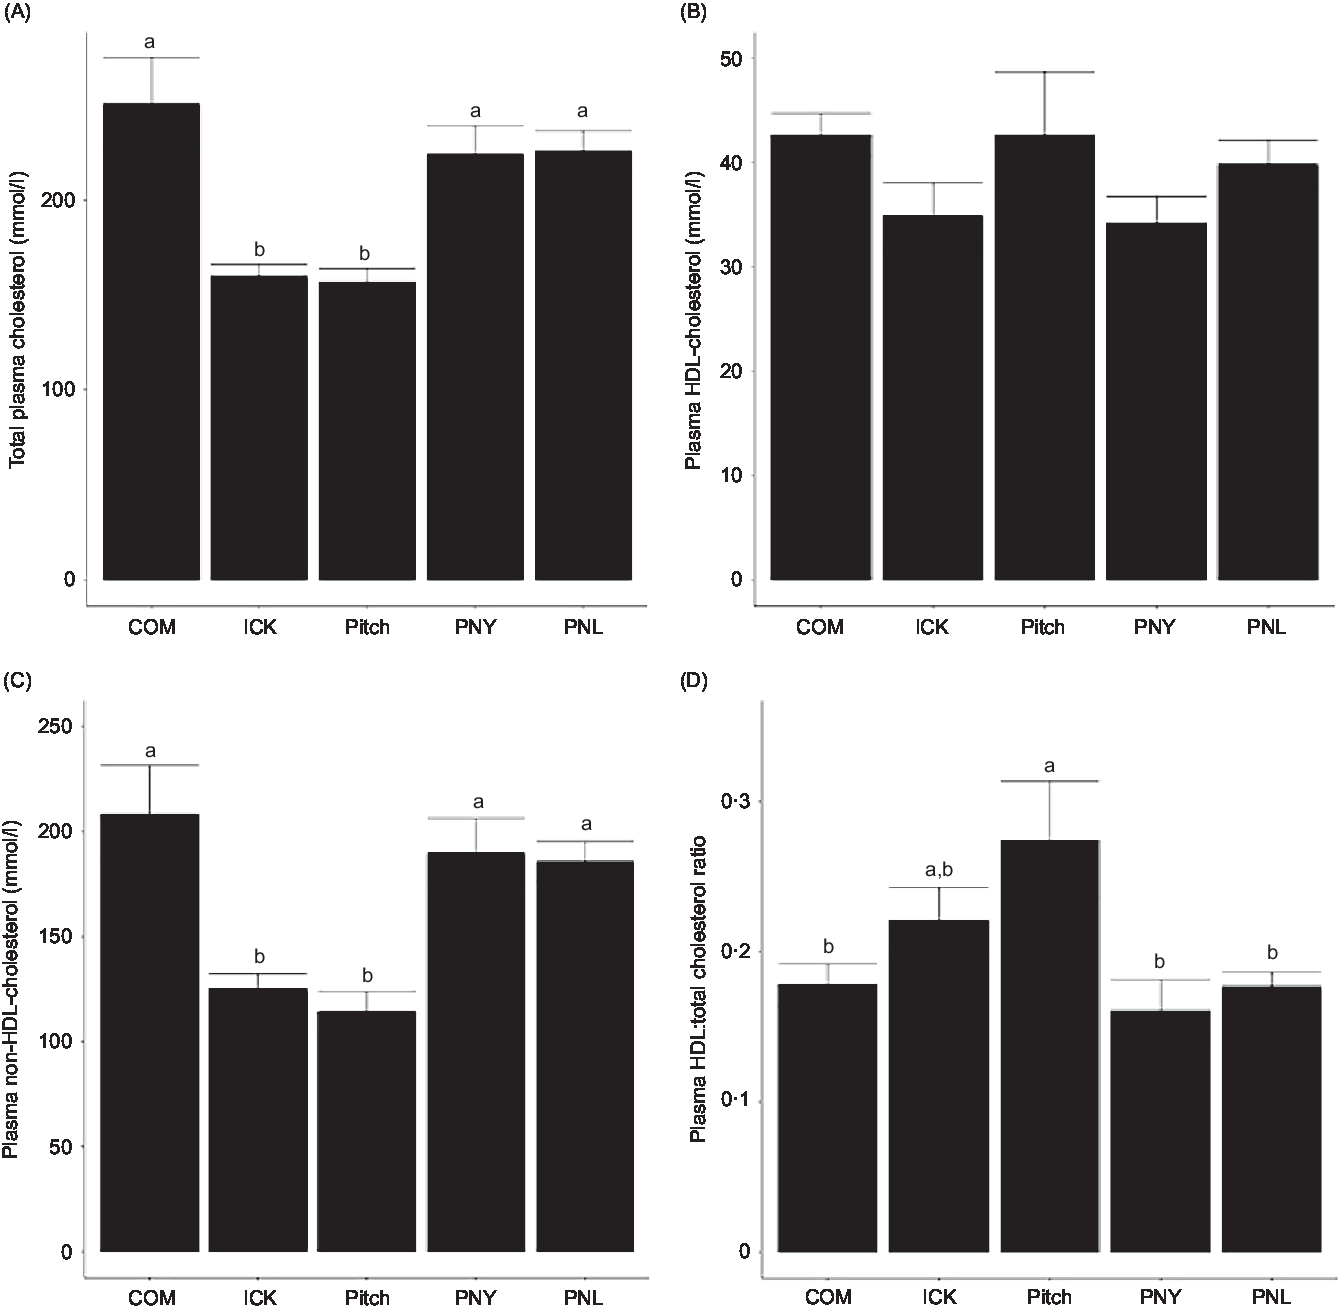
To determine if kefir composition impacted cholesterol metabolism, total plasma cholesterol, HDL and non-HDL-cholesterol levels were analysed and the HDL:total cholesterol ratio was calculated. Both the ICK and Pitch groups had similar total cholesterol levels, which were lower than those observed among the COM, PNL and PNY animals (P < 0·05 Fig. 3(A)). The same pattern between treatments was observed for plasma non-HDL-cholesterol, while plasma HDL-cholesterol levels were not significantly different between groups (Fig. 3(B) and (C)). Additionally, the Pitch-treated group showed improved HDL:total cholesterol ratios when compared with the COM-, PNL- and PNY-treated groups (P < 0·05, Fig. 3(D)). Overall, ICK and Pitch kefir improved plasma cholesterol profiles.
Concentration of plasma total cholesterol (A), non-HDL-cholesterol (B), HDL-cholesterol (C) and HDL:total cholesterol ratio (D) of mice fed a high-fat diet supplemented with different examples of kefir for 8 weeks. Data are mean values with their standard errors (n 8). a,b Means that do not share a letter are significantly different (P < 0·05). COM, mice fed a high-fat diet supplemented with commercial kefir for 8 weeks; ICK, mice fed a high-fat diet supplemented with traditional kefir ICK for 8 weeks; Pitch, mice fed a high-fat diet supplemented with pitched culture kefir for 8 weeks; PNY, mice fed a high-fat diet supplemented with pitched kefir containing no yeast population; PNL, mice fed a high-fat diet supplemented with pitched kefir containing no lactobacilli.
Traditional (ICK) and pitched kefir improved liver TAG levels
TAG in the liver were measured in order to determine if kefir composition plays a role in protection against NAFLD. Both the ICK and pitched kefir groups showed significantly lower levels of TAG when compared with commercial kefir-, PNL- and PNY-fed mice (Fig. 4).
Total TAG in the liver of mice fed a high-fat diet supplemented with different examples of kefir for 8 weeks. Data are mean values with their standard errors (n 8). a,b Means that do not share a letter are significantly different (P < 0·05). COM, mice fed a high-fat diet supplemented with commercial kefir for 8 weeks; ICK, mice fed a high-fat supplemented with traditional kefir ICK for 8 weeks; Pitch, mice fed a high-fat diet supplemented with pitched culture kefir for 8 weeks; PNY, mice fed a high-fat diet supplemented with pitched kefir containing no yeast population; PNL, mice fed a high-fat diet supplemented with pitched kefir containing no lactobacilli.

Kefir microbiota did not impact liver histopathology
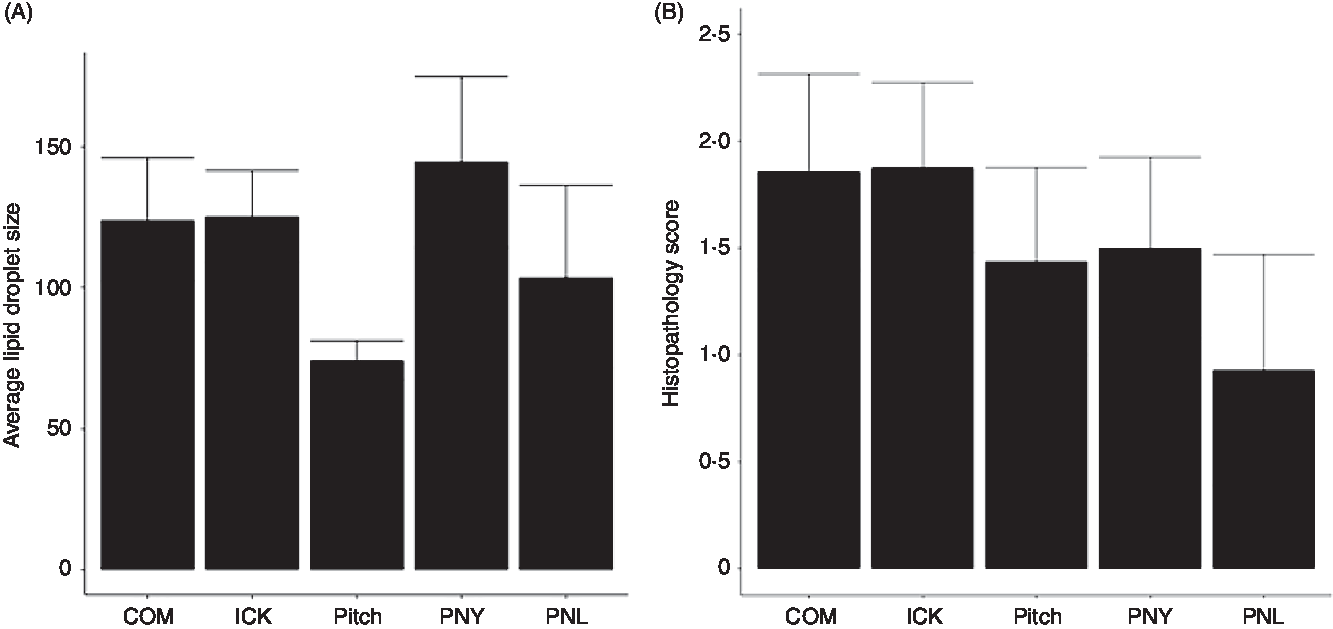
As increased liver TAG have been associated with the development of NAFLD and steatohepatitis, we examined the average size of lipid droplets in the liver and assigned histological scores for the degree of steatohepatitis present. Average size of lipid droplets in the liver was not significantly different between treatment groups (Fig. 5(A)). Histopathological scoring showed no significant differences between groups (Fig. 5(B)).
Average size of lipid droplets (A) and histopathology scores (B) of livers from mice fed a high-fat diet supplemented with different examples of kefir for 8 weeks. Data are mean values with their standard errors (n 6–8). COM, mice fed a high-fat diet supplemented with commercial kefir for 8 weeks; ICK, mice fed a high-fat diet supplemented with traditional kefir ICK for 8 weeks; Pitch, mice fed a high-fat diet supplemented with pitched culture kefir for 8 weeks; PNY, mice fed a high-fat diet supplemented with pitched kefir containing no yeast population; PNL, mice fed a high-fat diet supplemented with pitched kefir containing no lactobacilli.
Kefir composition is a factor in improving host lipid metabolism but not inflammatory markers
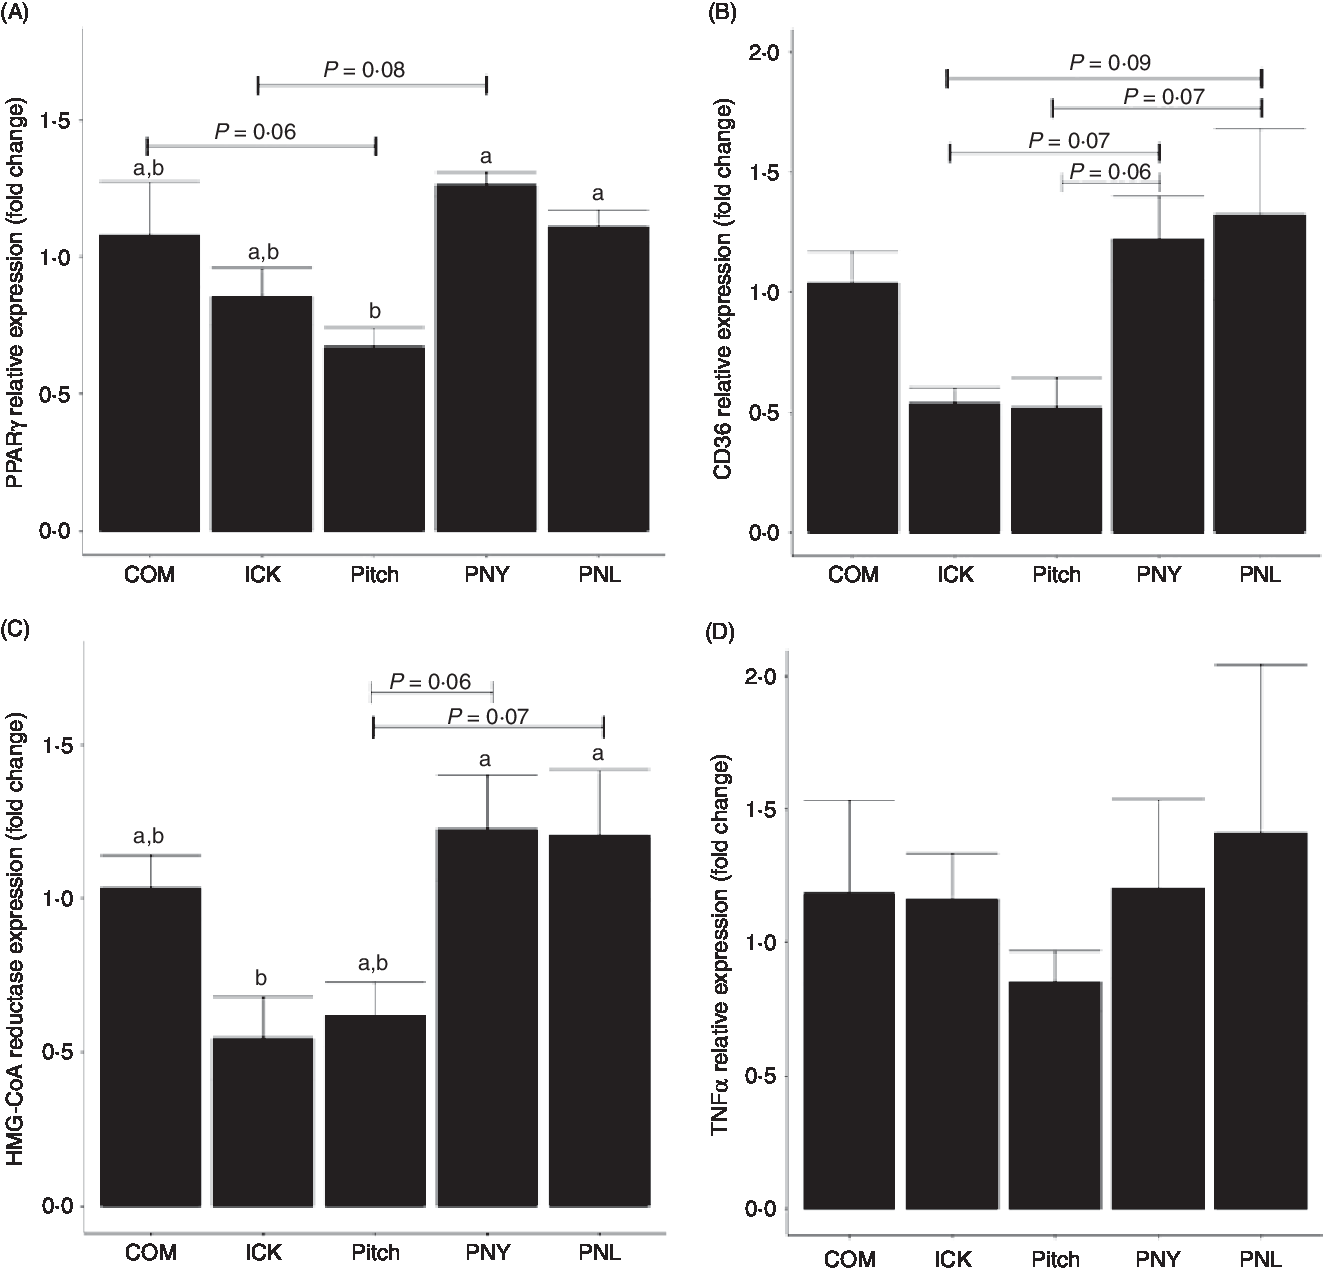
To determine how different kefirs were able to alter circulating cholesterol levels in mice, the expression of PPARγ, CD36 and 3-hydroxy-3-methylglutaryl-coenzyme A (HMG-CoA) reductase was measured in the liver. PPARγ expression was lower in the Pitch group when compared with the PNL and PNY (P < 0·05, Fig. 6(A)), while there was a trend for Pitch to be lower than the COM group. ICK did not have significantly lower expression than any of the other groups; however, there was a trend for ICK to be lower than PNL. CD36 showed similar patterns to PPARγ; however, none of the differences in expression levels was significant. In this case, PNY and PNL groups showed a trend to have higher expression than both ICK and Pitch (Fig. 6(B)). HMG-CoA reductase followed a similar pattern to PPARγ, with ICK having significantly reduced expression compared with PNY and PNL, while Pitch showed a trend to be lower than both PNY and PNL (Fig. 6(C)). In contrast to the alterations to expression levels of cholesterol-related genes in the liver, TNFα expression was not changed by any of the kefir treatments (P > 0·05, Fig. 6(D)).
Relative expression of PPARγ (A), cluster of differentiation 36 (CD36) (B), 3-hydroxy-3-methylglutaryl-coenzyme A reductase (HMG-CoA reductase) (C) and TNFα (D) in the liver of mice fed a high-fat diet supplemented with different examples of kefir for 8 weeks. Data are mean values with their standard errors (n 8). a,b Means that do not share a letter are significantly different (P < 0·05). COM, mice fed a high-fat diet supplemented with commercial kefir for 8 weeks; ICK, mice fed a high-fat diet supplemented with traditional kefir ICK for 8 weeks; Pitch, mice fed a high-fat diet supplemented with pitched culture kefir for 8 weeks; PNY, mice fed a high-fat diet supplemented with pitched kefir containing no yeast population; PNL, mice fed a high-fat diet supplemented with pitched kefir containing no lactobacilli.
Microbiota composition analysis
As the gastrointestinal microbiota has been linked to metabolic health, and kefir is often touted as a probiotic product with beneficial effects on the gut microbiota, our objective was to determine how kefir feeding impacted microbiome composition. β-Diversity of day 56 caecal microbiota was compared using Bray Curtis distance metric and visualised with principal coordinates analysis (PCoA) (online Supplementary Fig. S1). ADONIS analysis showed a significant effect of treatment and the COM group separated slightly from the rest of the kefir groups on the PCoA. This may have been due to a complete lack of the bacterial genera Leuconostoc in the caeca of commercial kefir-fed mice, while all other groups contained reads assigned to this genus, although at relatively low abundance (0·0209–0·00039 % relative abundance). Outside of this genus, there were no other significantly different genera between groups. α-Diversity was measured using both the Shannon and Simpson indices and was not significantly different among groups (online Supplementary Fig. S2).
Discussion
This is the first study to examine how specific changes to the microbial composition of kefir fermentations impact the ability of said kefir to improve cholesterol levels and metabolism. Given the significant differences in microbial communities present in the different kefirs, we expected that there would be some variability in their ability to impact cholesterol metabolism phenotypes in the presence of a high-fat/high-cholesterol diet. Indeed, we observed that both the traditional (ICK) and Pitch kefir-fed groups had significantly lower levels of both total and non-HDL-cholesterol than the commercial, PNY and PNL groups while having unaltered levels of HDL-cholesterol. This is in line with previous results from our group showing that traditional kefir can outperform a commercial example in improving cholesterol profiles in a mouse model of obesity(Reference Bourrie, Cotter and Willing5), while also highlighting the importance of microbial composition in the health benefits associated with kefir. This is especially important as elevated circulating cholesterol levels are indicative of an increased risk of the metabolic syndrome and CVD(Reference Després and Lemieux29). Additionally, functional food products are becoming more popular among the public as a means to improve metabolic health, and these results indicate that the microbial composition of these products needs to be taken into consideration when evaluating their health benefits.
HMG-CoA reductase is an especially important component of cholesterol homoeostasis as it is the rate-limiting enzyme in the biosynthesis of cholesterol. HMG-CoA reductase inhibitors have been utilised to treat hypercholesterolaemia for decades(Reference Grundy30,Reference Reihner, Rudling and Stahlberg31) . In our trial, we observed that the ICK group had significantly lower HMG-CoA reductase expression when compared with PNY and PNL groups, while Pitch-fed mice showed a trend to have lower expression levels than PNY- and PNL-fed mice. The pattern of HMG-CoA reductase expression was consistent with differences in plasma cholesterol and may explain the reduction in plasma cholesterol levels observed in the ICK and Pitch groups as expression levels of HMG-CoA reductase in the liver have been established to contribute to increased circulating cholesterol(Reference Chmielewski, Sucajtys and Swierczynski32,Reference Wu, Sarna and Hwang33) .
Another potential disease state associated with obesity and hyperlipidaemia is NAFLD, a significant risk factor for the development of steatosis and liver cancer, which is nearing epidemic levels worldwide(Reference Loomba and Sanyal34,Reference Duan, Zhang and Fan35) . One common indicator of NAFLD and non-alcoholic steatohepatitis is the quantity of TAG in the liver(Reference Angulo36). We determined that, concurrent with the changes observed in plasma cholesterol, ICK and Pitch mice exhibited lower liver TAG when compared with COM, PNY and PNL mice. Hepatic PPARγ and CD36 expression, which have been shown to have increased expression when liver TAG are increased(Reference Inoue, Ohtake and Motomura37–Reference Malaguarnera, Di Rosa and Nicoletti39), showed patterns of lower expression in Pitch and ICK mice relative to PNY and PNL. Additionally, HMG-CoA reductase expression has been shown to correlate with NAFLD and non-alcoholic steatohepatitis(Reference Min, Kapoor and Fuchs40), which may help to further explain the differences observed in liver TAG. These changes may point to an ability of specific kefirs to alter host lipid metabolism in the liver, leading to a decrease in the hyperlipidaemia commonly associated with obesity.
Interestingly, in contrast to our findings related to liver TAG deposition and lipid metabolism, histopathological scoring or liver lipid droplet size was not different between treatment groups, although exhibited high variation. This may be due to a lack of differences observed in the expression of the inflammatory cytokine TNFα in the liver as TNFα has been shown to be important in the development of non-alcoholic steatohepatitis(Reference Crespo, Cayón and Fernández-Gil41,Reference Takahashi, Soejima and Fukusato42) . Additionally, recent work has shown the importance of IL-1β and the activation of the NLRP3 inflammasome in the development of steatohepatitis in mice(Reference Miura, Kodama and Inokuchi43,Reference Mridha, Wree and Robertson44) . Previous work from our group failed to detect any differences in intestinal expression of the NLRP3 inflammasome markers IL-1β or IL-18 in mice fed kefir on a HFD(Reference Bourrie, Cotter and Willing5). This lack of an anti-inflammatory effect of kefir may explain the similarities in histopathology scoring between the treatment groups.
Recently, it has been shown that the gastrointestinal microbiota plays an important part in the development of obesity-associated metabolic disorders(Reference Everard and Cani45–Reference Rosenbaum, Knight and Leibel47). Given this, and the fact that kefir is generally regarded as a health-promoting beverage with beneficial effects on the gut, we examined the bacterial composition of the caecal microbiota following 8 weeks of HFD feeding supplemented with kefir. Although there was a significant effect of treatment in the ADONIS, there was minimal separation of groups on the PCoA, with the commercial group clustering somewhat separately from the grain-fermented and pitched culture kefir-fed groups. This was likely due to the non-detection of Leuconostoc in the gut of commercial mice, while each of the other groups contained this genus. This is interesting as the commercial kefir is marketed to contain live cultures of Leuconostoc and suggests that the strain present in this commercial product is less adept at surviving passage through the gastrointestinal tract than those contained in the freshly fermented kefir. It was also notable that, despite containing live yeast culture in the form of S. florentinus, the commercial kefir-fed mice presented significantly lower quantities of faecal fungal colonies when compared with ICK-, Pitch- and PNL-fed mice. Furthermore, there were no S. florentinus identified from the yeast isolated from COM mice. The lack of dramatic differences in the gut microbiota of the different groups, as assessed via 16S rRNA gene amplicon sequencing, suggests that the mechanism of action of kefir is not tied to large-scale microbial changes in the gut and is instead dependent on more subtle changes in composition, changes to the microbiome on a functional metabolic level or fermentation products present in the kefir acting directly on the host.
Interestingly, the removal of both yeast and Lactobacillus from the pitched kefir fermentation resulted in the loss of a beneficial impact on cholesterol metabolism. This may point to a relationship between the yeast component and Lactobacillus spp. present in the kefir fermentation that results in the production of a metabolite that is unable to be produced when one group is missing. This hypothesis is supported by recent work identifying interactions between lactobacilli and Saccharomyces species in various fermentations(Reference Mendes, Sieuwerts and de Hulster48–Reference Ponomarova, Sevin and Mülleder50) with some of these interactions being strain-dependent. In fact, metabolic by-products of kefir fermentation, such as small peptides and the exopolysaccharide kefiran, have been identified to have potentially positive effects on cholesterol metabolism in the past(Reference Chen, Tsai and Tsai11,Reference Uchida, Ishii and Inoue51–Reference Tung, Chen and Wu54) . These studies indicate that there is a possibility that the absence or lowering of a specific metabolic by-product or products could result in a drastically different effect of the kefir in question on the host, once again highlighting the importance of microbial composition in the ability of kefir to benefit host health. Furthermore, the fact that similar faecal yeast counts were obtained for Pitched and PNL suggests that the yeast survival in the tract may not be important to the cholesterol-lowering effect. This is in contrast to previous studies which have shown that kefir yeast can lower plasma cholesterol in animal models(Reference Liu, Xie and Xiong6,Reference Yoshida, Yokoi and Ohishi28) ; however, these studies utilised pure cultures or cell components of yeast which may explain these differences.
This study expands on previous work showing that kefir is able to improve cholesterol metabolism and that traditional kefir is more capable of improving metabolic health than certain commercial examples(Reference Bourrie, Cotter and Willing5,Reference Chen, Tung and Tsai12,Reference Kim, Kim and Jeong55) ; however, this is the first study to our knowledge to examine how specific alterations to the microbial composition of kefir impact host health and lipid metabolism in an in vivo model of diet-induced obesity. Both the grain-fermented ICK kefir and a laboratory-produced Pitch kefir utilising organisms isolated from ICK lowered plasma total cholesterol, non-HDL-cholesterol and liver TAG when compared with a widely available commercial kefir as well as laboratory-produced kefir that lacked either the Lactobacillus or yeast population. These greater impacts were likely due to an alteration of the host cholesterol and lipid metabolism in the liver based on observed changes to gene expression profiles. Our results show that, although many commercial kefirs have microbes of the same genera as those present in traditional kefir, the exact species and perhaps even strain of these species may be essential to the health benefits observed in previous studies utilising traditionally fermented kefir. This is not surprising given the importance of species and strain level differences in other fermented foods(Reference Marco, Heeney and Binda56). We also showed that the health benefits of traditional kefir can be recapitulated utilising traditional kefir organisms in a process of producing kefir using pitched cultures, indicating a potential important consideration in the future development of large-scale kefir production. This study highlights the importance of microbial composition and interactions in functional fermented foods and indicates that a failure to accurately replicate or retain key microbes present in such foods can have detrimental effects on the ability of said functional food to exert a positive influence on the host. It is important to note that female mice were used for this study, while the majority of metabolic work is carried out in male mice. Male C57BL/6 mice generally exhibit more severe and slightly different metabolic phenotypes than females when fed a HFD(Reference Hwang, Wang and Li57,Reference Yang, Smith and Keatg58) , and as such, future work should examine whether the effects observed in this study are also present in male C57BL/6 mice. However, given the increase in metabolic disorders in female populations worldwide, there is a need for more studies examining these conditions in female populations(Reference Engin, Engin and Engin59). Future work should focus on identifying the specific species necessary to achieve the health benefits observed while also examining how microbial interactions during fermentation may play a role in these benefits.
Acknowledgements
We thank Nicole Coursen and Deanna Pepin for assistance with animal handling.
The authors are funded through a Canadian Dairy Commission Graduate Scholarship, the Weston Foundation, the Teagasc Walsh Fellowship Scheme (2014025) and internal Teagasc funding (RMIS6486). B. P. W. is supported by the Canada Research Chairs Program. Research in the Cotter laboratory is funded by the ‘MASTER’ project, an Innovation Action funded by the European Commission under the H2020 Programme (grant number 818368), by Science Foundation Ireland (SFI) in the form of the Centre grant APC Microbiome Ireland (grant number 12/RC/2273), by SFI and the Department of Agriculture, Food and the Marine in the form of the Centre grant Vistamilk (16/RC/3835) and through Enterprise Ireland (Food for Health Ireland; phase 3). This research was supported by a Natural Sciences and Engineering Research Council Discovery grant held by B. P. W.
B. C. T. B., P. D. C. and B. P. W. designed the research; B. C. T. B., T. J. and A. J. F. conducted the research; B. C. T. B. and J. M. F. analysed the data; B. C. T. B., P. D. C. and B. P. W. wrote the paper; B. P. W. had primary responsibility for final content. All authors read and approved the final manuscript.
The authors declare that there are no conflicts of interest.
Supplementary material
For supplementary material referred to in this article, please visit https://doi.org/10.1017/S0007114520002743


