A sustained postprandial glycaemic response is advantageous for facilitating physical and cognitive performance( Reference Kirwan, Cyr-Campbell and Campbell 1 – Reference Nilsson, Radeborg and Bjorck 5 ). Working memory and selective attention, for example, were improved in the later postprandial period following consumption of a food item (bread enriched with guar gum) that elicited higher net glucose availability in the postprandial period compared with a reference food item (bread without guar gum). In addition, evidence suggests that consuming moderate glycaemic index foods 1–2 h before exercise better maintains euglycaemia and maximises carbohydrate oxidation during endurance exercise v. high glycaemic index foods which result in lower net glucose availability during the postprandial period( Reference Kirwan, Cyr-Campbell and Campbell 1 – Reference Kirwan, O’Gorman and Cyr-Campbell 3 ). In addition, slowing glucose absorption prevents postprandial hyperinsulinaemia, which in turn causes a rapid drop in blood glucose to below fasting concentrations. The resulting relative hypoglycaemia initiates a counter-regulatory hormone response that promotes gluconeogenesis, glycogenolysis, free fatty acid release and oxidative stress( Reference Ludwig 6 ). Given the popularity of foods high in rapidly digested carbohydrate and the advantages of promoting a sustained glycaemic response to promote physical and cognitive performance, there is substantial interest in developing food products that moderate postprandial glycaemic responses( Reference Hanhineva, Torronen and Bondia-Pons 7 ).
Polyphenols are a heterogeneous group of phytochemicals found in plant-based foods, many of which display anti-oxidant and anti-inflammatory properties, but which are also thought to modulate carbohydrate metabolism( Reference Hanhineva, Torronen and Bondia-Pons 7 ). In support, some studies have shown that whole berries, berry extracts, apple extract or juice and a mixture of polyphenol and fibre-rich foods (e.g. green tea, apple peel and freeze-dried berry powders) modulate the glycaemic response following consumption of sugar water or starch-based food items( Reference Castro-Acosta, Smith and Miller 8 – Reference Torronen, Sarkkinen and Niskanen 14 ). For example, Torronen et al. ( Reference Torronen, Kolehmainen and Sarkkinen 13 , Reference Torronen, Sarkkinen and Niskanen 14 ) demonstrated that consuming polyphenol-rich berry nectars or berry purees with a high-carbohydrate food favourably modulated postprandial glycaemia in healthy adults by slowing glucose absorption and enhancing insulin and glucagon-like peptide-1 (GLP-1) secretion. However, an acknowledged limitation of those studies was a higher dietary fibre content and viscosity of the berry interventions relative to control, as both fibre and viscosity influence postprandial glycaemia and endocrine responses. In contrast, studies by Castro-Acosta( Reference Castro-Acosta, Smith and Miller 8 , Reference Castro-Acosta, Stone and Mok 9 ) observed a blunted glycaemic response when a starchy meal was provided with polyphenol-rich apple and blackcurrant extracts (i.e. devoid of fibre). With regard to the mechanisms of the glycaemic and glucoregulatory hormone modulation, in vitro and animal studies suggest that polyphenols, including those found in berries and in extracts of polyphenol-rich foods, can inhibit the carbohydrate digestive enzymes α-amylase and α-glucosidase, slow glucose absorption, modulate secretion of insulin and/or the incretin hormones glucose-dependent insulinotropic polypeptide (GIP) and GLP-1( Reference Castro-Acosta, Stone and Mok 9 , Reference Torronen, Sarkkinen and Niskanen 14 , Reference Williamson 15 ) and stimulate glucose uptake into insulin-sensitive tissues through increased activation of insulin receptors( Reference Hanhineva, Torronen and Bondia-Pons 7 ). As such, polyphenol fortification of high-carbohydrate foods may help improve postprandial glycaemic control. This could have the added benefits of reducing free fatty acid release and oxidative stress( Reference Chen, Milbury and Lapsley 16 ) and preventing increases in appetite that may result from rapid drops in blood glucose concentrations( Reference Hanhineva, Torronen and Bondia-Pons 7 ).
Our group and others have previously reported that cranberry and black raspberry polyphenols inhibit α-amylase and α-glucosidase activities in vitro ( Reference Barrett, Ndou and Hughey 17 – Reference Barrett, Fortier and Apostolidis 19 ). The primary objective of this study was to translate those findings to human metabolism by determining dose–response effects of fortifying a high-carbohydrate food with freeze-dried black raspberries or with cranberry extract on postprandial glycaemia (i.e. glucose incremental AUC with respect to baseline, AUC, 0–180 min) in healthy adults. Fortified and non-fortified cereal bars were created that were approximately matched for fibre, macronutrients and physicochemical characteristics. Secondary objectives were to determine the effects on postprandial glucoregulatory hormone responses, appetite and ex vivo oxidative stress. We hypothesised that polyphenol fortification would result in a dose-dependent improvement in postprandial metabolic profiles and reduce appetite and ex vivo oxidative stress.
Methods
Participants
Participants were military and civilian personnel assigned to Natick Soldier Systems Center, Natick, MA. Twenty of the twenty-one participants who were enrolled and began the study completed data collection and were included in the data analyses. One participant was withdrawn from the study before consuming any of the cereal bars due to multiple failed catheter placements. Data collection occurred from January to November 2016 at the U.S. Army Research Institute of Environmental Medicine (USARIEM, Natick, MA). Each participant gave their written, informed consent after an oral explanation of the study. Men and women were included if they were 18–39 years; were generally healthy; had no history of liver disease, alcoholism, impaired glucose metabolism, thyroid disease, bleeding disorders, or gastrointestinal-related conditions that may impact glucose absorption; and had no allergy or aversion to any of the test foods. The study was approved by the Institutional Review Board, USARIEM. Investigators adhered to the policies for protection of human subjects as the prescribed DOD Instruction 3216·02, and the research was conducted in adherence to the provisions of 32 CFR Part 219. The Clinicaltrials.gov identifier is NCT02763020.
Design
This was a randomised, placebo-controlled, crossover trial conducted over five experimental sessions each separated by ≥5 d (9·5 (sd 5·2) d). Participants were assigned to experimental conditions using online software, Research Randomizer (www.randomizer.org). Flavour profile and colour of the bars provided some indication of the fruit contents; however, participants were unaware of which bars contained high v. low doses of the fruit ingredients. Study participants received written and verbal instructions to consume a low-polyphenol diet for two consecutive days before each session. Participants also consumed a provided dinner meeting approximately 1/3 of their estimated weight maintenance energy requirements the evening before testing.
On test days, participants arrived following a ≥12 h overnight fast. Adherence to pre-trial dietary restrictions and consumption of the standardised dinner meal were verified using food records that were reviewed by research dietitians during each session. Following IV catheter placement, participants consumed one of five cereal bars in ≤15 min. After bar consumption, the overall acceptability was rated on a Likert scale ranging from 1 (dislike extremely) to 9 (like extremely). Blood samples were collected and appetite was rated before and periodically for 180 min after bar consumption, to detect both the early and late postprandial responses of the outcome measures and to facilitate the ad libitum lunch test by providing a more realistic time frame between the ‘breakfast’ and lunch meals. During the 180 min postprandial period, participants remained seated and supervised and were not provided additional food or beverages other than 360 g of water. After 180 min, energy intake was measured during an ad libitum lunch.
Description of high-carbohydrate snack bars
Five different fibre and macronutrient-matched high-carbohydrate cereal bars were tested (Table 1). The placebo bar contained no freeze-dried fruit or fruit extract. Two bars contained freeze-dried black raspberries (10 % (LOW-Rasp) or 20 % (HIGH-Rasp) total weight), and two bars contained cranberry extract (0·5 % (LOW-Cran) or 1·0 % (HIGH-Cran) total weight). The base bar consisted of rice crisp cereal, marshmallows, butter and vanilla extract. The bar was loosely modelled after a Rice Krispie Treat (Kellogg Company), in an effort to promote palatability and to provoke marked glycaemia, which was necessary for testing the efficacy of polyphenol supplementation to moderate the glycaemic response.
Nutritional composition and acceptability of cereal barsFootnote * (Mean values and standard deviations)

* All bars were chemically analysed for nutritional content (Covance Laboratories Inc.).
† Contains 10 % freeze-dried black raspberry powder per total weight.
‡ Contains 20 % freeze-dried black raspberry powder per total weight.
§ Contains 0·5 % cranberry extract per total weight.
|| Contains 1 % cranberry extract per total weight.
¶ Starch content calculated as total carbohydrates minus total fibre and total sugar.
** Marginal model with Bonferroni corrections. Significantly different from reference P≤0·01.
Fructose powder, glucose powder or wheat bran was added to the bars, to approximately match sugar and fibre content between bars. The cranberry extract and raspberry powder were chosen based on their polyphenolic content and previous work by members of our group and others, suggesting that the polyphenol components (e.g. anthocyanins and proanthocyanidines) in these fruits effectively inhibited α-amylase and glucoamylase activity in vitro ( Reference Barrett, Ndou and Hughey 17 – Reference Barrett, Fortier and Apostolidis 19 ). The LOW-Rasp and HIGH-Rasp bars contained approximately 0·6 and 1·2 g of total polyphenols, respectively, based on gram weight of the bars (Table 1) and data indicating that black raspberries contain 0·98 g of polyphenols per 100 g of whole fruit( Reference Wada and Ou 20 ) (i.e. or approximately 5·1 g polyphenols per 100 g of freeze-dried black raspberry powder). The LOW-Cran and HIGH-Cran bars contained 0·3 and 0·6 g of polyphenols, respectively, based on gram weight of the bars (Table 1) and data indicating that the cranberry extract contains 45 g of polyphenols per 100 g of extract( Reference Martín, Ramos and Mateos 21 ). The polyphenols contained within HIGH-Rasp and LOW-Rasp were mostly anthocyanins, ellagitannins, ellagic acid and quercitin( Reference Wada and Ou 20 , Reference Gu, Ahn-Jarvis and Riedl 22 ), while the HIGH-Cran and LOW-Cran mainly consisted of flavanols (e.g. epicatechin), flavonols (e.g. quercetin) and phenolic acids (e.g. benzoic acid and chlorogenic acid), in addition to other polyphenolic compounds( Reference Martín, Ramos and Mateos 21 ). The highest dose of each fruit was based on the maximum dose that could be incorporated without compromising the organoleptic properties of the bars. The lower doses were included to assess the dose–response effects.
Blood sampling
An indwelling catheter was placed in the participants’ forearm or antecubital space upon arrival to the testing site. Blood samples were taken after catheter placement and every 15 min for the first hour and every 30 min thereafter (up to 180 min) following bar consumption. Whole blood was collected into serum tubes for measurement of glucose, insulin and C-peptide, and chilled EDTA tubes for measurement of GIP, GLP-1 and acylated ghrelin. EDTA tubes contained 4-(2-aminoethyl)-benzenesulfonyl fluoride, hydrochloride (100 mm; 50 µl/ml whole blood), dipeptidyl peptidase inhibitor IV (10 µl/ml whole blood) and aprotinin (770 nmol/ml whole blood, equivalent to 500 KIU/ml whole blood). Following serum and plasma separation, samples were stored at –80°C until analysis.
Glucose was measured on a Siemens Dimension Xpand Plus clinical chemistry analyser, while insulin and C-peptide were measured on a Siemens Immulite 2000 immunoassay system. GIP, active GLP-1 and acylated ghrelin were measured using the Milliplex MAP human metabolic hormone panel (Millipore), according to the manufacturer instructions. Assay sensitivity was 0·6 pg/ml for GIP, 1·2 pg/ml for GLP-1 and 13 pg/ml for acylated ghrelin.
Ex vivo LDL resistance against Cu2+-induced oxidation
Postprandial oxidative stress is regarded as a secondary response to postprandial hyperglycaemia and hypertriglyceridaemia( Reference Ceriello and Genovese 23 ). While there are many markers for assessment of oxidative stress, LDL oxidation was selected as a biomarker because of the involvement of oxidised LDL in the development of atherosclerosis. For example, Natella et al. ( Reference Natella, Ghiselli and Guidi 24 ) reported that postprandial LDL was more susceptible to metal-catalysed oxidation than the homologous baseline LDL after an ethanol meal. It was anticipated that postprandial hyperglycaemia may have the same impact on LDL susceptibility to oxidation as acute hyperglycaemia-induced oxidative stress in healthy people( Reference Marfella, Quagliaro and Nappo 25 ).
Plasma was mixed with sucrose (0·6 % final concentration), aliquoted and stored at –80°C. An ex vivo LDL oxidation assay was performed within 2 months of the sample collection. LDL (1·019–1·063 g/ml) was collected from the frozen plasma according to Chung et al. ( Reference Chung, Wilkinson and Geer 26 ) using a Beckman NVT-90 rotor (or similar) in a Beckman L8-M centrifuge (or similar). After salt removal using a desalting PD-10 column (Bio-Rad), the concentration of LDL was determined using a bicinchoninic acid protein assay kit (Pierce; or similar). Ex vivo LDL oxidation induced by Cu2+ was performed according to the method described by Chen et al. ( Reference Chen, Milbury and Lapsley 16 ). Formation of conjugated dienes was monitored by absorbance at 234 nm at 37°C for 6 h using a Shimadzu UV1800 spectrophotometer equipped with a six-position automated sample changer. The results of the assay are expressed as lag time, the intercept at the abscissa in the diene–time plot.
Plasma flavonoids and phenolic acids
Flavonoids (including the flavanols catechin and epicatechin and the flavonols quercetin, myricetin and isorhamnetin) and phenolic acids (including protocatechuic, phenylacetic, gentisic acid, benzoic acid, sinapic, caffeic, ferulic, vanillic and p-coumaric acids) in plasma were determined according to Chen et al. ( Reference Chen, Milbury and Lapsley 16 ), to provide insight into oxidative stress results. Briefly, plasma was incubated with vitamin C-EDTA and β-glucuronidase/sulfatase at 37°C for 45 min. Phenolic acids and flavonoids in the resulting mixture were extracted with acetonitrile, dried under purified N2 gas and reconstituted with mobile phase A for HPLC analysis using an ESA CoulArray System (ESA Inc.). Analyte separation was achieved using a Zorbax ODS C18 column (4·6×250 mm, 3·5 µm). Quantification of phenolic acids and flavonoids in unknown samples were calculated based on the standard curves constructed using authentic standards with adjustment for the internal standard (4′-hydroxy-3′-methoxyacetophenone).
Appetite testing
Two separate visual analogue scales were administered before each blood sample collection to measure the self-perceived appetite( Reference Blundell, de Graaf and Hulshof 27 ). Participants rated their levels of hunger and fullness by marking anywhere on a 10 cm scale anchored by phrases representing opposite extremes of a spectrum (e.g. ‘not at all hungry’ and ‘extremely hungry’).
An ad libitum lunch was served within 10 min after the final blood sample to provide an objective measure of appetite( Reference Karl, Young and Montain 28 , Reference O’Connor, Scisco and Smith 29 ). The meal consisted of Stouffer’s lasagna (41 % carbohydrate, 36 % fat, 23 % protein) and 240 g water. Participants were served 1653 (sd 57) g and instructed to eat until ‘comfortably full’. The amount of uneaten lasagna was weighed to calculate the energy intake.
Statistical analysis
Sample size estimates based on peak postprandial glucose concentrations, and using mean and variance data from Torronen et al. ( Reference Torronen, Kolehmainen and Sarkkinen 13 , Reference Torronen, Sarkkinen and Niskanen 14 , Reference Torronen, Sarkkinen and Tapola 30 ) indicated that twenty participants would allow detection of a 0·9 mmol/l (approximately 15 mg/dl) difference in peak glucose between trials with power=0·8 and α=0·01 to account for multiple comparisons.
Statistical analyses were conducted using the IBM SPSS statistical package version 24.0 (IBM Inc.). Data were examined for outliers both quantitatively and graphically, and normal distribution of data was examined via the Shapiro–Wilk test. All data, except glucose, appetite ratings, energy intake, and LDL lag, were log10 transformed for analysis to normalise distributions. Values that were below the assay limits of detection (13 % of values for GLP-1, 2 % for ghrelin, 4 % for insulin) were replaced with the lowest detectable limit for that assay before analysis.
Time to peak (i.e. for glucose, insulin, GLP-1, GIP, C-peptide) or nadir (i.e. for ghrelin) concentrations, change from baseline (time 0) to peak (i.e. for glucose, insulin, GLP-1, GIP, C-peptide, fullness) or nadir (i.e. for ghrelin, hunger) concentrations (Δmax), and incremental AUC with respect to baseline from 0 to 60 and 0 to 180 min were computed for all outcomes to standardise the results and used in the analyses to detect any differences between bars with regard to initial (AUC 0–60) and overall (AUC 0–180) postprandial responses. Analyses were run separately for the raspberry and cranberry interventions because the study objective was to assess dose–response effects within each intervention type and not to compare interventions. Data were analysed using marginal models to test for the main effects of treatment. Baseline (i.e. time 0 min) values were entered as covariates in the models, and carry-over effects were assessed by including terms for treatment order and its interaction with treatment. These terms were removed from the model if not significant. When significant main effects of treatment were observed, all possible t tests were conducted using the Bonferroni correction to adjust for multiple comparisons. The Kruskall–Wallis test was used to test for main effects of treatment on plasma flavonoid/phenolic acid content, because transformations did not normalise the data distribution. When significant main effects of treatment were observed, Mann–Whitney tests were conducted using Bonferroni corrections to adjust for multiple comparisons. Results are presented as means and standard deviations, unless otherwise noted. Two-tailed P values ≤0·05 were considered statistically significant, and P values ≤0·10 were considered trends.
Results
Participant characteristics
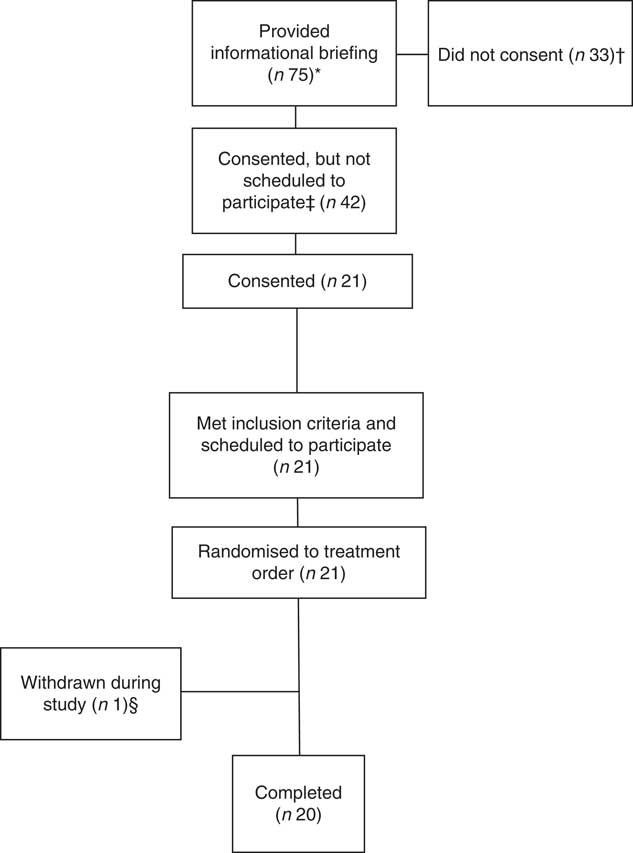
Eighteen men and two women completed the study (age: 24 (sd 5) years; BMI: 26·8 (sd 3·5) kg/m2) (Fig. 1). Energy and macronutrient intake in the 2 d before each trial, and in the evening meal before each trial, did not differ across trials (P>0·6) (online Supplementary Table S1). Body weight and fasting glucose and insulin concentrations did not differ across trials (P>0·3) (online Supplementary Table S2). Relative to the reference, the overall acceptability of the bars was rated lower for HIGH-Rasp and both cranberry bars (main effect of treatment, P≤0·02; Table 1).
Participant disposition. * Potential volunteers attended the briefing after seeing informational flyers or as part of their voluntary assignment in the Natick Soldier, Research, Development and Engineering Center’s Human Volunteer Detachment (Natick, MA). † Two individuals verbally indicated that they did not meet inclusion criteria. ‡ Not scheduled to participate due to scheduling conflicts. § Withdrawn due to multiple failed catheter attempts.
Glucose
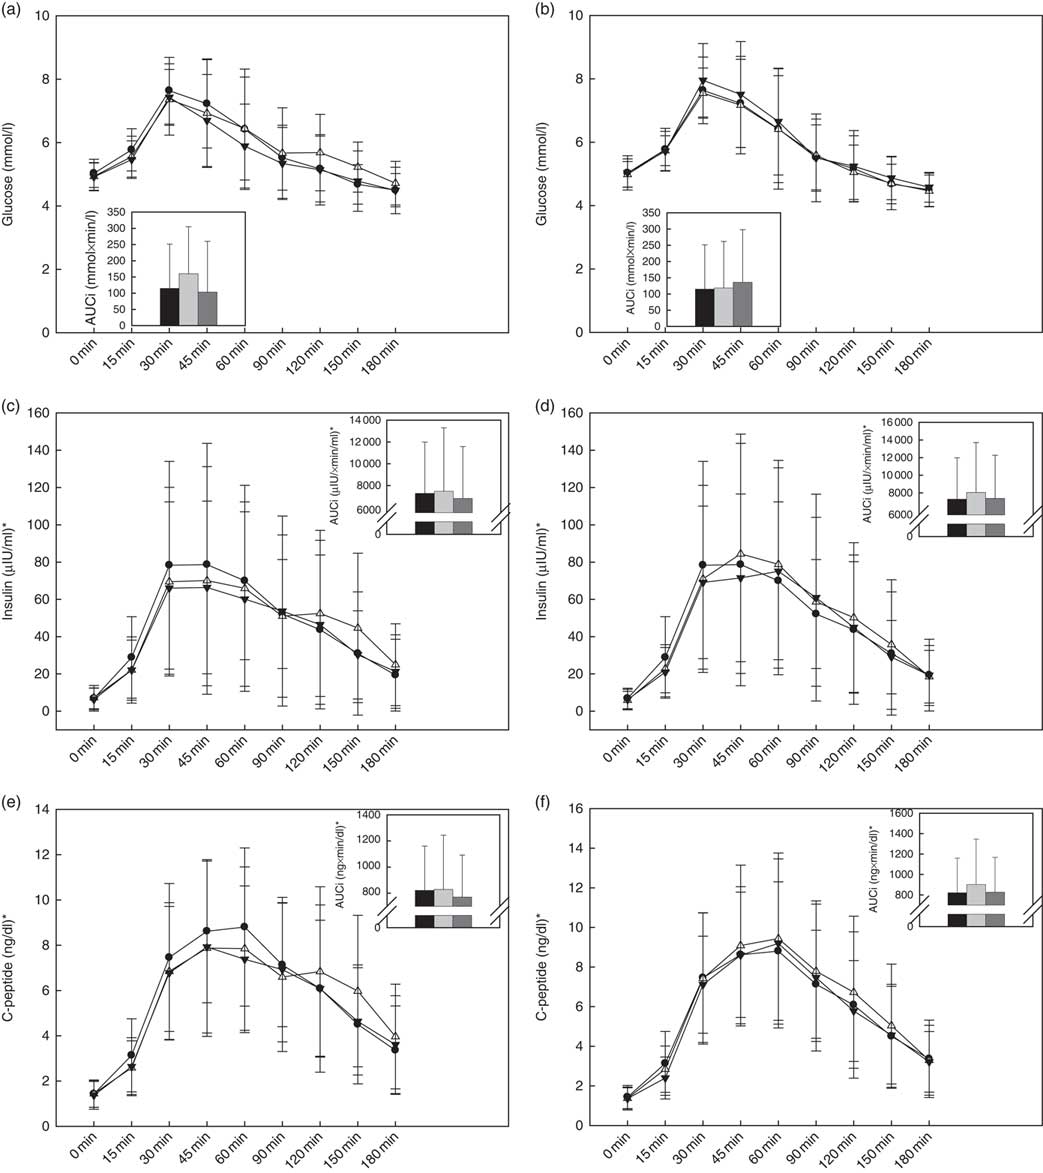
Within the raspberry treatments, there was a significant treatment effect on the overall glucose response (P=0·04), wherein a trend for a higher glucose AUC0–180 min was observed during HIGH-Rasp v. LOW-Rasp (P=0·06; Fig. 2(a)). Glucose Δmax, time to peak and AUC0–60 min were not affected by treatment (Table 2).
Baseline and postprandial glucose (a, b), insulin (c, d) and C-peptide (e, f) concentrations. Insets show incremental AUC (AUCi) 0–180 min postprandial. Values are means, with standard deviations represented by vertical bars. There was a treatment effect on the glucose AUC0–180min response (P=0·04): trend for higher glucose following consumption of black raspberry high v. black raspberry low (P=0·06). ![]() and
and ![]() , Reference (a–f);
, Reference (a–f); ![]() and
and ![]() , black raspberry high (a, c, e), cranberry high (b, d, f);
, black raspberry high (a, c, e), cranberry high (b, d, f); ![]() and
and ![]() , black raspberry low (a, c, e), cranberry low (b, d, f).*To convert insulin in μIU/ml to pmol/l, multiply by 6·945. To convert C-peptide in ng/dl to ng/l, multiply by 10.
, black raspberry low (a, c, e), cranberry low (b, d, f).*To convert insulin in μIU/ml to pmol/l, multiply by 6·945. To convert C-peptide in ng/dl to ng/l, multiply by 10.

Time to peak or nadir, and change from baseline to postprandial peak or nadir, blood concentrations of glucose, insulin, glucoregulatory and appetite-mediating hormonesFootnote * (Mean values and standard deviations)

Δmax, change from baseline to peak glucose, insulin, GLP-1, GIP, c-peptide concentrations or nadir acylated ghrelin concentrations; GLP-1, glucagon-like peptide-1; GIP, glucose-dependent insulinotropic polypeptide.
* Data analysed using marginal models with Bonferroni corrections. Δmax analyses included fasting blood concentrations as a covariate.
† Contains 10 % freeze-dried black raspberry powder per total weight.
‡ Contains 20 % freeze-dried black raspberry powder per total weight.
§ Contains 0·5 % cranberry extract per total weight.
|| Contains 1 % cranberry extract per total weight.
¶ Significant main effect of bar within raspberry treatment (P=0·02). To convert insulin in μIU/ml to pmol/l, multiply by 6·945.
** P=0·03 v. reference.
†† Trend for main effect of bar within raspberry treatment (P=0·09).
‡‡ P=0·09 v. reference.
§§ Significant main effect of bar within raspberry treatment (P=0·01).
|||| P=0·01 v. LOW-Rasp.
¶¶ To convert C-peptide in ng/dl to ng/l, multiply by 10.
The cranberry treatments had no effect on the postprandial glucose response (Table 2 and Fig. 2(b)).
Insulin
Within the raspberry treatments, there was a significant treatment effect on insulin Δmax (P=0·02), wherein the HIGH-Rasp response was lower relative to the reference (Table 2 and Fig. 3). There were no effects of the raspberry treatments on time to peak insulin or insulin AUC0–60 min or AUC0–180 min (Table 2 and Fig. 2(c)).
Baseline and postprandial glucagon-like peptide-1 (GLP-1) (a, b), glucose-dependent insulinotropic polypeptide (GIP) (c, d) and acylated ghrelin (e, f) concentrations. Insets show incremental AUC (AUCi) 0–180 min postprandial. Values are means, with standard deviations represented by vertical bars. * Significant difference between groups (P<0·05). There was a treatment effect on GIP AUC0–180min response (P=0·001): GIP was lower following the consumption of black raspberry high v. reference (P=0·014) and black raspberry low (P=0·003). ![]() and
and ![]() , Reference (a–f);
, Reference (a–f); ![]() and
and ![]() , black raspberry high (a, c, e), cranberry high (b, d, f);
, black raspberry high (a, c, e), cranberry high (b, d, f); ![]() and
and ![]() , black raspberry low (a, c, e), cranberry low (b, d, f).
, black raspberry low (a, c, e), cranberry low (b, d, f).

The cranberry treatment had no effects on the postprandial insulin response (Table 2 and Fig. 2(d)).
C-peptide
Within the raspberry treatments (Fig. 2(e)), there was a significant treatment effect (P=0·01), wherein participants C-peptide AUC0–60 was lower during HIGH-Rasp (247 (sd 117) ng/dl) compared with the reference (279 (sd 243) ng/dl), but there was no effect on AUC0–180 or time to peak C-peptide (Table 2).
The cranberry treatments had no effects on the postprandial C-peptide response (Table 2 and Fig. 2(f)).
Glucagon-like peptide-1
Within the raspberry treatments, there was a trend for a treatment effect (P=0·09), wherein GLP-1 Δmax trended towards being lower during HIGH-Rasp relative to the reference (Table 2 and Fig. 3(a)). No differences in time to peak GLP-1, AUC0–60 min or AUC0–180 min were observed (Fig. 3(a)).
Within the cranberry treatment, a carry-over effect was noted for GLP-1 AUC0–180 min. After removing the treatment sequence responsible for the carry-over effect, no differences across treatments were observed. No differences in time to peak GLP-1 or GLP-1 Δmax were observed (Table 2).
Glucose-dependent insulinotropic polypeptide
Within the raspberry treatments, there were significant treatment effects on the overall GIP response (P<0·05), wherein AUC0–60 and AUC0–180 for GIP were significantly lower following consumption of the HIGH-Rasp v. LOW-Rasp and/or reference bar (Fig. 3(c)). There was also a significant treatment effect (P=0·01), wherein GIP Δmax was lower after participants consumed HIGH-Rasp v. LOW-Rasp, but no effect on time to peak GIP was observed (Table 2).
The cranberry treatment had no effect on postprandial GIP response (Table 2 and Fig. 3(d)).
Ghrelin
The raspberry treatments had no effects on the postprandial acylated ghrelin response (Table 2 and Fig. 3(e)).
Within the cranberry treatment, there was a trend (P=0·07) for a treatment effect, wherein the acylated ghrelin AUC0–180 min trended towards being more negative (i.e. larger decrease) during HIGH-Cran relative to LOW-Cran (P=0·08). There was no effect of cranberry treatment on the maximal decrease in acylated ghrelin from baseline or time to nadir (Table 2 and Fig. 3(f)).
Ex vivo LDL resistance against Cu2+-induced oxidation
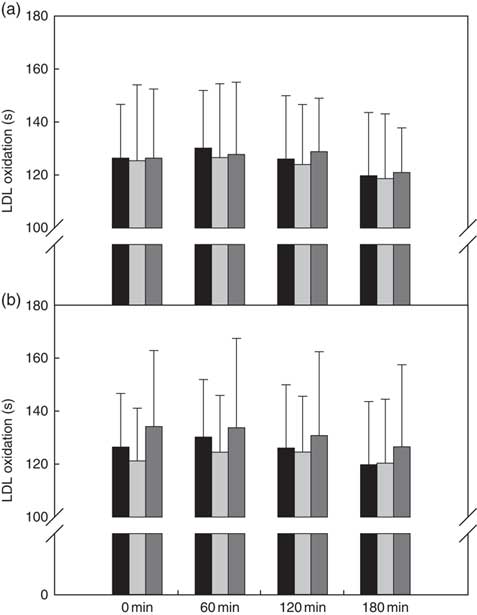
There was no treatment effect when the raspberry bars were compared with one another and/or the reference bar (Fig. 4(a)).
Ex vivo LDL oxidation (lag time, s) of (a) reference v. black raspberry-fortified bars and (b) reference v. cranberry-fortified bars. Values are means, with standard deviations represented by vertical bars. ![]() , Reference (a, b);
, Reference (a, b); ![]() , black raspberry high (a), cranberry high (b);
, black raspberry high (a), cranberry high (b); ![]() , black raspberry low (a), cranberry low (b).
, black raspberry low (a), cranberry low (b).

There were no treatment, time or treatment×time interactions when the cranberry bars were compared with one another and/or the reference bar (Fig. 4(b)).
Flavonoids and phenolic acids
The raspberry treatment had no effects on plasma concentrations of measured flavonoids or phenolic acids (select phenolic acids shown in online Supplementary Figs. S1 and S2).
Within the cranberry treatment, there were significant treatment effects on the plasma concentrations of phenolic acids (i.e. gentisic, vanillic, caffeic, coumaric, ferulic and sinapic acids, P<0·05) but not flavonoids. Most notably, post hoc testing indicated that gentisic acid was significantly higher after HIGH-Cran v. LOW-Cran and/or the reference bar; coumaric, ferulic and sinapic acids were significantly higher after consumption of HIGH-Cran and LOW-Cran compared with the reference bar; and vanillic acid and caffeic acid were significantly higher after LOW-Cran or HIGH-Cran, respectively, v. the reference bar (P<0·02) (online Supplementary Figs. S1 and S2).
Appetite
Within the raspberry treatments, there was a trend for a main effect of treatment on ad libitum energy intake (P=0·10), but post hoc testing did not indicate significant differences between treatments. The raspberry treatments did not impact postprandial hunger or fullness ratings (Table 3).
Appetite and ad libitum energy intake following consumption of fortified and reference cereal barsFootnote * (Mean values and standard deviations)

Δmax, change from baseline to peak fullness or the hunger nadir.
* Data analysed using marginal models with Bonferroni corrections. AUC and Δmax analyses included fasting hunger or fullness as a covariate.
† Contains 10 % freeze-dried black raspberry powder per total weight.
‡ Contains 20 % freeze-dried black raspberry powder per total weight.
§ Contains 0·5 % cranberry extract per total weight.
|| Contains 1 % cranberry extract per total weight.
¶ Trend for main effect of bar within cranberry treatment (P≤0·08).
** P=0·06 v. reference.
†† Trend for main effect of bar within raspberry treatment (P=0·10). No significant post hoc differences.
Within the cranberry treatments, there was a trend for a main effect of treatment on fullness AUC0–180 min (P=0·06), with post hoc comparisons indicating a trend for lower fullness during HIGH-Cran relative to the reference bar (P=0·06). A trend for a main effect of treatment on the peak change in fullness (P=0·08) was also observed, but post hoc testing did not indicate significant differences between treatments. The cranberry treatments did not impact hunger ratings or ad libitum energy intake (Table 3).
Discussion
The main findings of this study were that fortifying a high-carbohydrate cereal bar with a high dose, but not a smaller dose, of freeze-dried raspberries blunted postprandial peak insulin and incretin hormone responses compared with an unfortified bar and tended to increase postprandial glucose AUC but not peak concentrations. Together, these findings suggest that fortifying a high-carbohydrate bar with a high dose, but not a smaller dose, of freeze-dried black raspberry powder attenuated postprandial insulinaemia and slowed glucose absorption. These results are supported by reduced GIP concentrations following consumption of the high-dose raspberry bar, as GIP is a sensitive marker of intestinal glucose uptake, and no differences in plasma glucose concentrations were observed in the 60 min postprandial period (when the predominant influence on blood glucose is absorption rate). These effects did not result in differences in appetite or ex vivo LDL resistance against oxidation, and fortification with a polyphenol-rich cranberry extract did not elicit similar effects.
Our findings demonstrate that the high-dose raspberry bar favourably modulated postprandial glucose and glucoregulatory hormone responses. The 43 % higher postprandial glucose AUC, but no difference in peak glucose concentrations, following consumption of the high-dose compared with the low-dose raspberry bar suggests delayed glucose absorption or uptake into peripheral tissues. The former response could reduce the postprandial insulin demand( Reference Hanhineva, Torronen and Bondia-Pons 7 , Reference Kim, Jeong and Kwon 31 ), while the latter could be driven by lower postprandial insulin concentrations. Although diminished postprandial insulinaemia was not observed when comparing the high-dose with low-dose raspberry bar, the high-dose bar did show a modest blunting of postprandial insulin, C-peptide and glucoregulatory hormone responses when compared with the reference bar which is consistent with other studies( Reference Torronen, Sarkkinen and Niskanen 14 , Reference Williamson 15 ). The insulinaemic response to the high-dose black raspberry bar, compared with the reference, is consistent with the observation that C-peptide was lower in the 60 min following consumption of the high-dose black raspberry bar compared with the reference. C-peptide is not used by the liver and other organs, thus it is a more sensitive biomarker for endogenous insulin secretion compared with insulin itself due to unknown variability in tissue clearance of insulin( Reference Saisho 32 ) . In vitro studies demonstrating that polyphenols extracted from a variety of flavanol-rich foods inhibit digestive enzymes – specifically α-amylase, α-glycosidase and glucoamylase – during the breakdown of dietary carbohydrates into glucose( Reference Barrett, Ndou and Hughey 17 ) provide a plausible mechanism. For example, recent in vitro studies demonstrate the inhibitory effects of different plants/extracts (e.g. grapeseed extract and African pear fruit) on α-amylase and α-glycosidase( Reference Nyambe-Silavwe and Williamson 11 , Reference Miao, Jiang and Jiang 33 – Reference Tong, Wang and Waisundara 36 ). In addition, the raspberry powder used in the present study has exhibited similar effects in vitro, and these actions would be expected to inhibit starch digestion and slow glucose absorption( Reference Hanhineva, Torronen and Bondia-Pons 7 , Reference Torronen, Kolehmainen and Sarkkinen 13 , Reference Torronen, Sarkkinen and Niskanen 14 , Reference Barrett, Fortier and Apostolidis 19 ). Alternately, the blunted GIP and GLP-1 responses following the high-dose fortification could underpin the lower postprandial C-peptide and insulin concentrations which could slow glucose uptake into peripheral tissues. Regardless of the mechanism, previous studies suggest that one possible advantage of slowed glucose absorption and/or uptake is improved physical and cognitive performance, especially during exercise( Reference Kirwan, Cyr-Campbell and Campbell 1 – Reference Nilsson, Radeborg and Bjorck 5 ).
We acknowledge the inconsistency of not finding evidence for delayed glucose absorption when comparing the high-dose raspberry and reference bar despite the blunted insulin and glucoregulatory hormone responses. However, consistent with our results, three prior studies reported that the initial insulin response to a glucose beverage or starch-based food (i.e. bread) was attenuated by berries with little or no appreciable effect on glycaemic response( Reference Torronen, Kolehmainen and Sarkkinen 37 – Reference Xu, Jönsson and Plaza 40 ). These findings suggest an alternative mechanism whereby postprandial glucose metabolism may require less insulin when polyphenol-rich foods are consumed with high-carbohydrate foods, compared with high-carbohydrate foods alone( Reference Torronen, Kolehmainen and Sarkkinen 37 , Reference Coe and Ryan 39 – Reference Juntunen, Laaksonen and Autio 42 ). Although the underpinning mechanisms have not been clearly defined, polyphenols may possibly act acutely to improve insulin sensitivity in peripheral tissue( Reference Hanhineva, Torronen and Bondia-Pons 7 , Reference Kim, Jeong and Kwon 31 , Reference Coe and Ryan 39 , Reference Xu, Jönsson and Plaza 40 ). We also acknowledge the inconsistency in the observation that the overall glucose response (AUC0–180 min) was higher following consumption of HIGH-Rasp v. LOW-Rasp, in the absence of a higher overall insulin response. This suggests a lack of compensatory insulin secretion, possibly secondary to a lower overall GIP response, given that GIP is an incretin hormone. Indeed, inhibition of GIP has been observed in response to anthocyanin-rich blackcurrants( Reference Castro-Acosta, Smith and Miller 8 ). As suggested by others, this effect may be attributable to delayed glucose uptake in response to polyphenols as GIP is secreted from the proximal region of the small intestine, whereas glucose absorption may be occurring more distally because of the polyphenols( Reference Castro-Acosta, Smith and Miller 8 , Reference Johnston, Clifford and Morgan 10 ).
The observed effects of fortifying high-carbohydrate foods with polyphenol-rich foods on postprandial glycaemia were similar in magnitude (with regard to AUC) to a recent study that supplemented starch (i.e. white bread) with a mixture of polyphenol and fibre-rich foods (e.g. green tea powder, apple peel, blackberry, blackcurrant, and strawberry freeze-dried powders)( Reference Nyambe-Silavwe and Williamson 11 ) but less pronounced than those reported in other studies( Reference Torronen, Kolehmainen and Sarkkinen 13 , Reference Torronen, Sarkkinen and Niskanen 14 , Reference Torronen, Sarkkinen and Tapola 30 ). While the estimated amounts of total polyphenols were similar between this study and those of Torronen et al., it is possible that the type of polyphenols provided, as well as the fibre content and viscosity of the test meals, may be partially responsible for this discrepancy. For example, prior trials demonstrating a substantially altered glycaemic response used whole berries or berry purees consisting mainly of anthocyanins and proanthoyanidins( Reference Torronen, Kolehmainen and Sarkkinen 13 , Reference Torronen, Sarkkinen and Niskanen 14 , Reference Torronen, Sarkkinen and Tapola 30 ), whereas the present study used freeze-dried raspberry powder which contained mostly anthocyanins, ellagitannins, ellagic acid and quercitin. Further, the polyphenol-rich foods used in those studies contained more soluble fibre and were more viscous than their control foods. Authors of those studies asserted that the modified glucose response they observed was not solely attributed to differences in the soluble fibre content of the berry meals (up to 1·5 g); however, it may partially explain their results since soluble fibre increases viscosity and mitigates postprandial glycaemic response to high-carbohydrate foods( Reference Wood 43 ). In contrast, the polyphenol-rich and reference bars used in the present study contained no soluble fibre and did not differ in viscosity. Indeed similar to the present study, Castro-Acosta( Reference Castro-Acosta, Smith and Miller 8 , Reference Castro-Acosta, Stone and Mok 9 ) removed fibre as a potential confounding variable (i.e. by testing apple and blackcurrant extracts) and observed that the fruit extract modulated the glycaemic response to fruit juice and white bread with apricot jam. Differential findings between the aforementioned and present study may be attributable to the type of fruits, and their polyphenolic constituents, that were tested.
Contrary to our hypothesis, polyphenol fortification did not suppress appetite and did not dose dependently potentiate postprandial increases in GLP-1 or postprandial decreases in acylated ghrelin, both appetite-mediating hormones. Although relatively few studies have evaluated the acute effects of polyphenol-rich foods on appetite and associated hormones( Reference Pinent, Blay and Serrano 44 ), several have reported that consuming polyphenol-rich foods may alter appetite-mediating hormones in a direction that would be expected to suppress appetite. For example, in separate studies, adding a polyphenol-rich berry puree to sugar water potentiated postprandial increases in the appetite-suppressing hormone GLP-1( Reference Torronen, Sarkkinen and Niskanen 14 ), while adding polyphenol-rich soluble carob fibre to a liquid meal potentiated the postprandial suppression of the appetite-stimulating hormone acylated ghrelin( Reference Gruendel, Garcia and Otto 45 ). In vitro and animal studies suggest that certain polyphenols may directly modulate GLP-1 and ghrelin secretion and interact with hormones known to influence their biological activity( Reference Pinent, Blay and Serrano 44 ). However, the effects of polyphenols on GLP-1 and acylated ghrelin appear to vary by polyphenol type( Reference Serrano, Casanova-Marti and Depoortere 46 , Reference Serrano, Casanova-Marti and Gil-Cardoso 47 ) and the food matrix in which polyphenols are consumed( Reference Gruendel, Garcia and Otto 45 , Reference Gruendel, Garcia and Otto 48 , Reference Gruendel, Otto and Garcia 49 ). Importantly, studies demonstrating effects of polyphenol-rich foods on GLP-1 and/or ghrelin in a direction that would be expected to suppress appetite could not separate effects of polyphenols from the fibre and viscosity of the test meals( Reference Torronen, Sarkkinen and Niskanen 14 , Reference Gruendel, Garcia and Otto 45 ), which are both factors also thought to influence appetite-mediating hormone responses( Reference Wanders, van den Borne and de Graaf 50 ). In addition, a recent study found no acute effect of consuming 0·5–1·5 g of polyphenol-rich grape seed extract on appetite( Reference Shin, Kindleysides and Yip 51 ), despite the extract having been shown to inhibit α-amylase and α-glucosidase in vitro ( Reference Yilmazer-Musa, Griffith and Michels 52 ), similar to the polyphenols used in the present study. Collectively, these findings do not support an appetite suppressing effect of berry polyphenols within the doses studied when fibre intake and viscosity are matched across fortified and non-fortified food products. Nonetheless, an impact of polyphenols on appetite is biologically plausible, given the evidence for roles of various polyphenols in modulating glucose metabolism and the concentrations of appetite-regulating neuropeptides and enteroendocrine hormones( Reference Hanhineva, Torronen and Bondia-Pons 7 , Reference Pinent, Blay and Serrano 44 , Reference Serrano, Casanova-Marti and Depoortere 46 , Reference Panickar 53 ). As such, these results may not pertain to other polyphenol forms or sources administered in different doses or other food matrices.
Findings from the present study indicate that neither of the fruit ingredients, in the doses provided, enhanced the ex vivo resistance of LDL lipids to oxidation following consumption of a high-carbohydrate snack bar. This is not surprising, given there was little effect of the reference bar on LDL oxidation. Postprandial oxidative stress, as a sub-form of nutritional oxidative stress, ensues from sustained postprandial hyperlipidaemia and/or hyperglycaemia and is associated with a higher risk of cardiometabolic diseases( Reference Sies, Stahl and Sevanian 54 ). Even though absorbed polyphenols, including flavonoids and phenolic acids, may confer anti-oxidative protection to LDL against oxidation during the postprandial state, we speculated that the protection of LDL against oxidation might be mainly attributed to diminished postprandial glucose response derived from lower glucose absorption in the gastrointestinal tract. Thus, the interpretation of LDL oxidation data cannot solely focus on polyphenol bioavailability. In addition, this study only measured one biomarker to evaluate the effect of antioxidants within cranberry and black raspberry on oxidative stress, while a complete assessment of oxidative stress status from antioxidant interventions requires application of an array of biomarkers, including antioxidants (e.g. enzymes and small molecular antioxidants) and free radical-derived oxidised products. Altogether, future studies should consider assessing the effect of fortifying a high-fat food item with raspberry or cranberry polyphenols on LDL oxidation, using ex vivo or more robust in vivo methods, or in populations with increased susceptibility to oxidative stress such as the obese and elderly.
The raspberry and cranberry treatments produced differential effects on plasma concentrations of flavonoids and phenolic acids. Specifically, the raspberry treatment had no effect on circulating flavonoids or phenolic acid concentrations, whereas the cranberry treatment increased postprandial concentrations of several phenolic acids. These differences are probably attributable to the type of polyphenolic constituents within the berries and the methods of detection used in the present study. For example, anthocyanins are a main polyphenolic constituent of cranberries and black raspberries which are not quantified using the method described herein. Further, the bioavailability of polyphenols is also dependent on a number of factors that may have limited their detection in plasma, for example, chemical structure of the food matrix, intestinal absorption, interaction with gut microbiota and inter-subject differences in physiological, genetic and biochemical conditions( Reference Cassidy and Minihane 55 ).
Limitations
While the cereal bars were formulated to contain similar sugar and fibre composition, post-production chemical analysis revealed slight differences in fructose, sucrose and insoluble fibre content between the bars. However, these discrepancies are minor and unlikely to explain the differences we observed in glycaemic, insulinaemic and glucoregulatory hormone responses between the bars. Further, while polyphenol types within the bars were not measured, this data is reported in Phenol-Explorer( Reference Neveu, Perez-Jimenez and Vos 56 ) by Wada & Ou, and a detailed characterisation of the cranberry extract was published by Martín et al. In addition, the cyclical reproductive hormones for the two female participants were not considered, and the study was not powered to assess the differences between male and female. Lastly, we did not measure plasma anthocyanins due to cost constraints and instead chose to focus on flavonoids and phenolic acids, since the assay allowed measurement of more polyphenolic compounds. Despite these limitations, this was a comprehensive, highly controlled study examining the glycaemic, insulinaemic, glucoregulatory hormone and ex vivo oxidative stress responses following consumption of polyphenol-fortified, high-carbohydrate cereal bars.
Conclusion
Fortification with a high dose of freeze-dried black raspberries blunted postprandial peak insulin and incretin hormone responses compared with the reference bar and tended to increase postprandial glycaemia compared with the low-dose raspberry bar. Together, these findings suggest that fortifying a high-carbohydrate bar with approximately 25 g raspberry powder, which contained approximately 1·2 g of total polyphenols, modulated postprandial glycaemia and insulinaemia in a dose-dependent manner, thus maintaining glucose availability in the postprandial period. Further research is warranted to determine whether this response has practical benefits in certain scenarios, for example, when the food item is consumed before endurance exercise or to maximise cognitive performance during the later postprandial period. However, these glycaemic effects did not translate into meaningful changes in appetite or ex vivo oxidation of LDL within the immediate postprandial period at the dose consumed and/or with the method used to assess appetite.
Acknowledgements
The authors would like to thank the study participants and technical support personnel within USARIEM’s Military Nutrition Division, with whom this study would not have been possible.
The present study was funded by U.S. Army Medical Research and Materiel Command and Natick Soldier Research, Development and Engineering Center. This research was supported in part by an appointment to the Postgraduate Research Participation Program at the USARIEM administered by the Oak Ridge Institute for Science and Education through an interagency agreement between the United States Department of Energy and USARIEM.
The authors’ contributions are as follows: T. J. S. designed the study, collected data, conducted analyses and drafted the manuscript; J. P. K. contributed to study design, collected data, conducted analyses, drafted portions of the manuscript related to satiety and revised the article for important intellectual content. M. A. W. and C. C. W. collected data and assisted in data analyses; C. C. W. also assisted in drafting the manuscript. A. B. and N. F. F. conceived of the study, assisted in study design and revised the article for important intellectual content; C.-Y. O. C. assessed LDL oxidation and plasma polyphenolic concentrations and revised the article for important intellectual content; S. J. M. contributed to study design and revised the article for important intellectual content. All authors reviewed, edited and approved the final manuscript.
The opinions or assertions contained herein are the private views of the authors and are not to be construed as official or reflecting the views of the US Army or the Department of Defense. Any citations of commercial organisations and trade names in this report do not constitute an official Department of the Army endorsement of approval of the products or services of these organisations. Study funded by the US Army Medical Research and Materiel Command.
The authors have no financial or personal conflicts of interest to declare.
Supplementary material
For supplementary material/s referred to in this article, please visit https://doi.org/10.1017/S0007114519000394