


Introduction
Anatolia has been a centre of research into agricultural origins and development for more than a century, yet most of these studies focus on the earliest periods of agricultural development: from the Neolithic (c. 9700–5400 BC) through the origins of urban centres and territorial states during the Bronze Age (c. 3000–1200 BC) (Marston & Castellano Reference Marston, Castellano, Steadman and McMahon2021). Much less attention is directed towards the development of agricultural economies under later states and empires, especially the Roman, Byzantine and early Islamic polities of the first and second millennia AD, obscuring the substantial changes in agricultural practices during these periods that are indicated in historical documents (e.g. Watson Reference Watson1983; Blouin Reference Blouin2014; Hollander Reference Hollander2018). While recent archaeobotanical synthesis across Anatolia (Marston & Castellano Reference Marston, Castellano, Steadman and McMahon2021) offers a regional view of agricultural change, it is only a partial perspective, focused on crop production. To address agricultural and landscape change, it is necessary to relate archaeobotanical records with faunal evidence, to identify animal husbandry strategies, and with vegetation history, to identify patterns of land clearance or abandonment. Together, these datasets address enduring questions that originate in the archaeological, historical and palaeoenvironmental literature of this period. In this study, we bring together archaeobotanical, palynological and zooarchaeological evidence for the first time to address three key agricultural lacunae in understanding the climate and political economy of this period.
The first surrounds the extent to which climatic change, most notably the Roman Warm Period (RWP; c. 200 BC–AD 200), Late Antique Little Ice Age (LALIA; c. AD 500–800) and Medieval Climate Anomaly (MCA; c. AD 900–1350), affected agricultural production across Anatolia, with the understanding that Anatolia is climatically and phytogeographically diverse and that both climate and ecological responses to climate vary on a regional basis (Büntgen et al. Reference Büntgen2016; Izdebski et al. Reference Izdebski, Pickett, Roberts and Waliszewski2016; Haldon Reference Haldon, Izdebski and Mulryan2018; Roberts Reference Roberts, Izdebski and Mulryan2018). The second relates to the effect of Arab incursions into Byzantine Anatolia beginning in the seventh century AD, which led to the depopulation of areas of eastern and central Anatolia (Izdebski Reference Izdebski2013; Roberts Reference Roberts, Izdebski and Mulryan2018). Whether this depopulation represents a change only in settlement patterns or also a shift in agricultural practices on a regional scale remains unresolved. The final lacuna concerns how Roman and Byzantine agricultural economies differed from those of succeeding Islamic states, and how changes in political economy and state finance strategies affected the practices of farmers at the level of individual communities (Marston Reference Marston2012; Izdebski Reference Izdebski and Lavan2015).
Anatolia in the first and early second millennia AD
This study focuses on the more than 1500-year period between the establishment of Roman administration across Anatolia, c. 50 BC, through the consolidation of the Ottoman Empire following the conquest of Constantinople, c. AD 1450. We divide this period by historical events into the Roman period (first century BC to mid-fourth century AD); Early Byzantine (mid-fourth to mid-ninth centuries AD), when political authority shifted from Rome to Constantinople; Middle Byzantine (mid-ninth to early thirteenth centuries AD), from the end of Iconoclasm to the sack of Constantinople by the fourth Crusade; the Late Byzantine/Turkic (early thirteenth century to 1450 AD), when the Seljuk, Turkic beylik and Ottoman polities controlled the majority of Anatolia; and the consolidation of all of Anatolia under Ottoman rule (post-1450 AD). This chronology attempts, as far as possible, to match the site-specific strata and pottery-based chronologies used to date the assemblages studied, but is necessarily imprecise, given the distinct phasing of each site considered. We refer to more specific site-based chronologies when better temporal resolution is needed.
The extent and impetus behind settlement pattern changes during the second half of the first millennium AD remains a conundrum. Settlement surveys document sharp declines in settlement density across Anatolia, from Cappadocia (Allcock & Roberts Reference Allcock and Roberts2014) to south-western (Haldon et al. Reference Haldon2014) and northern Anatolia (Izdebski Reference Izdebski2012). Pollen sequences also record a cessation of arboriculture and a decline in cereal agriculture around the same time (Roberts Reference Roberts, Izdebski and Mulryan2018). Although both climatic cooling and the Justinianic Plague are likely to have reduced rural populations beginning in the mid-sixth century (Newfield et al. Reference Newfield, Brandes, Reimitz and Tannous2024), both have been rejected as a sufficient explanation for this large-scale shift (Haldon Reference Haldon, Izdebski and Mulryan2018; Roberts Reference Roberts, Izdebski and Mulryan2018), even at a regional scale (Jacobson et al. Reference Jacobson, Pickett, Gascoigne, Fleitmann and Elton2022). Instead, the decline in personal security resulting from Arab raids into Anatolia in the seventh century, and consequent economic reorganisation and intensification of Byzantine agriculture elsewhere, appears to have been the primary driver of regional-scale rural population decline (Izdebski Reference Izdebski2013).
The shift in rural lifeways that accompanied these changes was substantial. From the Middle Byzantine period, distinct trajectories of agricultural intensification and decline are evident at a sub-regional scale (Eastwood et al. Reference Eastwood, Gümüşçü, Yiğitbaşıoğlu, Haldon, England, Vorderstrasse, Roodenberg, Vorderstrasse and Roodenberg2009; Allcock Reference Allcock2017; Castellano Reference Castellano2021). The end of the seventh century also saw a major Byzantine tax reform that emphasised grain and livestock production alongside the reorganisation of military garrisons to place them closer to regional resource bases and enable more direct regional provisioning of those units under their own management (Haldon Reference Haldon, Izdebski and Mulryan2018: 203).
Such diversity of agricultural practices was enabled, and in some cases perhaps required, by the diversity of landscapes across Anatolia, with its complex topography and resultant variation in rainfall, temperature, hydrology and pedology. This level of geographic variation dictated the possible locations of certain agricultural practices, with frost-sensitive crops, such as olive, generally restricted to the Mediterranean climatic zones of Anatolia except during particular climatic periods (England et al. Reference England, Elton, Hadland, Şenkul, Free, Eastwood, Roosevelt and Haldon2021). The viability of extensive viticulture on the Anatolian plateau has also been in question, though recently published archaeobotanical remains from Kınık Höyük demonstrate large-scale grape cultivation since at least the Achaemenid period (c. 540–330 BC) (Castellano Reference Castellano2023). Climate change affected agricultural potential over time, expanding or contracting the geographic range of crops and cultivation strategies alike (Finné et al. Reference Finné, Holmgren, Sundqvist, Weiberg and Lindblom2011). For an overview of the climatic history of Late Holocene Anatolia, we refer the reader to published reviews (e.g. Labuhn et al. Reference Labuhn, Finné, Izdebski, Roberts, Woodbridge, Izdebski and Mulryan2018; Finné et al. Reference Finné, Woodbridge, Labuhn and Roberts2019; Luterbacher et al. Reference Luterbacher, Xoplaki, Izdebski, Fleitmann, Izdebski and Preiser-Kapeller2024) and to a summary provided in the online supplementary material (OSM).
Methods and datasets
Our analysis is built on three synthetic datasets of archaeobotanical macroremains, zooarchaeological evidence and pollen from sediment cores (Figure 1). The archaeobotanical data were assembled through a systematic review of publicly available, original, quantitative or semi-quantitative archaeological publications from the Roman through Ottoman periods, including previous syntheses by Marston and Castellano (Reference Marston, Castellano, Steadman and McMahon2021, Reference Marston and Castellano2023). Zooarchaeological records are based on a systematic review of published literature, with data drawn from original publications. Pollen records were retrieved from the European Pollen Database (EPD) for maximum comparability and accuracy, although some pollen records not in this database contribute to this discussion (e.g. those discussed by Roberts Reference Roberts, Izdebski and Mulryan2018; Woodbridge et al. Reference Woodbridge2019; see also Table S2) and are mentioned in the text where relevant.
Roman to Ottoman period sites producing data used in this study. Further information on each site is provided in the OSM. Letters denote locations of pollen cores described in Figure 4 (figure by authors).

We standardise botanical names for crops following Zohary and colleagues (Reference Zohary, Hopf and Weiss2012), with cereals following the Flora of Turkey (Davis Reference Davis1985). We reduced the level of taxonomic identification to crop types rather than varietals or to the genus or (sub-)family level for uncertain identifications. We excluded all non-economic taxa, tuber and parenchyma fragments, and other non-carpological remains save crop chaff and nutshell. Raw counts were recorded for each period from each site. We performed both simple numerical analyses and multivariate analysis following standard practices (see OSM).
Zooarchaeological data are reduced to common taxonomic categories following the same principles above. We include only definitely identified remains of domesticated animals, excluding broader categories (e.g. ‘large mammal’). We calculated relative percentages among domesticated animals based on bone counts (number of identified specimens, NISP) as reported in the original publications.
Palynological data available in the EPD includes 36 cores from Anatolia; of these, only ten have sufficient resolution of sampling and absolute dates associated with the years AD 1–2000. Samples were grouped into 200-year bins and reported as relative percentages calculated against the terrestrial pollen sum. Full detail on the datasets included and analytical methods are provided in the OSM.
Results
Annual field crops
Several trends are seen across space and time in the cereal and pulse macroremains data (Figures 2 & 3). In the Roman and Early Byzantine periods free-threshing wheat and barley are the primary cereals cultivated, in proportions of roughly 1:1 to 2:1, but in the Middle Byzantine free-threshing wheat becomes much more dominant. This trend continues into the Late Byzantine period in the Marmara region, while most sites in central, eastern and south-eastern Anatolia are now dominated by barley. Only single sites feature other cereals as primary cultivars; millets are the most common secondary crop, with rye also evident in the archaeobotanical record at a handful of sites and in low percentages in pollen records from the Early Byzantine onwards (Figures 2 & 4). Pulses, in contrast, are much less numerous than cereals at nearly every site, and entirely absent from shipwreck contexts. Lentil and bitter vetch are the most common pulses found, with pea and grass pea also relatively widespread, particularly post-1450. Fava bean and chickpea are less common but when found often appear in large concentrations.
Relative abundance of cereals calculated using the total of cereal caryopses as sum; identifications at the genus level or higher are excluded. Chaff is presented semi-quantitatively; n.s. = not stated. Only sites with at least 50 cereal caryopses are included (figure by authors).

Relative abundance of pulses calculated out of the total of all economic seed and fruit remains identified to the species level; n.s. = not stated. Only sites with at least 50 crop seeds are included (figure by authors).

Summary pollen diagrams for 10 cores covering the past 2000 years (see Figure 1 for locations); horizontal axis is percentage of total pollen sum; CJOV = sum of Castanea, Juglans, Olea and Vitis (chestnut, walnut, olive and grape); Arboreal Pollen* = total of the arboreal pollen excluding CJOV. Chronology in calibrated years before 1950 (BP) (figure by authors).

Perennials and arboriculture
Macroremains of fruit and nuts are common and numerous at all shipwreck sites and many terrestrial sites dating from the Roman through Middle Byzantine periods (Figure 5). Grape and fig, and to a lesser extent olive, are the most numerous and widespread fruit remains. All other taxa are present only in small numbers and typically as part of taxonomically diverse assemblages. Late period sites have fewer fruit remains than earlier periods, with grape the most common. Central and eastern Anatolian sites have fewer fruit remains than other regions, with only grape and fig usually present, while olive is found exclusively in Mediterranean climate regions, save one site in south-eastern Anatolia. Palynological data (Figure 6) support this distribution of olive, with Roman cultivation of olive extending into the transitional Mediterranean zone around Sagalassos (Bereket in Figure 6; Vermoere et al. Reference Vermoere, Vanhecke, Waelkens and Smets2003; Kaniewski et al. Reference Kaniewski, Paulissen, Laet, Dossche and Waelkens2007). The potential cultivation of olive in Cappadocia is discussed by England and colleagues (Reference England, Eastwood, Roberts, Turner and Haldon2008: 1241–42). Note that grape is under-represented in the palynological record, so not directly comparable with olive, and fig does not disperse pollen, so is absent from Figures 4 and 6.
Relative abundance of fruit and nut taxa calculated using the total of all economic seed and fruit remains identified to the species level as sum (only sites with at least 50 total crop seeds are included; n.s. = not stated) (figure by authors).

Palynological data for cultivated, or potentially cultivated, perennial fruit and nut taxa. Chronology is provided as calibrated years before 1950 (BP) (figure by authors).

Multivariate analysis of botanical remains
We conducted multivariate analysis of the archaeobotanical dataset of economic taxa using principal component analysis (PCA) (Figure 7). The first axis (PC1) of the PCA can be read as distinguishing fruit-rich samples (positive values) from grain-rich samples (negative values). PC2 distinguishes samples rich in free-threshing wheat (positive values) from those with more barley (negative values); it also separates circum-Mediterranean regions (positive values) from central, northern, eastern and south-eastern sites (zero and negative values). Chronological patterning is less distinct, but assemblages with high positive or negative PC2 values (all with negative PC1 values), dominated by free-threshing wheat or barley, respectively, date to the Middle Byzantine period or later.
Principal component analysis of archaeobotanical assemblages (figure by authors).

Animal husbandry
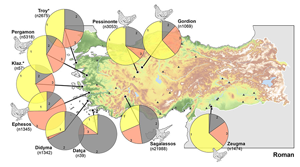
Domesticated faunal assemblages are dominated, as expected, by four taxa: sheep, goats, cattle and pigs (Figure 8). Domestic fowl and equids form important parts of the animal economy at some sites but are absent or nearly so at others. The highest frequency of cattle and pigs occurs during the Roman and Early Byzantine periods; caprines become more uniformly the most common taxon during the Middle and Late Byzantine periods, and into the Ottoman. In these three later periods, pigs become notably less common, with Mardin entirely devoid of pig remains and only minimal remains at Kınık Höyük, Aşvan Kale and Korucutepe, all found in central Anatolia and further east (Figures 8 & 9). During these periods, a high proportion of pigs (>20%) is found only at Gritille and Kinet Höyük (Figures 8 & 9). Equids are more common at sites in central, eastern and south-eastern Anatolia than along the Mediterranean or Aegean coasts, where higher proportions of cattle and pigs are present.
Relative abundance of main domesticated animal taxa (caprine, cattle, pig). Other taxa are indicated with symbol size relative to their frequency among all domesticated animal bones by number of identified specimens (NISP); * = datasets with only partially published data (main domesticates); n/a = data not provided in publication (figure by authors).

Maps of Anatolia, by period, depicting relative proportions of caprines, cattle and pigs at each site. Domesticated fowl, where recorded, are indicated with size relative to their frequency among all domesticated animal bones by number of identified specimens (NISP). Datasets not attributable to a single chronological period are excluded from the figure; * = datasets with only partially published data (main domesticates) (figure by authors).

Multivariate analysis of faunal remains
A PCA of faunal remains shows a clear dimensionality in the full dataset, with sheep/goat (positive) versus cattle (negative) along the primary axis, and pig (positive) versus equid (negative) providing the secondary axis of variation (Figure 10). Domestic fowl are intermediate to pig and sheep/goat and anticorrelated with cattle. A clear chronological trend is evident in the data, with the Roman and Early Byzantine periods located in the cattle/pig region of the diagram and most of the Middle and Late Byzantine period sited in the sheep/goat and equid region of the diagram, with the site of Gritille a clear exception.
Principal component analysis of faunal assemblages; those with only partially published data (i.e. only sheep/goat, cattle, pig) are removed from the dataset (figure by authors).

Diachronic trends and the impact of climate
Many regional trends in plant cultivation and animal husbandry can be explained by climate, including the absence of olive from areas subject to frost and the higher proportion of caprines in drier regions (Figures 6 & 9). Diachronic trends in plant and animal husbandry within regions are more interesting, as they are independent of differences between Anatolian ecoregions. These trends could be related to diachronic climate change, as has been argued for high-elevation olive cultivation during the Roman and Early Byzantine period (Vermoere et al. Reference Vermoere, Vanhecke, Waelkens and Smets2003; Kaniewski et al. Reference Kaniewski, Paulissen, Laet, Dossche and Waelkens2007; England et al. Reference England, Elton, Hadland, Şenkul, Free, Eastwood, Roosevelt and Haldon2021), corresponding to the RWP (Finné et al. Reference Finné, Holmgren, Sundqvist, Weiberg and Lindblom2011; Roberts et al. Reference Roberts2018). This climatic amelioration likely extended the altitudinal limit of viable olive cultivation during the earlier first millennium AD (Vermoere et al. Reference Vermoere, Vanhecke, Waelkens and Smets2003; Kaniewski et al. Reference Kaniewski, Paulissen, Laet, Dossche and Waelkens2007; Roberts Reference Roberts, Izdebski and Mulryan2018), as shown in the Bereket and probably also the Nar data (Figure 6). The subsequent LALIA, the onset of which is dated at Nar to c. AD 460, may have played a role in declining oleiculture in both regions of Anatolia. The RWP may have enabled the agricultural expansion and intensification that supported economic stability during the period of Roman imperial expansion (Bernard et al. Reference Bernard2023); while generally higher levels of free-threshing wheat (Figure 2) and olive (Figure 6) cultivation during the RWP are consistent with this hypothesis, it is not possible to discern the cause of this agricultural expansion from these data.
The most notable diachronic change visible in these data occurs following the Middle Byzantine period when arboriculture is dramatically reduced in both the archaeobotanical and palynological records (Figures 5 & 6). A simultaneous change in cereal cultivation resulted in an increase in barley versus free-threshing wheat farming in every region except the Marmara (Figure 2). The Late Byzantine reduction in arboriculture and wheat cultivation occurred during a period of increasingly humid conditions spanning the tenth–fourteenth centuries that constitutes the MCA (Bradley et al. Reference Bradley, Wanner and Diaz2016; Xoplaki et al. Reference Xoplaki2016), as documented in the stable isotope records from Nar Gölü and Sofular Cave (Figure S2). As climate change is not aligned with agricultural change during this transition, we agree with earlier assessments (Izdebski et al. Reference Izdebski, Pickett, Roberts and Waliszewski2016; Xoplaki et al. Reference Xoplaki2016; Haldon Reference Haldon, Izdebski and Mulryan2018; Roberts Reference Roberts, Izdebski and Mulryan2018; Roberts et al. Reference Roberts2018) that political and economic forces, as well as anthropogenic landscape change, are much more likely the causal variables in the diachronic patterns of change illustrated here. The Late Byzantine period saw distinct political and economic regimes operated in the Marmara region, where the Byzantine Empire held territory until 1453, versus the rest of Anatolia, which was controlled by successive Islamic states over this period. This political disjuncture provides the context for a possible explanation of this observed difference in cereal agriculture between sites in the Marmara and the remainder of Anatolia in the Late Byzantine period, perhaps also visible in the pollen evidence for arboriculture from Sepanca Gölü, İznik and Abant (Figure 6).
Agricultural economies of Roman, Byzantine and Islamic polities
Patterns in the botanical and faunal data suggest that a distinct set of economic processes and agronomic strategies distinguish the Roman and Early Byzantine periods, which show considerable continuity between them, from the Middle Byzantine period. The Late Byzantine period also seems distinct from the trends noted in the Early to Middle Byzantine transition, especially in plant cultivation. What was the cause of these shifts?
An extended debate in the literature has engaged this question, with the two competing hypothesised causal factors being climate and conflict (e.g. Izdebski et al. Reference Izdebski, Pickett, Roberts and Waliszewski2016; Haldon Reference Haldon, Izdebski and Mulryan2018; Roberts Reference Roberts, Izdebski and Mulryan2018). It does appear that the RWP supported an expansion of olive cultivation, and possibly arboriculture in general, during the Roman period, a spatial expansion and possible intensification of arboriculture already in progress on a regional scale termed the Beyşehir Occupation Phase (BOP) (Eastwood et al. Reference Eastwood, Roberts and Lamb1998; Roberts Reference Roberts, Izdebski and Mulryan2018). The RWP was relatively dry in central Anatolia, while the subsequent Early Byzantine period saw wetter conditions regionally that were associated with an expansion of rural settlement and agricultural activity, despite probable colder episodes in the sixth and seventh centuries during the LALIA (Büntgen et al. Reference Büntgen2016; Roberts Reference Roberts, Izdebski and Mulryan2018; Dönmez et al. Reference Dönmez2021) (Figure S2). Notably, more water-intensive cropping systems were introduced during this period, especially in the Konya plain, indicating an agricultural response to increased water availability (Izdebski et al. Reference Izdebski, Pickett, Roberts and Waliszewski2016: 203).
The end of the BOP, however, was not caused by a singular climatic event, but occurred at different times in different areas; in most areas of Anatolia the end corresponds with climatic stability, rather than change (Izdebski Reference Izdebski and Lavan2015; Izdebski et al. Reference Izdebski, Pickett, Roberts and Waliszewski2016; Roberts Reference Roberts, Izdebski and Mulryan2018; Woodbridge et al. Reference Woodbridge2019; see also Figure 6). A better correlation with the end of the BOP is the beginning of Arab raids into Anatolia in the late seventh century AD and subsequent reorganisations to both settlement location and agricultural policies in the Byzantine state (Haldon Reference Haldon2016, Reference Haldon, Izdebski and Mulryan2018; Izdebski et al. Reference Izdebski, Pickett, Roberts and Waliszewski2016; Roberts Reference Roberts, Izdebski and Mulryan2018). Most scholars (summarised by Roberts Reference Roberts, Izdebski and Mulryan2018) thus now cite economic instability and declining personal security for the end of the BOP, both of which greatly increased the risk associated with investing in delayed-return tree-fruit resources, favouring annual crops or animal herding instead. Yet these conclusions have been based solely on pollen records, without the use of archaeobotanical evidence, which represent different spatial scales and levels of taxonomic distinction in vegetation change, or even zooarchaeological data.
Archaeobotanical data demonstrate a continued importance of arboriculture and viticulture through the Middle Byzantine period in the areas that continued under Byzantine control: the Mediterranean and Aegean coasts, the Marmara region and northern Anatolia. With the exceptions of Amorium (where the mineralisation of seeds presents a distinct taphonomy from other sites; Giorgi Reference Giorgi, Lightfoot and Ivison2012), continued viticulture at Aşvan Kale and the presence of figs at Mediterranean Kinet Höyük and Mersin-Yümüktepe, archaeobotanical data do not show evidence for the continued importance of arboriculture in the eastern half of Anatolia, which would have been contested or under Arab control from the Middle Byzantine period onwards. That the archaeobotanical record correlates well with the pollen data (Figure 6, save the continuity in walnut pollen at Van) in showing this decline is a crucial finding, given the natural under-representation of grape and the absence of fig in pollen records; olive cultivation at higher elevations declined earlier, likely due to colder temperatures of the LALIA following the RWP.
We expected that sites in contested areas would emphasise cereal production instead of arboriculture as a lower-risk crop. This does seem to have been the case: our multivariate analysis (Figure 7) places Middle and Late Byzantine assemblages in the area of the PCA plot dominated by cereals. Amorium, as discussed above, and Kinet Höyük, which is dominated by cotton, do provide exceptions, although both do include significant quantities of cereals as well. Roman and Early Byzantine assemblages, in contrast, are all located on the opposite side of the plot, associated with grape and fig, with the exception of two sites in central and south-eastern Anatolia (Gordion and Ziyaret Tepe) that both lie in semi-arid regions where arboriculture would have been challenging and cereals are dominant in every chronological period (Rosenzweig Reference Rosenzweig2014; Marston Reference Marston2017).
Given the importance of free-threshing wheat as military rations in both the Roman (Bennett Reference Bennett2013; Marston & Miller Reference Marston and Miller2014) and Byzantine Empires (Haldon Reference Haldon, Izdebski and Mulryan2018), it is not surprising that free-threshing wheat is the dominant cereal at Roman and Early Byzantine sites (Figure 3). Its continued dominance in the Middle Byzantine period occurs at sites that remained under Byzantine control, including Aşvan Kale (AD 900–1100; Nesbitt et al. Reference Nesbitt, Bates, Hillman and Mitchell2017), Mersin-Yümüktepe (eleventh–thirteenth centuries AD; Fiorentino et al. Reference Fiorentino, Primavera, Caracuta and Milano2014) and Komana (eleventh–thirteenth centuries AD; Pişkin & Tatbul Reference Pişkin, Tatbul, Erciyas and Tatbul2015). Gritille, which fell under Arab control during this period, is the outlier but most seeds from this site come from crop stores associated with a Crusader garrison (Miller Reference Miller and Redford1998). Looking at the period of Crusader control at Gritille (c. AD 1100–1150), wheat is more numerous than barley, while the reverse is true under Muslim rule. Similarly, pigs were the primary meat source at Crusader Gritille, and at Kinet Höyük during the Late Byzantine, when it was likely also a Crusader settlement (Redford et al. Reference Redford, Ikram, Parr and Beach2001), in marked contrast to contemporaneous Muslim-ruled sites across eastern Anatolia. In the Late Byzantine period, sites in the Marmara region continued to produce free-threshing wheat, while barley was more common in other regions. The emphasis on barley under Arab or Turkic control may reflect a renewed importance of pastoralism, with the barley used for winter fodder, or a return to risk-minimising cultivation methods by favouring a more drought-tolerant crop in drier and colder areas of central and eastern Anatolia.
The zooarchaeological assemblage could lend additional nuance to the interpretation of barley. Unfortunately, zooarchaeological data are not available from any sites in the Aegean or Marmara in the Middle or Late Byzantine periods (Figure 9). Comparing Roman and Early Byzantine sites in central, eastern and south-eastern Anatolia with assemblages in the Middle and Late periods, when those regions fell under Muslim control, shows a marked decline in both cattle and pigs, but especially the latter, and a proportional increase in caprines and horses. Barley may have been used as horse fodder and/or winter fodder for cattle, sheep and goats.
Conclusions
The Early to Middle Byzantine transition represents a division between two agricultural trajectories. Central and eastern Anatolia, the regions most affected by Arab raids and advancing Turkic states during the Middle Byzantine period, show a dramatic decline in arboriculture following the seventh century AD. In contrast, archaeobotanical and palynological evidence indicates continued arboriculture and viticulture through the Middle Byzantine period in western and northern Anatolia, and parts of Mediterranean and eastern Anatolia, areas that remained under Byzantine control. Notably, pollen records from south-western, western and northern Anatolia all indicate agricultural stability from the Roman through the Middle Byzantine period, confirming the pattern shown by carpological remains. Pollen records from central and eastern Anatolia, in contrast, show a sharp decline in agricultural (and especially arboricultural) signatures as early as the late seventh century AD, evidence that has been used together with regional settlement surveys to infer a rural depopulation of these regions (Izdebski Reference Izdebski2013; Roberts Reference Roberts, Izdebski and Mulryan2018).
The Late Byzantine period, when Byzantine control contracted to portions of western Anatolia and the Marmara region, represents another agricultural transition. Archaeobotanical evidence of arboriculture nearly disappears, paralleling pollen evidence. Cereal agriculture also changed dramatically, with only sites in the Marmara region continuing to emphasise wheat cultivation, while barley and millet became more common elsewhere. This implies a change in priorities for cereals, away from human consumption towards animal fodder, presumably within a distinct agricultural economy with different economic incentives for cereal and livestock production. Zooarchaeological evidence refines this picture, with increased proportions of caprines and equids suggesting a more mobile pattern of animal husbandry under Turkic control. The exact political and economic context under which this shift occurred requires further attention in future research, which should also integrate wood charcoal data, providing insights into local-scale changes in arboriculture and landscape clearance (e.g. Castellano Reference Castellano2021; Marston & Vaiglova Reference Marston and Vaiglova2024), amidst additional archaeobotanical publication. This study, however, provides a general framework with which to guide future work in this dynamic period of Anatolian history.
Acknowledgements
We thank the many scholars whose published work forms the basis of the datasets presented here. Palynological data were obtained from the European Pollen Database (EPD) via the Neotoma Paleoecology Database (http://www.neotomadb.org). The work of data contributors, data stewards and the EPD and Neotoma communities is gratefully acknowledged.
Funding statement
This research was partially funded by a Fulbright Scholar award from the Australian-American Fulbright Commission and a New York University Research Catalyst Grant.
Online supplementary material (OSM)
To view supplementary material for this article, please visit https://doi.org/10.15184/aqy.2024.232 and select the supplementary materials tab.


 Open access