
1. Introduction
Dialects in the South East of England are very often perceived as one homogenous mass, without much regional variation. Rosewarne introduced the notion of Estuary English and defined it as ‘variety of modified regional speech [ . . . ] a mixture of non-regional and local south-eastern English pronunciation and intonation’ (Rosewarne, Reference Rosewarne1984). However, studies such as Przedlacka (Reference Przedlacka2001) and Torgersen & Kerswill (Reference Torgersen and Kerswill2004) have shown that, at least on the phonetic level, distinct varieties exist. Nevertheless, very few studies have investigated language use in the South East and even fewer in the county of Sussex. It is often claimed that there is no distinct Sussex dialect (Coates, Reference Coates2010: 29). Even in the earliest works describing the dialect of the area (Wright, Reference Wright1903) there are suggestions that it cannot be distinguished from Hampshire in the west and Kent in the east.
Only two recent studies of accent and dialect use in Sussex are known to the authors. Coates (Reference Coates2010) is based on Survey of English Dialects (SED) data to provide an insight into dialect use in Sussex in the middle of the 20th century. The data is quite limited in that mainly non-mobile older rural males (NORMS; Chambers & Trudgill, Reference Chambers and Trudgill1998) were recorded. The aim of the study was to preserve a record of ‘traditional dialect, genuine and old’ (Orton, Reference Orton1960: 332).
A more recent study investigates the process of regional dialect levelling in Hastings, a town in the east of Sussex (Holmes–Elliott, Reference Holmes–Elliott2015). Holmes–Elliott uses a language variation and change framework to study changes in the goose and mouth vowels and in the use of /θ/. While changes in the mouth vowel are described for different parts of the South East (Kerswill & Williams, Reference Kerswill and Williams2005; Holmes–Elliott, Reference Holmes–Elliott2015), TH-fronting along with L-vocalisation and T-glottalling have been identified as features which are diffusing across the country (cf. Torgersen, Reference Torgersen1997; Britain, Reference Britain2009; Flynn, Reference Flynn2012; Jansen, Reference Jansen2018).
In this paper we present a recent description of features and variation as found in the county of Sussex. Based on English Dialect App Corpus (EDAC) data (Leemann, Kolly & Britain, Reference Leemann, Kolly and Britain2018), we provide information about the geographical distribution of dialect features across the county, divided into coastal and inland regions, urban and rural areas, main administrative centre and other areas and East Sussex vs West Sussex vs Mid Sussex. In many cases we also include information about the use of features by age group as this can be an indicator for change.
2. Sussex
Sussex is situated in the South East of England, stretching along the south coast from Chichester in the west to Rye in the east and reaching north to Crawley. The area known as Sussex also includes the unitary authority of Brighton and Hove. In 1974 the county was divided into the two administrative parts, East and West Sussex. The area traditionally had a largely rural population. The south-coast towns developed as tourist centres after the Prince Regent, later King George IV, adopted Brighton as his holiday home in the 1820s and tourism is now a significant source of employment in these towns. During the second half of the 20th century the area began to attract workers in the service industries, so that by 2011, 65% of the population was employed in retail, health, education and other service industries. The population in the area has grown from around 600,000 in 1911 to 1,600,000 in 2011. Around 50% of the population live in West Sussex, 33% in East Sussex and the remaining 17% in Brighton and Hove.Footnote 1 It is an area that attracts incomers from other parts of the UK and has significant numbers of commuters, especially in the corridor between London and Brighton.
3. The English Dialect App
The data for this paper are taken from the EDAC (Leemann et al., Reference Leemann, Kolly and Britain2018). The data was collected with the English Dialect App (EDA), a free iOS and Android app which includes a dialect quiz and dialect recordings. It was launched in January 2016 and more than 50,000 users took part. In this quiz participants have to indicate variants of 26 words they use. Based on SED data, the app then guesses their local dialect region. The quiz was made up of 19 phonetic and phonolexical variables (73%), three lexical variables (12%), four morphological variables (12%) and one syntactic variable (3%) (Leemann et al., Reference Leemann, Kolly and Britain2018: 3). More than 3,500 users also provided audio recordings. For further details of the app development and discussions of the validity of this data in the context of dialect research traditions and current trends see Leemann et al. (Reference Leemann, Kolly and Britain2018).
The participants also provided several items of personal information, e.g. gender, age, social class, ethnicity and place of residence. Table 1 provides the overall distribution of the participants by age group.
Age group distribution and number of participants per age group

For the purpose of this paper we used further regional divisions. On the one hand the place of residence was divided into three areas: East, Mid and West Sussex. The shape of the county together with the special status of Brighton and Hove, led us to divide the county into three areas, with the area lying due north of Brighton, technically within West Sussex, being designated as Mid Sussex.
On the other hand, the county was also divided into five different categories: coastal rural, rural inland, inland town, main town and seaside town. Examples for coastal rural communities are Saltdean and Hambrook; for rural inland communities: Angmering and Stanmer; for inland towns: Arundel and Burgess Hill; Chichester and Brighton for main towns and Bexhill and Shoreham-by-Sea for seaside town. Obviously, the broader social categories are intertwined with the different regions and advanced statistical analyses would be needed but cannot be included in this paper.
4. Data analysis
In this section, we describe the linguistic data. We focus on those variables which either show significant variation across Sussex or where the use has changed dramatically between the SED and the EDAC data.Footnote 2 We take the different linguistic levels in turn, starting with phonetic/phonological variation, moving next to lexical variation and finally addressing morphological/syntactic variation.
4.1 Phonetic/phonological variation
Variation in the use of pre-consonantal /l/
We start off with the variation within the EDA data. A variable for which we find quite a bit of variation across apparent time and in the different regions is the use of preconsonantal or word-final /l/. While in regions such as the North East of England clear /l/ prevails in this position, in Sussex the main variation occurs between dark /l/ [ɫ] (66.3%) and [ʊ] (31%) as vocalic variant. L-vocalisation as an innovative form diffusing from London has been reported in recent years (cf. Tollfree, Reference Tollfree, Foulkes and Dochety1999; Williams & Kerswill, Reference Williams, Kerswill, Foulkes and Docherty1999; Britain, Reference Britain2009).
For Sussex, Coates (Reference Coates2010) mentions that in the west velarized and vocalised forms are found in syllable-final position and in syllabic position. Torgersen (Reference Torgersen1997) also reports some L-vocalisation for Sussex. In the EDA data an increase in the use of L-vocalisation from 25.8% for the >60 age group to 35.7% for <20 age group is observable. Variation in the geographical distribution of this variant from east to west is also attested (east: 32.1%, mid 31%, west 25.3%). Variation exists between coastal places (coastal rural: 38.7%, seaside town: 39.9%) and inland places (inland town: 28.7%; rural inland: 25.7%) and main towns (26.4%). The information that this is a diffusing feature in addition to the data analysis suggests that we see the diffusion of this feature to the coast before the inland is affected. At the same time, an east to west diffusion is observable.
Word-final intervocalic /t/
The second phonetic variable for which we find variation is the use of /t/ in word-final prevocalic position. The sample word in the EDA is bit of. While it seems clear that L-vocalisation originates from Cockney English, the origins of T-glottalling are not as easy to identify. Trudgill (Reference Trudgill1999: 132) states that East Anglia ‘appears to have been one of the centres from which glottalling has diffused geographically in modern English English’ while others (Wells, Reference Wells, Melchers and Johannesson1994; Williams & Kerswill, Reference Williams, Kerswill, Foulkes and Docherty1999; Przedlacka, Reference Przedlacka2001; Altendorf, Reference Altendorf2003) have argued for London East End and/or Scotland (cf. Schleef, Reference Schleef2013; Smith & Holmes–Elliott, Reference Smith and Holmes–Elliott2018) as place of origin. A second innovative variant is [d] or flapping, a feature similar to the realisation of intervocalic /t/ in American English.
Turning to the EDA results, the most common variants in the Sussex data are [t] (71.1%), [d] (13.7%) and [ʔ] (13.8%). For the latter two variants an increase across apparent time is observable while the use of [t] decreases from 82.8% for the <60 age group to 66.7% for the >20 age group. In addition, some geographical variation for T-glottalling is found in Sussex: It is used in East and Mid Sussex at 14.5% and 14.9% respectively while the use in West Sussex is only 8.8%. The use of flaps in this environment is also geographically stratified: in the east 14.2% of participants chose the flap variant, in Mid Sussex 13.2% and in West Sussex 11.8%. In the main towns 17.9% report glottalling and in the rural coast area it is 16.1%. In main towns it is 12.5%, in inland towns it is 12.3% and in the rural inland it is 11%.
Given that T-flapping is described as innovation in RP and in general not often described for /t/ in the south of England, a surprisingly high percentage of T-flapping is reported in Sussex. While in the rural inland 8.8% of participants report on the use of this variant, in the rural coast area the use increases to 19.4%. Taking a look at the social stratification, the variant is used more by working-class speakers (18.7%) than in the highest social category (12%). This finding is somewhat surprising since Barrera (Reference Barrera2015) reports this variant for RP speakers. This calls for a closer investigation of /t/ variation and/or change in the South East.
Similar to L-vocalisation, T-glottalling is one of the features which has been diffusing across the country (cf. Britain, Reference Britain2009; Schleef, Reference Schleef2013; Alderton, Reference Alderton2020; Jansen, Reference Jansen2021). However, it is surprising that the rate of T-glottalling is fairly low at 13.8% with even the youngest age group not reaching 18%. Schleef (Reference Schleef2013) reports the completion of the change towards glottal stops for adolescents in London and Jansen (Reference Jansen2018) finds 64.6% in the age group of 22–29 in Carlisle in the north of England using glottal stops. Hence, while we see T-glottalling (similar to L-vocalisation) reaching the west later than the east, the low frequency of this feature in Sussex is surprising and needs to be investigated further.
TH
A third variable for which we find variation in Sussex is the interdental /θ/ sound. Just like the previous two variables, this variable is reported as being subject to change across the country at the moment. In many varieties in England, the interdental sound is replaced by [f] (cf. Llamas, Reference Llamas1998; Tollfree, Reference Tollfree, Foulkes and Dochety1999; Williams & Kerswill, Reference Williams, Kerswill, Foulkes and Docherty1999; Trudgill, Reference Trudgill1999; Kerswill Reference Kerswill, Britain and Cheshire2003, Jansen, Reference Jansen2014).
The EDA provided four options: [θ], [f], [ð] and [t] and the two common variants are the first two. Realising an interdental sound as a labiodental variant is called TH-fronting and 11.6% of the participants use this variant while the large majority of 86.4% (still) uses the interdental variant. For TH-fronting we see an increase from 6.5% for the >60 age group to 15.5% for the <20 age group. Again, the coastal rural areas (16.1%) and the seaside towns (15.5%) are leading the change, while the inland towns (11.8%), rural inland (8.1%) and main towns (8.1%) lag behind in the reporting of TH-fronting. In the Mid Sussex region speakers use more TH-fronting (18.4%) than in the east (10.5%) and the west (10.6%).
Again, the frequency of TH-fronting as an innovative form is surprisingly low compared to other studies. In particular Holmes–Elliott's (Reference Holmes–Elliott2015) study of innovations such as TH-fronting in Hastings is of relevance here. The result for her middle age speakers (35–50) is 34% and therefore much higher than what we find in the EDA results. We will come back to this point in the discussion.
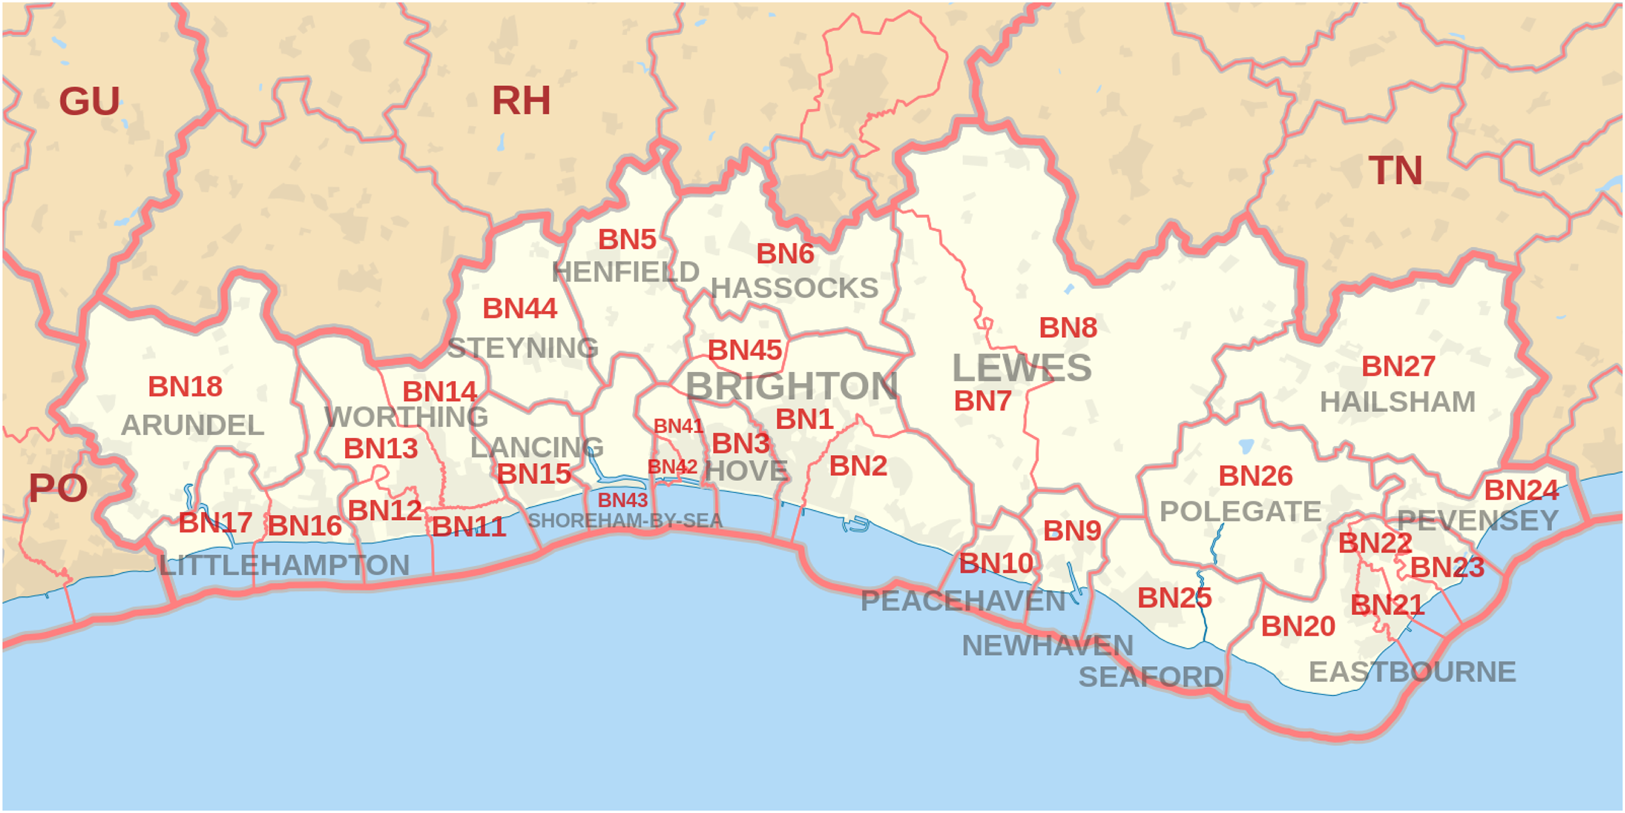
The post code areas of Sussex, Creative commons BN postcode area map by Richardguk is licensed under CC-BY-SA-3.0 (© Ordnance Survey 2012)
Dramatic phonological shifts
The following two variables do not show much variation in the EDAC data. However, comparing the SED data with the EDAC data shows a dramatic shift towards more standard like variants.
Rhoticity
The first of the two variables discussed here is rhoticity.Footnote 3 In the English-speaking world, rhoticity refers to the use of /r/ in non-prevocalic position in words such as car and card.Footnote 4
East Sussex is described as variably rhotic by Ellis (Britain, Reference Britain2009 based on Ellis, Reference Ellis1889) in the second half of the 19th century while West Sussex was still rhotic. In the SED data ‘preconsonantal and prepausal /r/ is regularly pronounced’ (Coates, Reference Coates2010: 44). The EDAC data, on the other hand, shows that non-rhoticity is very much the norm now in Sussex, with around 7% reporting rhoticity in the word arm, although there is no apparent change across the age groups. Piercy (Reference Piercy2006) based on Ellis (Reference Ellis1889) and the Linguistic Atlas of England (Orton, Sanderson & Widdowson, Reference Orton and Widdowson1978) suggests that the increase of non-rhoticity is diffusing east to west in the south of England. Based on the lack of variation in the EDAC data we can conclude that the change towards non-rhoticity is completed in Sussex now.
A phenomenon which is related to rhoticity is r-sandhi, the surfacing of /r/ in a linking position. In addition to the distribution of rhoticity, the EDAC also provides information about intrusive /r/ in the item thawing. The use of the sandhi phenomenon increases from 49.5% for the age bracket of the >60 age group to 80.2% for the group of the <20 age group. In the phonological literature, it has been argued that rhoticity and /r/-sandhi are in complementary distribution (e.g. Giegerich, Reference Giegerich1999: 196), while Barras (Reference Barras, Braber and Jansen2018) attests the co-occurrence of these forms in Lancashire. The EDA data leads to the assumption that intrusive /r/ is on the rise after the loss of rhoticity in this area.
H-dropping
A second feature for which we find virtually no variation in the EDAC is the deletion of word initial /h/ in words like house, hand and height. Coates (Reference Coates2010: 45) writes: ‘The north of the county is at the southern tip of a corridor in which initial /h/ may be retained, but even there h is variably absent.’ Hence, while in the middle of the 20th century H-dropping was still a common feature of Sussex English, in the EDAC, over 90% of each age group indicate that they use [h] in word initial position. Again, this is a dramatic shift in variant use over the course of the 20th century. Figure 2 provides a visualisation for the SED and EDAC data.
H-dropping areas based on SED data (left) and on the EDAC data (right)

mouth
Turning to vowel variation, both price and mouth show variation across the county. The EDA question provides eight variant pronunciations for the word house but only four options were chosen by Sussex participants: [aʊ], [əʊ], [ɛʊ] and [æʊ]. [aʊ] is associated with the standard form which seems to have become a supralocal form (cf. Holmes–Elliott, Reference Holmes–Elliott2015) while the other variants are part of Diphthong Shift, an extension of the Great Vowel Shift, which has been described for the South East of England (cf. Wells, Reference Wells1982b; Williams & Kerswill, Reference Williams, Kerswill, Foulkes and Docherty1999; Kerswill, Torgerson & Fox, Reference Kerswill, Torgersen and Fox2008; Holmes–Elliott, Reference Holmes–Elliott2015; Oxbury & de Leeuw, Reference Oxbury and de Leeuw2020). The predominant form for Sussex in the SED is [ɛʊ] (cf. Coates, Reference Coates2010). Coates (Reference Coates2010) also mentions the ‘new monophthongal forms from London’, i.e. [aː] which is attested for Multicultural London English (cf. Kerswill et al., Reference Kerswill, Torgersen and Fox2008).
The most widespread variant is clearly [aʊ], ranging from 54.8% in the >60 age group to 77.3% in the <20 age group. This indicates a change towards the standard form. However, as discussed above, [əʊ], [ɛʊ] and [æʊ] are also attested in the data, i.e. the latter two variants seem to be reminiscent of Diphthong Shift in Sussex which is now overruled by pronunciation standardisation processes. Surprisingly, participants in inland locations seem to favour the standard form more than participants at seaside locations. This seems to contradict the idea of levelling of supralocal forms spreading from London via major towns/cities, but fits the pattern of the higher use of non-standard forms along the coast.
price
Two questions in the EDA are concerned with the price vowel: the vowel before a voiceless consonant as in night and before a voiced consonant as in five. The app provides different sets of options for each question, but the four variants which trigger most responses in the Sussex data are shared: [aɪ]/[æɪ]; [ɑɪ]; [ʌi]/[əi]; [ɒɪ]/[ɔɪ].
For Sussex speakers, the first two of these account for over 90% of occurrences, but the distribution varies. For the night question, the first option accounts for 84% of responses, with 9% choosing the second option. For the five question these percentages are roughly reversed, with 9% and 83% respectively.
The vowel distribution suggests that there is an allophonic split between these two groups. In quite a number of varieties of English an allophonic split also known as Canadian Raising – e.g. on Martha's Vineyard (Labov, Reference Labov1963); Canada (Chambers, Reference Chambers1973); the Fens (Britain, Reference Britain1997); St. Helena (Schreier, Reference Schreier, Schreier, Trudgill, Schneider and Williams2010); Mersea Island in Essex (Amos, Reference Amos2011) – exists in which the onset of the diphthong is raised before voiceless consonants. However, the allophonic split in the Sussex data has a different distribution. If the diphthong is followed by a voiceless consonant, it is likely that the onset is realised as an open front vowel [a] or near-open front vowel [æ] whereas the open back vowel [ɑ] seems to be preferred in words like five in which the vowel is followed by a voiced consonant. Wells (Reference Wells1982a: 208) mentions that varieties which have [ɑɪ] have undergone Diphthong Shift, e.g. Cockney (Wells, Reference Wells1982b: 308). However, he does not mention an allophonic split. The only significant regional variation in the price lexical set can be found in the coastal rural locations, where the allophonic variation before the voiceless sound is between [aɪ]/[æɪ] (77%) and [ʌi]/[əi] (16%).
The other two variants are ones that Coates mentions as Sussex specific variants. He states that [ɔɪ] is used in the West, with [əi] in the East. Mainly older speakers (over 60) favour this variant which seems to be a repercussion of Diphthong Shift, similar to the variant distribution for mouth. Those traditional variants for both mouth and price only play a marginal role now which indicates that levelling is happening (cf. Kerswill & Williams, Reference Kerswill and Williams2005).
4.2 Morphosyntax and lexis
Moving on to morphosyntactic and lexical variation, not much variation exists in this dataset. For all four morphosyntactic and three lexical variables in the EDAC the standard variant is indicated in over 90% of responses. However, lexical and some morphosyntactic variables often show less striking and statistically insignificant differences between the usage of variants than phonological variables do (cf. Beal & Burbano–Elizondo, Reference Beal and Burbano-Elizondo2012; Robinson, Reference Robinson2012). Therefore, in this paper we report on all these patterns of variation.
With little geographical variation not much can be said (anymore) about the diffusion pattern of these variables. However, taking Coates (Reference Coates2010) into account, it shows that these non-standard forms used to be found in Sussex quite regularly. Coates (Reference Coates2010: 48) mentions that the third person reflexive pronoun is ‘widely hissel(f)’. In the EDAC data 17 participants indicate that they use this form and participants in the rural inland indicate it in 2.2% which is the highest proportion.
A second form which triggers more variation is the syntactic structure ‘give it to me’. The three options which were offered in the EDAC are: give me it (2.3%), give it me (4.9%) and give it to me (92.8%). The minor variants are used more in towns especially in the mid-Sussex area. They are also used nearly twice as much by females than males. The give it me construction is attested for Sussex and Kent by Coates (Reference Coates2010: 48).
The Third-Person Singular Present variable is presented by variants feeds (97.7%), feed 28 (2.2%), and do feed (one instance). The distribution of feed across the demographic data is relatively even. In addition, there are two instances of the possessive pronoun hern compared with the majority form of hers.
All lexical variables in the EDA concern onomasiological variation and this is not discussed by Coates (Reference Coates2010). The dominant analysis indicated that most lexical variation exists in the usage of SPLINTER. All ten variants available for SPLINTER in the EDAC are used across Sussex. Figure 3 presents the relative distribution of 44 instances of the minor variants of SPLINTER (3.5% of the total usage of SPLINTER).
The relative usage of the minor variants of SPLINTER

A far greater degree of variation in SPLINTER is reported now in comparison with the SED, which indicates only two variants being used in Sussex in 1950s, i.e. splinter and sliver. Sliver is still currently the most frequent of the minor variants with 13 instances. The minor variants of SPLINTER are used mainly in coastal towns.
When it comes to the AUTUMN variable, all three available variants are reported in Sussex. Fall (ten instances) is used mainly in towns and backend (four instances) is used by two Asian speakers out of the entire population of 17 Asians in the EDA.
Least onomasiological variation exists in the concept of SNAIL. Two middle aged females chose the variant represented as hodmedod / hoddy-dod / hoddy-doddy. No usage is reported for dod-man.
5. Discussion
The results of the EDAC provide a clearer picture of the dialectological landscape of Sussex, a county which is linguistically understudied. Comparing the dialect data with one of the very few accounts of the Sussex dialect (Coates, Reference Coates2010), there are some interesting findings in terms of stability and change. As part of the South East of England, the linguistic situation is often described as homogeneous with very little variation. And indeed, the morphosyntactic and lexical results for Sussex confirm Anderwald's (Reference Anderwald2006: 460) observation that speakers in the South East of England are mainly using standard English features. Very little variation is found for lexical and grammatical items tested in the dialect app.
One of the most striking changes between the SED data and the present-day data is the dramatic decline of rhoticity and H-dropping in the entire county. While both features were still very frequent in the SED data, both are categorically absent in the EDAC data. Even the oldest speakers in the EDAC hardly use these forms which leads to the assumption that instead of gradual changes over the course of the 20th century, these might have been quite abrupt changes.
Comparing the geographical distribution of phonetic innovations such as L-vocalisation, T-glottalling/T-flapping and TH-fronting, the EDA data shows that the changes are more advanced in East Sussex than in the other parts of the county. This might have to do with good road and rail links to London as well as outmigration from London to places like Brighton and Hastings which lead to increased dialect contact situations compared to the West Sussex areas. At the same time, the coastal places seem to adopt non-standard feature more quickly and retain traditional non-standard features longer than inland communities. One aspect which was not discussed in the paper but should be taken into account in future studies is social class in correlation with place. Inland communities often seem to be very middle class compared to seaside towns like Hastings or Newhaven and this intersectionality might have repercussions on the diffusion process.
This paper provides an initial view on variation in Sussex. More work is needed and more research based on the EDAC is anticipated which will include information on gender, age group, ethnicity and social class. As hinted at above, the complex interaction between place and social class which the data indicate needs to be discussed further.
Even though the EDAC is an excellent data source, there might be some restrictions when eliciting the data. People might over- or underestimate the use of certain forms. The relatively low percentage of consonantal innovations in this dataset hints at this problem. While sociolinguistic studies such as Torgersen (Reference Torgersen1997) or Przedlacka (Reference Przedlacka2001) and Holmes–Elliott (Reference Holmes–Elliott2015) find quite high percentages for the innovative forms, the percentage of people who report using these features in the EDAC is comparatively low. A second problem is that change in progress can only be investigated in a very indirect manner. The participants need to be able to observe that they are using a variant that is on the rise and it is only possible to name one variant, i.e. early stages of a change are underrepresented. The EDAC data can provide indicators for ongoing changes. However, in-depth sociolinguist research is needed for communities in Sussex to get a precise picture of the language variation and change situation in this county by the sea.
 Sandra Jansen is a Senior Lecturer in English linguistics at the University of Paderborn, Germany. Her research focuses on language variation and change, Cumbrian English, sociophonetics and variation in production and perception of L2 varieties of English. Recently, she edited a volume on Sociolinguistics in England (Palgrave; with Natalie Braber) and a volume on Processes of Change. Studies in Late Modern and Present-Day English (John Benjamins; with Lucia Siebers). Email: sandra.jansen@unipaderborn.de
 Justyna A. Robinson is a Senior Lecturer in English Language and Linguistics at the University of Sussex, United Kingdom. Her research focuses on semantic variation and change, sociolinguistics, cognitive linguistics, corpus linguistics and how these interact. Her recent work on a collaborative AHRC-funded project ‘Linguistic DNA. Modelling concepts and semantic change’ is available here https://www.linguisticdna.org/. Email: justyna.robinson@sussex.ac.uk
 Lynne Cahill is a Senior Lecturer in English Language and Linguistics at the University of Sussex. Her previous work mostly focusses on lexical representation of morphology and phonology and the connections between orthography, phonology and morphology. In recent years she has focused on the relationship between spelling and pronunciation, with a particular interest in variant spellings in contexts as diverse as medieval legal documents and computer mediated communication. She has worked on accent change alongside students, including a study of the diphthongs in Mick Jagger’s speech over 50 years. She is the author of the textbook Discovering Phonetics and Phonology and has been a Sussex resident for nearly 40 years.
 David Britain has been Professor of Modern English Linguistics at the University of Bern in Switzerland since 2010, having previously worked in New Zealand and the UK. His research interests embrace language variation and change, varieties of English (especially in Southern England, the Southern Hemisphere and the Pacific), dialect contact and attrition, dialect ideologies, and the dialectology-human geography interface, especially with respect to space/place, urban/rural and the role of mobilities. He is co-author (with Laura Rupp) of Linguistic perspectives on a Variable English Morpheme: Let’s Talk about –s (Palgrave, 2019), editor of Language in the British Isles (Cambridge University Press, 2007), co-editor (with Jenny Cheshire) of Social Dialectology (Benjamin, 2003), and co-author of Linguistics: An Introduction (with Andrew Radford, Martin Atkinson, Harald Clahsen and Andrew Spencer) (Cambridge University Press, 2nd edn., 2009). David was Associate Editor of the Journal of Sociolinguistics between 2008 and 2017.
 Tamsin Blaxter did her BA Linguistics at the University of Essex, MPhil General Linguistics and Comparative Philology at the University of Oxford, and her PhD in Linguistics at the University of Cambridge. Her PhD used spatial evidence to explore the role of contact in simplificatory change in the history of Norwegian. She is currently undertaking a Research Fellowship at Gonville & Caius College. Her research interests include spatial aspects of language change and language variation, mathematical models of change, Scandinavian historical linguistics, and English dialectology.
 Adrian Leemann did his PhD in 2009 at the University of Bern on the Intonation of Swiss German dialects. As a postdoc, he worked on a number of projects in forensic phonetics and dialectology at the Universities of Zurich and Cambridge. During this time, he – with various teams – developed dialect apps for typologically diverse languages. In 2017 he was appointed Assistant Professor of Sociolinguistics at Lancaster University. Since September 2019 he has his own research group at the University of Bern, investigating language variation and change in German-speaking Switzerland.


 Open access