

A Base for Detailed Comparative Studies of Sea-Ice Textures
The development of a sea-ice sheet in the complex framework of ice ocean-atmosphere interaction expresses itself in the ice texture, i.e. the size, shape, and spatial distribution of the component phases. Texture, in turn, to a large extent controls sea-ice properties. Traditionally, textural information is extracted from ice core samples through visual examination of thin sections from different stratigraphic units, augmented by inspection of vertical thick sections. Based on this qualitative assessment, samples are designated one of several textural classes (cf. Weeks and Ackley, Reference Weeks and Ackley1982; Eicken and Lange, Reference Eicken and Lange1989). Table 1 indicates the three main textural classes considered in this paper. Development and properties of the floe that a sample originated from are clarified by assigning the sample to one of these classes (Table 1). However, the subjective character of the classification process does not necessarily permit intercomparison between large numbers of samples, nor does it guarantee a high degree of reproducibility. Automated textural classification of thin sections could be of use in this context because it may (a) ensure reproducible results, (b) draw information from large data sets for comparison and (c) allow for quantitative textural analysis with further differentiation between samples of the same textural class.
Technically, automated classification algorithms have to rely on a set of criteria capable of distinguishing between different textural classes. Following the description
Table 1. Classification of sea-ice textures

of the hardware employed, we attempt to establish useful classification criteria and outline the methodic path leading to a distinction between different textures.
Instruments and Sample Preparation
Preparation of sea-ice thin sections
Sea-ice thin sections were cut at −25° to −30° C from cores collected in Fram Strait and the central Arctic, as well as in the central, southeastern and northwestern Weddell Sea. To ensure that image analysis is not hampered by artifacts such as surface grooves caused by the microtome blade, emphasis was placed on careful sample preparation. Horizontal thick sections were sawed, frozen onto a first glass plate, and the resulting surfaces microtomed. These surfaces were then fixed on a second glass slide by welding with water from the side. The first glass plate was then removed, and the thin section microtomed to roughly 0.5 mm thickness and polished with a cloth.
Hardware components of the image-analysis system, digitizing procedure
Thin sections, placed on a Rigsby stage between crossed polarizers in a glaciological cold laboratory, were recorded with a Hamamatsu C2400 grey-tone video camera (Fig. 1). A consistent magnification was chosen to exclude resolution-dependent effects. Video frames were digitized with a Matrox Pip-1024 image-analysis board installed on a Compaq 386 microcomputer clocked at 20MHz (cf. Perovich and Hirai, Reference Perovich and Hirai.1988). Digitized images consist of a 512 × 512 pixel array, each pixel with a designated grey value ranging between 0 (black) and 255 (white). Colours or grey values of crystals change at different orientations with respect to the polarizers. In order to compensate for this effect and to improve recognition of grains, each thin section was recorded at two different orientations, such that the median grey value of an entire image was at its minimum and maximum, respectively (see Fig. 2 for a flow-chart of the image-analysis process). Due to internal diffraction, pores may appear as dark speckles within grains of high grey value. Through non-linear filtering (morphological opening, for details cf. Serra, Reference Serra1982) pore signals up to a size of 4

Fig. 1. Sketch of hardware set-up for imane processing of ice thin sections.

Fig. 2. Flow chart of image-processing steps carried out for tcxtural classification.
pixels in diameter were removed from the images. The resulting modification of image resolution along with a detailed error analysis will be discussed in a later publication by Eicken.
Classifiers for the Distinction Between Different Textures
Distribution of grey values: the contrast gradient
One of the most obvious distinctions between granular and columnar ice is the difference in mean grain-size. Not as apparent from mere visual inspection of thin sections, yet of great importance when distinguishing between samples of similar grain-size, is the distribution of crystallographic c axes of the grains. By defining a contrast gradient (CG) as a measure both for the degree of misalignment between grains and the density of grain boundaries within an image, we attempt to distinguish between samples of granular and columnar texture based on image contrast.
For the determination of CG, the image exhibiting the maximum median grey value is convolved with a 3×3 kernel h(u, v) with u identifying the row and v the column of each element. All pixels of the original image S(x, y) with x and y specifying the pixel position within each row and column, respectively, are transformed to S′(x, y) by comparing them with their eight nearest neighbours according to

with m = 3 and k. = (m − 1)/2 (Haberäcker, Reference Haberäcker1985). In this case, regions of high contrast are marked through convolution with a Laplacian edge detection kernel
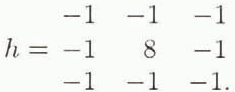

Fig. 3. Sketch clarifying computation of contrast gradient (CG) for samples of different grain-size and c-axis orientation. Centre graphs show grey value (GV) variations along profile specified at left; graphs at right show contrast curves (grey value histogram) from which CG is derived.
By comparing each pixel with its eight nearest neighbours in such a way, regions of high contrast, such as grain boundaries with a high degree of crystallographic misalignment between adjacent pixels, are marked in the transformed image as bright zones of high grey value (Fig. 3, middle). The grey-value distribution of the Laplacian-filtered image thus contains information about the grain-boundary density and the degree of misalignment between grains. High frequencies of low grey values correspond to little overall contrast in the image, and vice versa (Fig. 3, right). This information may be extracted from the Laplacian-filtered image by computing the slope (g) of the grey-value frequency histogram between grey values 20 and 128 with a least-squares method. Small-scale contrast (grey values <20) at the low end of the histogram and large-scale contrast (grey values >128) at the high end are not considered because they are prone to error and contain little useful information. The contrast gradient is defined as
Fine-grained granular specimens, which typically exhibit a random distribution of c axes, exhibit large CG values, whereas coarse-grained columnar specimens with c axes aligned near parallel exhibit small CG values (Fig. 3).
Table 2 shows mean CG values, standard deviation, extrema, and number of samples analyzed for the three main textural classes. The samples considered in this study represent a wide scope of different textures from
Table 2 Mean values, standard deviations and range of contrast gradients (CG) for different classes (N samples analyzed)

the Arctic and the Weddell Sea. Although mean values diverge between textural classes, there is still considerable overlap between granular and columnar ice with respect to individual data points. For further differentiation, in addition to considering mean values, we take into account the distribution of grain sizes as well.
Lineal analysis: the distribution of chord sizes
Lineal analysis (i.e. the collection of data along sets of lines) is aimed at determining the lengths of chords that are cut off from grains by intersecting pixel rows or columns (Fig. 4). The chord-size distribution contains information about shapes and sizes of the analyzed particles. Prerequisite for this method is the segmentation of the thin-section image into grains and grain boundaries with the aid of the Sobel operator. This operator computes grey-value gradients in a;- and y-direction with masks x and y (Haberäcker, Reference Haberäcker1985)

thereby accentuating grain boundaries as regions of high contrast. For every sample, two images exhibiting maximum- and minimum-median grey values were convolved with a 3 × 3 Sobel operator. The filtered images were combined and binarized about a threshold value of 128, with grey values 0 and 255 designated to grains and grain boundaries, respectively. Finally, the distribution of chord lengths was determined.
Figures 5a and 5b show representative chord-size distributions for samples of granular and columnar ice, re-

Fig. 4. Sketch of lineal analysis performed on exemplary grain.

Fig. 5. Chord-size distribution for (a) a representative, sample of granular ice; mean chord size SM = 1.2 mm, skewness of the distribution f = 9.9; and (b) a representative, sample of columnar ice; mean chord size Sm = 6.8 mm, skewness of the distribution f = 1.5.
spectively. Whereas granular ice generally exhibits a narrow range of chord sizes with maximum values below 10 mm, columnar ice tends towards much higher values. Α χ2 test (Lloyd, Reference Lloyd1984) suggests that chords of granular samples follow a different distribution than most columnar samples. In this context, the skewness (f) of the chord-size distribution appears as a useful parameter for the distinction between granular and columnar ice (Fig. 5). It represents a measure of the degree of asymmetry with respect to a normal distribution (for which f = 0) and is defined as

for Ν samples xM with mean value xM and standard de-
Table 3. Mean values, standard deviations and range of chord-size skewness (f) for different textural classes (N samples analyzed)

viation σ (Lloyd, Reference Lloyd1984). Table 3 lists mean skewness, standard deviation, extrema, and number of samples an-alyzed for different textural classes.
Combining information for classification
As a step towards classification, the contrast gradient CG is plotted versus the skewness f of the chord-size distribution (Fig. 6). Figure 6 demonstrates that joint specification of CG and f allows for distinct separation between columnar and granular samples. In addition, further specification of a sample with regard to its exact position in the CG-f parameter plane may be of use for detailed tcxtural characterization.
There is a problem concerning mixed columnar/granular (mixed c/g) samples that overlap with the domains of granular and columnar texture. One has to consider that any differentiation between textures is based on arbitrary dividing lines. Whereas the distinction between columnar ice, forming through congelation of sea water at the advancing ice-water interface, and granular ice, resulting from compaction of frazil crystals formed in the water column, does in fact represent a natural disparity between different growth processes, the distinction between mixed c/g and other textures may not.

Fig. 6. Contrast gradient (CG) plotted versus skewness (f) of the chord-size distribution for 112 samples from the Arctic and Antarctic.

Fig. 7. Schematic drawing of samples of mixed c/g and intermediate c/g texture.
Distinguishing between mixed and intermediate textures
Two different modes of mixed columnar/granular textures may be recognized:
-
(1) grains occurring in two different size and shape spectra, that of granular and that of columnar ice,
-
(2) grains occurring in one size and shape spectrum characteristic of both granular and columnar ice.
Case (1) will be referred to as mixed columnar/granular (c/g) ice proper, case (2) as intermediate columnar/granular ice (Fig. 7, cf. Eicken and Lange, Reference Eicken and Lange1989). The former mainly results from mechanical mixing of columnar ice with granular fragments during deformation. As a working hypothesis, we consider the latter as congelation ice formed under dynamic hydrographic conditions and high growth rates.
Differentiation between these two textural classes is possible through utilization of the concept of self-similarity. Mixed c/g ice appears rather self-similar when viewed at different scales, since large columnar grains are suspended in a finer-grained granular matrix (Fig. 7). The opposite is true for ice of intermediate c/g texture which exhibits a rather narrow size spectrum. This is expressed in the concept of the fractal dimension D. In an equation relating a linear measure of size, e.g. mean grain perimeter P, with image resolution expressed through the size of the picture elements L and a constant k, D appears as an exponent (Mandelbrot, Reference Mandelbrot1983; Fig. 8)
Based on the concept of morphological openings (Serra, Reference Serra1982), we achieved decreasing effective resolution by increasing the size of the morphological mask. The fractal dimension appears as the gradient of a logarithmic curve relating mean chord size s M mask size m
The sketch of a mixed c/g sample in Figure 7 serves well to illustrate the principle. Viewing the image from an increasing distance (i.e. larger m in Equation 7), one resolves fewer and fewer small grains; finally only the largest grains will be recognized. This corresponds to an increase in SM in Equation 7, since more and more small grains will be excluded from the chord-size distribution with increasing m. The larger the fractal dimension D, the larger the degree of self-similarity of the sample investigated. Distinction between mixed and intermediate c/g samples seems possible with the aid of D values, since these do not overlap between the two textural classes (Fig. 7). In fact, with the exception of two samples of granular ice, mixed c/g samples exceed all others with respect to D. These dividing lines are of course blurred by errors due to image processing and acquisition. Although validation requires analysis of additional data, we regard the fractal dimension as a useful parameter to separate mixed c/g ice from other forms.
It seems impossible to draw a boundary line separating columnar and intermediate c/g ice due to their similar mode of formation. However, distinction between intermediate c/g and granular ice may be possible by taking into account maximum grain sizes occurring in a sample, as well as the occurrence of inclusions within grains typical of intermediate c/g textures.
Conclusions
The development of image-processing techniques and algorithms for textural quantification of sea-ice thin sections may serve as a base for detailed texture analyses. The combination of parameters that specify mean size and orientation of grains as well as their size distribution enables us to distinguish between granular and columnar ice for a representative data set. Although this task may appear trivial, it involves overcoming of a number of difficulties, including standardized image acquisition and identification of grain boundaries. Further differentiation between varieties of mixed columnar/granular textures has been shown possible on a small, yet representative data set. Here, the degree of self-similarity of thin sections, as described by the fractal dimension D serves as a classifier. Further work is of more general interest with regard to the development of different textures in anisotropic granular media, such as metals or igneous and metamorphic rocks.
One of the advantages of textural quantification through image-processing is the high reproducibility achieved, especially when distinguishing between apparently similar samples. The method, however, allows for more than simple classification. Through specification of a sample’s location in the CG-f parameter plane, accurate discrimination between samples of the same texture becomes possible. Thus one may be able to determine and quantify regional textural differences, such as disparities between thin sections of columnar ice from the Arctic and Antarctic.
Acknowledgements
We thank Don Perovich and Steve Ackley for putting us on the path to image analysis of sea-ice thin sections. Contribution no. 322 of the Alfred-Wegener-Institut für Polar- und Meeresforschung.


