Dietary patterns play a crucial role in the high incidence and prevalence of CVD and other chronic non-communicable diseases(Reference Bruins, Van Dael and Eggersdorfer1). The Mediterranean diet, one of the most widely studied dietary patterns, has been proposed as an effective approach for both the prevention and management of CVD, including CHD, which is a common form of CVD(Reference Mozaffarian2). Moderate wine consumption, a characteristic of Mediterranean diet, is supported by numerous epidemiological studies, which suggest that 20–30 g of alcohol (approximately 160–250 ml of wine) per d is associated with a lower risk of CVD(Reference Costanzo, Di Castelnuovo and Donati3). Generally, low-to-moderate drinking is defined as no more than one drink per d for women and no more than two drinks per d for men, with recent recommendations suggesting a maximum of 100 g of alcohol per week(Reference Visseren, Mach and Smulders4). Although ethanol itself offers some cardiovascular benefits(Reference O’Keefe, DiNicolantonio and O’Keefe5), such as increasing HDL-cholesterol, preventing platelet aggregation and enhancing fibrinolysis, wine is considered to provide superior health benefits. Moderate wine consumption has been shown to influence haemostatic balance by modulating platelet function, fibrinolytic activity and endothelial function, which may contribute to its potential protective effects against CVD through the reduction of thrombotic events(Reference Fragopoulou and Antonopoulou6). Several studies have demonstrated that the protective effects of wine are primarily attributed to its micro-constituents, which exert potent anti-oxidant, anti-inflammatory and anti-thrombotic effects(Reference Fragopoulou, Demopoulos and Antonopoulou7). Among these bioactive compounds are phenolic compounds such as anthocyanins, flavanols, flavonols, phenolic acids and stilbenes. Resveratrol, gallic acid, catechin, epicatechin and quercetin are particularly noteworthy(Reference Vallverdú-Queralt, Boix and Piqué8).
Platelet-activating factor (PAF) is a potent phospholipid mediator involved in the initiation and prolongation of atherosclerosis(Reference Demopoulos, Karantonis and Antonopoulou9). PAF levels are regulated by the rate of its biosynthesis and its catabolism (Fig. 1)(Reference Snyder10). Its biosynthesis occurs through two specialised pathways distinct from those of other phospholipids. The remodelling pathway begins with cell membrane phospholipids and involves phospholipase A2, which generates lyso-PAF. This is then acetylated by acetyl-CoA:lyso-PAF acetyltransferase (LysoPAF-AT) to form PAF(Reference Shindou, Hishikawa and Nakanishi11). The main reaction in the de novo pathway utilises 1-alkyl-2-acetyl-sn-glycerol and cytidine 5’-diphospho (CDP)-choline as substrates of a dithiothreitol (DTT)-insensitive phosphocholine transferase (PAF-phosphocholine transferase), which catalyses the synthesis of PAF from 1-O-alkyl-2-acetyl-glycerol(Reference Snyder12). The catabolism of PAF is mainly mediated by an intracellular PAF-specific acetylhydrolase (PAF-AH) and its plasma isoform, lipoprotein-associated phospholipase A2 (LpPLA2), both of which hydrolyse the acetyl group from the sn-2 position to form lyso-PAF(Reference Stafforini13). Elevated levels of PAF, through binding to its specific receptor, enhance inflammation and thrombosis. The ex vivo response of platelets to PAF, particularly their aggregatory ability, is considered an indirect method to estimate PAF’s actions in the organism. PAF signalling system amplifies inflammatory and thrombotic cascades when interacting with other mediators, mediating molecular and cellular interactions between inflammation and thrombosis(Reference Zimmerman, McIntyre and Prescott14,Reference Verouti, Fragopoulou and Karantonis15) .
Main enzymatic pathways of PAF metabolism. AAG, alkyl-acetyl-glycerol; AAGP, alkyl-acetyl-glycerophosphate; ALPA, alkyl-lyso-glycerophosphate; LpPLA2, lipoprotein-associated phospholipase A2 (plasma isoform); PAF-AH, PAF-acetylhydrolase (cellular isoform); LysoPAF-AT, lyso-platelet-activating factor acetyltransferase; Lyso-PC, lyso-phosphatidylcholines; LysoPAF, lyso-platelet-activating factor; PAF, platelet-activating factor; PAF-CPT, platelet-activating factor-cholinephosphotransferase.

Previous studies of our research group have shown that wine extracts inhibit PAF-induced platelet aggregation in vitro and reduce the activity of PAF biosynthetic enzymes in U937 monocytes(Reference Fragopoulou, Antonopoulou and Demopoulos16–Reference Vlachogianni, Fragopoulou and Stamatakis19). Other researchers have also reported that wine extracts downregulate the expression of adhesion molecules (Intercellular adhesion molecule-1 [ICAM-1], VCAM-1), E-selectin and monocyte chemoattractant protein-1(Reference Angel-Morales, Noratto and Mertens-Talcott20,Reference Calabriso, Scoditti and Massaro21) , as well as inhibit IL-1β secretion and gene expression in macrophages(Reference Chalons, Amor and Courtaut22). Clinical trials suggest that wine micro-constituents contribute to the anti-inflammatory effects of both acute and long-term wine consumption(Reference Fragopoulou, Choleva and Antonopoulou23). More specifically, wine compounds could modulate leukocyte adhesion molecules(Reference Fragopoulou, Choleva and Antonopoulou23–Reference Estruch, Sacanella and Badia26) during long-term wine consumption and improve flow-mediated dilatation at the postprandial level(Reference Karatzi, Papamichael and Aznaouridis27–Reference Whelan, Sutherland and McCormick29). Additionally, the reduction of PAF biosynthetic enzymes in leukocytes(Reference Argyrou, Vlachogianni and Stamatakis30) has been reported in the postprandial state. However, there is currently no data available on the effects of regular moderate wine consumption on PAF action and metabolism.
Based on the above, it was hypothesised that the micro-constituents of wine could exert beneficial effects by modulating the enzymes involved in PAF metabolism and reducing PAF-induced platelet aggregation, thereby attenuating inflammatory and thrombotic processes. Therefore, the aim of the present study was to evaluate the effects of light to moderate red wine consumption – previously shown to contain PAF inhibitors, as extracts from this wine inhibit PAF-induced platelet aggregation – on PAF metabolism and action, along with thrombotic biomarkers, in patients with CHD. These effects were compared with those of alcohol abstention and with an alcoholic beverage that does not contain wine’s micro-constituents.
Materials and methods
Study design
The study was a randomised, single-blind, controlled, three-arm parallel intervention study designed to evaluate whether light to moderate wine consumption could modulate thrombosis and inflammation in patients diagnosed with CHD.
Seventy-one male patients with CHD were initially recruited to participate in the study. The recruitment took place at several hospitals in Athens, Greece, under the supervision of the corresponding cardiologist. Inclusion criteria were the presence of CHD, stable medication for at least 6 months and the habit of consuming 10–28 g of alcohol per week, a low amount of weekly consumption designed to exclude abstainers. CHD was diagnosed either through angiography or by meeting one of the following criteria: positive stress test, positive myocardial perfusion scintigraphy with thallium, positive triplex heart ultrasound with dobutamine or hospitalisation because of myocardial infarction or stroke. Exclusion criteria were the history of any other chronic inflammatory disease, diabetes, the presence of cold or flu, acute respiratory infection, dental problems and renal/hepatic diseases. This approach was chosen to ensure homogeneity between patient groups and to minimise potential random effects on inflammatory/thrombotic markers and platelet function, particularly given that the study design was parallel rather than crossover. Finally, sixty-four met the inclusion criteria and signed the informed consent. The enrolled participants were randomised into one of the three groups of the study described below. The flow chart of the protocol, already published(Reference Choleva, Argyrou and Detopoulou31,Reference Fragopoulou, Argyrou and Detopoulou32) , is presented in online Supplementary Fig. 1.
The study took place at the Department of Nutrition and Dietetics of Harokopio University in Athens, Greece, and was registered in ClinicalTrials.gov (NCT04438122). Each participant was fully informed about the objectives and procedures of the study and provided written consent before enrolment. The study was conducted in accordance with the guidelines laid down in the Declaration of Helsinki (1989) of the World Medical Association and was approved by the Bioethics Committee of Harokopio University.
All volunteers underwent an initial 15-d alcohol-free washout period, after which they were randomly assigned to one of the three intervention groups. The randomisation code was prepared by a staff member who was not involved in running the trial by using computer-generated random numbers. Subjects were strongly advised to follow their usual dietary and physical activity habits and not change their medication during the study period. The medication of the participants was 75 % anti-hypertensive drugs (mainly renin-angiotensin system inhibitors and β-blockers), 94 % anti-thrombotic (mainly salospir) and 91 % hypolipidaemic (mainly statins), with non-significant differences between groups. In Group A (control group), participants consumed no alcohol; in Group B, participants consumed 200 ml of red wine (Cabernet Sauvignon 13·5 % v.v alcohol), and participants in Group C (ethanol group) consumed 69 ml of tsipouro with 38 % v.v alcohol. The ethanol that was consumed in the last two groups was equal at 27 g of ethanol per d, and alcoholic beverage was consumed along with the meal (lunch or dinner). Finally, fifty-seven participants completed the study, in particular twenty in Group A (two drop out), twenty-one in Group B (one drops out) and sixteen in Group C (three drop out). The intervention lasted 8 weeks, and biological samples (blood, urine) were collected at baseline (0 week), in the middle (4 week) and in the end (8 week) of each intervention, in order to study also the time effect of alcohol consumption on biomarkers. Information about smoking habits was recorded through a structured questionnaire. Participants’ habitual dietary intake, including alcoholic beverage intake, was assessed using a validated FFQ(Reference Bountziouka, Bathrellou and Giotopoulou33). Adherence to the Mediterranean diet, as an index of diet quality, was assessed using MedDietScore(Reference Panagiotakos, Pitsavos and Arvaniti34). Compliance to the study protocol, that is, keeping dietary habits as unchanged as possible, was assessed by 24-h telephone recalls. Physical activity was assessed with the use of a validated questionnaire (IPAQ short version) and was expressed in metabolic equivalents minutes per week (MET-min-week)(Reference Kavouras, Maraki and Kollia35).
Anthropometric measurements
Anthropometry was carried out on each visit. Weight was measured to the nearest 0·1 kg using a digital scale and height to the nearest 0·1 cm using a stadiometer with the head in horizontal Frankfurt plane. Both measurements were taken with the subject in light clothing and without shoes. BMI was then calculated as weight (kg) divided by height squared (m2). Waist circumference was measured to the nearest 0·1 cm between the superior iliac crest and the lower rib margin in the midaxillary line. Resting arterial blood pressure was measured three times in the right arm with the subject in a sitting position.
Haematological and biochemical measurements
Blood samples collection was held between 08.00 and 10.00, after 12 h fasting. Complete blood count was determined in EDTA anticoagulated whole blood with a Mindray BC-3000 haematology analyser (Mindray). Serum and plasma were isolated and frozen immediately at –80°C. Glucose levels, total cholesterol, TAG and HDL-cholesterol were measured by enzymatic colorimetric assay (COBAS® 8000 analyser, Roche), while the LDL-cholesterol concentrations were calculated using the Friedewald formula. Insulin levels were determined by the chemiluminescence method (E170 modular analyser, Roche). Levels of liver enzymes, namely, ALT, aspartate aminotransferase and gamma-glutamyl transferase (GGT), were measured by enzymatic colorimetric method (COBAS® 8000 analyser, Roche). High sensitive C-reactive protein (hsCRP) was measured by nephelometry method (BN II nebuliser, Siemens). Sandwich ELISA kits were used for measurement of soluble vascular cell adhesion molecule 1 (sVCAM-1) (Duoset ELISA, R&D Systems), adiponectin (ELISA, kit Quantikine, R&D Systems) and IL-6 (Quantikine HS ELISA, R&D Systems) in plasma of volunteers. The intra-assay CV was < 10% for sVCAM/sP-selectin, < 5% for adiponectin and < 7% for IL-6. The inter-assay CV was < 12% for sVCAM/sP-selectin, < 8% for adiponectin and < 9·8 % for IL-6. Levels of D-dimers were measured, in citrate plasma, by the INNOVANCE® D-dimer assay that is an automated, particle-enhanced, immunoturbidimetric assay for the quantitative determination of cross-linked fibrin degradation products (SYSMEX CS-100 analyser, Siemens). Levels of fibrinogen were measured in citrate plasma, according to the Clauss method, based on measuring the clotting time of diluted plasma after the addition of thrombin (SYSMEX CS-100 analyser, Siemens). The intra-assay and inter-assay CV was < 8% for D-dimers and < 3·5% for fibrinogen. Activity of plasminogen activator inhibitor-1 (PAI-1) and tissue plasminogen activator (tPA) were measured in citrate plasma using a Chromogenic Activity Kit (Assaypro LLC); the intra-assay and inter-assay CV was < 10%.
Ex vivo human platelet-rich plasma aggregation
Blood was centrifuged at 170 g for 15 min in order to collect the supernatant platelet-rich plasma. Platelet-poor plasma was obtained by recentrifugation of the pellet at a higher force. The platelet count of platelet-rich plasma was adjusted to 300·000/ml with platelet-poor plasma. Samples were incubated at 37°C, with a stirring rate of 1·000 rpm. Chronolog Aggregometer (Model 440VS) was used for determining aggregation responses based on light transmittance method against various concentrations of PAF, ADP and collagen. The maximum reversible or the least not reversible aggregation was estimated in order to evaluate the 100 % aggregation. The plot of percent aggregation (ranging from 20 to 80 %) v. different concentrations of agonist is linear. Based on this curve, the half-maximal effective concentration (EC50) value, meaning the concentration of agonist (PAF, ADP and collagen) that induces 50 % of maximum aggregation, was calculated.
Isolation of leukocytes from heparinised blood
Five millilitres of heparinised blood were obtained from each volunteer, and leukocytes were isolated as previously described(Reference Detopoulou, Nomikos and Fragopoulou36). Protein concentrations of all preparations were determined according to the Bradford method(Reference Bradford37) with the use of bovine serum albumin as a protein standard.
Assay of lyso-platelet-activating factor at activity in leukocyte homogenate
Isolated leukocyte homogenates, 15 μg of total protein, were incubated for 10 min at 37°C with 4 nmol of lyso-PAF and 40 nmol of acetyl-CoA. A final reaction volume of 200 μl was obtained by adding 50 mM Tris/HCl buffer (pH 7·4) containing 0·25 mg/ml of BSA and CaCl2 2·8 mM(Reference Fragopoulou, Argyrou and Detopoulou32). Cold chloroform: methanol (2 % acetic acid) was added for stopping the reaction. All assays were performed in duplicate.
Assay of platelet-activating factor-cholinephosphotransferase activity in leukocyte homogenate
15 μg of isolated leukocyte homogenate protein was incubated at 37°C for 5 min with 100 mM Tris–HCl (pH 8·0), 15 mM DTT, 0·5 mM EDTA, 20 mM MgCl2, 1 mg/ml of BSA, 100 μM of CDP-choline and 100 μM of 1-O-hexadecyl-2-acetyl-sn-glycerol in total reaction volume of 200 μl(Reference Detopoulou, Nomikos and Fragopoulou36). Cold chloroform: methanol (2 % acetic acid) was added to stop the reaction. All assays were performed in duplicate.
Extraction and quantification of platelet-activating factor produced by enzymatic assays
For the determination of PAF levels produced by enzyme assays, lipids were extracted by the acid Bligh–Dyer method(Reference Bligh and Dyer38), and PAF was determined with LC-MS. Extracted samples were inserted on Hypersil GOLD™ (5 μm, 150 × 4·6 mm; Thermo Scientific) for the analysis of assay product, namely, PAF. The mobile phase contained 98 % methanol LC-MS and 2 % 1 mM aqueous ammonium acetate, and the flow rate was 0·1 ml/min. MS analysis was performed using an Exactive™ Plus Orbitrap Mass Spectrometer (Thermo Scientific) with an electrospray ionisation source. Quantification was performed using the transition m/z 524·37 at a retention peak time of 10 min. A calibration curve, with a range of 1·6–24 pmol PAF, was routinely performed for every two batches, and a control PAF sample was included in each batch. Inter-day and intra-day precision was 15·9 and 11·8 %. Mass spectra were processed using the Xcalibur 4·0 (Thermo Scientific) software. The enzymatic activity was expressed as specific activity pmol PAF/mg/min.
Measurement of platelet-activating factor acetylhydrolase activity in leukocyte homogenate and lipoprotein-associated phospholipase A2 activity in serum
Determination of PAF-AH activity was done in 30 μg leukocyte homogenate protein based on the TCA precipitation method using [3H] PAF as a substrate(Reference Detopoulou, Nomikos and Fragopoulou36). Leukocyte homogenate was incubated with 4 nmol of [3H] PAF (20 Bq/nmol), 100 mM Tris/HCl buffer (pH 7·2) plus 1 mM ethylene glycol tetraacetic acid (EGTA) for 15 min at 37°C. The final reaction volume was 200 μl, and the reaction was stopped by adding cold TCA (10 % final concentration). Afterwards, samples were incubated in an ice bath for 30 min and then were centrifuged for 2 min. A liquid scintillation counter was used for the measurement of [3H]-acetate, which was released into the aqueous phase. All assays were performed in duplicate. The enzyme activity was expressed as specific activity pmol/mg/min.
Serum LpPLA2 activity was measured by a commercial kit using 2-thio PAF as a substrate (Cayman Chemical). The intra-assay CV was < 4%, and the inter-assay CV was < 10%. All assays were performed in duplicate. The enzyme activity was expressed as specific activity nmol/min/ml.
Statistical analysis
Normality was tested using the Kolmogorov–Smirnov criterion. Normally distributed continuous variables are presented as mean values (sd), while skewed variables as median and quartiles (25th–75th). For the comparisons at baseline values, a one-way ANOVA test for normally distributed variables or Kruskal Wallis test for skewed variables was used. Partial correlations among the variables adjusted for age and BMI were also made. For the evaluation of the effect of intervention in the inflammatory and thrombotic biomarkers, the results are expressed as % change of baseline levels to minimise inter-subject variability. Comparisons of the response curves of the three trials for normally distributed variables were performed using the repeated-measures ANOVA by testing for time effect (P time), trial effect (P trial) and time × trial interaction (P time*trial). Bonferroni correction was used for multiple comparisons. Furthermore, in skewed variables, comparison between groups at 4 and 8 weeks was carried out by the Kruskal–Wallis test in order to illuminate a potential trial effect and pairwise comparisons among the groups. Friedman’s two-way ANOVA by ranks were performed for testing time effect within each trial. A paired Wilcoxon test within each group in comparison with baseline values was also performed. Analyses were initially performed with the intention to treat the population, for which missing values were predicted using estimating-equation methods by fitting a statistical model to the observed data(Reference Little, D’Agostino and Cohen39). A secondary complete-case analysis was also performed in the per-protocol population SPSS statistical software package, version 18, was used for all statistical calculations. All reported P-values compared with a significance level of 5 %.
Results
A total number of fifty-seven participants completed the study, in particular twenty in Group A, twenty-one in Group B and sixteen in Group C, with ages ranging from 36 to 81 years. A per-protocol analysis of the results was performed for the fifty-seven participants who completed the study. However, intention to treat for the sixty-four participants that were initially allocated in the intervention groups was also performed and presented in the following tables. The per-protocol analysis revealed similar trends but with less pronounced effects. The trial flow chart of the study has already been previously published(Reference Choleva, Argyrou and Detopoulou31,Reference Fragopoulou, Argyrou and Detopoulou32) , and it is presented in online Supplementary Fig. 1. The 24-h recalls revealed a good compliance with the study protocol (data not shown).
Baseline characteristics of participants
No significant changes in volunteers’ dietary habits or physical activity were observed during the study (data not shown)(Reference Fragopoulou, Argyrou and Detopoulou32). The baseline levels of key biochemical and anthropometric characteristics of the participants have been previously published(Reference Karatzi, Papamichael and Aznaouridis27), with the most important variables presented in Supplementary Table 1. No significant differences were observed in age, BMI or basic biomarkers – including glucose, insulin, lipid profile, hepatic enzyme activity and uric acid – among the three intervention groups.
Table 1 presents the baseline values of inflammatory and thrombotic biomarkers. No significant differences were observed among the three intervention groups, except for the EC50 values of PAF, where a trend towards differentiation was noted (P= 0·07).
Baseline values (0 week) of inflammatory and thrombotic biomarkers of volunteers (Median values and 25th–75th quartiles; mean values and standard deviations)

hsCRP, high sensitive C-reactive protein; VCAM, vascular cell adhesion molecule-1; LysoPAF-AT, lyso-platelet-activating factor acetyltransferase; PAF-CPT, platelet-activating factor-cholinephosphotransferase; PAF-AH, platelet-activating factor acetylhydrolase; LpPLA2, lipoprotein-associated phospholipase A2; tPA, tissue plasminogen activator; PAI, plasminogen activator inhibitor; EC50, half-maximal effective concentration.
Data are presented as means (sd) for normally distributed variables or as median (25th–75th quartiles) for skewed variables. One-way ANOVA or Kruskal–Wallis tests were used for the comparisons, respectively.
To investigate potential associations between biomarkers in this specific population, partial correlations adjusted for age and BMI were conducted on inflammation and thrombosis markers at baseline, independent of the intervention groups.
Strong positive correlations were observed between C-reactive protein (CRP) and IL6 (r= 0·497, P< 0·000) and CRP and fibrinogen (r= 0·568, P< 0·000). Moderate positive correlations were observed between IL6 and fibrinogen (r= 0·300, P= 0·01) and fibrinogen and D-dimer (r= 0·330, P= 0·009). Additionally, LysoPAF-AT was moderately positively correlated with platelet-activating factor-cholinephosphotransferase (PAF-CPT) (r= 0·379, P= 0·003) and moderately negatively correlated with sVCAM (r= –0·271, P= 0·05). PAF-CPT was moderately positively correlated with tPA (r= 0·363, P= 0·004) and strongly negatively correlated with PAF-AH (r= –0·451, P< 0·00). LpPLA2 showed a moderate positive correlation with PAI-1 (r= 0·261, P= 0·04) and with sVCAM (r= 0·291, P= 0·02). As for platelet aggregation, PAF EC50 was moderately positively correlated with ADP EC50 values (r= 0·353, P= 0·005) and negatively with LpPLA2 (r= –0·379, P= 0·003).
Effect of intervention on inflammatory biomarkers
No significant changes were observed on the percentage change of hsCRP, IL6, adiponectin or sVCAM during the intervention (online Supplementary Table 2). The percentage changes in activities of PAF metabolism enzymes during the intervention are presented in Table 2.
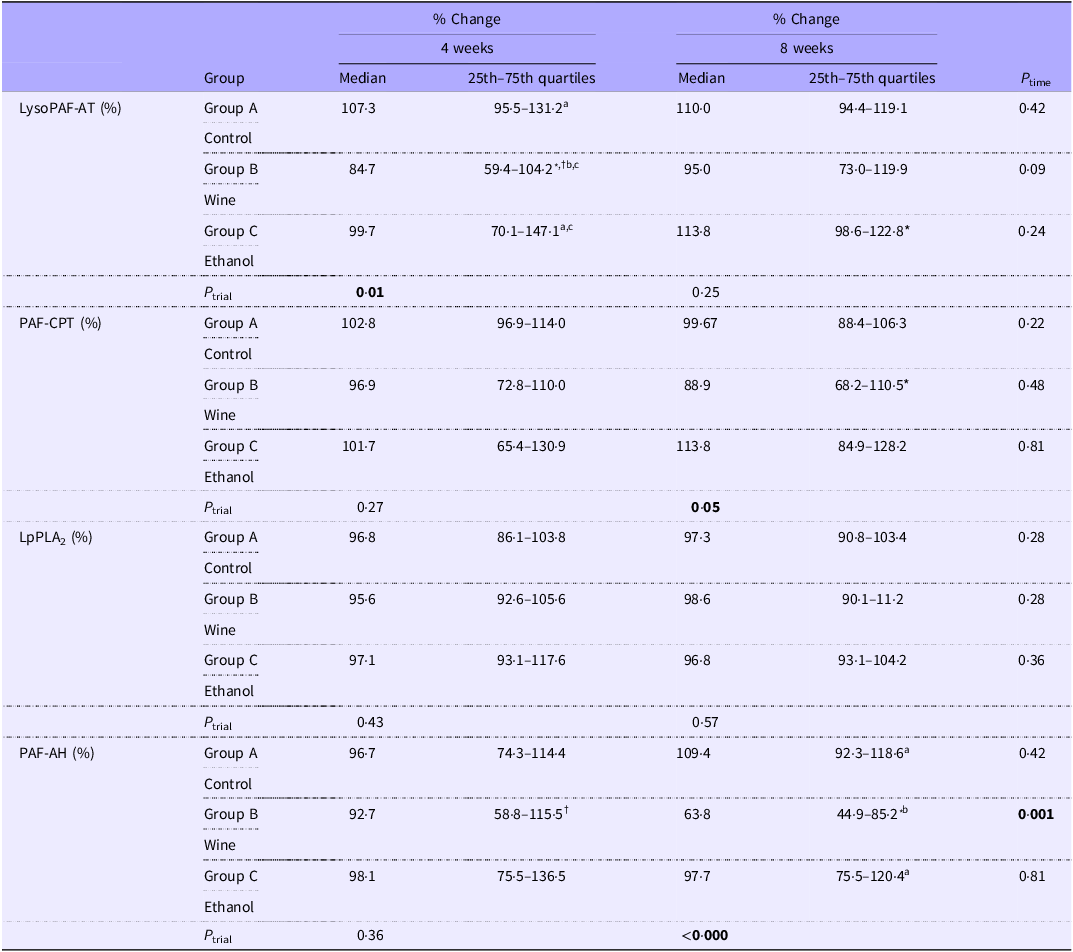
% Change of baseline values in platelet-activating factor metabolism enzymes specific activity (Median values and 25th–75th quartiles)

LysoPAF-AT, lyso-platelet-activating factor acetyltransferase; PAF-CPT, platelet-activating factor-cholinephosphotransferase; LpPLA2, lipoprotein-associated phospholipase A2; PAF-AH, platelet-activating factor acetylhydrolase.
Skewed variables data are presented as median (25th–75th quartiles). Friedman’s two-way ANOVA by ranks was used to estimate the time effect in each intervention group (P time). Time-related pairwise comparisons were performed using paired Wilcoxon signed-rank tests. * indicates significant difference compared with baseline, †compared with 8 weeks. Kruskal–Wallis test was used to compare the three different intervention groups (P trial). Different letters indicate statistical significance according to pairwise comparisons of the Kruskal–Wallis test after adjustments for multiple testing using the Bonferroni error correction. Boldface is used for statistical significant (P< 0·05).
Regarding the biosynthesis of PAF, a trend towards a time effect (P= 0·09) was observed in the activity of LysoPAF-AT in Group B (wine group), but no significant time effect was observed for the activity of PAF-CPT (P> 0·05). Paired analysis revealed that in Group B, the activity of LysoPAF-AT at 4 weeks was significantly lower, by 15·3 %, compared with baseline (P= 0·008) and by 10·3% compared with 8 weeks (P= 0·03). Additionally, the activity of PAF-CPT was lower, by 11·1 %, at 8 weeks in Group B compared with baseline levels (P= 0·04). In contrast, in Group C, the activity of LysoPAF-AT was significantly higher, by 13·8 %, at 8 weeks compared with baseline (P= 0·05). Between-group comparisons revealed a trial effect on the activity of LysoPAF-AT at 4 weeks (P= 0·01), specifically between Groups A and B (P= 0·01) and a trial effect on the activity of PAF-CPT at 8 weeks (P= 0·05), specifically between Groups B and C (P= 0·02).
Regarding PAF catabolism, no significant time or trial effects were observed in the activity of LpPLA2 in the serum of volunteers nor in the ratio of LpPLA2 activity to LDL-cholesterol levels, the primary carrier of the enzyme in blood. However, leukocyte PAF-AH activity showed a significant time effect in Group B (P= 0·001), with lower, by 36·2 %, enzyme activity at 8 weeks compared with baseline (P= 0·001). A significant trial effect was also observed at 8 weeks (P< 0·000), with lower PAF-AH activity in Group B compared with both Group A (P< 0·000) and Group C (P= 0·009).
Effect of intervention on thrombotic biomarkers
The values of thrombotic biomarkers in plasma, along with platelet responses to PAF, ADP and collagen in platelet-rich plasma, are presented in Table 3. tPA activity showed a time effect in Group B (P= 0·03), with lower tPA activity at 8 weeks compared with baseline (P= 0·04). A trial effect was also observed at 8 weeks (P= 0·01), with lower tPA activity in Group B compared with Group A (P= 0·01). In contrast, no time or trial effects were observed for PAI-1 activity or for the percentage change in the ratio of tPA activity to PAI-1 activity. A time effect was observed in Group B for fibrinogen (P= 0·003), with lower levels at both 4 weeks (P= 0·04) and 8 weeks (P= 0·01) compared with baseline. D-dimer showed both a time and trial effect, with Group C exhibiting higher levels at 8 weeks compared with baseline (P= 0·005) and compared with Group B (P= 0·01).
% Change of baseline values in of thrombotic biomarkers during intervention (Median values and 25th–75th quartiles)

tPA, tissue plasminogen activator; PAI, plasminogen activator inhibitor; EC50 PAF, half-maximal effective concentration.
For skewed variables, data are presented as median (25th–75th quartiles). Friedman’s 2-way ANOVA by ranks was used to estimate the time effect in each intervention group (P time). Time-related pairwise comparisons were performed using paired Wilcoxon signed-rank tests. * indicates significant difference compared with baseline, †compared with 8 weeks. Kruskal–Wallis test was used to compare the three different intervention groups (P trial). Different letters indicate statistical significance according to pairwise comparisons of the Kruskal–Wallis test after adjustments for multiple testing using the Bonferroni error correction. Boldface is used for statistical significant (P< 0·05).
Platelet aggregation was primarily assessed in response to PAF but also to ADP and collagen. No significant time or trial effects were observed for platelet response to ADP. However, a significant time and trial effect was observed in response to PAF in both Groups B and C (Table 3). Regarding PAF EC50, higher values were observed at 4 weeks (P= 0·02) and 8 weeks (P= 0·005) in Group B and at 8 weeks (P= 0·005) in Group C, compared with baseline. Additionally, Group B (P= 0·005) and Group C (P= 0·007) showed higher PAF EC50 values at 8 weeks compared with Group A.
Collagen EC50 values showed a trend for a time effect in Group B (P= 0·08), a significant change over time in Group C (P= 0·001) and a significant trial effect at 4 weeks (P= 0·03). Group C had higher collagen EC50 values at both 4 weeks (P= 0·006) and 8 weeks (P= 0·004) compared with baseline. Additionally, Group B exhibited higher collagen EC50 values at 8 weeks compared with Group A (P= 0·04).
Correlations among the percentage change of biomarkers during the intervention
To investigate potential interactions among the changes in biomarkers during the intervention, correlations were calculated after adjusting for BMI and age.
In the wine group (Group B), at 4 weeks, the percentage change in EC50 values against PAF was positively correlated with adiponectin levels (r= 0·472, P= 0·03). The percentage change in EC50 values against ADP was strongly negatively correlated with PAF-AT activity (r= −0·710, P< 0·000), and the percentage change in EC50 values against collagen was negatively correlated with D-dimer (r= −0·489, P= 0·02) and positively correlated with PAF-AH activity (r= 0·438, P= 0·05). At 4 weeks, the percentage change (reduction) in LysoPAF-AT activity was strongly correlated with the percentage change (reduction) in PAF-CPT activity (r= 0·672, P= 0·01), while a trend was observed at 8 weeks (r= 0·444, P= 0·07). Additionally, the percentage change in PAF-AH activity was strongly positively correlated with the percentage change in LpPLA2 activity in the wine group (r= 0·448, P= 0·02). Also, strong correlations were observed at 8 weeks between the percentage change in fibrinogen levels and the percentage change in hsCRP (r= 0·514, P= 0·02), as well as adiponectin levels (r= –0·455, P= 0·04). A correlation was found between the percentage change in EC50 values against collagen and both D-dimer (r= –0·439, P= 0·05) and hsCRP (r= 0·451, P= 0·04).
In the tsipouro group (Group C), a strong negative correlation was observed between the percentage change in EC50 values against PAF and PAF-AH activity (r= –0·540, P= 0·02). The percentage change in EC50 values against ADP and collagen was positively correlated with D-dimer levels (r= 0·742, P= 0·001) and negatively correlated with collagen levels (r= –0·577, P= 0·01), respectively.
Discussion
Although some recommendations advocate for zero alcohol consumption(Reference Anderson, Berdzuli and Ilbawi40), there is also evidence suggesting that moderate wine consumption is associated with a lower risk of CVD(Reference Minzer, Estruch and Casas41,Reference Boban, Stockley and Teissedre42) . The benefits of wine, compared with other alcoholic beverages, are thought to be linked to its micro-constituents, which have potent anti-inflammatory and anti-thrombotic effects(Reference Fragopoulou, Demopoulos and Antonopoulou7). In this study, regular light to moderate wine consumption in male CVD patients led to improvements in the activity of enzymes involved in PAF metabolism and platelet aggregation, compared with both the control group (which abstained from alcohol) and the group that consumed an alcoholic beverage lacking the beneficial micro-constituents of wine.
Inflammation and thrombosis, in addition to oxidative stress, are key pathological mechanisms involved in many diseases, including CVD. PAF is a potent lipid mediator of both inflammation and thrombosis, playing a critical role in the initiation and progression of atherosclerosis(Reference Demopoulos, Karantonis and Antonopoulou9,Reference Ninio43) , the primary pathological mechanism underlying CVD. Among its various actions, PAF promotes the migration of monocytes into the endothelial space, secretion of cytokines and platelet activation and aggregation. Its levels are largely determined by the balance between its biosynthesis and degradation, as well as by the organism’s oxidative status, as PAF is also produced in an uncontrolled manner during LDL-cholesterol oxidation(Reference Liapikos, Antonopoulou and Karabina44). Wine contains micro-constituents that have been shown to exert potent anti-inflammatory and anti-thrombotic effects in vitro (Reference Fragopoulou and Antonopoulou6). In this context, extracts from both red and white wines, as well as individual phenolic compounds, have been found to inhibit platelet aggregation induced by PAF and modulate its metabolism by affecting the activity of its biosynthetic enzymes, namely, LysoPAF-AT and PAF-CPT(Reference Fragopoulou, Demopoulos and Antonopoulou7,Reference Xanthopoulou, Asimakopoulos and Antonopoulou18,Reference Vlachogianni, Fragopoulou and Stamatakis19) . Flavonoids, in particular, have been shown to inhibit LysoPAF-AT activity in various cell types, including endothelial cells and mastocytoma cell lines, with the degree of inhibition appearing to depend on the specific structure of the flavonoid(Reference Yanoshita, Chang and Son45,Reference Balestrieri, Castaldo and Balestrieri46) . These findings support the idea that wine micro-constituents are potent modulators of PAF metabolism and its biological actions.
In the present study, the consumption of red wine (Cabernet Sauvignon) resulted in a reduction in the activity of LysoPAF-AT at 4 weeks compared with baseline and a reduction in PAF-CPT activity at 8 weeks compared with ethanol group (tsipouro) in the leukocytes of volunteers. Notably, the ethanol group showed an increase in LysoPAF-AT activity at 8 weeks compared with baseline. These findings align with a previous study, which reported that the consumption of red wine (Cabernet Sauvignon) and white wine (Robola), when consumed with a meal, reduced the activity of these biosynthetic enzymes in young healthy men compared with a control meal and pure ethanol(Reference Argyrou, Vlachogianni and Stamatakis30). In that study, ethanol consumption with the meal led to higher enzyme activity compared with the control meal. However, the two studies differ in design, with the present study collecting blood after overnight fasting in the long-term design. It appears that wine consumption has a more pronounced effect in the postprandial state than with long-term consumption. This suggests that the short half-life (1–3 h) of phenolic compounds in plasma may limit their effects or that a longer duration of consumption is required to observe more significant changes in PAF metabolism. In general, wine consumption seems to first affect the remodelling pathway, followed by the de novo pathway, as supported by the observed positive correlation between changes in enzyme activity.
Regarding PAF-acetylhydrolase activity, only the cellular isoform was affected. At 8 weeks, its activity was significantly lower in the wine group compared with baseline levels and compared with both the control and tsipouro groups. It is possible that the reduction in PAF-CPT activity at 8 weeks led to decreased PAF levels, thereby diminishing the need for PAF-AH action. Although LpPLA2 activity did not show a significant change during the intervention, its percentage change was positively correlated with the percentage change in PAF-AH activity, independent of age and BMI. This suggests a regulatory link between the two enzymes. Previous studies have reported a correlation between PAF-AH and LpPLA2 activity in apparently healthy individuals(Reference Detopoulou, Fragopoulou and Nomikos47).
The effects observed in the wine group (Group B) on PAF metabolism enzymes were not seen in the tsipouro group (Group C), indicating that the changes were likely attributed to the micro-constituents of wine rather than to ethanol alone. However, it is important to note that due to the study design, it is not possible to specifically attribute the observed effects to any particular bioactive compound.
As far as thrombosis biomarkers are concerned, wine consumption reduced fibrinogen levels and lowered tPA activity compared with baseline levels at 8 weeks, with the latter (tPA) also being lower in comparison with the ethanol group. The percentage change in fibrinogen levels in the wine group was positively correlated with the percentage change in hsCRP levels and negatively correlated with the percentage change in adiponectin levels, indicating a possible interplay among these biomarkers. These findings align with previous studies, which have proposed that increased levels of CRP and fibrinogen, along with reduced levels of adiponectin, could predict diabetic complications(Reference Swellam, Sayed Mahmoud and Abdel-Fatah Ali48). In addition, the ethanol group (Group C) reduced D-dimer levels at 8 weeks compared with baseline and the other groups. Platelet aggregation was affected both in the wine and ethanol group (Groups B and C, respectively). The inhibitory effect on platelet aggregation seems to be agonist depended, as both wine and ethanol consumption (tsipouro) reduced platelet response against PAF and collagen, but not to ADP. It is also important to note that the majority of volunteers (94 %) were on anti-thrombotic medication, mainly salospir, yet an effect on platelet aggregation was still observed. These results indicate the potential of both ethanol and wine micro-constituents to affect platelet aggregation, and they are in agreement with previously published studies, although most of them compared the consumption of wine with abstention(Reference Fragopoulou, Choleva and Antonopoulou23). The effect of ethanol and wine micro-constituent in platelet aggregation may be mediated through different pathways. In the wine group, the presented change in platelet aggregation was correlated with adiponectin, LysoPAF-AT, hsCRP, IL6 and D-dimer, while in the tsipouro group, it was mainly correlated with D-dimer. Adiponectin is reported to have an anti-platelet action, although the mechanisms underlying its actions remain elusive, with oxidative stress being a proposed factor(Reference Wang, Zhang and Gao49). Concerning PAF as an agonist for platelet aggregation, no other long-term data are available to directly compare with our results. However, in the postprandial state, it was reported that wine consumption along with a meal in healthy men reduced PAF-induced platelet aggregation compared with both control meal and ethanol consumption with the meal(Reference Xanthopoulou, Kalathara and Melachroinou50).
Platelet function inhibition is believed to be beneficial in limiting thrombus formation after the rupture of an intracoronary plaque, potentially reducing both mortality and morbidity in individuals with coronary artery disease. However, this inhibition can also raise the risk of bleeding. Striking the right balance between the therapeutic benefits and potential side effects is essential when considering the use of anti-platelet medications in patients with stable coronary artery disease(Reference Knight51). Modulating platelet aggregation through dietary changes could present an effective approach to lowering the required dosage of medications, thereby reducing the risk of adverse effects. Furthermore, considering the interaction between inflammation and thrombosis, targeting the reduction of inflammatory mediators by modulating enzymes involved in PAF metabolism could offer a more effective and beneficial approach to managing thrombosis in these patients.
The limitations of the study include the moderate sample size, as well as the fact that only male participants were included; thus, findings cannot be translated to women. The compliance of the participants to the study protocol was estimated by self-reported methods and not by measuring metabolites in biological samples. However, this study has strengths to present as well, such as the inclusion of the tsipouro group, where the volunteers consumed an alcoholic beverage without bioactive wine micro-constituents in order to distinguish the biological effects of wine micro-constituents from those of the alcohol. Similarly, the selection of unhealthy CHD patients is a strength since the majority of the studies regarding wine consumption have been conducted in healthy volunteers. Finally, the light transmission aggregometry that was used for the measurement of platelet aggregation, along with the calculation of EC50 values against agonist instead of using only one concentration, is considered the gold standard method.
In conclusion, even though alcohol consumption can be harmful and should be part of a balanced, healthy dietary pattern, regular moderate wine consumption seems to have benefits on PAF metabolism enzymes activity regardless of ethanol content and to reduce platelet aggregation probably through different mechanisms compared with ethanol. Although these findings need to be replicated in other population groups and to be confirmed with other inflammatory markers, they provide preliminary evidence on the potential inclusion of light to moderate wine consumption in dietary interventions for men with heart disease.
Supplementary material
For supplementary material/s referred to in this article, please visit https://doi.org/10.1017/S0007114525000273.
Acknowledgements
We are grateful to the participants in this study. Also, we would like to thank Antigoni Tsiafitsa for her technical assistance in blood samples. The wines used in the study were kindly offered by Domaine Hatzimichalis.
The study was partly supported through research funding from the Graduate Programme of the Department of Nutrition and Dietetics, Harokopio University, and Hellenic Atherosclerosis Society.
E. F. was responsible for the conceptualisation, methodology and supervision of the study, as well as data curation and writing of the manuscript. C. A. was involved in the methodology of the study, data curation and the platelet-rich plasma analysis, measurement of PAF-AH and other biochemical markers. M. D. was involved in the methodology of the study and data curation. E. M. and C. P. measured biosynthetic PAF enzymes’ activity. S. A. critically revised the manuscript. G. K. and P. K. were involved in participants’ recruitment. All authors have read and agreed to the published version of the manuscript.
The authors declare no conflict of interest.