


- GSEA
gene set enrichment analysis
- IGF
insulin-like growth factor
- MetS
metabolic syndrome
- OXPHOS
oxidative phosphorylation
- PGC-1α
PPARγ coactivator 1α
- T2DM
type 2 diabetes mellitus
- WAT
white adipose tissue
The metabolic syndrome
The metabolic syndrome (MetS) is a very common condition that often precedes type 2 diabetes mellitus (T2DM) and is associated with a greater risk of CVD(Reference Isomaa, Almgren, Tuomi, Forsen, Lahti, Nissen, Taskinen and Groop1). It is characterised by abdominal obesity, insulin resistance, dyslipidaemia, hypertension and a chronic sub-acute pro-inflammatory state that impedes insulin signalling(Reference Ghanim, Aljada, Hofmeyer, Syed, Mohanty and Dandona2, Reference Roche3). The present paper will explore examples in which transcriptomic approaches facilitate the understanding of the dysregulated nutrient-sensitive transcription factor-mediated metabolic and molecular perturbations that underlie insulin resistance within the context of the MetS. Particular emphasis will be placed on adipose tissue transcriptomic profiles, which have revealed the complex cellular re-arrangements that occur during the development of obesity. It is evident that other cellular processes, in particular those associated with the immune system and oxidative stress, may play a key role in the development of obesity-induced insulin resistance(Reference Nguyen, Favelyukis, Nguyen, Reichart, Scott, Jenn, Liu-Bryan, Glass, Neels and Olefsky4, Reference Ozcan, Cao, Yilmaz, Lee, Iwakoshi, Ozdelen, Tuncman, Görgün, Glimcher and Hotamisligil5). There is evidence to suggest that manipulating the inflammatory and/or oxidative stress components of adipose tissue biology may represent an alternative strategy in terms of reducing the metabolic risk factors associated with obesity(Reference Moloney, Toomey, Noone, Nugent, Allan, Loscher and Roche6). The challenge will be to validate this hypothesis in man.
Metabolic health is a complex state, requiring complex approaches
Metabolic health is a complex and sensitive physiological state, maintained through integration of diverse biological processes in multiple-organ systems. This complexity is mirrored in the pathophysiology of the MetS, which is clinically defined as a cluster of symptoms including abdominal obesity, insulin resistance, dyslipidaemia, hypertension and a chronic sub-acute pro-inflammatory state(Reference Ghanim, Aljada, Hofmeyer, Syed, Mohanty and Dandona2, Reference Roche3). A number of biomarkers have been identified using single-transcript and single-protein approaches, such as RT–PCR and enzyme immunoassay to characterise metabolic health in terms of glucose homeostasis, insulin resistance, oxidative stress and inflammation(Reference Egerod, Nielsen, Iversen, Thorup, Storgaard and Oleksiewicz7–Reference Van Guilder, Hoetzer, Greiner, Stauffer and Desouza9). While these biomarkers are valuable for clinical diagnosis of MetS, they provide little insight into the mechanisms of dysregulation that underlie deterioration of metabolic health. In fact, it can be reasoned that alterations in the level of a single analyte could not be sufficient to explain the aetiology and pathogenesis of a multi-factorial disorder. Transcriptomic analysis carries the unique advantage of providing a comprehensive system-wide view of gene-expression patterns in states of health and disease. This panoramic approach has the potential to comprehensively assess multi-dimensional aspects of health.
Transcriptomics: definition
From a technical standpoint, microarrays have provided a mechanism to circumvent the limitations of single-transcript analyses by allowing researchers to simultaneously analyse the relative concentrations of thousands of mRNA transcripts. Since the initial description of microarrays(Reference Schena, Shalon, Davis and Brown10), the uptake of the technology within the biological sciences has been astounding. This initial description was followed 2 years later by a report on the use of the technology for the discovery of genes related to inflammatory disease(Reference Heller, Schena, Chai, Shalon, Bedilion, Gilmore, Woolley and Davis11). In the 10 years since the latter publication there have been >24 000 articles indexed in PubMed that contain the term ‘microarray’. This number of citations is even more surprising when the cost of microarrays is considered relative to cheaper single-molecule analysis such as Northern blotting and RT–PCR. However, in contrast to such technologies, microarrays allow the beneficiary to analyse genes that are not only known to be involved in a disease, but also those for which no function is known or for which no involvement in the disease has previously been described. This facility allows the user to escape the trap of literature bias and concentrate their efforts on novel markers and players in a disease of interest.
Microarrays: a few technical issues that need to be appreciated
Performance of a typical microarray experiment requires the isolation of sufficient quantities of highly-pure and high-quality RNA to avoid any bias or failure of chip hybridisation. Modern approaches to RNA extraction have enabled researchers to extract, quantify and run quality control on RNA from a biological sample within the course of 1 d. Where sufficient volumes of high-quality mRNA are purified these RNA samples may be used to create cDNA for amplification using PCR. The PCR-amplified cDNA is then fluorescently labelled and used for microarray hybridisation.
Two types of microarray are in common use today; oligonucleotide microarrays and cDNA arrays. As oligonucleotide microarrays are the most common and used by consortiums such as the European Nutrigenomics Organisation: linking genomics, nutrition and health research (an EC-funded project known as NuGO) the discussion will be confined to arrays of this type. Additionally, a number of excellent reviews are available that describe both types of array in detail(Reference Do and Choi12–Reference Sievertzon, Nilsson and Lundeberg14). Oligonucleotide arrays rely on the hybridisation of short 15 bp regions of DNA from the 5′ region of the transcript to a complementary 15 bp ‘probe’ randomly distributed across the chip. For each transcript being analysed a set of approximately ten such probes is located across the chip. Furthermore, for each probe in the probe-set a corresponding ‘mis-match’ probe is also found on the chip. The mis-match probes have a single-base mis-match compared with the perfect-match probe and are used to assess the level of background binding to the chip. After the cDNA strands have bound to the chip, the level of fluorescence at each probe location is measured in a purpose-designed scanner. Following scanning, the data produced should be ready for analysis.
Analysis of the spot intensities for a particular chip is a complicated process and requires the evaluation of the intensities of all probes in a probe-set as compared with the background staining level. At the most basic level, this evaluation is performed by subtracting the mis-match intensities from the perfect-match intensities for each probe in the probe set (i.e. probe signal – probe background) and obtaining the mean intensity based on the corrected values. In this way each transcript can be given a value that approximately corresponds with its abundance within the sample. However, researchers must also account for differences in staining and hybridisation across microarray chips and mis-match binding levels that can exceed perfect-match binding levels. For this reason more-mathematically-advanced approaches to microarray analysis have been developed with algorithms such as robust multiarray average and GC-corrected robust multiarray average achieving widespread use and acceptance as methods suitable for the detection of biologically-relevant transcript level changes(Reference Allison, Cui, Page and Sabripour15, Reference Irizarry, Hobbs, Collin, Beazer-Barclay, Antonellis, Scherf and Speed16). By applying such methods to the analysis of microarray data, it is possible to discover which transcripts (if any) are differentially expressed at a significant level between two conditions. At this stage it is common to validate the gene-list, i.e. quantitative RT–PCR assays are conducted for a select number of genes to examine whether the results of the two different methodologies agree(Reference Dallas, Gottardo, Firth, Beesley, Hoffmann, Terry, Freitas, Boag, Cummings and Kees17).
Microarrays to uncover novel patterns of metabolic dysregulation
Using transcriptomics for de novo gene and pathway investigation has contributed substantially to the understanding of metabolic health. While some expression profiling studies are directed toward elucidating the global effects of a particular nutrient or drug intervention or genetic knock-out, others seek to broadly characterise aberrant patterns of gene expression in individuals with compromised metabolic health. Table 1 presents a comprehensive overview of studies that have employed transcriptomic analysis in human subjects for wide-range characterisation of gene-expression changes associated with metabolic dysregulation and/or nutrient intervention. An early example of this approach is seen in a comparison of gene-expression profiles of muscle tissue in healthy subjects and individuals with T2DM, matched for age and BMI(Reference Sreekumar, Halvatsiotis, Schimke and Nair18). In this study eighty-five genes were identified as differentially expressed between the groups; many of which had not previously been associated with the pathology of insulin resistance in muscle tissue, including myosin heavy-chain isoform-I, NADH dehydrogenase, heat-shock protein 70 kDa and superoxide dismutase 2. Functional analysis of these genes has revealed dysregulation of a variety of biological processes, including mitochondrial maintenance, insulin signalling and energy metabolism. This same process-driven approach has been used to define unique transcriptomic signatures associated with obesity, insulin resistance and T2DM, in a variety of tissues including adipose, liver and skeletal muscle (as summarised in Table 1). Also, the effect of a number of nutrient interventions on transcriptomic profiles, including n-3 PUFA supplementation, MUFA interventions and manipulation of dietary carbohydrate glycaemic index.
Transcriptomic signatures associated with obesity, insulin resistance and type 2 diabetes mellitus (T2DM) that provide insight in relation to characterising metabolic health

CHO, carbohydrate; GI, glycaemic index.
Before publication of microarray results such as those in Table 1, many journals require that the raw data are prepared in a standard format and made available on the internet, to allow reviewers and other interested parties to examine the data. Typically, this process requires the formatting of results in a standard format such as ‘minimal information about a microarray experiment’ and the uploading of the data to a web server such as the Gene Expression Omnibus (National Center for Biotechnology Information, Bethesda, MD, USA). The availability of data via services such as the Gene Expression Omnibus allows further research to be performed on data sets and simultaneous analysis of multiple datasets from different sources and studies in meta-analyses. A previous study that has identified transcriptional events common to over forty sets of microarray data highlights the utility of publically-available microarray data(Reference Rhodes, Yu, Shanker, Deshpande, Varambally, Ghosh, Barrette, Pandey and Chinnaiyan19). The growing availability of microarray data on nutrigenomics studies increases the probability that such an approach will prove useful for the study of nutrition.
Bioinformatic tools for the exploratory analysis of gene-lists
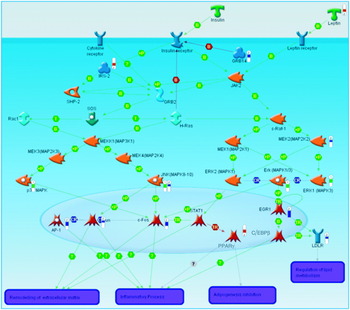
Generation of a list of differentially-expressed transcripts (known as a ‘gene-list’) is normally one of the first-round approaches to examining transcriptomic data. However, it can be insufficient to further clarify the biological basis of a disease. Also, in many cases alterations in gene-expression profiles are modest. For example, it has been difficult to find consistent changes in gene-expression profiles associated with diabetes in man(Reference Mootha, Lindgren and Eriksson20, Reference Patti, Butte and Crunkhorn21). In order to gain insights into the events underlying the disease phenotype it is also necessary to represent those genes from the list in the context of well-characterised biological processes such as signalling or metabolic pathways. There are already a number of tools in routine use, which allow the visualisation of gene-list data in the context of biological pathways. Pathway databases such as the Kyoto Encyclopaedia of Genes and Genomes (a bioinformatics resource being developed as part of the research projects of the Kanehisa Laboratories in the Bioinformatics Center of Kyoto University, Kyoto, Japan and the Human Genome Center of the University of Tokyo, Tokyo, Japan) can effectively be mined for entries that are statistically over-represented in a gene-list using a variety of both commercial and community-supported software. In concert with the growing availability of data from biological studies, bioinformatics software has grown to incorporate an increasingly broad range of data. Using Metacore (GeneGO, St Joseph, MI, USA) to analyse data from an IL-1 type I receptor-knockout mouse model that has been shown to be more resistant to insulin resistance (S Toomey, J Browne, M Claessens, E Oliver, C Loscher, KHG Mills and HM Roche, unpublished results), it has been possible to integrate the results of transcriptomics assays with Western blot experiments. This process has allowed the visualisation of both mRNA expression and protein phosphorylation in the context of insulin signalling (Fig. 1). In a similar approach to pathway analysis gene ontology classifications are routinely examined for a list of differentially-expressed transcripts to ascertain which functions are most over-represented among those genes of the gene-list. In many cases a variety of biological databases are used to annotate a gene-list, in order to identify changes in enzymic activity as well as transcription regulation and cell signalling(Reference Henegar, Tordjman and Achard22). Of course, the over-representation of transcripts associated with a particular process is not sufficient to illuminate the underlying biology of the disease; these exploratory analyses must also be followed up by laboratory validation. Thus, it must be possible to predict a function of a study model that can be tested in an alternative system in order to prove the effect is biologically reproducible. The benefits of using a separate study system for validation are twofold: first, the relative abundance of mRNA transcripts within a sample may not result in a direct alteration of protein level; second, by using a different study system it is possible to prove the universality of the proposed biological effect(Reference Chuaqui, Bonner and Best23).
A pathway diagram generated using Metacore (GeneGO, St Joseph, MI, USA). The red ‘thermometers’ indicate an increase in gene expression, the blue ‘thermometers’ indicate a decrease in gene expression and the green ‘thermometers’ indicate a recorded decrease in protein phosphorylation as measured by Western blot. T, transformation; B, binding; TR, transport; CR, class relation; +P, phosphorylation; MAP, mitogen-activated protein; MAPK, MAP kinase; MEK, MAPK kinase; MEKK, MEK kinase; SHP-2, SH2 domain-containing tyrosine phosphatase 2; AP-1, activator protein 1; STAT, signal transducers and activators of transcription; IRS2, insulin receptor substrate 2; C/EPBbeta, CCAAT-enhancer-binding protein β; LDLR, LDL receptor; GRB, epidermal growth factor receptor-binding protein; JAK2, janus kinase 2; EGR1, early growth response factor 1.
The gene set enrichment analysis (GSEA) approach was introduced by a group determining the differential gene-expression patterns in skeletal muscle biopsies of subjects with diabetes(Reference Mootha, Lindgren and Eriksson20), in which ‘gene sets’ based on biological function, chromosomal location or co-regulated genes were analysed. This approach was developed because traditional analytical approaches have shown no differentially-expressed gene between subjects with diabetes and control subjects despite very different phenotypic characterisation. The GSEA approach has identified gene sets, related to oxidative phosphorylation (OXPHOS) and mitochondrial function, whose expression is related to insulin resistance and aerobic capacity. Although the reduction in expression of the OXPHOS gene set is subtle (−20%) in the subjects with diabetes, the decrease is consistent across 89% of the gene set. Further analysis was carried out to determine whether differential gene-set expression precedes the onset of diabetes or is secondary to the metabolic phenotype. The comparative analysis of subjects with impaired glucose tolerance and subjects who are normo-glycaemic has shown that down-regulation of OXPHOS-co-regulated genes precedes the onset of insulin resistance. In particular, GSEA has allowed identification of PPARγ coactivator 1α (PGC-1α), the gene set that coordinately regulates oxidative phosphorylation, which may account for the reduction in OXPHOS gene-set alterations. Methods such as GSEA are complementary to single-gene approaches, providing a framework to examine transcriptional regulation at a higher level of metabolic organisation.
The findings with PGC-1α have subsequently been reproduced in another study, which has evaluated gene-expression patterns in Mexican-American subjects with diabetes who are prone to T2DM(Reference Patti, Butte and Crunkhorn21). Interestingly, PGC-1α and mitochondrial respiratory-gene expression are lower in both subjects with diabetes and subjects without diabetes with a family history of T2DM. This finding raises the possibility that reduced PGC-1α might be a marker of a pre-diabetic condition. In terms of the mechanistic role of PGC-1α in the pathogenesis of T2DM, it is proposed that impaired mitochondrial function contributes to dysregulated glucose and lipid metabolism, which leads to reduced fatty acid oxidation and resultant intracellular lipid accumulation, in turn adversely affecting insulin sensitivity(Reference Crunkhorn, Dearie, Mantzoros, Gami, da Silva, Espinoza, Faucette, Barry, Bianco and Patti24).
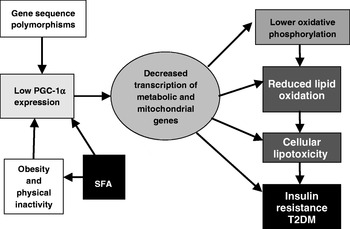
The central role of a PGC-1α-related transcriptomic signature within the context of insulin resistance and T2DM is illustrated in Fig. 2. A number of genetic polymorphisms in PGC-1α have been associated with increased risk of T2DM(Reference Phillips, Lopez-Miranda, Perez-Jimenez, McManus and Roche25). Environmental factors can also modulate PGC-1α status; physical activity and energy restriction in obese subjects increase PGC-1α expression(Reference Zong, Ren, Young, Pypaert, Mu, Birnbaum and Shulman26, Reference Larrouy, Vidal, Andreelli, Laville and Langin27). In contrast, a high-fat diet reduces mitochondrial gene expression in healthy human subjects after only 3 d(Reference Sparks, Xie, Koza, Mynatt, Hulver, Bray and Smith28). Interestingly, a recent paper designed to investigate the mediators of obesity-linked reductions in PGC-1α has demonstrated that SFA composition but neither high glucose nor excess amino acid concentrations affect PGC-1α εexpression. Long-chain SFA, but not MUFA or long-chain n-3 PUFA decrease PGC-1α and mitochondrial gene expression, and O2 consumption, in a p38 mitogen-activated protein kinase-dependent fashion(Reference Crunkhorn, Dearie, Mantzoros, Gami, da Silva, Espinoza, Faucette, Barry, Bianco and Patti24). Thus, transcriptomic signatures characteristic of PGC-1α and mitochondrial function have been fruitful in terms of extending the understanding of how SFA exposure, particularly coupled with obesity and physical inactivity, may aggravate metabolic inflexibility, insulin resistance and T2DM.
Central role of PPARγ coactivator 1α (PGC-1α)-related transcriptomic signature within the context of insulin resistance and type 2 diabetes mellitus (T2DM). (Adapted from Patti et al. (Reference Patti, Butte and Crunkhorn21).)
Key functional features of metabolic syndrome: inflammation and oxidative stress
A number of studies exist in which novel mechanisms underlying the development of insulin resistance and the MetS have been uncovered using transcriptomic profiling. As a result of the strong link between obesity and the development of T2DM and atherosclerosis, adipose tissue is a key target for such studies. States of obesity-related metabolic stress are characterised by reduced insulin sensitivity and glucose uptake (hyperglycaemia) in adipose tissue, as well as increased production of pro-inflammatory cytokines by adipocytes resulting in macrophage infiltration(Reference Weisberg, McCann, Desai, Rosenbaum, Leibel and Ferrante29). Markers of inflammatory response, such as C-reactive protein and TNFα, indicate that inflammation is a key functional link between obesity and T2DM(Reference Hotamisligil, Arner, Caro, Atkinson and Spiegelman30, Reference Pradhan, Manson, Rifai, Buring and Ridker31). However, mechanisms promoting the initial altered cellular phenotype of adipose tissue and dysregulation of adipocytes remain unclear. Recently, microarray-based functional genomic profiling has been combined with gene co-expression network analysis to provide an integrated analytical approach(Reference Henegar, Tordjman and Achard22). This study has shown very consistent alterations in transcriptomic patterns that reflect the interaction between excess extracellular matrix components and the inflammatory response to impair insulin signalling in white adipose tissue (WAT) of obese individuals. It was shown that an increase in macrophage-specific gene expression is directly responsible for this pathological tissue-level re-modelling. Interestingly, these co-expression networks remain true following weight loss, which reverses the functional genomic profile of the obese WAT, attenuating components of the extracellular matrix components and inflammatory network but dramatically increasing the metabolic processes that are otherwise down-regulated in the obese WAT. Furthermore, the transcriptional network analysis was validated using a complimentary in vitro study, in which it was found that human pre-adipocytes cultured in the presence of activated macrophage conditioned media demonstrate consistent marked up-regulation of the inflammatory and extracellular matrix component transcriptional networks. For example, among the extracellular matrix component-related genes showing significant differential expression in the obese WAT compared with lean controls 71·4% of extracellular matrix component-related genes also show significant expression changes in the pre-adipocytes exposed to the activated macrophage conditioned media. This work presents an important step in defining mechanistic links between multiple biological processes that are characteristic of the MetS.
Oxidative stress is one such process that appears to be closely related to this pro-inflammatory state. Defined as an imbalance between oxidants (i.e. reactive oxygen species and free radicals) and antioxidants, oxidative stress is considered to be an important functional feature of the MetS. Studies of serum and plasma markers in lean and obese subjects with and without diabetes have shown that production of reactive oxygen species and pro-inflammatory cytokines are highly correlated, and closely linked with blood glucose level(Reference Stentz, Umpierrez, Cuervo and Kitabchi32). More recently, gene-expression profiles of adipose and muscle tissue from healthy individuals have demonstrated that induction of a hyperglycaemic state (using a hyperglycaemic–euinsulinaemic clamp and somatostatin) results in altered expression of 336 genes in adipose tissue and 316 genes in muscle tissue(Reference Meugnier, Faraj and Rome33). Of particular importance is an observed induction of genes from the metallothionein family, which act as scavengers of oxidant species, as well as a known transcription factor (MTF1) that induces expression of these genes. These results suggest that the hyperglycaemic state is a direct precursor to oxidative stress and subsequent activation of stress-response pathways.
Diet-induced alteration of transcriptomic signatures relevant to metabolic health
The aetiological agents that cause the MetS remain ambiguous, but it is clear that environmental factors and in particular nutrient intake play a very important role. Even subtle changes to dietary intake can generate widespread alterations in gene expression and, consequently, metabolic health. Thus, knowledge of diet-induced gene-expression alterations could provide further insight into mechanisms that advance development of the MetS.
In one such microarray study of forty-seven individuals with the MetS, it has been demonstrated that modification of dietary carbohydrate glycaemic index composition produces distinct gene-expression signatures in abdominal subcutaneous adipose tissue(Reference Kallio, Kolehmainen and Laaksonen34). Consumption of a diet rich in low-glycaemic index carbohydrates (rye and pasta) improves the insulinogenic index and reduces adipocyte cell size despite no alteration in body weight, and transcriptional analyses have shown modest, but significant, down-regulation of genes involved in insulin signalling (insulin-like growth factor (IGF)-binding protein-5, the insulin receptor and hormone-sensitive lipase). Whilst the role of IGF-binding protein-5 has not been determined in WAT, like IGF-binding protein-3 this protein modulates the effect of IGF-I and IGF-II, where lower levels would improve insulin sensitivity. Interestingly, and quite unexpectedly, the high-glycaemic index diet was found to be associated with up-regulation of oxidative stress, inflammatory response and the glucocorticoid-related gene transcripts. Enhanced heat-shock 10 kDA and 70 kDA protein gene expression are indicative of oxidative and inflammatory stress. Increased mitogen-activated protein kinase-related gene expression could be related to heat-shock 10 kDA and 70 kDA protein, inflammatory cytokines, oxidative stress and altered redox status. The mechanism(s) by which the low-glycaemic index diet induces changes indicative of mitogen-activated protein kinase activation, which would contribute to the inflammatory response and oxidative stress that are strongly associated with the MetS, remains to be determined.
Dietary fats, in particular PUFA, have also been shown to have important bioactive effects. By activating a key set of transcription factors, e.g. the PPAR, fatty acids have a potent regulatory influence on expression of genes related to lipid metabolism(Reference Bouwens, Afman and Muller35). Commonly-used markers of metabolic health, such as the homeostasis model assessment of insulin resistance and quantitative insulin sensitivity check index, indicate that PUFA improves insulin sensitivity and glucose homeostasis. Recently, transcriptomics analysis has allowed researchers to gain a more mechanistic understanding of this fact. In one such study gene-expression profiling was used to determine the effects of n-3 PUFA supplementation on adipose tissue in women with T2DM(Reference Kabir, Skurnik and Naour36). Long-chain n-3 PUFA supplementation was found to be associated with a significant hypotriacylglycerolaemic effect and lower NEFA concentrations (albeit approaching significance; P=0·09). No effect of long-chain n-3 PUFA on insulin or glucose homeostasis was found. Whilst body weight was not found to be altered, whole-body fat mass was reduced as the result particularly of a reduction in trunk fat, and adipocyte diameter was also reduced following the n-3 PUFA supplement. Interestingly, an increase in the expression of WAT genes involved in glucose and lipid metabolism was reported. The n-3 PUFA supplement was also found to be accompanied by reduced expression of several genes associated with the inflammatory response including: matrix metalloprotease 9, which is involved in matrix re-modelling and macrophage infiltration; cathepsin S; the chemoattractant plasminogen activator urokinase receptor; the macrophage surface markers CD11b and CD18; CD68, a macrophage-specific phagocytic activity marker. n-3 PUFA supplementation was found to reduce plasma plasminogen activator inhibitor factor-1 concentration but adipokine levels were not altered. Nevertheless, these results suggest that n-3 PUFA mediate subtle anti-inflammatory gene-expression profiles, which may reflect the altered adipose tissue morphology with fewer macrophages present that would otherwise be associated with insulin resistance. However, this hypothesis warrants further investigation with detailed cell-specific immunohistochemical analysis and functional characterisation.
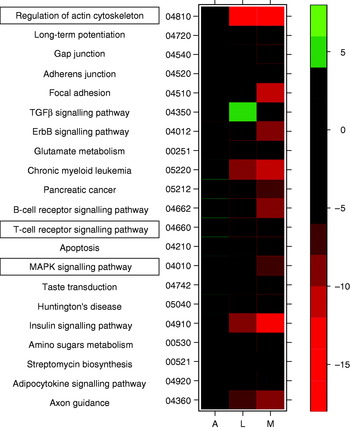
Similarly, research by the Nutrigenomics Research Group at University College Dublin has shown potent anti-diabetic effects associated with feeding diets enriched with the PUFA conjugated linoleic acid, as well as dramatic differences in expression profiles between liver, adipose and skeletal muscle tissue of genetically-obese C57/Bl6 ob/ob mice(Reference Moloney, Toomey, Noone, Nugent, Allan, Loscher and Roche6) (MJ Morine, J McMonagle and HM Roche, unpublished results). In the latter study the effect of feeding a diet supplemented with cis-9, trans-11 conjugated linoleic acid was determined in WAT, skeletal muscle and liver in order to understand the inter-organ transcriptional networks that underlie the potential anti-diabetic effect of cis-9, trans-11 conjugated linoleic acid. Preliminary results have shown dramatic gene-expression changes in liver tissue and muscle, but only a small extent of expression change in adipose tissue. These between-tissue differences are equally apparent at the pathway level. As an example, results from GSEA of these data indicate that a number of key pathways thought to be associated with progression of MetS (such as mitogen-activated protein kinase and T-cell signalling(Reference Crunkhorn, Dearie, Mantzoros, Gami, da Silva, Espinoza, Faucette, Barry, Bianco and Patti24, Reference Taleb, Herbin and Ait-Oufella37), and regulation of actin cytoskeleton(Reference Das and Rao38)) are up regulated in adipose tissue and down regulated in liver and muscle (Fig. 3) in response to conjugated linoleic acid. The GSEA of cellular compartment categories, however, indicates a number of global changes, in particular a significant (P<0·05) down-regulation of genes in the mitochondrial region (e.g. mitochondrial inner membrane, mitochondrial proton-transporting ATP synthase complex); future analyses will explore potential implications for OXPHOS.
Heatmap displaying a subset of metabolic pathways that are significantly affected in adipose (A), liver (L) and muscle tissue (M). Colours indicate t values for level of increase (green) or decrease (red) in expression level for each pathway. TGFβ, transforming growth factor β; MAPK, mitogen-activated protein kinase.
Summary and future perspectives
Recent advances in microarray technologies and bioinformatics have facilitated the profiling of comparative gene expression levels across metabolic phenotypes. This profiling allows researchers to identify mRNA expression changes that may be characteristic of a disease process with a view to identifying biomarkers of the disease. Typically, such an approach can yield one or more markers that can be used to diagnose or monitor disease. Such biomarkers are likely to be of greatest utility when identified in easily-accessible biological substrates such as peripheral blood. With gene-expression profiling it is also possible to monitor regulation and activity of entire metabolic pathways in different tissues, treatments and disease states. This approach allows not only the identification of differentially-regulated mRNA transcripts, but also the analysis of such transcripts in the context of biological processes. When in a process-orientated approach such changes may indicate key molecular events underlying disease development and progression and allow the development of therapies for metabolic disease. Future progression of transcriptomic profiling is likely to involve the incorporation of new gene-expression analysis platforms, mathematics, bioinformatics and data from proteomics and metabolomics studies in a systems-biology-orientated approach. This broad system-level scope will provide the necessary perspective to resolve the complexity of metabolic health.
Acknowledgements
The work described in this manuscript is supported by the Department of Agriculture and Food, Ireland, Food Institutional Research Measure (FIRM) project entitled Nutrigenomics & Functional Food Development. M. J. M. is a recipient of an EMBARK Postgraduate Scholarship, Irish Council for Science, Engineering and Technology (IRCSET). H. M. R. is a recipient of a Science Foundation Ireland (SFI) Principal Investigator Research Programme.
The authors declare no conflicts of interest. All named authors contributed to the design, writing and review of the manuscript.



