

New functional roles of vitamin D beyond its traditional role in Ca homoeostasis and bone metabolism(Reference Suda, Ueno and Fujii1) have emerged in recent years linking the fat-soluble vitamin to various non-communicable diseases. Vitamin D deficiency and sub-optimal status are increasingly associated with unfavourable metabolic phenotypes including insulin resistance, type 2 diabetes, CVD and certain cancers(Reference Holick2); conditions also commonly linked with overweight and obesity. Relationships between vitamin D status and obesity were first noted in the 1970s(Reference Lumb, Mawer and Stanbury3), with most subsequent studies focusing on the morbidly obese(Reference Compston, Vedi and Ledger4–Reference Liel, Ulmer and Shary6). However, a substantial body of evidence now indicates a more graded relationship between vitamin D status and BMI(Reference Jacques, Felson and Tucker7–Reference Hypponen and Power9), or specifically, adiposity(Reference Arunabh, Pollack and Yeh10–Reference Ernst, Thurnheer and Schmid12).
A number of hypotheses have been proposed to explain the potential mechanisms whereby alterations in the vitamin D endocrine system occur in the obese state(Reference Looker13). Plausible explanations are that heavier individuals may partake in less outdoor activity owing to limited mobility and may also cover-up, wearing more clothing than leaner individuals, leading to a decreased sun exposure and therefore limiting endogenous production of vitamin D in the skin(Reference Compston, Vedi and Ledger4). Negative feedback mechanisms from increased concentrations of 1,25-dihydroxyvitamin D3 have also been suggested, although evidence for such mechanisms is equivocal(Reference Bell, Epstein and Greene5, Reference Bell, Shaw and Turner14–Reference Konradsen, Ag and Lindberg16). A final hypothesis is that vitamin D (as a fat-soluble vitamin) may get sequestered or ‘hidden-away’ in the adipose tissue, leading to lower bioavailability in the obese state(Reference Need, Morris and Horowitz17, Reference Wortsman, Matsuoka and Chen18). BMI and adiposity have not only been inversely associated with vitamin D status in cross-sectional studies as mentioned previously, they have also been negatively correlated with the change in vitamin D status following supplementation, suggesting that body size and/or adiposity should be taken into account when determining the vitamin D intake required for optimal status(Reference Barger-Lux, Heaney and Dowell19–Reference Lee, Greenfield and Seibel21). On the other hand, some studies have found no such association(Reference Canto-Costa, Kunii and Hauache22, Reference Nelson, Blum and Hollis23).
Given the seasonal variation in endogenous vitamin D synthesis, especially for those residing at higher latitudes, supplementation is often recommended during the winter months only. Therefore, the aim of the present study was to investigate (Reference Suda, Ueno and Fujii1) cross-sectional associations between anthropometric measures of body size, adiposity and 25-hydroxycholecalciferol (25(OH)D), and (Reference Holick2) the wintertime serum 25(OH)D response to supplemental cholecalciferol, in healthy young and older Irish adults participating in a randomised placebo-controlled trial.
Materials and methods
Subjects
Apparently healthy adults were equally recruited within two centres; Coleraine, Northern Ireland (latitude 55°N) and Cork, Republic of Ireland (latitude 51°N). The primary aim of this study was to establish the distribution of dietary requirements for the maintenance of nutritional adequacy of vitamin D during late winter by performing a randomised controlled intervention study using supplemental intakes of cholecalciferol. Inclusion criteria were consenting adults, aged 20–40 and ≥ 64 years recruited before the winter months in 2006 and 2007, respectively. Recruitment aimed to have similar numbers of men and women within each study population (i.e. 20- to 40- and ≥ 64-year-olds). Exclusion criteria were: the use of vitamin D-containing supplements 12 weeks before the study, a planned winter vacation, use of tanning facilities, any severe medical condition or the use of medications known to interfere with vitamin D metabolism. The study was approved by the research ethics committee of the University of Ulster, Coleraine, and the clinical research ethics committee of the Cork Teaching Hospitals, University College Cork. All subjects gave written informed consent according to the guidelines laid down in the Declaration of Helsinki.
Study design
All subjects completed a validated sun exposure questionnaire (B Cullen and M Kully, unpublished results) that provided categorical information on various factors known to influence sun exposure, such as occupation, time spent outdoors, choice of clothing when outdoors and sunscreen use. Within each study population, subjects were stratified by centre, age and sex, and randomised to one of four treatment groups: 5, 10, 15 μg cholecalciferol or placebo daily, for 22 weeks over the winter months. For the purpose of the present analysis, only subjects randomised to either placebo or 15 μg cholecalciferol per d were included (n 227). The intervention period commenced in October, when vitamin D status is expected to be at its peak after the summer months and finished in March, the nadir for vitamin D status. To monitor compliance throughout this period, subjects were requested to return supplement boxes with any missed supplements at regular intervals. The number of missed supplements was then expressed relative to the number of supplements given to each subject (%). An overnight fasting blood sample was collected by venepuncture at baseline (October) and post-intervention (March) by a trained phlebotomist. All samples were processed within 3 h of collection and serum was frozen at − 80°C until analysis. Habitual dietary vitamin D intake was estimated using a validated FFQ(Reference Hill, Collins and O'Brien24, Reference Collins25) with the aid of a photographic portion size food atlas(26).
Anthropometric measurements
Anthropometric measurements included height to the nearest 0·01 m (using a wall-mounted stadiometer), weight to the nearest 0·01 kg (Seca Limited, Hamburg, Germany) and umbilical waist circumference (WC) to the nearest 0·5 cm. BMI (kg/m2) was calculated as weight (kg) divided by height (m2). Skinfold thickness measurements were also obtained from four sites (subscapular, suprailiac, biceps and triceps). Body density was calculated using the sum of four skinfolds, as described by Durnin & Womersley(Reference Durnin and Womersley27), and from which, fat mass (FM) relative to total body weight (FM %) was calculated using the Siri formula (((4·95 − body density)/4·5) × 100)(Reference Siri, Tobias and Lawrence28). Using total body weight, we then indirectly calculated FM and fat-free mass (FFM) in absolute terms (kg), adjusted them for height(Reference VanItallie, Yang and Heymsfield29) and also expressed them as a percentage ratio of each other as follows:
Laboratory analysis
Baseline and post-intervention samples were used to measure serum 25(OH)D (as a marker of vitamin D status) and serum intact parathyroid hormone (PTH) by ELISA (OCTEIA 25-Hydroxy Vitamin D; IDS Limited, Boldon, UK and MD Biosciences, Inc., St Paul, MN, USA, respectively). The intra- and inter-assay CV were 5·9 and 6·6 % for the 25(OH)D method, and 3·4 and 3·8 % for the PTH method, respectively. All laboratory analyses were carried out after the intervention period as previously described(Reference Cashman, Hill and Lucey30, Reference Cashman, Wallace and Horigan31).
Statistical analyses
All data were analysed using SPSS for Windows (version 15.0; SPSS, Inc., Chicago, IL, USA). In both age groups, the Kolmogorov–Smirnov statistic was used to determine the distribution of the data (excluding age), in which any significant result (P < 0·05) was indicative of a non-normal distribution. Where appropriate, data were log-transformed to achieve normal (or approaching normal) distributions. This transformation was applied to 25(OH)D, PTH, vitamin D intake, height, FM (kg and %), FMI, FFM, FM:FFM in the younger adults, and to PTH, vitamin D intake and weight in the older adults. Descriptive statistics (means, standard deviations or medians (25th and 75th percentiles)) were used to explore the characteristics of the study populations at baseline and significant differences were determined using independent t tests. The effect of intervention on vitamin D status and PTH concentration was assessed within each study population using ANCOVA, with baseline 25(OH)D as a covariate, and within each treatment group, using paired t tests.
Associations between body size, adiposity and vitamin D status at baseline were tested using Pearson's partial correlations. Subjects were classified into subgroups based on the baseline anthropometric measures: BMI (kg/m2), WC (cm), FM (kg) and FMI (kg/m2). Established cut-offs for BMI(32) and waist action levels (WAL)(Reference Han, van Leer and Seidell33), together with sex- and centre-specific tertiles of FM and FMI, were used for subgroup analysis. The vitamin D response to supplementation was then tested within the categorical and continuous data using ANOVA with Tukey post hoc tests, and ANCOVA, respectively. The PTH response to supplementation was also tested using ANCOVA. An a priori approach was applied when investigating the effect of intervention, in that, only those subjects who completed the 22-week intervention with >85 % compliance were included in the analysis. P values < 0·05 were considered statistically significant.
Results
A total of 227 adults were included in the present analysis (20- to 40-year-olds, n 118; ≥ 64-year olds, n 109). At baseline, 20- to 40-year-old adults had significantly higher vitamin D status and consequently lower serum PTH concentrations (both P values < 0·001), despite consuming a significantly lower mean daily intake of vitamin D than the ≥ 64-year olds (P = 0·004; data not shown). There was no difference in baseline vitamin D status between men and women in the younger group (80·7 (sd 33·2) v. 75·6 (sd 32·5); P = 0·311), however, older men had significantly higher vitamin D status compared to older women (61·5 (sd 23·5) v. 53·5 (sd 18·4); P = 0·049). Within both age groups, men consumed significantly more vitamin D per d on average than women (5·1 (sd 3·6) v. 3·5 (sd 2·3); P = 0·003, and 5·8 (sd 3·3) v. 4·6 (sd 2·7) P = 0·028, in the 20- to 40- and ≥ 64-year-olds, respectively). As expected, all anthropometric measures of adiposity, with the exception of BMI, were significantly different between men and women within each age group (all P values < 0·05; data not shown). Furthermore, baseline vitamin D status was also significantly higher in those recruited in Cork than those from Coleraine (88·3 (sd 36·5) v. 68·2 (sd 25·4); P = 0·001, and 62·3 (sd 23·5) v. 52·3 (sd 17·6); P = 0·012, in the 20- to 40- and ≥ 64-year-olds, respectively). Owing to these differences, all further analyses were adjusted for sex and recruitment centre, and were carried out in each age group separately.
In terms of baseline characteristics, there were no significant differences in any characteristic between the treatment groups in either age group (Table 1). In the 20- to 40-year-olds, there were five and three dropouts from the placebo and 15 μg/d groups, respectively; all other subjects completed the 22-week intervention with >85 % compliance. Among the ≥ 64-year olds, two subjects in the placebo group did not complete the study and a further two and three subjects from the placebo and supplemental groups, respectively, were excluded for non-compliance. Reasons for dropouts were unrelated to the intervention. There were no significant differences in terms of baseline vitamin D status, body size or adiposity between those who completed the study (n 110 and n 102) and those who were excluded through dropout or non-compliance (n 8 and n 7) in both the young and the older adults, respectively (data not shown). The effect of the intervention on vitamin D status and PTH concentrations is shown in Table 2. Vitamin D status at baseline was significantly associated with sun exposure in both young(Reference Cashman, Hill and Lucey30) and older(Reference Cashman, Wallace and Horigan31) adults, therefore, to take account for such differences, and subsequently the previous summertime endogenous production of vitamin D, all longitudinal analysis was controlled for baseline 25(OH)D. In younger adults, a non-significant decline in vitamin D status and a significant increase in PTH concentration were evident over the winter months in the group supplemented with 15 μg cholecalciferol per d (P = 0·193 and 0·011, respectively), whereas in the ≥ 64-year olds, supplementation significantly increased vitamin D status with no significant change in PTH concentration (P < 0·001 and 0·180, respectively).
(Medians, number of subjects, and 25th and 75th percentiles)

25(OH)D, serum 25-hydroxycholecalciferol; PTH, parathyroid hormone; WC, waist circumference; FM, fat mass; FMI, fat mass index; FFM, fat-free mass; FFMI, fat-free mass index.
* Vitamin D intake estimated from a validated FFQ.
† No significant differences between the treatment groups within each age group, all P>0·05 (independent t test).
(Medians, and 25th and 75th percentiles)

* Data shown for those who completed the 22-week intervention with >85 % compliance (determined by counting returned supplements).
† Change from baseline (within group paired t test).
‡ Significant effect of treatment, controlling for baseline concentrations (ANCOVA; P < 0·01).
At baseline, 25(OH)D was not significantly correlated with any anthropometric index in younger adults (Table 3) and the change in 25(OH)D following supplementation was not significantly influenced by body size or adiposity, in either the placebo or the 15 μg cholecalciferol per d groups (data not shown). However, in the ≥ 64-year-old adults, baseline 25(OH)D concentration was significantly negatively correlated with BMI (kg/m2), WC (cm), FM (kg), FM (%), FMI (kg/m2) and FM:FFM (%) (r − 0·33, − 0·36, − 0·33, − 0·30, − 0·33 and − 0·27, respectively; all P values < 0·01; Table 3). When ANCOVA adjusted for sex, recruitment centre and baseline 25(OH)D concentration was used to test the effect of body size and adiposity on the 25(OH)D response to supplemental cholecalciferol, only BMI was significantly and negatively associated with change in 25(OH)D in the older adults (Table 4). In addition, categorical analyses showed the change in 25(OH)D was also associated with measures of body size and adiposity in the older placebo group (Fig. 1(A)–(D)). Individuals classified as obese (BMI ≥ 30·0 kg/m2), or in WAL 2 (WC ≥ 102 cm in men and ≥ 88 cm in women) and randomised to the placebo group had a significantly smaller decline in 25(OH)D over the winter months compared with those classified as normal weight (BMI < 25·0 kg/m2) or below WAL 1 (WC < 94 cm in men and < 80 cm in women). Individuals in the middle and highest tertiles of FM (kg) and randomised to the placebo group tended to have a smaller decline in 25(OH)D compared with those in the lowest tertile; however, the change only reached significance between the lowest and middle tertiles. Similar trends were also apparent between the tertiles of FMI (kg/m2), but this did not reach significance. ANCOVA investigating the PTH response to supplemental cholecalciferol showed no significant effect of body size or adiposity, after controlling for sex, recruitment centre and baseline PTH concentration (data not shown).
(Pearson's partial correlation coefficients)
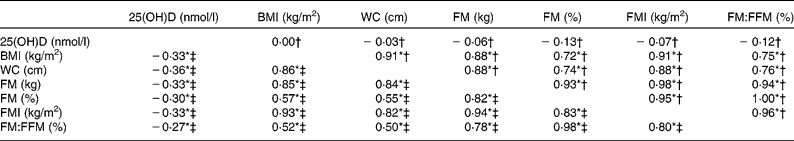
25(OH)D, serum 25-hydroxycholecalciferol; WC, waist circumference; FM, fat mass; FMI, fat mass index; FFM, fat-free mass.
* Pearson's partial correlation coefficient (r) adjusted for sex and recruitment centre (P < 0·01).
† 20- to 40-year-olds (n 118).
‡ ≥ 64-year-olds (n 109).
(β Coefficients and 95 % confidence intervals)
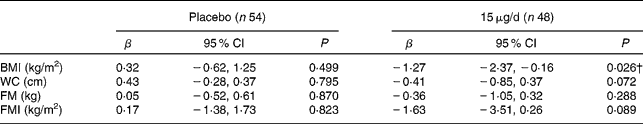
WC, waist circumference; FM, fat mass; FMI, fat mass index.
* Each model included baseline 25(OH)D, age, sex and recruitment centre as covariates.
† Significant association with the change in serum 25(OH)D from baseline (ANCOVA; P < 0·05).
Mean (sem 2) change in serum 25-hydroxycholecalciferol (25(OH)D) (nmol/l) in ≥ 64-year-old adults (n 102) by (A) BMI categories (□, BMI < 25·0; ![]() , BMI 25.0–29.9;
, BMI 25.0–29.9; ![]() , BMI ≥ 30.0); (B) sex-specific waist action levels (WAL 1: male (M), ≥ 94 cm and female (F), ≥ 80 cm; WAL 2: M, ≥ 102 cm and F, ≥ 88 cm). □, < WAL 1;
, BMI ≥ 30.0); (B) sex-specific waist action levels (WAL 1: male (M), ≥ 94 cm and female (F), ≥ 80 cm; WAL 2: M, ≥ 102 cm and F, ≥ 88 cm). □, < WAL 1; ![]() , ≥ WAL 1 < WAL 2;
, ≥ WAL 1 < WAL 2; ![]() , ≥ WAL 2; (C) sex- and centre-specific tertiles of fat mass (FM: low (□), 12·2–26·8 kg; medium (
, ≥ WAL 2; (C) sex- and centre-specific tertiles of fat mass (FM: low (□), 12·2–26·8 kg; medium (![]() ), 17·6–32·6 kg; high (
), 17·6–32·6 kg; high (![]() ), 27·5–53·0 kg); (D) sex- and centre-specific tertiles of fat mass index (FMI: low (□), 3·7–10·3 kg/m2; medium (
), 27·5–53·0 kg); (D) sex- and centre-specific tertiles of fat mass index (FMI: low (□), 3·7–10·3 kg/m2; medium (![]() ), 6·0–13·2 kg/m2; high (
), 6·0–13·2 kg/m2; high (![]() ), 8·9–21·8 kg/m2). Significant differences between groups determined by within-treatment group ANOVA. Values are means, with their standard errors represented by vertical bars. a,b Mean values with unlike letters were significantly different within the groups by Tukey post hoc tests (P < 0·05).
), 8·9–21·8 kg/m2). Significant differences between groups determined by within-treatment group ANOVA. Values are means, with their standard errors represented by vertical bars. a,b Mean values with unlike letters were significantly different within the groups by Tukey post hoc tests (P < 0·05).

Discussion
Overall, this study observed significant negative associations between baseline 25(OH)D and all anthropometric measures of body size and adiposity in a group of healthy older adults, aged 64 years and over. Furthermore in this group, the 25(OH)D response to supplemental cholecalciferol (15 μg/d) over the winter months was also negatively associated with baseline BMI, whereby the mean adjusted change in 25(OH)D decreased by approximately 6·5 nmol/l with every 5 kg/m2 increase in BMI at baseline. In contrast, no such relationships were apparent between body size, adiposity and baseline vitamin D status, or the vitamin D response to supplementation in younger adults (20–40 years).
A number of previous studies in older populations have also reported an inverse relationship between BMI(Reference Jacques, Felson and Tucker7, Reference Blum, Dallal and Dawson-Hughes20, Reference Lee, Greenfield and Seibel21) and/or measures of body fat(Reference Bolland, Grey and Ames11, Reference Snijder, van Dam and Visser34, Reference Moschonis, Tanagra and Koutsikas35) and vitamin D status. In the present study, a stronger relationship was observed when FMI (kg/m2) (i.e. FM adjusted for height) was used in the analysis instead of FM (%), an index not previously reported. An inverse relationship between adiposity and the decline in 25(OH)D over the winter months was also observed in older adults in the placebo group, which concurs with previous findings in both older men(Reference Lagunova, Porojnicu and Lindberg36) and postmenopausal women(Reference Bolland, Grey and Ames11, Reference Need, Morris and Horowitz17). Overall, in older adults, while baseline vitamin D status (primarily reflective of synthesis via UV-B during the summer months) was inversely associated with body size and adiposity, adiposity appeared to attenuate the natural seasonal decline in vitamin D status over the winter months, when vitamin D synthesis is absent. This finding may be attributed to the sequestration theory, suggested by Wortsman et al. (Reference Wortsman, Matsuoka and Chen18), that proposed that with increasing adiposity, more vitamin D is stored or trapped in adipose tissue following UV-B synthesis, leading to lower vitamin D status. Findings from the present study suggest that this sequestration in body fat may in fact act as a wintertime reservoir of vitamin D; however, this could only be confirmed by quantifying the vitamin D content of adipose tissue.
The inverse association observed in the present study between BMI and the 25(OH)D response to supplementation in older adults has also been noted in previous studies(Reference Blum, Dallal and Dawson-Hughes20, Reference Lee, Greenfield and Seibel21). In addition, Blum et al. (Reference Blum, Dallal and Dawson-Hughes20) reported inverse relationships between the change in 25(OH)D following supplementation and WC (cm), total FM (kg) and central FM (kg), albeit weaker associations than those noted for BMI. Inconsistencies in study findings between Blum et al. (Reference Blum, Dallal and Dawson-Hughes20) and the present study could be explained by the different methods used to assess adiposity. Blum et al. (Reference Blum, Dallal and Dawson-Hughes20) used dual-energy X-ray absorptiometry, which may be considered a more robust measure of adiposity than skinfold thickness measurements. On the other hand, the present finding of no relationship between any measure or index of FM and the 25(OH)D response to supplementation in this age group is in agreement with an earlier study in institutionalised older adults that used tertiles of FM (%) in their analysis(Reference Canto-Costa, Kunii and Hauache22). In the older group in the present analysis, supplementation also had a significant effect on PTH concentrations, however, as no effect of body size or adiposity on the change in PTH was evident, the significant increase in vitamin D status is the most plausible explanation for the PTH response to supplemental cholecalciferol.
In the younger adults, no associations were observed between baseline vitamin D status and any anthropometric measure of body size or adiposity, which is at variance to findings previously reported for similar age groups(Reference Nesby-O'Dell, Scanlon and Cogswell8, Reference Nelson, Blum and Hollis23, Reference Winters, Chennubhatla and Wang37). Furthermore, no associations were observed between baseline adiposity and the 25(OH)D or PTH response to supplementation. The majority of previous cross-sectional studies investigating vitamin D and obesity, more often than not have used BMI categories or cut-offs as a proxy measure of adiposity, e.g. obese v. non-obese (BMI ≥ 30 and < 30 kg/m2), which could result in stronger associations, than when BMI is used as a continuous variable. Two previous studies in younger adults have investigated the association between body size or adiposity and the 25(OH)D response to supplementation; however, results have been equivocal(Reference Barger-Lux, Heaney and Dowell19, Reference Nelson, Blum and Hollis23).
The findings from the present study, that anthropometric measures of body size and adiposity are associated with vitamin D status at baseline, the seasonal decline in vitamin D status over the winter months, and also the change in vitamin D status following supplementation in older, but not younger adults, could be indicative of fundamental age-related differences in vitamin D metabolism(Reference MacLaughlin and Holick38). Previous research reported that the serum 25(OH)D response 24 h after an oral dose of vitamin D2 was the same in both lean and obese younger adults(Reference Wortsman, Matsuoka and Chen18), but no such research has been undertaken in older population groups. The present findings, however, may also be explained by other factors rather than age-associated changes in vitamin D metabolism. It is well known that adiposity increases with age and vitamin D status is reported to be lower in older adults(Reference Lester, Skinner and Wills39, Reference Hirani and Primatesta40); the findings of the present study are in keeping with such reports. Therefore, it is possible that relationships between adiposity and vitamin D status may only be apparent when baseline adiposity is higher and vitamin D status is lower, as observed in older adults in the present analysis. Indeed, it could be hypothesised that if we had recruited a younger study population with similar baseline vitamin D status and adiposity as reported in our older population, similar associations between adiposity and vitamin D status may have been evident.
The present study has particular strengths and limitations. Although the sample size was small, the study had a randomised placebo-controlled design and was therefore ideal for investigating the impact of body size and adiposity on the 25(OH)D response to cholecalciferol supplementation. Undertaking the intervention only in wintertime also ensured that there would be no confounding of the results by endogenous synthesis of 25(OH)D and furthermore, compliance was very good with 93 % of the volunteers recruited consuming >85 % of the supplements provided. In the present study skinfold thickness measurements were used to estimate FM. Although skinfold-assessed adiposity has been shown to agree well with other direct measures of adiposity(Reference Durnin and Womersley27), such assessments are prone to inter- and intra-observer bias of uncertain magnitude and direction. To minimise such measurement error, all investigators were trained in these measures at one centre to standardise the methodology. A particular strength of the current analysis, we believe, was the inclusion of the measure of adiposity, FMI, i.e. FM adjusted for height (kg/m2). Within the literature, the most common method of reporting FM is as a percentage relative to total body weight but this method has a number of limitations(Reference VanItallie, Yang and Heymsfield29, Reference Rennie, Wells and McCaffrey41, Reference Cole, Fewtrell and Prentice42). Owing to the fact that FM (the numerator) is also a component of total body weight (the denominator), differences in adiposity between lean and obese individuals can be underestimated, which can be avoided by adjusting FM for height (FMI) rather than total body weight. It is recommended that future studies investigating the influence of adiposity on vitamin D status should use more direct measures of adiposity, appropriately adjusted for body size.
In conclusion, in the present study vitamin D status was inversely associated with anthropometric measures of adiposity at baseline, and BMI was also inversely associated with the change in vitamin D status following supplementation in older ( ≥ 64 years), but not younger Irish adults (20–40 years). If wintertime supplementation is recommended to those residing at higher latitudes, these results suggest that body weight status, as assessed by BMI, may need to be taken into account when determining an adequate dose for healthy older adults.
Acknowledgements
This research was funded by the Department of Employment and Learning, and the UK Food Standards Agency. The authors' responsibilities were as follows: J. J. S., J. M. W. W., E. M. McS., M. P. B., P. J. M., K. D. C. and M. K. designed the research. L. K. F., M. S. B., G. H., T. R. H. and A. J. L. conducted the research. L. K. F. and M. S. B, analysed the data. L. K. F., M. B. E. L. and J. M. W. W. interpreted the results and prepared the manuscript. All the authors read and approved the final manuscript. The authors have no conflict of interest. We thank statisticians at the Northern Ireland Clinical Research Support Centre, Belfast for statistical advice and Miss Carol Wilson for her comments on drafts of this manuscript. We are also very grateful to volunteers from both centres who participated in this research.


