





Introduction
Cover crops are increasingly being adopted to combat declines in agroecosystem biodiversity and health and as a tool for sustainable agricultural intensification through provision of agroecosystem services such as nutrient retention and scavenging, improving soil organic matter, and reducing erosion (Blanco-Canqui et al. Reference Blanco-Canqui, Shaver, Lindquist, Shapiro, Elmore, Francis and Hergert2015). In addition, the use of cover crops can be an important component of integrated weed management programs (Teasdale Reference Teasdale1996) and as a herbicide-resistance management tool (Norsworthy et al. Reference Norsworthy, Ward, Shaw, Llewellyn, Nichols, Webster, Bradley, Frisvold, Powles, Burgos and Witt2012). Cover crops fulfilling specific ecological goals are traditionally sown in monoculture, as species vary in functional traits such as rooting density, rate of leaf appearance, canopy development, and weed suppression, influencing agroecosystem processes (Wagg et al. Reference Wagg, van Erk, Fava, Comeau, Mitterboeck, Goyer, Li, McKenzie-Gopsill and Mills2021). Recently, diverse species mixtures have gained popularity due to the suggestion of enhanced productivity, synergism in agroecosystem services and improved year-to-year stability as compared with monocultures (Finney and Kaye Reference Finney and Kaye2017). Therefore, it is important to understand how increasing cover crop diversity from a range of species can improve productivity across diverse environments.
Cover crops can suppress weeds through a variety of mechanisms. Living cover crops directly compete with weeds for light, water, nutrients, and space, reducing weed germination, growth, and reproductive potential (Christina et al. Reference Christina, Negrier, Marnotte, Viaud, Mansuy, Auzoux, Techer, Hoarau and Chabanne2021). The capacity of cover crops to suppress weeds, however, is species and taxon specific through differences in phenotypic traits such as canopy development and relative growth rate. Plant functional groups such as grasses, including cereal rye (Secale cereale L.) and oat (Avena sativa L.), as well as forbs such as buckwheat (Fagopyrum esculentum Moench), have rapid growth and canopy development to suppress weeds and prevent their establishment (Baraibar et al. Reference Baraibar, Hunter, Schipanski, Hamilton and Mortensen2018). Similarly, living Brassica spp. have been demonstrated to suppress weeds through canopy light interception (Lawley et al. Reference Lawley, Teasdale and Weil2012). In contrast, some legume monocultures are often cited as poor annual cover crops for weed suppression due to their slow establishment and growth (Elsalahy et al. Reference Elsalahy, Döring, Bellingrath-Kimura and Arends2019). Taken together, cover crop biomass production appears to be a key metric and mechanism of weed suppression.
Cover crop mixtures are purported to increase productivity and agroecosystem services through greater complementarity in resource partitioning (Finney and Kaye Reference Finney and Kaye2017). Therefore, it stands to reason that cover crop mixtures will provide greater weed suppression than monocultures. Increased diversity driving enhanced productivity and agroecosystem services has been demonstrated in a variety of experimental grassland systems (Loreau and Hector Reference Loreau and Hector2001). Despite this, numerous agricultural studies have failed to observe enhanced productivity or weed suppression by diverse cover crop mixtures (Baraibar et al. Reference Baraibar, Hunter, Schipanski, Hamilton and Mortensen2018; Florence et al. Reference Florence, Higley, Drijber, Francis and Lindquist2019; Florence and McGuire Reference Florence and McGuire2020; Smith et al. Reference Smith, Atwood and Warren2014, Reference Smith, Warren and Cordeau2020). It has been suggested that the inclusion of a highly productive grass species in a mixture is primarily responsible for improved weed suppression. Other highly productive species such as buckwheat or crimson clover (Trifolium incarnatum L.), however, may provide similar weed suppression as grass species when included in mixture and provide additional agroecosystem services. Diverse cover crop mixtures that include multiple highly productive species may provide additional benefits, such as improved stability of cover crop productivity and weed suppression, providing insurance against widely fluctuating environments (Loreau et al. Reference Loreau, Barbier, Filotas, Gravel, Isbell, Miller, Montoya, Wang, Aussenac, Germain and Thompson2021).
Within Atlantic Canada, stagnant yields and declines in soil health have been a driving factor for the adoption of cover crops (Mann et al. Reference Mann, Lynch, Dukeshire and Mills2021; Nyiraneza et al. Reference Nyiraneza, Thompson, Geng, He, Jiang, Fillmore and Stiles2017). Due to the region’s long cool summer growing season and late harvest, there is limited opportunity for fall cover crop establishment, and soil is often left bare over the winter. As such, cover crops are typically grown in the year before or following a main cash crop, often potato (Solanum tuberosum L.), soybean [Glycine max (L.) Merr.], or small grains. In this system, cover crops are seeded in late June or early July and mowed in the fall, with residues remaining on the soil surface to overwinter until spring. In this study, we evaluated cover crop biomass productivity and weed suppression of a range of cover crops grown for a full growing season from various functional groups seeded in monoculture and in various two- and three-way species mixtures in Atlantic Canada. This study is part of a larger project aimed at evaluating cover crop suitability for adoption in Atlantic Canadian cropping systems. We developed three hypotheses to evaluate productivity and weed suppression by annual cover crops grown for a full growing season in monoculture and mixture. We hypothesized that (1) greater cover crop biomass productivity would provide greater weed suppression; (2) diverse cover crop mixtures would provide equivalent biomass productivity and weed suppression as compared with monocultures; and (3) diverse cover crop mixtures would be more stable in terms of biomass productivity and weed suppression than monocultures.
Materials and Methods
Experimental Design
Field experiments were conducted at the Charlottetown Research and Development Centre’s experimental farm (Harrington, PE, Canada; 46.35°N, 63.15°W) for 4 yr from 2018 to 2021. Soil at Harrington is classified as a Orthic Humo-Ferric Podzol (Canadian System of Soil Classification; Humic Cryorthods, U.S. Soil Taxonomy; pH 6.5 and organic matter 3%). In Atlantic Canada, cover crops are sown in late June or early July and mowed in September. Monthly temperatures at Harrington, PE, during this period average a low of 13.1 C and high of 21.0 C; monthly average precipitation was 76.6 mm over the previous 10 yr (2011 to 2021; Supplemental Table 1). Fields varied across years, with the preceding crops being soybean in 2018 and 2019 and buckwheat double cropped as a cover crop in 2020 and 2021.
A total of 38 cover crop treatments were selected; 19 cover crops sown as monocultures and 19 cover crop mixtures (Table 1). Cover crop treatments ranged in species and functional richness from one to three species. In addition, a bare soil control was included for a total of 39 treatments. Individual cover crops were chosen from those available in the region, and which provide a range of ecological services (Clark 2012) representing four taxonomic groups (brassica, forb, grass, and legume). Two- and three-species mixtures were composed of one, two, or three functional groups and were constructed using species of contrasting growth habits and phenologies. In addition, mixtures were designed to include warm- and cool-season species, which are similarly productive in the Atlantic Canadian climate (Wagg et al. Reference Wagg, van Erk, Fava, Comeau, Mitterboeck, Goyer, Li, McKenzie-Gopsill and Mills2021). This resulted in two- and three-species mixtures containing only legumes, grasses, brassicas, and forbs as well as one-, two-, and three-species mixture for all possible combinations of functional groups (Table 1). Besides single functional group mixtures, no mixture had more than one species of a functional group. One species from each functional group (brassica: brown mustard [Brassica juncea (L.) Czern.]; forb: buckwheat; grass: sorghum–sudangrass [Sorghum × drummondi (Nees ex. Steud.) Millsp. & Chase]; legume: crimson clover) was included in multiple mixtures to specifically evaluate these species inclusion in mixture. These species were chosen because they provide agroecosystem services that are of high priority to producers in the Atlantic Canadian region. Brown mustard and buckwheat have been shown to reduce wireworm [Coleoptera: Elateridae (Leach)] populations in subsequent potato crops (Vernon and van Herk Reference Vernon and Van Herk2017), sorghum–sudangrass has been shown to reduce Verticillium wilt, caused primarily by Verticillium dahliae (Kleb.), in subsequent potato crops (Larkin et al. Reference Larkin, Honeycutt and Olanya2011), and crimson clover is known for its soil-building properties and capacity to reduce erosion (Adetunji et al. Reference Adetunji, Ncube, Mulidzi and Lewu2020).
List of cover crop treatments, EPPO code, functional group (functional richness), species richness, and seeding rates used in the study.

a Note, seeding rates were adjusted for germination percentage, those listed represent unadjusted seeding rates. Species 1, 2, and 3 refer to order listed in treatment.
In all years, fields were chisel plowed and rolled before planting with a seed drill (Plotseed XL, Wintersteiger, Saskatoon, SK, Canada) with 15.24-cm spacing and a depth of 2.5 cm. Seeding rates of monocultures (Table 1) were determined from Extension recommendations, converted to a plant population density (plants m−2), and adjusted each year for germination percentage of seed. Seeding rates were halved in two- and three-way mixtures, except for buckwheat, which was divided by three according to Extension recommendations (Clark 2012; Table 1). All legumes were treated with Rhizobium leguminosarum (Frank 1889) before seeding. Plots measured 1.82 m by 10 m and were arranged in a randomized complete block design with 3 blocks (n = 468). Cover crops were planted on July 5, 2018, June 25, 2019, June 14, 2020, and June 14, 2021. Due to poor stand establishment in 2021, cover crops were replanted on July 13, 2021. Fertility, where required, was applied before planting and incorporated according to local recommendations. As is common in the region, cover crops were mowed with a flail mower in late September or early October depending on the year.
Data Collection
Each year and within each plot, we quantified cover crop and weed diversity and biomass production when >75% of cover crop species were flowering and had achieved canopy closure in mid-August. This stage was chosen to reflect outcomes of early-season competition and to measure biomass productivity before reproductive growth and plant senescence. A 0.5 m by 0.5 m quadrat (0.25 m2) was randomly placed within each plot, and density of emerged cover crops was determined. All cover crops and weeds were then clipped at the soil surface, sorted by species, and dried in a crop dryer to constant weight at 80 C.
Statistical Analysis
All statistical analyses were conducted in the R environment v. 4.0.3 (R Core Team 2020). Diversity was measured using a variety of metrics, including species richness (S), which is the number of species in a given area; Shannon diversity (H), which extends species richness to account for relative abundances of species; and evenness (E), which defines how numerically equally a community is distributed among its constituent species. Species richness (S), Shannon diversity (H), and evenness (E) were calculated for cover crops with the R package vegan (Oksanen et al. Reference Oksanen, Blanchet, Friendly, Kindt, Legendre, McGlinn, Minchin, O’Hara, Simpson, Solymos, Stevens, Szoecs and Wagner2020) for each plot using observed species densities. Shannon diversity was calculated as: $H = {\rm{\;}} - \sum \left[ {\left( {{p_i}} \right) \times \ln \left( {{p_i}} \right)} \right]$
where p i is the proportion of the ith species. Evenness was calculated as:
 $$E = H/{\rm{ln}}\left( S \right)$$
where H is the Shannon diversity index, and S is species richness. Weed suppression for each treatment was calculated using weed biomass in the control of the corresponding block as:
 $$\eqalign{ {\rm{Weed}}\;{\rm{suppression}}\;\left( \% \right) = 1\; - ({\rm{weed}}\;{\rm{biomass}}\;{\rm{in}}\;{\rm{treatment}} \cr /{\rm{weed}}\;{\rm{biomass}}\;{\rm{in}}\;{\rm{control}}) \cr} $$
Due to low weed biomass in control plots in 2018, data for that year were removed from analysis of weed suppression. Data points lying 1.5 × outside the interquartile range were treated as outliers and removed before analysis.
To evaluate our first hypothesis, we took three different approaches. First, to determine cover crop and weed biomass productivity by all cover crop treatments, a linear mixed-effects model was constructed with cover crop treatment (n = 38) as the fixed effect and replication and year treated as random effects (Baraibar et al. Reference Baraibar, Hunter, Schipanski, Hamilton and Mortensen2018). The effect of year was evaluated with a Wald’s test, and data were combined. Second, to evaluate effects of increasing species richness (1 to 3) on cover crop and weed biomass productivity, a linear mixed-effects model was constructed with species richness as the fixed effect and replication and year treated as random effects (Baraibar et al. Reference Baraibar, Hunter, Schipanski, Hamilton and Mortensen2018). Cover crop treatment was included as a random effect for the analysis of species richness to isolate effects of richness from community composition (Schmid et al. Reference Schmid, Baruffol, Wang and Niklaus2018). Further, to account for the unbalanced design, type III sums of squares were used. Linear mixed-effects models were constructed with the R package nlme (Pinheiro et al. Reference Pinheiro, Bates, Sarkar, Histerkamp, Van Willigen and Ranke2021). To compare cover crop sown richness, least-squares means were generated with the R package emmeans (Lenth et al. Reference Lenth, Buerkner, Herve, Love, Riebl and Singmann2021), and means were separated with a Tukey’s honest significant difference (HSD) test. Effects were considered significant with a type I error rate of α = 0.05. Finally, we estimated the effect size of increasing functional richness on cover crop biomass productivity and weed biomass suppression according to Florence et al. (Reference Florence, Higley, Drijber, Francis and Lindquist2019). In this analysis, the following linear model is constructed, which relates the standard deviation of cover crop biomass production to its mean with and without the interaction of functional richness and cover crop biomass as:
 $${\rm{Cover}}\,{\rm{crop}}\,{\rm{biomass}}\,{\rm{SD \sim cover}}\,{\rm{crop}}\,{\rm{biomass\ }}\overline x$$
 $$\begin{align*}{\rm{Cover}}\,{\rm{crop}}\,{\rm{biomass}}\,{\rm{SD \sim cover}}\,{\rm{crop}}\,{\rm{biomass\ }}\overline x \\ +\, {\rm{Cover}}\,{\rm{crop}}\,{\rm{biomass }}\ \overline x{\rm{:functional}}\,{\rm{richness}}\end{align*}$$
A significant effect of the interaction between functional richness and cover crop biomass indicates functional richness alters this relationship. The effect of increasing functional richness on weed suppression was estimated by fitting the following exponential model with and without functional richness:
 $${\rm{Weed}}\,{\rm{suppression}} = 100 - 100{e\ ^{{\rm \beta} 1x}}$$
 $${\rm{Weed}}\,{\rm{suppression}} = {\rm{100}} - {\rm{100}}{{\rm{e}}\ ^{{\rm{\beta 1}}x + }}^{{\rm{\beta 2functional}}\,{\rm{richness}}}$$
The control was removed before analysis in all cases.
To evaluate our second hypothesis, correlation and regression were used to investigate relationships between cover crop and weed biomass, weed suppression, species richness, Shannon diversity, and evenness. Linear and quadratic regression was conducted on the entire data set as well as split by functional group (Baraibar et al. Reference Baraibar, Hunter, Schipanski, Hamilton and Mortensen2018), and models with the lowest Akaike information criterion values were selected. Pearson’s correlation coefficients were generated in all cases. Monoculture cover crops were removed from diversity regressions. To assess variability in cover crop evenness, the coefficient of variation (CV) was generated for each treatment and compared.
To assess stability of mixtures versus monocultures and the third hypothesis, the CV was calculated for cover crop biomass (n = 12) and weed suppression (n = 9) for each treatment calculated from all replicates and all years. The CV represents the spatial (location) and temporal (year) variability of biomass production and weed suppression of each treatment (Smith et al. Reference Smith, Warren and Cordeau2020). As CVs cannot be compared statistically, treatments were ranked from lowest CV (most stable) to highest CV (least stable).
Results and Discussion
Cover Crop Productivity Varied by Species, Functional Group, and Diversity
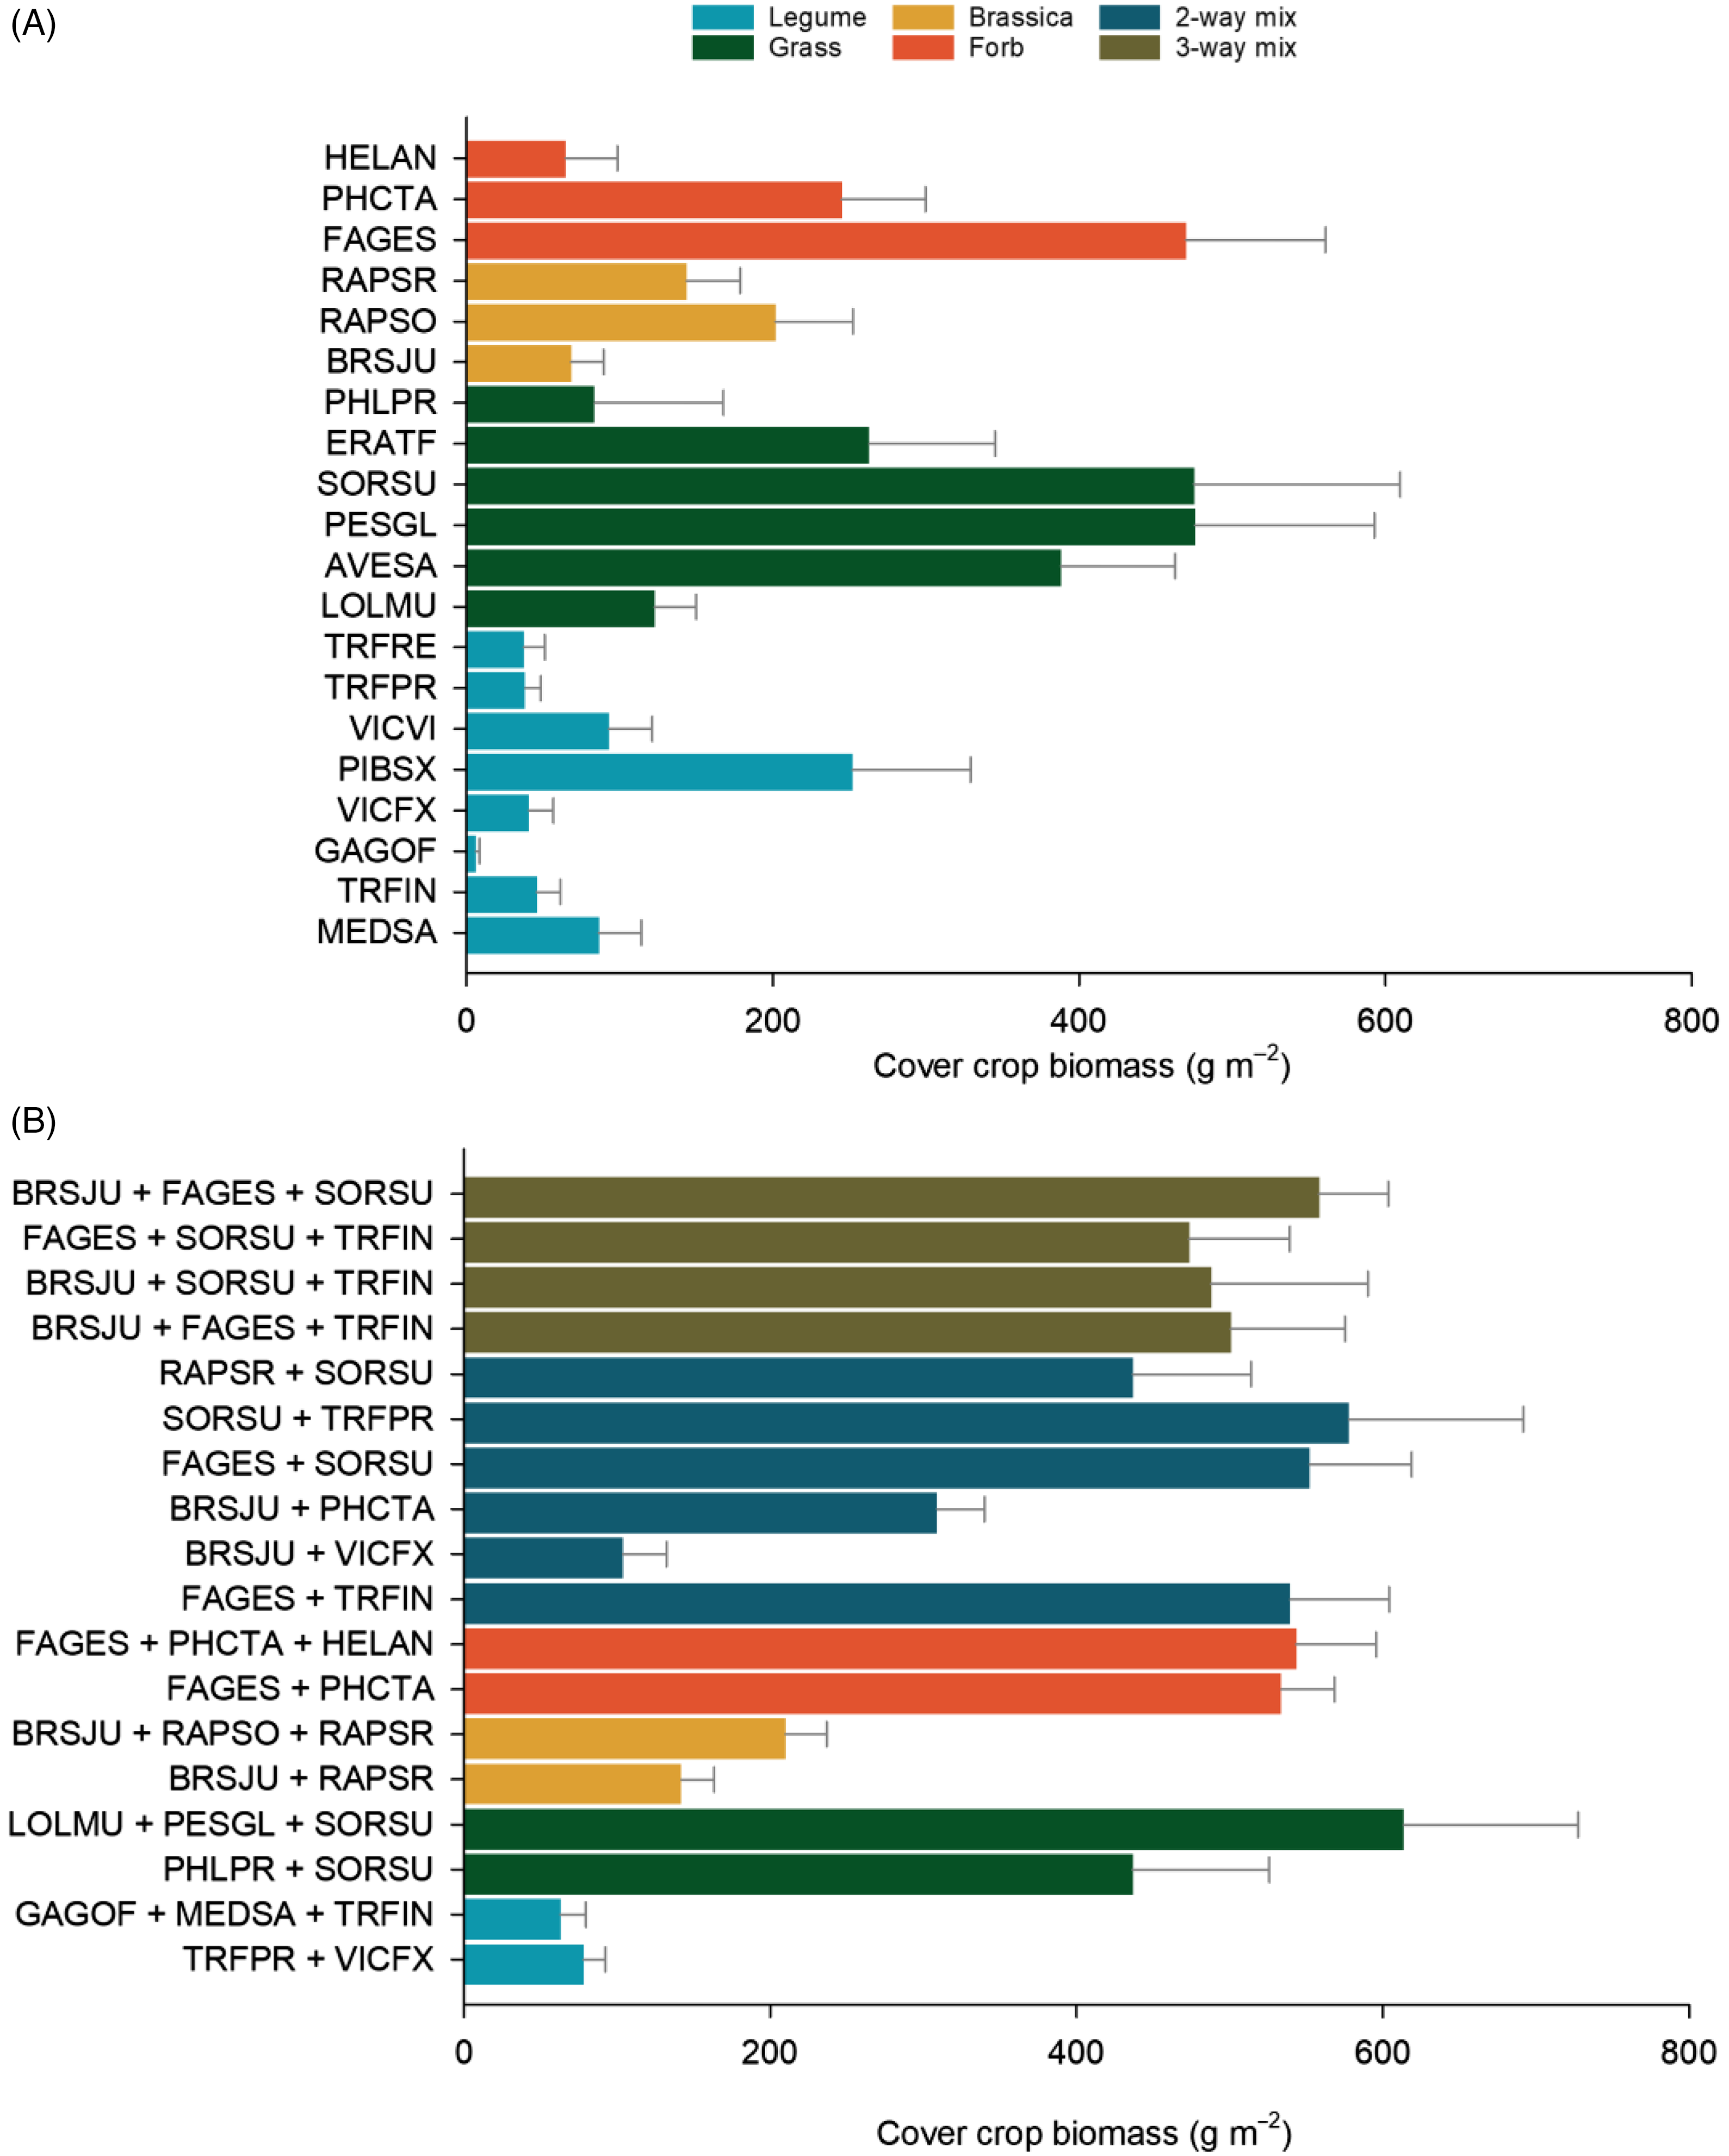
Cover crop biomass production varied by treatment and sown richness (Figure 1; Table 2). Within monoculture cover crops, brassicas and legumes tended to produce less biomass than grasses and forbs; however, there was large variability within each group (Figure 1A). On average, legumes produced the least biomass of all cover crops and were highly variable, ranging from a low of 6 g m−2 in galega (Galega officinalis L.) to a high of 252 g m−2 in field pea (Pisum sativum L.) (Figure 1A). The grasses sorghum–sudangrass, pearl millet [Pennisetum glaucum (L.) R. Br.], and oat and the forb buckwheat were the most productive of all monocultures, producing between 388 and 476 g m−2 of biomass.
Cover crop productivity. Biomass production (g m−2) of cover crop in (A) monocultures and (B) mixtures. Values represent means ± standard errors. See Table 1 for species (EPPO) codes.
ANOVA of cover crop biomass, cover crop evenness, and weed biomass by treatment, functional group, and sown richness. a

a ndf, numerator degrees of freedom; ddf, denominator degrees of freedom.
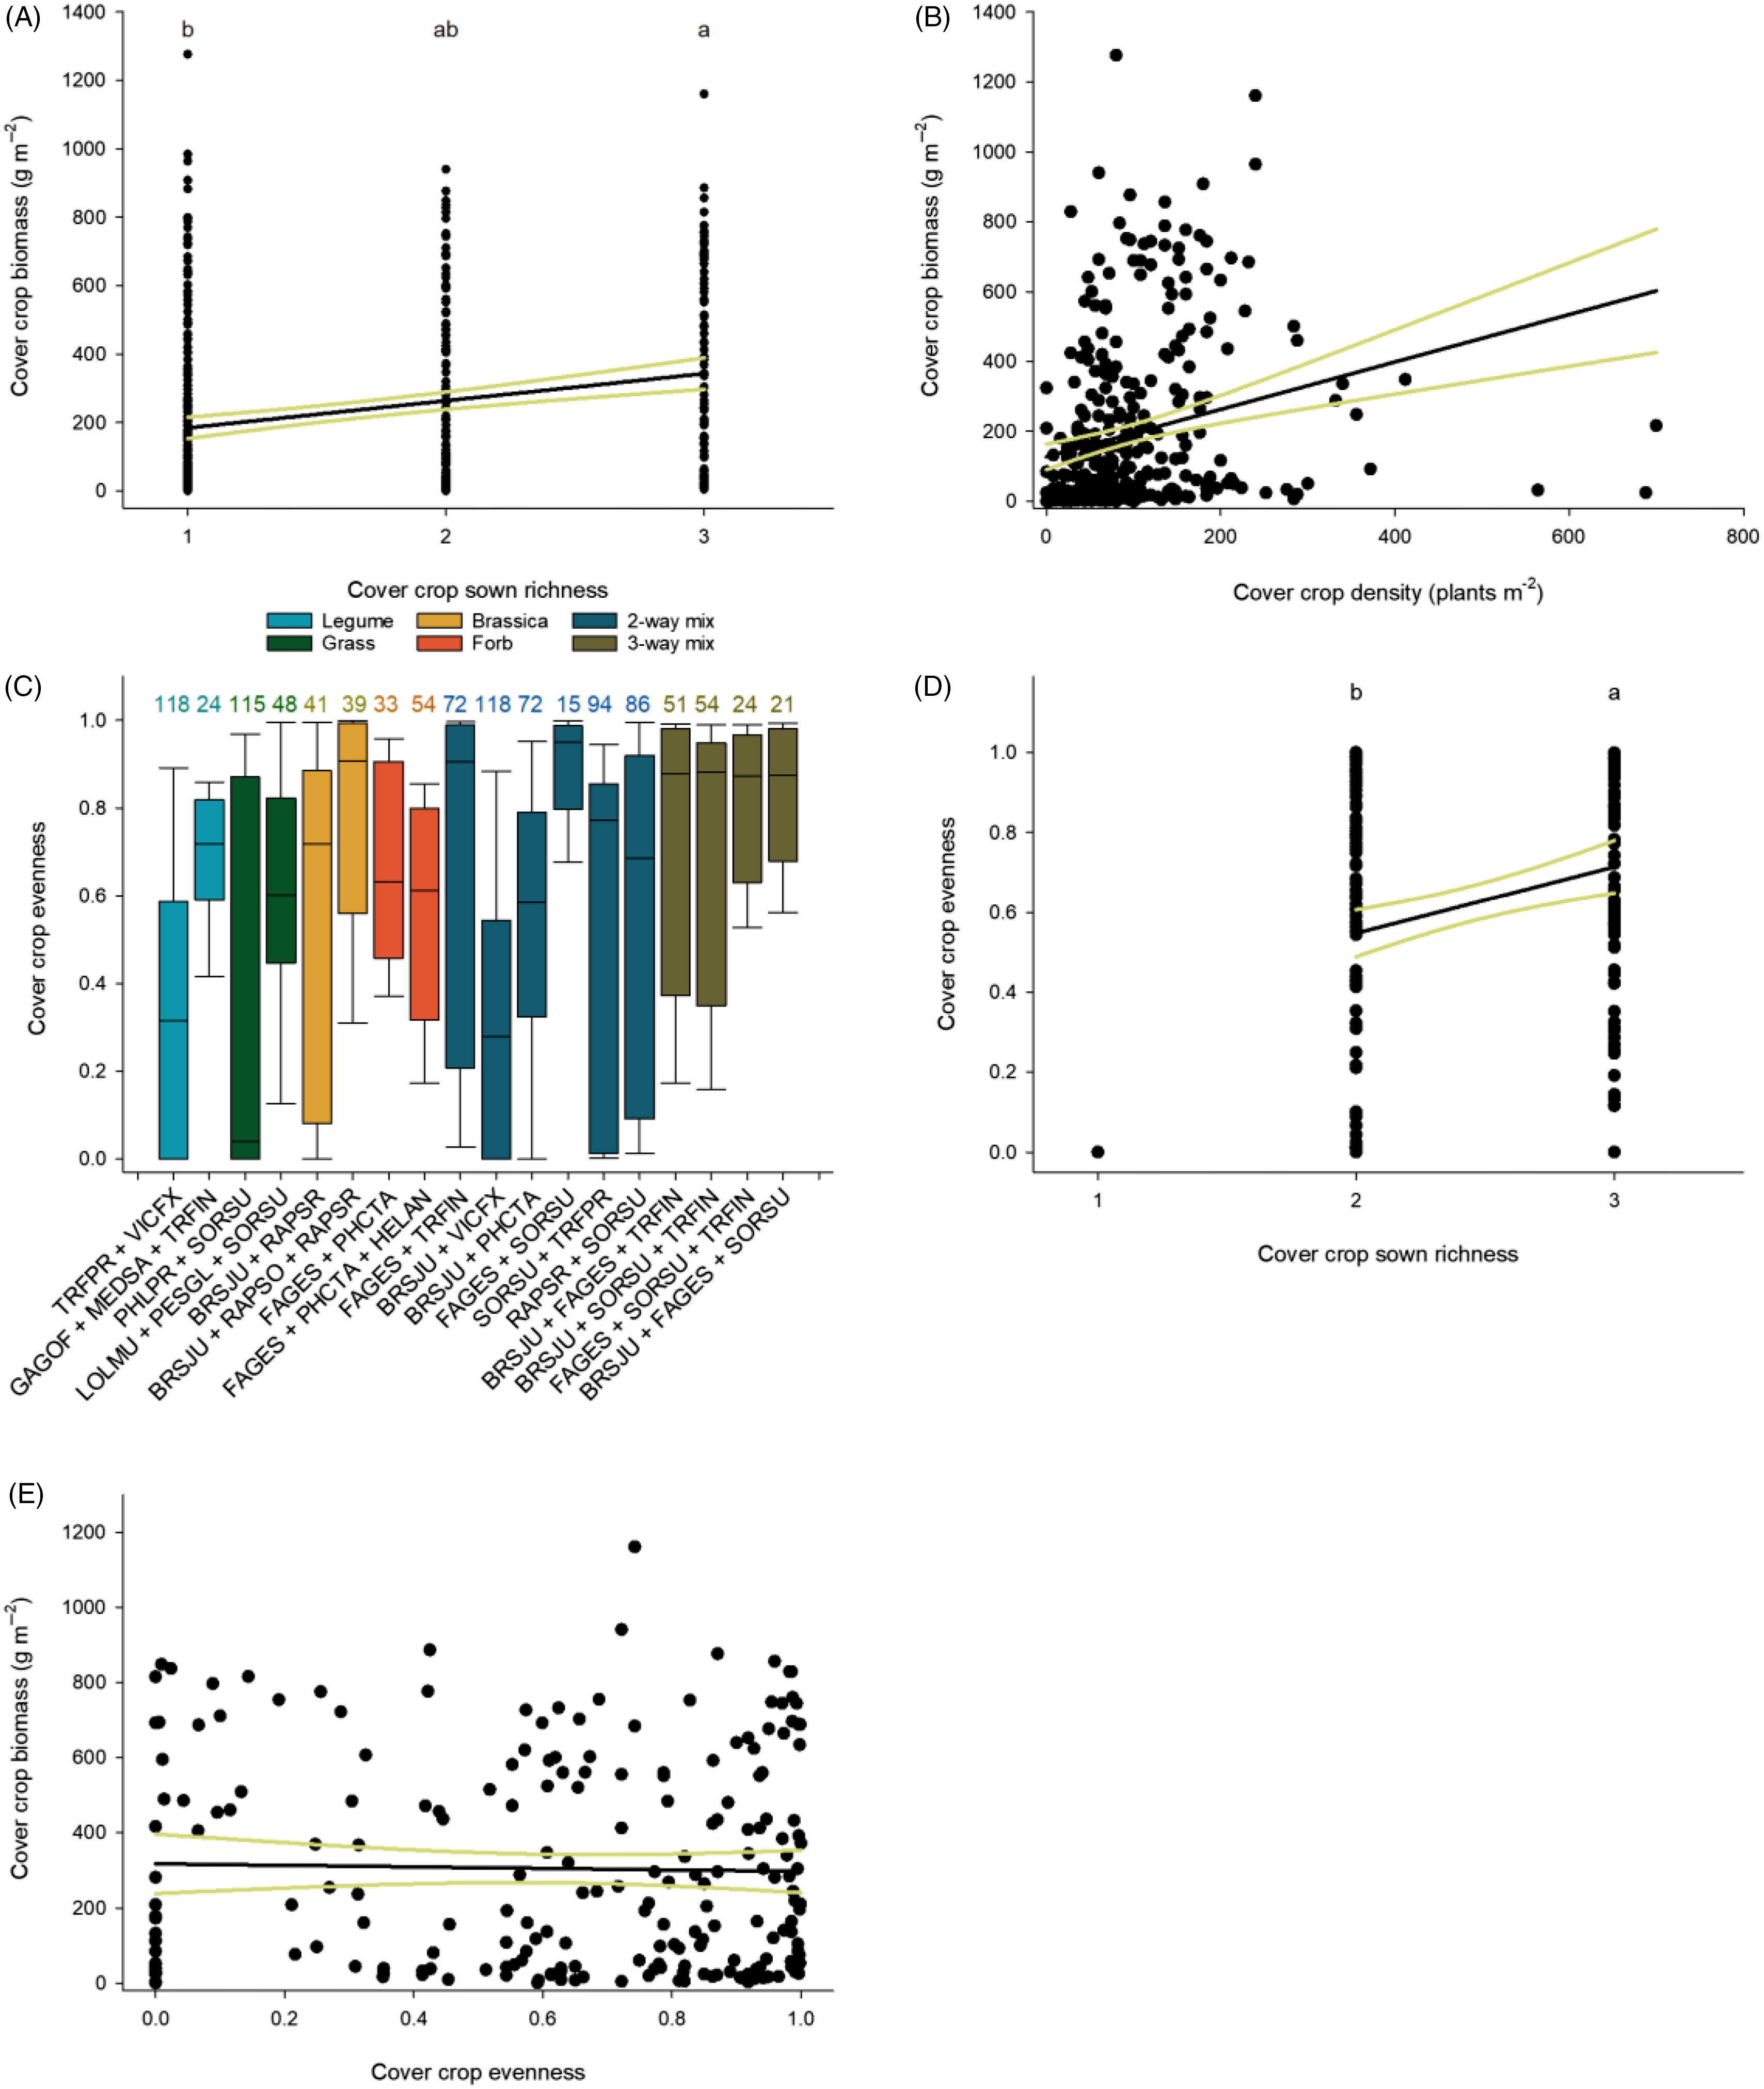
In general, cover crop mixtures were more productive than monocultures but not more than the most productive monocultures (Figure 1). Increasing sown richness, however, did increase cover crop biomass (Figure 2A). Within functional groups, grass mixes, forb mixes, and two- and three-way mixtures produced more biomass than brassica or legume monocultures and legume mixtures (Figure 1). Of mixtures, the two-way mixtures of buckwheat + sorghum–sudangrass and sorghum–sudangrass + red clover (Trifolium pratense L.) and the three-way mixtures of annual ryegrass [Lolium perenne L. ssp. multiflorum (Lam.) Husnot],+ pearl millet + sorghum–sudangrass and brown mustard + buckwheat + sorghum–sudangrass were the most productive and ranged from 426 to 468 g m−2 of cover crop biomass (Figure 1B). Cover crop biomass increased with increasing density (Table 3; Figure 2B). Overall, while cover crop biomass production was positively correlated with cover crop density, density explained minimal variation across all cover crop treatments (Table 3). Within specific functional groups, however, a stronger relationship between density and biomass production was observed. Cover crop biomass of forbs and the two- and three-species brassica, legume, and forb mixes, as well as the three-way mixtures, was positively correlated with density (Table 3). Together, these results suggest that increased biomass production can be partly attributed to increased density; however, this relationship is species and functional group specific.
The effects of cover crop diversity on cover crop productivity and evenness. The relationship between (A) sown richness (y = 105.41 + 79.39x) and (B) density (y = 127.31 + 0.68x) and cover crop biomass production. (C) Distribution of mixture evenness. Boxes represent first and third quartiles, black bars the medians, and error bars the maxima and minima. Values above bars are the coefficient of variation (CV) of evenness. The response of (D) evenness to increased cover crop richness (y = 0.22 + 0.17x) and (E) cover crop biomass to evenness (y = 317.25 − 19.94x). Black lines represent linear regression and yellow lines 95% confidence intervals. Values not connected by the same letter are significantly different according to Tukey’s honest significant difference (HSD) (α = 0.05). See Table 1 for species (EPPO) codes.

Evenness of Cover Crop Mixtures
Within mixtures, cover crop species evenness varied by mixture composition (Table 2). Significant variability in evenness was observed across cover crop mixtures ranging from high to low evenness (Figure 2C). Grass and legume mixtures tended to be the least even of all functional groups, with mixtures containing sorghum–sudangrass consistently among those with the largest variability in evenness observed (Figure 2C). In general, mixtures containing buckwheat and brown mustard had the least variability in evenness (Figure 2C). For example, the addition of a highly productive species such as buckwheat and/or brown mustard to a mixture containing sorghum–sudangrass reduced variability in evenness. In addition to differences across cover crop mixtures, as sown cover crop species richness increased from 2 to 3, evenness increased (Table 2; Figure 2D). Despite variability in evenness across cover crop mixtures, no relationship was observed between cover crop biomass production and evenness (Figure 2E).
Cover Crop Mixtures Were More Weed Suppressive Than Monocultures
The weed community across all years and treatments was dominated by smooth crabgrass [Digitaria ischaemum (Schreb) Schreb. ex Muhl.), common lambsquarters (Chenopodium album L.), redroot pigweed (Amaranthus retroflexus L.), quackgrass [Elymus repens (L.) Gould], and corn spurrey (Spergula arvensis L.), which comprised 92% of the total weed biomass. Within these, D. ischaemum and C. album were the most common species and constituted 77% of total weed biomass. Weed biomass was affected by cover crop treatment and sown cover crop richness (Figure 3). Within monocultures, weed biomass was greater in legume plots compared with other cover crop species, with a few exceptions (Figure 3A). Weed biomass in the non-legume monocultures of annual ryegrass, timothy (Phleum pratense L.), brown mustard, and sunflower (Helianthus annuus L.) ranged from 100 g m−2 to 147 g m−2 and was similar to that observed for the majority of legume cover crops. In comparison, weed biomass in the most suppressive cover crops of oat, buckwheat, phacelia (Phacelia tanacetifolia Benth.), pearl millet, oilseed radish (Raphanus sativus L. var. oleiformis Pers.), and sorghum–sudangrass ranged from 12 g m−2 to 44 g m−2.
Weed biomass (g m−2) in (A) monocultures and (B) mixtures. Values represent means ± standard errors. See Table 1 for species (EPPO) codes.

In general, weed biomass was reduced in cover crop mixtures as compared with monocultures (Figure 3). Significant variability, however, was observed across all other functional groups (Figure 3B), and increasing functional richness did not improve cover crop biomass productivity or weed suppression (Tables 4 and 5). The most weed-suppressive mixtures were both forb mixes (buckwheat + phacelia [7 g m−2] and buckwheat + phacelia + sunflower [15 g m−2]), whereas legume mixtures were the least weed-suppressive functional group and comparable to legume monocultures. For example, the least suppressive legume mixtures were galega (244 g m−2) and galega + alfalfa (Medicago sativa L.) + crimson clover (188 g m−2), respectively. No relationship was found between cover crop Shannon diversity or evenness and weed biomass (data not shown).
Parameter estimates and standard error for linear models relating standard deviation (SD) of cover crop biomass (CCBio) production to mean cover crop biomass production with and without the effect of functional richness.

a Asterisked values (*) indicate functional richness altered the relationship between mean and SD of cover crop biomass production (α = 0.05).
Parameter estimates and standard errors for exponential models relating cover crop biomass production to weed biomass suppression with and without the effect of functional richness (FR).

a An asterisked (*) significant β2 parameter (α = 0.05) indicates functional richness altered the relationship between cover crop biomass production and weed suppression.
Weed biomass declined with increasing cover crop biomass (Figure 4A), density (Figure 4B), and cover crop sown richness (Figure 4C). The relationship between cover crop biomass and weed biomass, however, varied by functional groups (Table 3). Biomass of all functional groups except brassica and legume mixtures was correlated to weed biomass. Grass and forb mixtures had the highest correlation between cover crop biomass and weed biomass. Overall, cover crop biomass explained little variability in weed biomass. In comparison, density explained less variability in weed biomass than cover crop biomass (Table 3). Only forb monocultures and the three-way mixtures displayed a significant negative correlation between density and weed biomass (Table 3). Similar to the effects of cover crop biomass on weed biomass, weed suppression rapidly increased with increasing cover crop productivity (Figure 4D). The regression of cover crop biomass and weed suppression demonstrated that cover crop biomass of 120 g m−2, 335 g m−2, and 450 g m−2 was required to achieve 50%, 80%, and 90% suppression of weed biomass, respectively (Figure 4D). Maximum weed suppression (97%) was achieved when cover crop biomass was 655 g m−2.
Mechanisms of weed suppression. The effects of cover crop (A) biomass (y = 0.01 + 0.00008x 2 − 0.19x), (B) density (y = 96.33 + 0.0006x 2 − 0.39x), and (C) sown richness (y = 107.16 − 21.87x) on weed biomass and cover crop biomass on weed suppression [y = 0.26 + (−0.000002x 2) + 0.002x]. Black lines represent linear regression and yellow lines 95% confidence intervals. Values not connected by the same letter are significantly different according to Tukey’s honest significant difference (HSD) (α = 0.05).

Importance of Cover Crop Biomass and Diversity for Weed Suppression
Across cover crop species, functional groups, and diversity, we observed a strong relationship between cover crop biomass production and weed biomass suppression; the most productive cover crops tended to be the most weed suppressive. As such, our results support the notion that biomass production is a key mechanism of weed suppression in annual cover-cropping systems and support our initial hypothesis. This is in agreement with numerous previously published reports demonstrating cover crop biomass as a key predictor of weed suppression for summer annual cover crops (MacLaren et al. Reference MacLaren, Swanepoel, Bennett, Wright and Dehnen-Schmutz2019; Smith et al. Reference Smith, Atwood, Pollnac and Warren2015, Reference Smith, Warren and Cordeau2020). Our observation that species such as buckwheat, sorghum–sudangrass, and oats are highly productive and provide a high degree of weed suppression is similar to results in other studies from the Northeast-Atlantic region (Smith et al. Reference Smith, Atwood and Warren2014, Reference Smith, Atwood, Pollnac and Warren2015; Wagg et al. Reference Wagg, van Erk, Fava, Comeau, Mitterboeck, Goyer, Li, McKenzie-Gopsill and Mills2021). Buckwheat has consistently been demonstrated to provide superior weed suppression through rapid growth, canopy development, and potential allelopathy (Falquet et al. Reference Falquet, Gfeller, Pourcelot, Tschuy and Wirth2015). Similarly, several studies have highlighted the productivity (Smith et al. Reference Smith, Atwood and Warren2014, Reference Smith, Atwood, Pollnac and Warren2015) and allelopathic potential (Weston et al. Reference Weston, Harmon and Mueller1989) of sorghum–sudangrass and its use as a weed-suppressive cover crop. Indeed, as observed in our study and elsewhere (Baraibar et al. Reference Baraibar, Hunter, Schipanski, Hamilton and Mortensen2018; Elsalahy et al. Reference Elsalahy, Döring, Bellingrath-Kimura and Arends2019), slow-growing legumes tend to produce little biomass and are poor annual cover crops for weed suppression. In addition, several mixtures, in particular ones containing buckwheat, brown mustard, and sorghum–sudangrass, were among the most weed-suppressive cover crops evaluated. This is in line with previous results demonstrating mixtures containing these species can provide weed suppression equivalent to the most superior monoculture (Baraibar et al. Reference Baraibar, Hunter, Schipanski, Hamilton and Mortensen2018; Nelson et al. Reference Nelson, Pswarayi, Quideau, Frick and Spaner2012).
A degree of caution, however, is required with using biomass as the sole metric of plant competition (see Trinder et al. Reference Trinder, Brooker and Robinson2013, Reference Trinder, Brooker, Davidson and Robinson2020). Biomass alone provides an incomplete picture of plant–plant interactions and resource capture, as other factors such as relative growth rate and canopy light interception can be equally as important (Christina et al. Reference Christina, Negrier, Marnotte, Viaud, Mansuy, Auzoux, Techer, Hoarau and Chabanne2021; Kruidhof et al. Reference Kruidhof, Bastiaans and Kropff2008; Lawley et al. Reference Lawley, Teasdale and Weil2012). Interactions between species functional traits, including rate of leaf appearance, resource use efficiency and capture, and emergence pattern in mixture may enhance or hinder weed suppression, further limiting the usefulness of biomass production as an indicator of weed suppression in cover crop mixtures. Future studies evaluating these interactions between species are required to fully disentangle the weed-suppressive contribution of species to diverse cover crop mixtures.
In support of the majority of studies (Baraibar et al. Reference Baraibar, Hunter, Schipanski, Hamilton and Mortensen2018; Florence et al. Reference Florence, Higley, Drijber, Francis and Lindquist2019; Florence and McGuire Reference Florence and McGuire2020; Nelson et al. Reference Nelson, Pswarayi, Quideau, Frick and Spaner2012; Smith et al. Reference Smith, Warren and Cordeau2020), we observed cover crop mixtures were not necessarily more weed suppressive than the most productive monocultures. We did, however, detect a positive effect of increasing cover crop species richness on biomass production and weed suppression, which supported our second hypothesis. Further, the inclusion of highly productive species such as buckwheat or sorghum–sudangrass were integral to driving this relationship in mixture. These results are in line with the large body of evidence within the ecological literature wherein ecosystem functioning increases with increasing plant diversity (Cardinale et al. Reference Cardinale, Srivastava, Duffy, Wright, Downing, Sankaran and Jouseau2006; Isbell et al. Reference Isbell, Calcagno, Hector, Connolly, Harpole, Reich, Scherer-Lorenzen, Schmid, Tilman, Van Ruijven and Weigelt2011). We provide several possible explanations for the incongruences between our results and previous research demonstrating a poor relationship between diversity and weed suppression. First, our cover crop mixtures were constructed in a partial substitutive design; seeding rates were reduced by half in both two- and three-way mixtures. While greater cover crop density in three-way mixtures providing greater weed suppression may explain our response, we failed to detect a strong relationship between density and weed suppression in all other mixtures. We observed that several plots with the highest densities had similar levels of weed biomass as low-density cover crop plots. Similarly, we observed no differences in cover crop density between two- and three-way mixtures. Increasing monoculture seeding rate has been associated with superior weed suppression (Akemo et al. Reference Akemo, Regnier and Bennett2000; Weiner et al. Reference Weiner, Griepentrog and Kristensen2001), but not necessarily cover crop biomass production (Ryan et al. Reference Ryan, Curran, Grantham, Hunsberger, Mirsky, Mortensen, Nord and Wilson2011), due to greater intraspecific competition. In addition, several studies concerning cover crop mixtures using a substitutive versus additive design have similarly failed to detect strong evidence for increased weed suppression by increasing cover crop density in mixture (Mohler and Liebman Reference Mohler and Liebman1987; Poggio Reference Poggio2005; Smith et al. Reference Smith, Atwood, Pollnac and Warren2015), despite larger effect sizes reported in the ecological literature with additive designs (Balvanera et al. Reference Balvanera, Pfisterer, Buchmann, He, Nakashizuka, Raffaelli and Schmid2006). Our analysis attempted to control for variable species communities and densities across treatments to isolate effects of richness on productivity and weed suppression. While we cannot fully disentangle the effects of increased cover crop density and diversity on biomass production and weed suppression, our data support the notion that increased cover crop diversity can promote agroecosystem services.
Results from our study demonstrate that increased biomass productivity and weed suppression are not necessarily associated with the dominance of a single highly productive grass species. Baraibar et al. (Reference Baraibar, Hunter, Schipanski, Hamilton and Mortensen2018) found that inclusion of cereal rye or oats in a mixture provided weed suppression equivalent to the most suppressive monocultures. Similarly, MacLaren et al. (Reference MacLaren, Swanepoel, Bennett, Wright and Dehnen-Schmutz2019) found the proportion of cereal biomass within a mixture to have a greater effect on weed suppression than cover crop biomass alone. Mixtures in past studies focused on few species and primarily consisted of grass–legume polycultures. We found that, regardless of functional identity, if a species was highly productive in monoculture, it was similarly productive in mixture. For example, evenness decreased in functionally rich mixtures containing sorghum–sudangrass, while maintaining a high level of weed suppression similar to sorghum–sudangrass monocultures. This effect on evenness could be buffered against if the mixture contained a similarly productive species such as buckwheat, pearl millet, or annual ryegrass, resulting in reduced variability in mixture evenness. Other mixtures with variable evenness resulted from poor establishment by a cover crop species that also had poor establishment in monoculture, suggesting cover crop evenness may be unpredictable from year to year. For instance, mixtures containing faba bean (Vicia faba L.) tended to be the least even, and monocultures of faba bean similarly had poor productivity. Taken together, our results demonstrate that the inclusion of multiple highly productive species in cover crop mixtures is essential to maintain stand evenness as diversity increases and ensure maximum productivity and weed suppression.
Spatiotemporal Stability of Cover Crops
To assess spatiotemporal stability of cover crop biomass production and weed suppression across replications and years, the CV was calculated for each treatment and ranked (Figure 5). In terms of biomass production of the 10 most stable cover crops, 6 were mixtures, and all contained either buckwheat and/or brown mustard (Figure 5A). The only monocultures within this group were the forbs buckwheat and phacelia, and grasses oat and annual ryegrass. In contrast, half of the least stable biomass-producing cover crops were legumes in monoculture, and only two were mixtures, brown mustard + faba bean and the legume mixture of galega + alfalfa + crimson clover (Figure 5A). Similar to biomass production, the greatest stability in weed suppression was observed in mixtures containing buckwheat and/or brown mustard and monocultures of oat, buckwheat, and pearl millet (Figure 5B). In general, legumes and mixtures containing legumes provided the least stability in weed suppression and represented 7 of the 10 least stable cover crops.
Spatiotemporal stability of (A) cover crop productivity (n = 12) and (B) weed suppression (n = 9). Values are coefficients of variation and ranked from most stable to least stable across sites and years. See Table 1 for species (EPPO) codes.

The diversity–stability theory purports that species-rich ecosystems will be more spatiotemporally stable against environmental fluctuations than less species-rich ecosystems (Loreau et al. Reference Loreau, Barbier, Filotas, Gravel, Isbell, Miller, Montoya, Wang, Aussenac, Germain and Thompson2021). Several authors, however, have failed to find evidence in support of this hypothesis in annual cover-cropping systems (Florence et al. Reference Florence, Higley, Drijber, Francis and Lindquist2019; Smith et al. Reference Smith, Atwood and Warren2014, Reference Smith, Warren and Cordeau2020). In contrast, we found that the majority of highly stable cover crops were mixtures and, therefore, partial support for our third hypothesis that diverse cover crop mixtures would provide greater stability in biomass production and weed suppression than monocultures. Though in congruence with Smith et al. (Reference Smith, Warren and Cordeau2020), monocultures of buckwheat and grass species such as pearl millet and oats displayed the greatest stability in weed suppression across sites and years. Therefore, while mixtures may not necessarily provide the most consistent weed suppression, many were among the most stable crops. Of mixtures, buckwheat and brown mustard were overrepresented among the most stable cover crops, suggesting they may have a greater influence on stabilizing productivity and weed suppression than other species under the variable Atlantic Canadian climate. The increase in cover crop stability through inclusion of these species in mixture may provide a means of bet-hedging against biotic and abiotic fluctuations producers face in the region and a mechanism to maximize weed suppression while providing additional agroecosystem services.
Our results demonstrate a positive effect of cover crop diversity on weed suppression; however, in line with previous studies, not all mixtures were more weed suppressive than the most productive monocultures. Monocultures of buckwheat, oat, pearl millet, or sorghum–sudangrass were often more productive and weed suppressive than the average mixture. This consistent result across regions, seasons, mixture composition, and functional diversity demonstrates that mixtures are not necessarily more productive or weed suppressive than monocultures. Proponents of cover crop mixtures suggest they provide an opportunity for increased diversity within annual cropping systems and provide increased agroecosystem services as compared with monocultures (Finney and Kaye Reference Finney and Kaye2017). If weed suppression is the primary goal, however, consistent evidence suggests that cover crop mixtures may not necessarily be the most effective option. Our results highlight the importance of species selection in cover crop mixture composition. In addition, complementarity can limit the dominance of highly productive species and maximize cover crop biomass and weed suppression. Within Atlantic Canada, cover crops are typically selected for their soil-building properties and to offset declines in soil organic matter (Mann et al. Reference Mann, Lynch, Dukeshire and Mills2021; Nyiraneza et al. Reference Nyiraneza, Thompson, Geng, He, Jiang, Fillmore and Stiles2017). An important consideration of future research will be to assess weed suppression in addition to other agroecosystem services across a range of species and mixture compositions to fully evaluate the contribution of cover crop diversity to Atlantic Canadian cropping systems.
Acknowledgments
The authors wish to thank the many summer students and the Harrington farm crew for their assistance. Funding for this project was provided by the Atlantic Grains Council and Agriculture and Agri-Food Canada project J-002184. The authors declare they have conflicts of interest.
Supplementary material
To view supplementary material for this article, please visit https://doi.org/10.1017/wsc.2022.28


 Open access

