The USA Census Bureau has reported a staggering increase in the elderly population worldwide (i.e. 65 years and older). As of 2015, there are approximately 617 million aged individuals, representing 9 % of the total population(Reference Roberts, Ogunwole and Blakeslee1–3). From a healthcare perspective, a significant concern is the heightened susceptibility of the elderly to disease. In particular, insulin resistance, weight gain, and progressive pancreatic $\beta $
-cell dysfunction are concomitant with the ageing process(Reference De Tata4–Reference Palmer, Gustafson and Kirkland7), and thus ageing is considered an important risk factor for metabolic diseases such as type 2 diabetes (T2D)(8,9) . With T2D prevalence doubled in the elderly (20 % from 9 %) compared with the general population(Reference Saeedi, Petersohn and Salpea10) and the rising life expectancy of the older population(Reference Roberts, Ogunwole and Blakeslee1), T2D in the elderly is a fast-growing public health issue.
$\beta $
-cell dysfunction are concomitant with the ageing process(Reference De Tata4–Reference Palmer, Gustafson and Kirkland7), and thus ageing is considered an important risk factor for metabolic diseases such as type 2 diabetes (T2D)(8,9) . With T2D prevalence doubled in the elderly (20 % from 9 %) compared with the general population(Reference Saeedi, Petersohn and Salpea10) and the rising life expectancy of the older population(Reference Roberts, Ogunwole and Blakeslee1), T2D in the elderly is a fast-growing public health issue.
Lifestyle intervention is considered to be the most effective strategy to prevent metabolic diseases, even compared with traditional medication regimens(Reference Eddy, Schlessinger and Kahn11–Reference Knowler, Barrett-Connor and Fowler15). For example, physical activity, weight loss, and restriction of total energy or macronutrients consumed (e.g. carbohydrates) are commonly employed to combat metabolic abnormalities(Reference Andersen and Fernandez16). Recently, manipulation of dietary fat composition (i.e. fatty acid (FA) profile) to mitigate metabolic impairments has also become of considerable scientific interest. The benefits of supplementing the diet with cold-water fatty fish or its derived oils are well-established, underscoring the favourable physiologic effects of long-chain n-3 FAs (i.e. EPA, 20:5 and DHA, 22:6)(Reference Jump17–Reference Natto, Yaghmoor and Alshaeri19). Furthermore, epidemiological studies indicate that consumption of full-fat dairy products, with a uniquely complex dietary FA composition (> 400 FAs(Reference Månsson20); short-, odd- and branched-chain FAs, 18:1 and 18:2 trans isomers)(Reference Unger, Bourne and Walsh21), can reduce metabolic derangements and disease risk(Reference Mozaffarian, De Oliveira Otto and Lemaitre22–Reference Santaren, Watkins and Liese25). However, detailed clinical evidence and mechanistic data validating this relationship are not available. Additionally, the impact of consumption of plant-derived n-3 and n-6 FAs on T2D susceptibility is not clear(Reference Mahendran, Ågren and Uusitupa26–Reference Wanders, Blom and Zock29). Echium oil is a promising source of pro-health FAs(Reference Lee, Ivester and Hester27,Reference Kavanagh, Flynn and Jenkins30) because of its unusually high content of α-linolenic acid (18:3 n-3), stearidonic acid (18:4 n-3), and $\gamma $
-linolenic acid (18:3 n-6)(Reference Unger, Jetton and Kraft31), an n-6 FA with purported anti-inflammatory properties(Reference Johnson, Swan and Surette32). Importantly, whether or not chronic consumption of beneficial FAs can protect against metabolic abnormalities and disease development during ageing is unclear.
$\gamma $
-linolenic acid (18:3 n-6)(Reference Unger, Jetton and Kraft31), an n-6 FA with purported anti-inflammatory properties(Reference Johnson, Swan and Surette32). Importantly, whether or not chronic consumption of beneficial FAs can protect against metabolic abnormalities and disease development during ageing is unclear.
We sought to determine whether long-term effects of diets differing in fat quality influence metabolic derangements associated with T2D risk in male and female CD-1® mice. We hypothesised that dietary supplementation with fish-, dairy- and echium oil would attenuate metabolic impairments induced by consumption of a fat with a FA composition representative of the average U.S. American diet. Our specific objectives were to (i) measure glucose tolerance and insulin sensitivity every 3 months of experimental feeding, (ii) assess the effects of dietary fat quality, sex, and age on glucose tolerance and insulin sensitivity and (iii) investigate potential diet-induced biological mechanisms influencing glucose tolerance and insulin sensitivity in CD-1® mice.
Experimental methods
Animals and experimental design
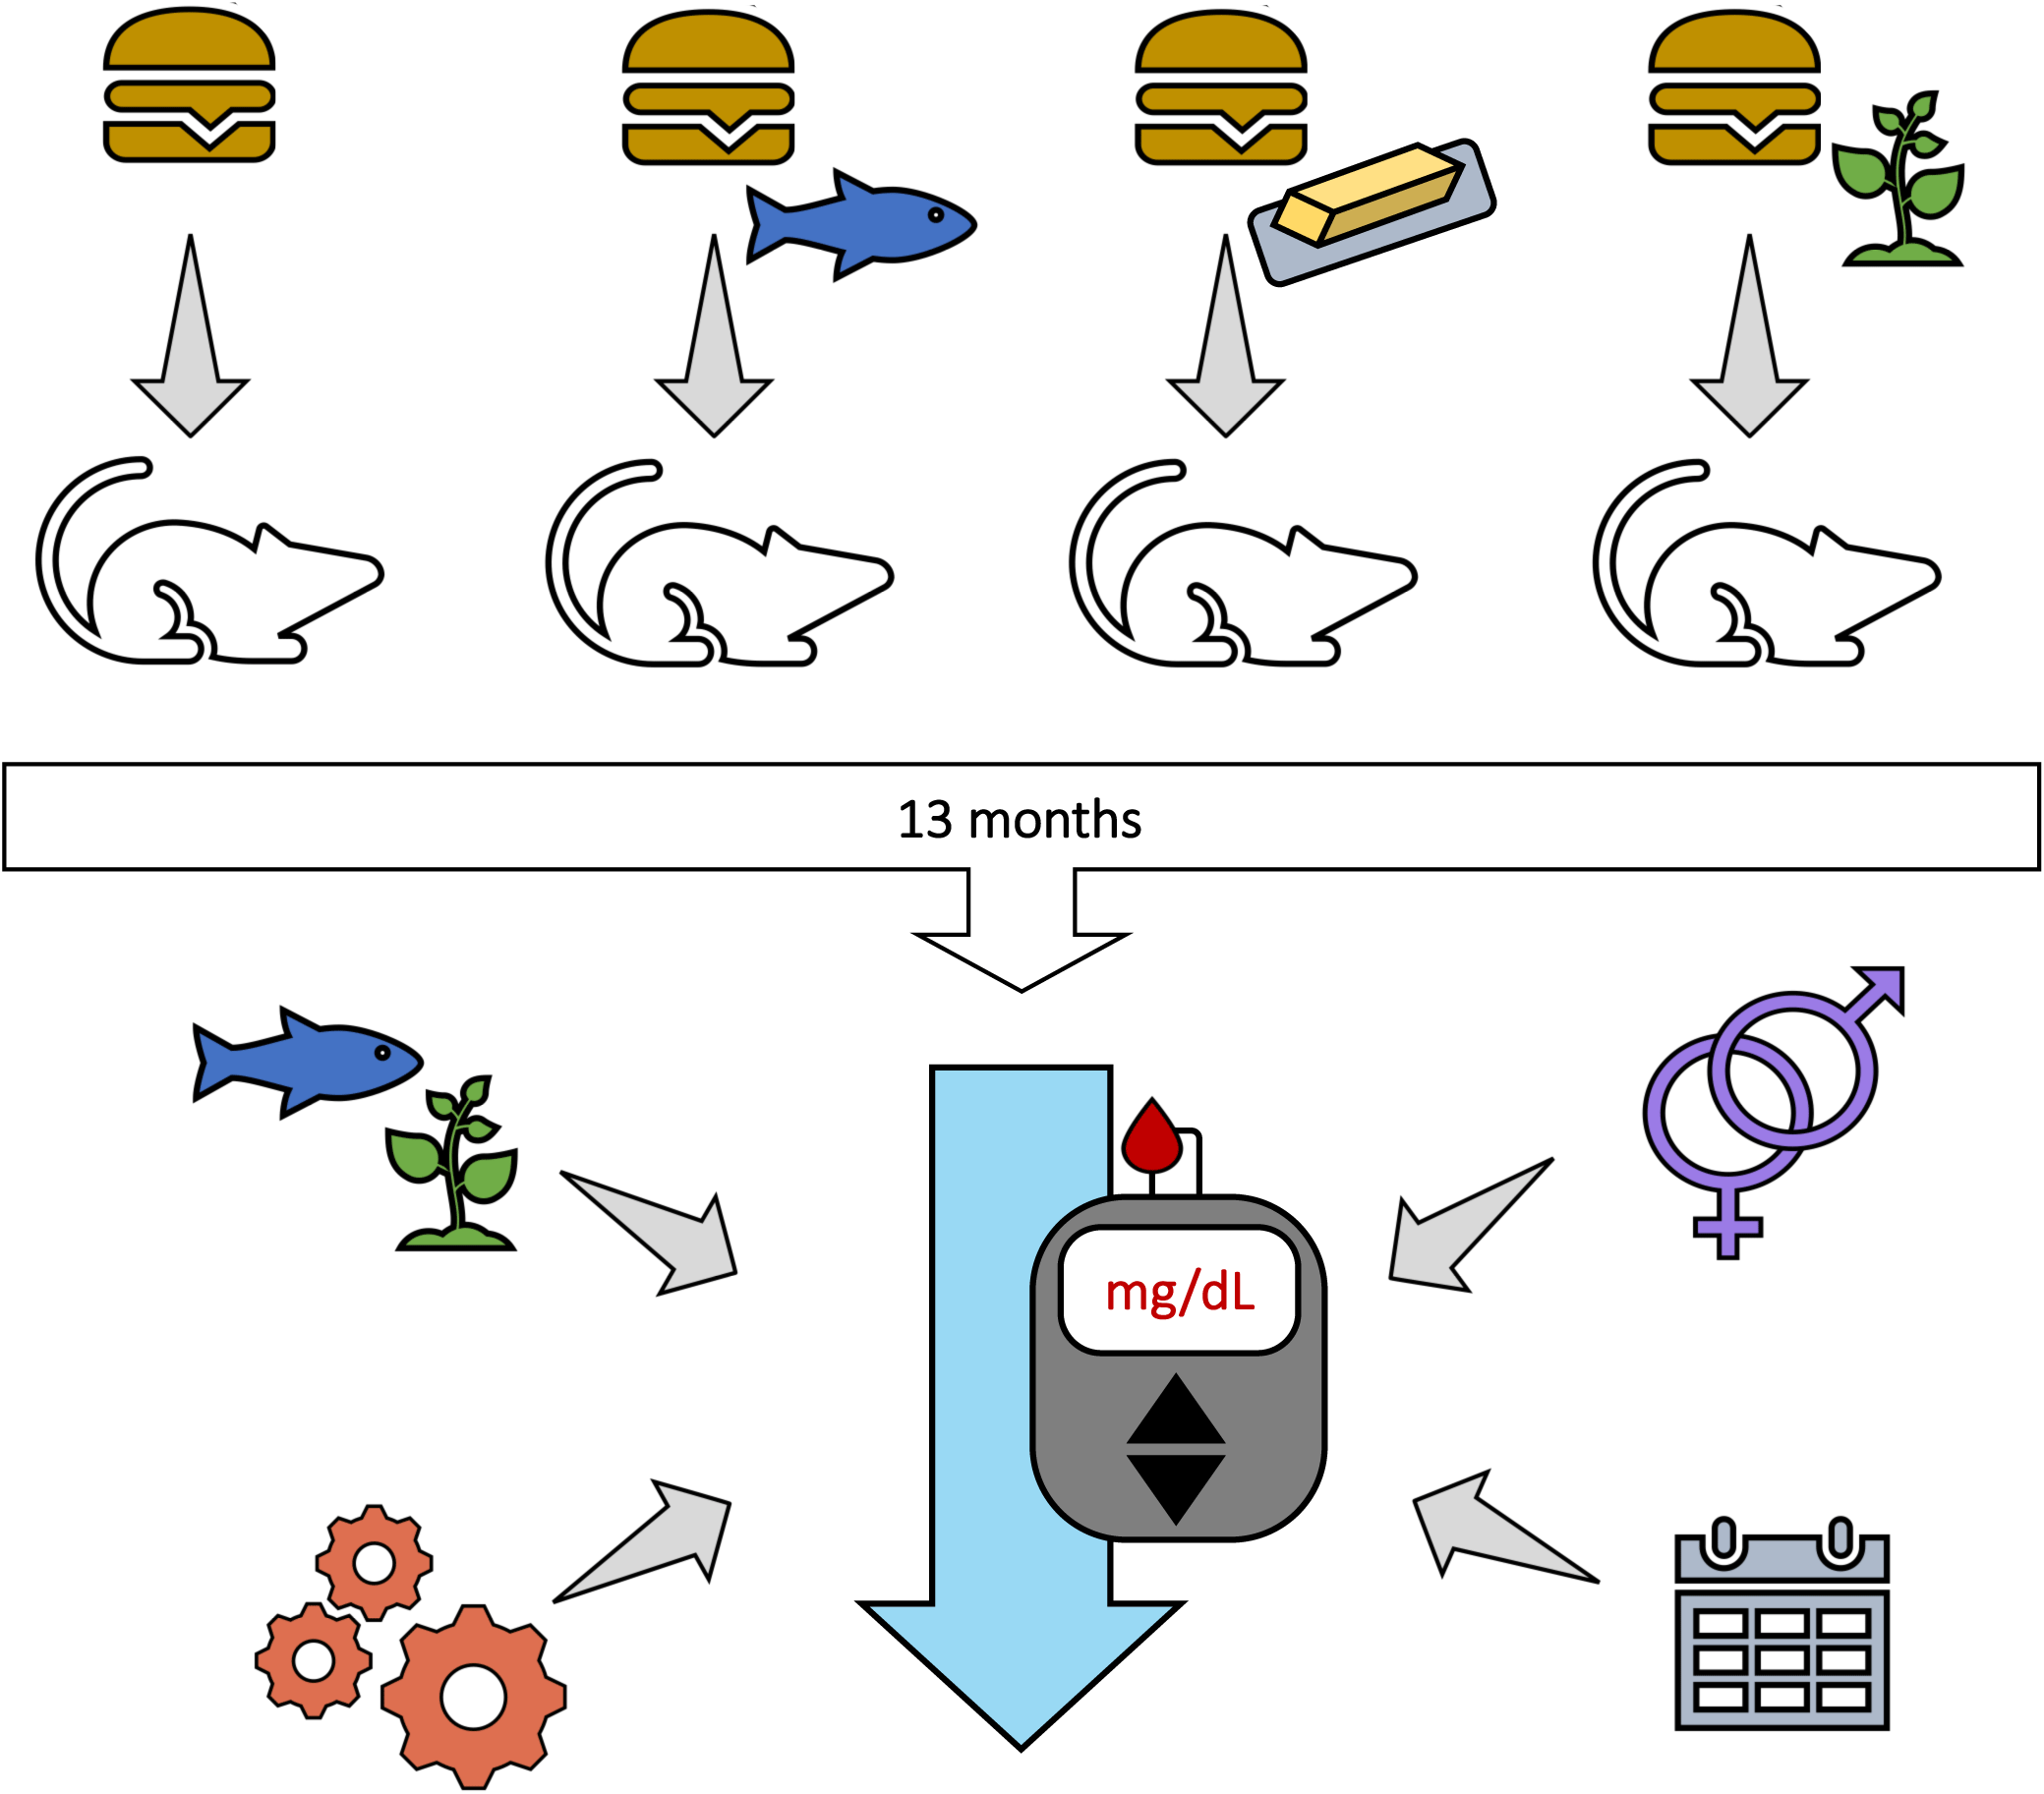
The outbred CD-1® mouse stock (IGS #022) was chosen as a preclinical model to assess the metabolic effects of a long-term nutritional intervention throughout different life stages because of its genetic heterogeneity(33) (representative of a human population) and documented longevity(Reference Maita, Hirano and Harada34). After weaning (3 weeks of age), male and female CD-1® mice (n = 81, n = 40–41 per sex) were shipped from Charles River (Raleigh, NC, USA) to The University of Vermont (Colchester, VT, USA). Upon arrival, mice were immediately randomised (no specific randomisation technique used) into same-sex pairs and one group of three male cage mates. Cages were kept in ventilated racks (Thorens Caging Systems, Hazelton, PA, USA) on a 12 h light/dark cycle at 23·6°C with 64 % humidity. Wooden blocks and igloo shelters were provided as enrichment.
For 1 week, while mice adjusted to their new housing conditions, mice were fed a standard laboratory pelleted chow (26 % protein, 60 % carbohydrate, and 14 % fat; LabDiet, St. Louis, MO, USA). At 4 weeks of age, mice (n = 10–11 per sex/diet group) were switched over to one of four isoenergetic high-fat (40 % of total energy) diets. Investigators were not blinded to the group allocation for any stage of the experiment but were blinded during analysis. Mice consumed their designated diets until the conclusion of the study (14 months of age). Throughout the study, mice had ad libitum access to feed and water.
All experimental procedures with animals were approved by and performed in accordance with The University of Vermont Institutional Animal Care and Use Committee (protocol #16–007). Animal protocols also adhered to the ARRIVE Guidelines for Reporting Animal Research (The ARRIVE Essential 10 and The Recommended Set)(Reference Kilkenny, Browne and Cuthill35).
Experimental diets
Experimental diets were formulated to be equivalent to one another with respect to macronutrients (protein, carbohydrate, and fat as 17, 43, and 40 % energy, respectively) and differed only in FA composition (Table 1). Each experimental diet was designed to supply 40 % of daily kcal as fat, 5 % greater than what is generally recommended by USA dietary guidelines(36), yet still feasible for human consumption. The fat content in the control diet (CO) was composed of an in-house designed USA fat blend, formulated to mimic the FA composition of the average U.S. American diet(Reference Ervin, Wright and Wang37). The fat content of the other three experimental diets contained 70 % of the USA fat blend and 30 % of a supplementary fat source, either (i) dairy fat derived from butter oil (BO diet), (ii) echium oil from the seed of Echium plantagineum (EO diet) or (iii) fish (menhaden) oil (FO diet). Supplementation of the BO-, EO- and FO-diet with 30 % of the respective fat source intentionally sought to represent a dietary pattern whereby an average U.S. American substitutes fat derived from dairy, echium or fish in place of a portion of their typical fat source. In-house preparation and FA analysis of the experimental fat blends(Reference Unger, Eckstrom and Jetton38) and a complete composition and ingredient list of the experimental pelleted diets(Reference Unger, Jetton and Kraft31) (formulated by Research Diets, Inc. (Brunswick, NJ, USA)) have been previously described.
Composition (g/kg) of experimental high-fat diets

BCFAs, branched-chain fatty acids. CO, 100 % USA fat blend. FO, 70 % CO supplemented with 30 % fish oil. BO, 70 % CO supplemented with 30 % dairy (butter) fat. EO, 70 % CO supplemented with 30 % echium oil. FA, fatty acid.
* Formulated by Research Diets Inc.
† USA fat blend consisted of lard, walnut oil, high-oleic sunflower oil, coconut oil and palm oil in a ratio of 18·8:3·6:2·8:1·8:1·0.
‡ Fish oil supplement was derived from menhaden and supplied by Research Diets Inc.
§ Analysis of FAs was performed via gas-liquid chromatography as described in Unger et al. (Reference Unger, Jetton and Kraft31). Data presented as 0 g/kg of diet signify <0·5 g/kg.
|| Dairy-derived FAs include the sum of 4:0–11:0, 13:0 iso, 13:0 aiso, 14:0 iso, 15:0, 15:0 iso, 15:0 aiso, 16:0 iso, 16:1 t9, 17:0, 17:0 iso, 17:0 aiso, 18:0 iso, 18:1 trans isomers, 18:2 trans isomers and 18:2 conjugated isomers.
¶ Short- and medium-chain FAs include the sum of dairy-derived FAs 4:0–11:0.
** BCFAs include the sum of 13:0 iso, 13:0 aiso, 14:0 iso, 15:0 iso, 15:0 aiso, 16:0 iso, 17:0 iso, 17:0 aiso and 18:0 iso.
†† Echium-derived FAs include the sum of 18:3 c6,c9,c12 (n-6), 18:3 c9,c12,c15 (n-3) and 18:4 c6,c9,c12,c15 (n-3).
‡‡ Fish-derived FAs include the sum of 20:5 c5,c8,c11,c14,c17 (n-3), 22:5 c7,c10,c13,c16,c19 (n-3), and 22:6 c4,c7,c10,c13,c16,c19 (n-3).
Parameters of health and glucose homoeostasis
Each mouse was considered an experimental unit. For the duration of the study, feed intake and body weight were measured to assess growth and health. Feed intake was evaluated weekly on a cage basis. Body weight was measured every week for the first 3 months and subsequently every month. If an animal was observed to rapidly lose a significant amount of weight (10–20 % of body weight within one month), animals were euthanised.
Every month during the intervention, whole blood was collected via tail-nick for determination of fed (09.00) glucose and insulin concentrations. In addition, mice were subjected to intraperitoneal glucose tolerance tests (GTTs) and insulin tolerance tests (ITTs) every 3 months to evaluate glucose homoeostasis and insulin sensitivity. These procedures have been previously described in detail in Unger et al. (Reference Unger, Eckstrom and Jetton39). Briefly, after a 6 h fast, GTTs (120 min in duration) began with an intraperitoneal injection of sterile 2 g/kg glucose (Sigma-Aldrich, St. Louis, MO, USA). The Zeitgeber time was 3 (i.e. 10.00, as lights on in our facility is 07.00) for both glucose and ITTs; thus, food removal and cage changes commenced at 04.00 (Zeitgeber time of 21) for a 6 h fast. From this procedure, the following measurements were assessed: fasted glucose and insulin, homoeostatic model of insulin resistance (HOMA-IR), GTT area under the curve of glucose (AUC), and final (120 min) blood glucose measurement of GTT. Similarly, fasted mice were challenged during ITTs (60 min in duration) with intraperitoneal administration of insulin (Humulin® R (U-100); 0·75 U/kg; Eli Lilly and Company, Indianapolis, IN, USA). From this procedure, the following measurements were assessed: ITT AUC, final (60 min) blood glucose measurement of ITT, and percent change in blood glucose during ITT.
To minimise potential confounding of results, such as treatment order, during procedures and measurements, two to three cages of each sex and treatment group were assessed together. Procedures and measurements were then staggered over the course of approximately 1 week. In this manner, procedure day and procedure time of day were controlled for each treatment group and sex. For example, fasting of mice on a cage basis as preparation for GTTs and ITTs was staggered every 20 min beginning at 04.00, with glucose or insulin administration, respectively, staggered accordingly starting at 10.00 to achieve a 6-h fast.
Colonic bacterial composition
The effects of the experimental diets on the colonic bacterial composition (relative abundance and diversity indices) in this cohort of mice, assessed at 10·5 and 13·5 months of age, have been established previously(Reference Unger, Eckstrom and Jetton38). To examine the relationship between dietary fat quality, metabolic health, and colonic bacteria, we performed correlation tests between parameters of glucose homoeostasis at 12 months of experimental feeding with published data of colonic bacterial composition measured before harvest (13·5 months of age).
Tissue collection and analysis
We also sought to correlate dietary FA tissue content with metabolic responses to the experimental diets. Previous measurements of diet-derived FAs (percent of total FA methyl esters) into body tissues collected at harvest (14 months of age) have been reported in Unger et al. (Reference Unger, Jetton and Kraft31).
Measurement of circulating estradiol
Circulating estradiol (E2) concentrations were measured in a subset of female mice at sexual maturity (5 months of age) and at harvest (14 months of age). Plasma E2 was measured via a commercial murine E2 ELISA kit (Calbiotech Inc., El Cajon, CA, USA) following the protocol provided by the manufacturer.
Statistical analysis
All data, except for plasma E2 concentrations, were analysed via linear mixed model with an unstructured covariance in IBM SPSS Statistics for Macintosh, Version 25.0 (MIXED function; IBM Corp., Armonk, NY, USA). Diet, sex, and time (age) were included as fixed effects, while body weight was included as a covariate. Normality in the distribution of residuals in the model was evaluated via Q-Q plots, and data that were not normally distributed were transformed. The following dependent variables were transformed as follows: feed efficiency, body weight, body weight gain, ITT AUC via square root; fed glucose and insulin, fasted glucose and insulin, GTT AUC, HOMA-IR, and final blood glucose measurement of GTT and ITT via log. If significance for a main effect or an interaction between two main effects on a dependent variable was present, unadjusted pairwise differences (COMPARE function) were examined. An unadjusted post hoc test was specifically chosen due to the large number of interactions in the model. Spearman correlations were performed in R (version 3.4.2). For all data, significance was determined as P < 0·05, and a trend was determined as P = 0·05–0·10. Non-transformed data are stated in all tables and figures. Heat maps for correlations were generated in R (version 3.4.2), and all other graphic visualisations of the data were created with GraphPad Prism version 7·00 (GraphPad Software, La Jolla, CA, USA). Plasma E2 concentrations at 5 and 14 months of age in females were compared via a two-sample t test in JMP® (Version 15, SAS Institute Inc., Cary, NC, USA).
Sample size determinations were performed using an Excel-based power calculator(40) and considering 10 % attrition. The minimum number of mice required for these studies was based on our previous study in chronically diet-induced obese mice(Reference Gupta, Jetton and LaRock41), whereby frank insulin resistance was initially detectable by ITT, yielding an effect size of ∼0·5. This was based on a two-sided t test (P of 0·05 at 80 % power).
During statistical analysis, outcome measurements were not available, and thus not included, for a given animal if premature mortality occurred. For example, when analysing parameters of glucose homoeostasis derived from GTTs and ITTs, there were five animal mortalities due to euthanasia secondary to severe weight loss (n = 1, BO-fed male), fatal fight wounds (n = 1, FO-fed male), coronary blood clot (n = 1, CO-fed male), atrial thrombosis (n = 1, EO-fed female), and an unknown cause (n = 1, CO-fed female). Data points for parameters of glucose homoeostasis were also excluded if the animal failed to respond appropriately to the glucose or insulin challenge (e.g. no change in blood glucose or severe hypoglycaemia, respectively). We attributed an occasional lack of response to technical issues with intraperitoneal injection. Exclusion was made without consideration of assigned treatment or sex of the animal.
Results
Feed intake, weight gain and feed efficiency
Diet had no effect on feed intake, animal weight, weight gain, or feed efficiency of mice (Table 2). As expected, animal weight and weight gain were 60 and 110 % greater in males compared with females, respectively, which was also reflected in a 100 % greater feed efficiency in males (P < 0·001; Table 3). Animal weight and weight gain increased over time (P < 0·001), with a weight gain of 13·3 g by 3 months of experimental feeding and 26·3 g by 12 months of experimental feeding (Table 4). Accordingly, feed efficiency steadily decreased as mice aged (P < 0·001; Table 4). An interaction between the main effects of diet and sex on feed intake (P = 0·004) and weight gain (P = 0·02) of mice revealed that diet influenced these outcomes in a sex-specific manner. For instance, feed intake was 18, 21, and 18 % greater in FO-, BO-, and EO-fed males, respectively, compared with CO-fed males (3·48, 3·57, and 3·48 g v. 2·94 g, respectively, P < 0·05; Fig. 1(a)). Similarly, weight gain was 34, 52, and 42 % greater in FO-, BO-, and EO-fed males, respectively, compared with CO-fed males (28·7, 32·5, and 30·3 g v. 21·4 g, respectively, P < 0·05; Fig. 1(b)). Yet, these comparative differences were not observed for feed efficiency (Fig. 1(c)). Of note, we also observed considerable heterogeneity in weight (online Supplementary Fig. 1) and weight gain (Supplementary Fig. 2) in both male and female CD-1® mice in response to varying dietary fat quality. In sum, diet influenced feeding behaviour and weight gain differently in males v. females.
Daily feed intake, feed efficiency, body weight, and parameters of glucose homoeostasis of CD-1® mice fed one of four experimental isoenergetic high-fat (40 % fat of total energy) diets

CO, diet composed of 100 % USA fat blend; FO, diet composed of 70 % USA fat blend and 30 % fish (menhaden) oil; BO, diet composed of 70 % USA fat blend and 30 % dairy (butter oil) fat; EO, diet composed of 70 % USA fat blend and 30 % echium oil. D, diet; S, sex; T, time (month of data collection); GTT, glucose tolerance test; ITT, insulin tolerance test.
* Values are expressed as mean ± standard error of the mean and are collapsed by sex and time. Data were collected at 3, 6, 9, and 12 months of experimental feeding. Means without a common letter differ (P < 0·05).
† Feed efficiency = total weight gain (g)/total feed intake (kcal).
‡ HOMA-IR, homoeostatic model of assessment of insulin resistance = (glucose0 min × insulin0 min)/405.
§ % change from baseline = ((Final blood glucose – initial blood glucose)/initial blood glucose)) × 100.
Daily feed intake, feed efficiency, body weight, and parameters of glucose homoeostasis of male and female CD-1® mice

D, diet; S, sex; T, time (month of data collection); GTT, glucose tolerance test; ITT, insulin tolerance test.
* Values are expressed as mean ± standard error of the mean and are collapsed by diet and time. Means without a common letter differ (P < 0·05). Data were collected at 3, 6, 9, and 12 months of experimental feeding.
† Feed efficiency = total weight gain (g)/total feed intake (kcal).
‡ HOMA-IR, homoeostatic model of assessment of insulin resistance = (glucose0 min × insulin0 min)/405.
§ % change from baseline = ((Final blood glucose – initial blood glucose)/initial blood glucose)) × 100.
Daily feed intake, feed efficiency, body weight, and parameters of glucose homoeostasis of CD-1® mice at 3, 6, 9 and 12 months of experimental feeding

D, diet; S, sex; T, time (month of data collection); GTT, glucose tolerance test; ITT, insulin tolerance test.
* Values are expressed as mean ± standard error of the mean and are collapsed by diet and sex. Means without a common letter differ (P < 0·05).
† Feed efficiency = total weight gain (g)/total feed intake (kcal).
‡ Results of statistical analysis similar when data from month 12 is excluded.
§ HOMA-IR, homoeostatic model of assessment of insulin resistance = (glucose0 min × insulin0 min)/405.
|| % change from baseline = ((Final blood glucose – initial blood glucose)/initial blood glucose)) × 100.
Feed intake (a), body weight gain (b), and feed efficiency (c) of male and female of CD-1® mice fed one of four experimental isoenergetic high-fat (40 % fat of total energy) diets with fat content consisting of either 100 % USA fat blend (CO) or 70 % USA fat blend and 30 % fish oil (FO), dairy fat (BO), or echium oil (EO), respectively. Values are expressed as mean ± standard error of the mean from data collected at 3, 6, 9, and 12 months of experimental feeding. † = P = 0·07, males v. females collapsed by diet and time. ***P < 0·001, males v. females collapsed by diet and time. & = P < 0·05, FO-, BO-, or EO-fed males v. CO-fed males collapsed by time. # = P < 0·05, BO-fed females v. CO-fed females collapsed by time. Data were analysed via linear mixed model with an unstructured covariance, specifying diet, sex, and time as fixed effects and body weight as covariate when appropriate. ![]() , CO;
, CO; ![]() , FO;
, FO; ![]() , BO;
, BO; ![]() , EO.
, EO.

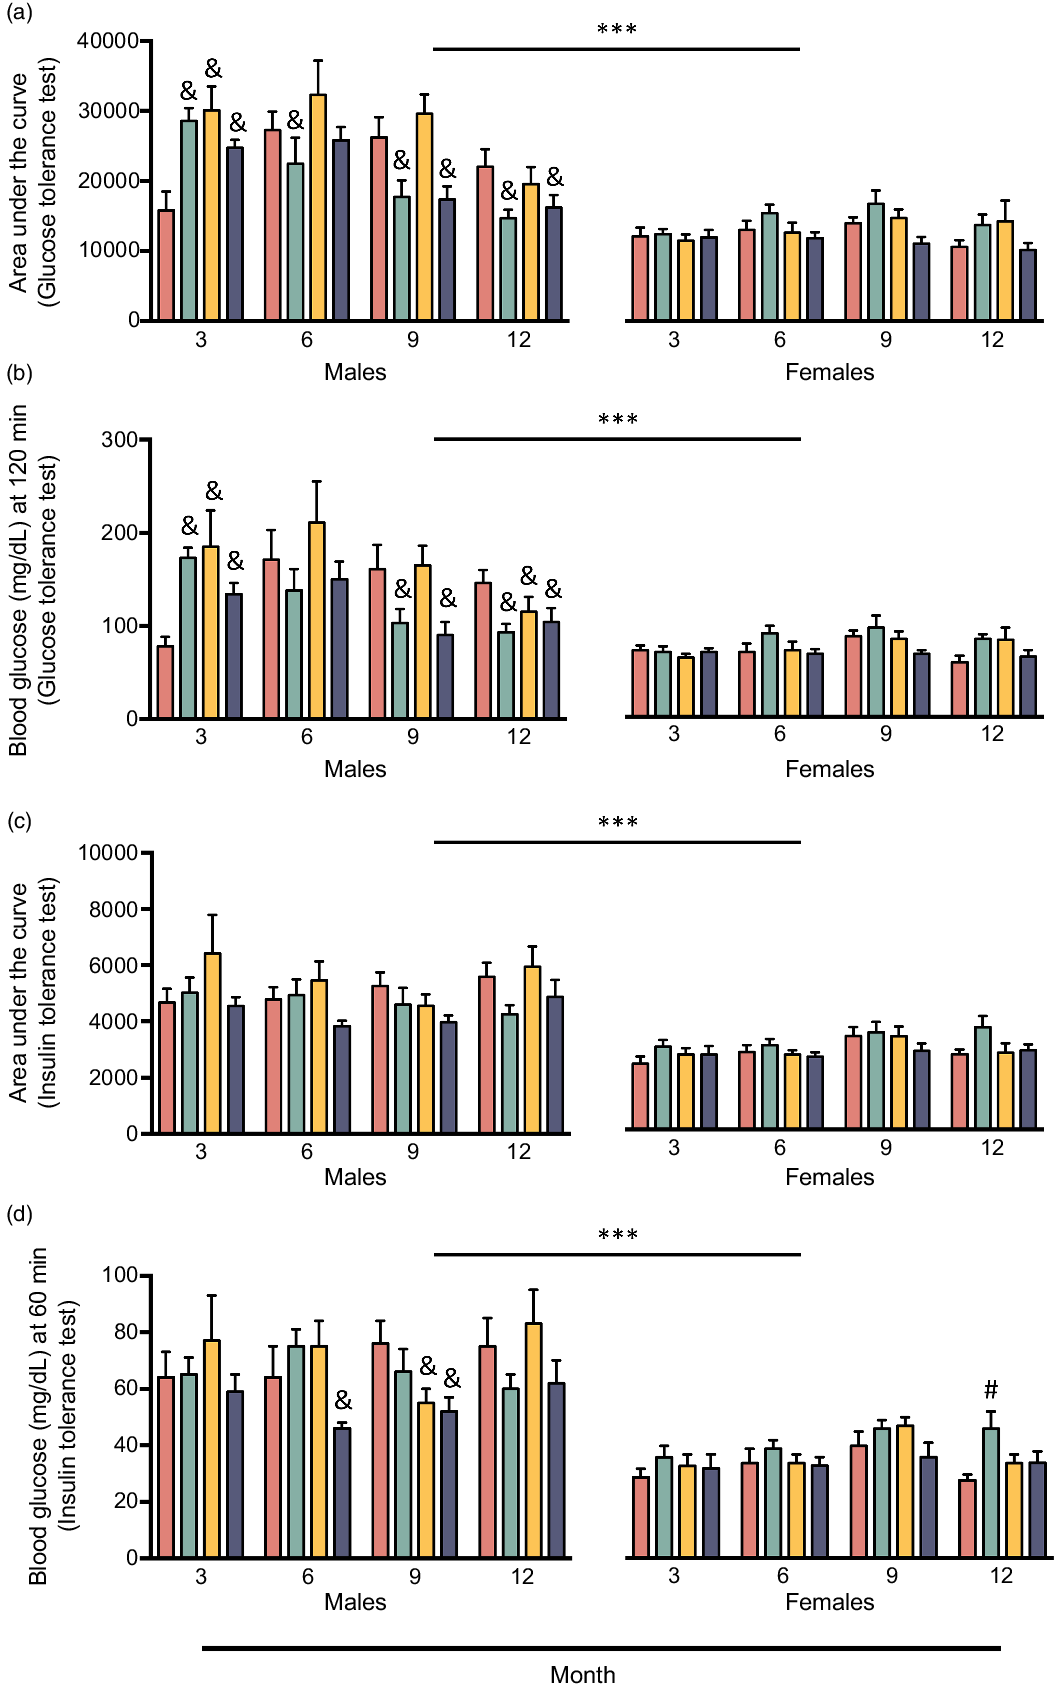
Area under the curve of glucose tolerance test (a), final blood glucose measurement of glucose tolerance test (b), area under the curve of insulin tolerance test (c), and final blood glucose measurement of insulin tolerance test (d) of male and female CD-1® mice at 3, 6, 9, and 12 months of feeding one of four experimental isoenergetic high-fat (40 % fat of total energy) diets with fat content consisting of either 100 % USA fat blend (CO) or 70 % USA fat blend and 30 % fish oil (FO), dairy fat (BO), or echium oil (EO), respectively. Values are expressed as mean ± standard error of the mean. ***P < 0·001, males v. females collapsed by diet and time. & = P < 0·05, FO-, BO-, or EO-fed males v. CO-fed males within each respective month. # = P < 0·05, FO-fed females v. CO-fed females within the respective month. Data were analysed via linear mixed model with an unstructured covariance, specifying diet, sex, and time as fixed effects and body weight as covariate when appropriate. ![]() , CO;
, CO; ![]() , FO;
, FO; ![]() , BO;
, BO; ![]() , EO.
, EO.
Parameters of glucose tolerance and insulin sensitivity
The final blood glucose measurement of ITT was 10 % lower in EO-fed mice than in CO-fed mice (P < 0·05), an indicator that EO-fed mice exhibited improved peripheral insulin sensitivity (Table 2). In addition, ITT AUC tended to be lower in EO-fed mice (7 %) compared with CO-fed mice (P = 0·07). By all metrics used to assess glucose homoeostasis in this study, except percent change from baseline in blood glucose during ITT, glucose tolerance and insulin sensitivity were greater in females compared with males, regardless of diet (P ≤ 0·001; Table 3). Unexpectedly, when examining the effect of time (i.e. age) on parameters of glucose homoeostasis, GTT AUC was found to be 21 % lower at 12 months of experimental feeding than at all other time points (P < 0·05; Table 4), indicating that glucose tolerance improved with age. To investigate this finding further, we examined the interaction between the effects of diet, sex, and time on GTT AUC (P = 0·001) and final blood glucose measurement of GTT (P < 0·001); at 3 months of experimental feeding, FO-, BO-, and EO-fed males had an 81, 90, and 56 % greater GTT AUC, respectively, than CO-fed males (28 565, 30 085, and 24712 v. 15816, respectively, P < 0·05; Fig. 2(a)). Yet, this phenotype disappeared 3 months later, and by 12 months of experimental feeding, FO- and EO-fed males had a 33 % and 26 % lower GTT AUC, respectively, compared with CO-fed males (14 704 and 16 230 v. 22 043, respectively, P < 0·05; Fig. 2(a)). Notably, no diet-induced changes over time were detected in females. Similar results were observed for the final blood glucose measurement of GTT (Fig. 2(b)), but no interaction between the effects of diet, sex, and age was found for ITT AUC (Fig. 2(c)). Compared with CO-fed males, EO-fed males had a lower final blood glucose measurement of ITT at 6 months (28 % difference, 64 v. 46 mg/dl, respectively, P < 0·05) and at 9 months (32 % difference, 76 v. 52 mg/dl, respectively, P < 0·05) of experimental feeding. However, there were no differences at 12 months of experimental feeding (Fig. 2(d)). Taken together, long-term supplementation of dietary fat with sources of unique FA compositions, particularly fish and echium oil, may beneficially modulate glucose homoeostasis in a sex- and age-dependent manner.
Correlations of parameters of glucose homoeostasis with tissue fatty acids
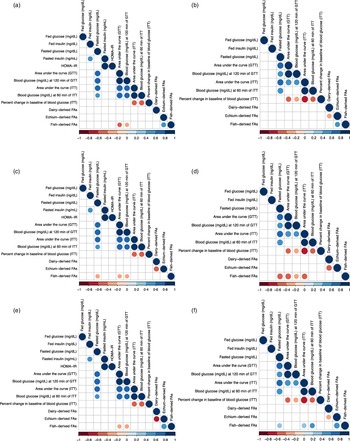
Spearman correlations were performed to assess the relationship between parameters of glucose homoeostasis at 12 months of experimental feeding and dietary FA content measured in insulin-sensitive tissues at time of harvest (14 months of age), i.e. liver (Fig. 3(a) and 3(b)), muscle (Fig. 3(c) and 3(d)) and adipose tissue (Fig. 3(e) and 3(f)). Due to the pronounced sex differences observed in measurements of metabolic health in mice, all correlations for this study were performed separately for males and females. In liver, muscle, and adipose tissue of males, fish-derived FAs were negatively associated with GTT AUC and final blood glucose measurement of GTT ( $\rho $
= –0·36–0·42, P < 0·05), indicating that fish-derived FAs beneficially modulate glucose tolerance. Similar results were found for muscle tissue, but not liver or adipose tissue, of female mice (P < 0·05; Fig. 2(d)). Yet, unexpectedly, the content of fish-derived FAs in adipose tissue of females was positively correlated with ITT AUC (
$\rho $
= –0·36–0·42, P < 0·05), indicating that fish-derived FAs beneficially modulate glucose tolerance. Similar results were found for muscle tissue, but not liver or adipose tissue, of female mice (P < 0·05; Fig. 2(d)). Yet, unexpectedly, the content of fish-derived FAs in adipose tissue of females was positively correlated with ITT AUC ( $\rho $
= 0·37) and final blood glucose measurement of ITT (
$\rho $
= 0·37) and final blood glucose measurement of ITT ( $\rho $
= 0·41, P < 0·05). Overall, diet-derived FAs in tissue may play a role in glucose tolerance and insulin sensitivity; however, this effect may be more pronounced in males than females.
$\rho $
= 0·41, P < 0·05). Overall, diet-derived FAs in tissue may play a role in glucose tolerance and insulin sensitivity; however, this effect may be more pronounced in males than females.
Spearman correlation matrices between metabolic parameters determined at 12 months of experimental feeding and fatty acids measured in liver tissue of male (a), liver tissue of female (b), muscle tissue of male (c), muscle tissue of female (d), adipose tissue of male (e), and adipose tissue of female (f) CD-1® mice at harvest (14 months of age). A positive correlation (closer to 1) is signified by a darker shade of blue; a negative correlation (closer to –1) is signified by a darker shade of red (P < 0·05). HOMA-IR, homoeostatic model of assessment of insulin resistance = (glucose0 min × insulin0 min)/405. GTT, glucose tolerance test. ITT, insulin tolerance test. Percent change in baseline = ((Final blood glucose – initial blood glucose)/initial blood glucose)) × 100. FAs, fatty acids. Dairy-derived FAs include the sum of 15:0, 16:1 t9, 17:0, 18:1 t11, and 18:1 c9,t11. Echium-derived FAs include the sum of 18:3 c6,c9,c12 (n-6), 18:3 c9,c12,c15 (n-3), and 18:4 c6,c9,c12,c15 (n-3). Fish-derived FAs include the sum of 20:5 c5,c8,c11,c14,c17 (n-3), 22:5 c7,c10,c13,c16,c19 (n-3), and 22:6 c4,c7,c10,c13,c16,c19 (n-3). Variables of fasted insulin and HOMA-IR were not included in analysis with females due to the low number of observations.

Correlations of parameters of glucose homoeostasis with colonic bacterial composition
In males, the abundance of the colonic genera Clostridium and Oscillospira was negatively correlated with fasting glucose ( $\rho $
= –0·52 and –0·45, respectively, P < 0·05; (Fig. 4(a)). In addition, observed genera (an index of α diversity) were negatively associated with fasted insulin (
$\rho $
= –0·52 and –0·45, respectively, P < 0·05; (Fig. 4(a)). In addition, observed genera (an index of α diversity) were negatively associated with fasted insulin ( $\rho $
= –0·60) and HOMA-IR (ρ = –0·56), while Akkermansia, Bacteroides, and Parabacteroides were all positively associated with AUC GTT (ρ = 0·44–0·52) in males (P < 0·05). In females, abundance of Ruminococcus and Turicibacter was negatively correlated with fed glucose and fed insulin, respectively (ρ = –0·55 and –0·56, respectively, P < 0·05; (Fig. 4 (b)). Abundance of Lachnoclostridium, Parabacteroides, and Roseburia and observed genera were positively associated with final blood glucose measurement of ITT in females (ρ = 0·52–0·67, P < 0·05). Furthermore, Eubacterium positively correlated with fed insulin in both male and female mice (ρ = 0·45 and 0·67, respectively, P < 0·05). Collectively, abundance and diversity of specific colonic bacteria were associated with metabolic health in a sex-specific fashion.
$\rho $
= –0·60) and HOMA-IR (ρ = –0·56), while Akkermansia, Bacteroides, and Parabacteroides were all positively associated with AUC GTT (ρ = 0·44–0·52) in males (P < 0·05). In females, abundance of Ruminococcus and Turicibacter was negatively correlated with fed glucose and fed insulin, respectively (ρ = –0·55 and –0·56, respectively, P < 0·05; (Fig. 4 (b)). Abundance of Lachnoclostridium, Parabacteroides, and Roseburia and observed genera were positively associated with final blood glucose measurement of ITT in females (ρ = 0·52–0·67, P < 0·05). Furthermore, Eubacterium positively correlated with fed insulin in both male and female mice (ρ = 0·45 and 0·67, respectively, P < 0·05). Collectively, abundance and diversity of specific colonic bacteria were associated with metabolic health in a sex-specific fashion.
Spearman correlation matrices between metabolic parameters determined at 12 months of experimental feeding, diversity indices of colonic bacteria measured before harvest (13·5 months of age), and abundance by counts of colonic bacterial genera (mean relative abundance > 1 %) measured before harvest (13·5 months of age) of male (a) and female (b) CD-1® mice. A positive correlation (closer to 1) is signified by a darker shade of blue; a negative correlation (closer to –1) is signified by a darker shade of red (P < 0·05). HOMA-IR, homoeostatic model of assessment of insulin resistance = (glucose0 min × insulin0 min)/405. GTT, glucose tolerance test. ITT, insulin tolerance test. Percent change in baseline = ((Final blood glucose – initial blood glucose)/initial blood glucose)) × 100. Variables of fasted insulin and HOMA-IR were not included in analysis with females due to the low number of observations.

Assessment of plasma estradiol concentration
To evaluate whether females were reproductively senescent at the end of the study, we compared circulating E2 concentrations in a subset of female mice at a time of sexual maturity and again when aged (i.e., 5 and 14 months of age, respectively). As expected, plasma E2 concentrations were lower as female mice aged (P < 0·01; online Supplementary Fig. 3).
Discussion
Ageing is a significant risk factor in the development of metabolic diseases such as T2D, yet, there is a lack of effective lifestyle prevention strategies to protect against age-related metabolic impairments. Research shows that diet, and specifically dietary fat quality, can significantly influence glucose homoeostasis, however, whether or not life-long consumption of beneficial FAs can attenuate glucose intolerance and insulin resistance during ageing is not clear. Our study therefore aimed to evaluate whether long-term supplementation of a diet with fish oil, dairy fat, or echium oil attenuates age-related glucose intolerance and insulin resistance induced by consumption of a FA composition mixture representative of the average U.S. American diet in outbred mice.
A principal finding of our work is the prominent sexual divergence in the metabolic response of mice to diets varying in fat quality. Diet per se had a minimal impact on parameters of glucose homoeostasis, but when males and females were assessed separately, we observed that dietary fat quality influenced glucose tolerance notably in males but not females. In particular, consumption of echium oil or fish oil had a protective effect against deterioration of glucose tolerance in males. Echium oil is a seed oil that may have unique health properties due to its high content of PUFAs, particularly ∝-linolenic acid and stearidonic acid (both n-3 FAs), as well as $\gamma $
-linolenic acid (n-6 FA)(Reference Unger, Jetton and Kraft31). Studies in rodents(Reference Zhang, Boudyguina and Wilson42–Reference Forrest, Boudyguina and Wilson44) and humans(Reference Surette, Edens and Chilton45,Reference Kuhnt, Fuhrmann and Köhler46) indicate that the primary physiologic benefits of echium oil are its lowering effect on cholesterol and/or triacylglycerol blood concentrations, likely by modulating transcription of hepatic genes related to lipogenesis(Reference Zhang, Boudyguina and Wilson42,Reference Shewale, Boudyguina and Zhu43) and inflammation(Reference Shewale, Boudyguina and Zhu43). Of note, Kavanagh et al. (Reference Kavanagh, Flynn and Jenkins30) showed that dietary echium oil promoted glucose disposal in aged, hyperglycaemic and hyperinsulinaemic monkeys, which aligns with our work showing that EO-fed mice, regardless of sex, lowered blood glucose following an insulin bolus. We and others have shown that consumption of echium oil-derived stearidonic acid results in an increased tissue content of downstream long-chain n-3 FAs (e.g. EPA)(Reference Unger, Jetton and Kraft31,Reference Kuhnt, Weiß and Kiehntopf47) , which are known to impart health benefits by modulating atherogenic risk factors(Reference Natto, Yaghmoor and Alshaeri19,Reference Harris48–Reference De Luis, Conde and Aller50) . Additionally, research also suggests that
$\gamma $
-linolenic acid (n-6 FA)(Reference Unger, Jetton and Kraft31). Studies in rodents(Reference Zhang, Boudyguina and Wilson42–Reference Forrest, Boudyguina and Wilson44) and humans(Reference Surette, Edens and Chilton45,Reference Kuhnt, Fuhrmann and Köhler46) indicate that the primary physiologic benefits of echium oil are its lowering effect on cholesterol and/or triacylglycerol blood concentrations, likely by modulating transcription of hepatic genes related to lipogenesis(Reference Zhang, Boudyguina and Wilson42,Reference Shewale, Boudyguina and Zhu43) and inflammation(Reference Shewale, Boudyguina and Zhu43). Of note, Kavanagh et al. (Reference Kavanagh, Flynn and Jenkins30) showed that dietary echium oil promoted glucose disposal in aged, hyperglycaemic and hyperinsulinaemic monkeys, which aligns with our work showing that EO-fed mice, regardless of sex, lowered blood glucose following an insulin bolus. We and others have shown that consumption of echium oil-derived stearidonic acid results in an increased tissue content of downstream long-chain n-3 FAs (e.g. EPA)(Reference Unger, Jetton and Kraft31,Reference Kuhnt, Weiß and Kiehntopf47) , which are known to impart health benefits by modulating atherogenic risk factors(Reference Natto, Yaghmoor and Alshaeri19,Reference Harris48–Reference De Luis, Conde and Aller50) . Additionally, research also suggests that $\gamma $
-linolenic acid is another FA constituent in echium oil that favourably influences lipid metabolism(Reference Shewale, Boudyguina and Zhu43). Fish, fish oil, and n-3 FA supplements have been extensively studied as nutritional interventions to protect against metabolic diseases(Reference Natto, Yaghmoor and Alshaeri19,Reference Harris48–Reference De Luis, Conde and Aller50) . In rodents, research suggests that supplementation of marine oils rich in long-chain n-3 FAs to a high-fat diet (45–60 % of total energy) can protect against cardiometabolic risk factors(Reference Caesar, Tremaroli and Kovatcheva-Datchary51–Reference Loehfelm, Rizwan and Tups53). Loehfelm et al. (Reference Loehfelm, Rizwan and Tups53) showed that a high-fat (60 % of total energy) diet enriched with mussel oil prevented diet-induced weight gain in young mice (∼10–12 weeks of age) after 1 week of feeding, and either attenuated weight-gain or decreased weight in lean or obese, respectively, aged mice (∼12 months of age) after 4 weeks of feeding. However, observational studies in humans assessing the effect of fish oil consumption on T2D risk are highly controversial(Reference Wallin, Di Giuseppe and Orsini18). For example, research has generally observed that fish oil intake is associated with an increased risk of T2D in USA populations(Reference Wallin, Di Giuseppe and Orsini18). Here, we demonstrate via a controlled experiment that fish oil supplementation to a base diet with a FA composition reflecting the average U.S. American FA composition can improve metabolic predictors of T2D risk in males.
$\gamma $
-linolenic acid is another FA constituent in echium oil that favourably influences lipid metabolism(Reference Shewale, Boudyguina and Zhu43). Fish, fish oil, and n-3 FA supplements have been extensively studied as nutritional interventions to protect against metabolic diseases(Reference Natto, Yaghmoor and Alshaeri19,Reference Harris48–Reference De Luis, Conde and Aller50) . In rodents, research suggests that supplementation of marine oils rich in long-chain n-3 FAs to a high-fat diet (45–60 % of total energy) can protect against cardiometabolic risk factors(Reference Caesar, Tremaroli and Kovatcheva-Datchary51–Reference Loehfelm, Rizwan and Tups53). Loehfelm et al. (Reference Loehfelm, Rizwan and Tups53) showed that a high-fat (60 % of total energy) diet enriched with mussel oil prevented diet-induced weight gain in young mice (∼10–12 weeks of age) after 1 week of feeding, and either attenuated weight-gain or decreased weight in lean or obese, respectively, aged mice (∼12 months of age) after 4 weeks of feeding. However, observational studies in humans assessing the effect of fish oil consumption on T2D risk are highly controversial(Reference Wallin, Di Giuseppe and Orsini18). For example, research has generally observed that fish oil intake is associated with an increased risk of T2D in USA populations(Reference Wallin, Di Giuseppe and Orsini18). Here, we demonstrate via a controlled experiment that fish oil supplementation to a base diet with a FA composition reflecting the average U.S. American FA composition can improve metabolic predictors of T2D risk in males.
Males have a higher prevalence of T2D than females(Reference Saeedi, Petersohn and Salpea10); however, the differential influence of dietary fat quality on T2D risk by sex is not well characterised. Studies assessing dietary FA content and composition and metabolic health outcomes using animal models have often used only males or females(Reference Shewale, Boudyguina and Zhu43,Reference Forrest, Boudyguina and Wilson44,Reference Caesar, Tremaroli and Kovatcheva-Datchary51,Reference Huang, Leone and Devkota54) , while human trials may not explicitly test the effect of sex(Reference Surette, Edens and Chilton45,Reference Kuhnt, Fuhrmann and Köhler46,Reference Zheng, Lin and Imamura55,Reference Sawada, Tsubata and Hashimoto56) (e.g. sex included as a covariate in statistical analysis). In our study, sex was the most consistent effect on parameters of glucose tolerance and insulin sensitivity, even when considering known risk factors of diet and age. While previous work underscores that sex hormones play an important role in T2D risk(Reference Bonds, Lasser and Qi57–Reference Ding, Song and Manson60), the biological mechanisms underlying the observed differences in metabolic health of male and female mice in our work are not clear. Although mice are not considered elderly until 18 months of age, reproductive senescence begins between the age of 10 and 15 months(Reference Dutta and Sengupta61), and as a result estrogen levels in females begin to decline(Reference Brinton62). Similarly, our work shows that E2 concentrations had declined in aged female mice (i.e. 14 months of age) compared with female mice during sexual maturity. Nevertheless, for the duration of the study and regardless of age, females surprisingly remained more protected against T2D risk than males. Therefore, the significance of circulating sex hormones in the context of our study, particularly as mice aged, should be carefully considered. To fully understand the implications of our work, more long-term studies are warranted, particularly focused on the intersection of dietary fat quality, sex and sex hormones, and T2D risk in a frank elderly population.
We also observed several sex-specific correlations between metabolic parameters and FA content in tissues. Overall, this was expected, as we have observed in this cohort of mice that the distribution of unique FAs derived from fish, dairy, and echium in tissues differed between males and females (these results have been discussed extensively previously(Reference Unger, Jetton and Kraft31)). Notably, we found that the content of fish-derived FAs (i.e. EPA, docosapentaenoic acid, and DHA) in liver, muscle, and adipose tissue correlated with improved glucose tolerance in males, with similar results found in females but in skeletal muscle only. This points to a relationship between diet-derived FAs from fish oil and from echium oil, as we have shown previously in this cohort of mice that echium oil consumption increases tissue content of long-chain n-3 FAs(Reference Unger, Jetton and Kraft31). These results align with the current consensus that fish-derived n-3 FAs are potent regulators of tissue-specific gene expression and function (as reviewed in(Reference Deckelbaum, Worgall and Seo63)). For example, EPA and DHA can beneficially regulate membrane fluidity and signalling pathways when incorporated into the membrane phospholipids, as well as promote homoeostasis by modulating gene expression for lipid metabolism and inflammation. In this study, no correlations between the content of diet-derived FAs in liver tissue and measurements of glucose tolerance or insulin sensitivity were observed, while fish-derived FA content in adipose tissue was associated with indices of insulin resistance, in female mice. However, the physiologic relevance of these findings is ambiguous, as females were at very low risk of metabolic abnormalities.
No correlations between dairy-derived FAs in tissues and metabolic outcomes were found. While this is likely explained by the modest metabolic improvements exhibited in mice supplemented with dairy fat, it is striking that BO-fed males were significantly less glucose intolerant than CO-fed males after 12 months of experimental feeding. It is challenging to contextualise that these results via other rodent studies, as dietary supplementation with dairy fat in other work has shown mixed results on metabolic parameters(Reference Huang, Leone and Devkota54,Reference Prieto, Hidalgo and Segarra64–Reference Hidalgo, Prieto and Abriouel66) that are likely more reflective of the respective study designs (e.g. animal model, diet formulation). For example, when male C57BL/6 mice were fed a low-fat chow or a high-fat diet (10 and 37·5 % of total energy, respectively) with fat composed of milk fat, lard, or safflower oil, modest changes in markers of inflammation in adipose tissue were found in mice fed milk fat, whereas markers of inflammation in adipose tissue were significantly enhanced in mice fed safflower oil(Reference Huang, Leone and Devkota54). An important consideration, however, is that the dietary fat of these murine diets was derived from a single fat source (i.e. 100 % milk fat). In general, our results more closely support several epidemiological studies showing that dairy fat intake is negatively associated with T2D(Reference Yakoob, Shi and Willett67,Reference Imamura, Fretts and Marklund68) and related metabolic impairments(Reference Kratz, Marcovina and Nelson23,Reference Santaren, Watkins and Liese25) , particularly in elderly populations(Reference Babio, Becerra-Tomás and Martínez-González69). One possible explanation for this is that the preparation of our murine diets reflects the macronutrient profile (in percent energy) and the FA composition of an U.S. American diet, which has been suggested to lead to the most accurate results in terms of mimicking human physiology(Reference Whelan and Whelan70). Yet, it is important to note that murine and epidemiological studies cannot completely account for all exposures (or lifestyle factors) occurring simultaneously in the complex lives of humans; thus, more research is needed to understand the physiologic effects of dairy-derived FAs on health.
Gut microbiota are increasingly recognised as a critical factor for health maintenance and disease pathogenesis(Reference Turnbaugh, Ley and Mahowald71–Reference Galicia-Garcia, Benito-Vicente and Jebari75), and studies have established that diet is integral to this relationship(Reference Caesar, Tremaroli and Kovatcheva-Datchary51,Reference Huang, Leone and Devkota54,Reference Menni, Zierer and Pallister76) . Our study suggests that colonic bacterial genera may differentially impact metabolic outcomes in mice after feeding a controlled diet long-term. For example, an index of α diversity (i.e. observed genera) was associated with measurements of insulin sensitivity (in males only), consistent with previous studies(Reference Candela, Biagi and Soverini77–Reference Menni, Zhu and Le Roy79). Unexpectedly, however, we found a positive association between the abundance of Akkermansia and glucose intolerance (i.e. AUC GTT) in male mice and the abundance of Eubacterium and insulin resistance in both male and female mice. Akkermansia muciniphila, a recently discovered genus and species(Reference Derrien, Vaughan and Plugge80), is a mucin-degrading bacterium largely observed as beneficial to systemic metabolism in rodent(Reference Everard, Belzer and Geurts81,Reference Plovier, Everard and Druart82) and human studies(Reference Allin, Tremaroli and Caesar73,Reference Zhang, Shen and Fang83,Reference de la Cuesta-Zuluaga, Mueller and Corrales-Agudelo84) . Likewise, certain Eubacterium spp. are gaining recognition as potential targets for microbiome-centric therapeutic strategies to improve health in humans(Reference Mukherjee, Lordan and Ross85). In particular, daily oral dosing of Eubacterium hallii for 4 weeks has been reported to improve markers of insulin sensitivity in obese, diabetic db/db mice(Reference Udayappan, Manneras-Holm and Chaplin-Scott86). While these relationships between gut bacteria and metabolic risk factors observed in our work are surprising, it is noteworthy that the field of gut microbiota and human disease is still in its infancy. For example, Eubacterium is an very diverse genus both in its phylogeny and functional characteristics, and consensus of the definition of the Eubacterium genus is ongoing(Reference Mukherjee, Lordan and Ross85). Moreover, a survey of the literature establishes that the association of bacterial taxa and host phenotype varies widely across studies(Reference He, Wu and Zheng87,Reference Gurung, Li and You88) and that more controlled trials are needed to fully define the function of specific bacteria in isolation and as part of the collective microbial population. To that end, future research utilising metagenomics and metatranscriptomics to evaluate functional pathways of gut bacteria may resolve the direct or indirect role of gut bacterial composition and their derived metabolites on the net effectiveness of specific diets to mitigate disease risk.
Mice are an adequate but imperfect model organism to study the effectiveness of nutritional interventions on disease risk in humans, as the murine gastrointestinal tract has certain differences when compared with that of humans(Reference Nguyen, Vieira-Silva and Liston89). Yet, an advantage of our experimental approach was the utilisation of an outbred mouse stock to mimic the genetic heterogeneity of the human population. In addition, by using a relatively short-lived mouse model, we were capable of examining diet effects over several different life stages. However, due to progressive morbidity in our study population, we did not study the effects of dietary fat quality in a frank elderly population; hence, more work is needed to contextualise our research in a human population over 65 years of age. Importantly, our work is limited in its characterisation of the onset of reproductive senescence in female mice during the study, which was assessed at only two timepoints. In addition, estrous cycle was not monitored or coordinated by research personnel, as the significant amount of time and labour required in such a large cohort and long duration of our study (∼14 months) is not practical. Nevertheless, our study demonstrates the need for future studies evaluating differences in males and females to focus on the role of sex hormones in glucose tolerance and insulin sensitivity in response to dietary interventions, both during sexual maturity and throughout ageing and reproductive quiescence. Lastly, since dietary sources of unique FAs were incorporated with a diet typical of an U.S. American diet, our results may not be generalisable to other populations with distinct, complex, and varying dietary patterns.
Our work demonstrates that long-term supplementation of dietary fat with sources of unique FAs, notably fish oil and echium oil, can beneficially modulate glucose homoeostasis during ageing in a sex-dependent manner. Our study sheds light on the sex-specific role of tissue FA content and colonic bacterial composition on metabolic health. Overall, our findings underscore the importance of sex in formulating future dietary recommendations to mitigate development of metabolic diseases such as T2D risk through adulthood. Moving forward, clinical trials examining the metabolic impact of long-term dietary fat quality in males and females across different age groups are needed to validate our findings.
Acknowledgements
The authors would like to thank Keara McElroy-Yaggy for assistance during sample collection and animal procedures.
This work was supported by an Armin Grams Memorial Research Award (J.K. and T.L.J., http://med.uvm.edu/) from the Center on Aging at the UVM Robert Larner, M.D. College of Medicine and a USDA-NIFA Hatch Fund (J.K., accession number: 1006628; https://nifa.usda.gov/). The aforementioned funders had no role in the design, analysis, or writing of this article.
The authors’ responsibilities were as follows – T. L. J. and J. K.: formulated the research questions and designed research project; T. L. J., J. K., and A. L. U.: conducted research; A. L. U.: analysed data; T. L. J., J. K., and A. L. U.: interpreted the findings; T. L. J., J. K., and A. L. U.: wrote paper. All authors read and approved the final manuscript.
There are no conflicts of interest.
Supplementary material
For supplementary material accompanying this paper visit https://doi.org/10.1017/S0007114521004001