

Food intake in Australia has changed greatly over the last half century. This is due to a combination of an increase in urbanisation and gross domestic profit, more efficient import streams and an increasing multicultural population. Migrants have brought with them their traditional cuisines and ingredients, which over time have been shared and incorporated into everyday diets, resulting in multicultural food customs and a great increase in dietary diversity in Australia( Reference Finkelstein 1 ). Adding further to this changing food culture is the ever-evolving food technology industry, which has introduced GM crops and grains( Reference Uzogara 2 ), processed and ultra-processed foods with significantly extended shelf lives( Reference Monteiro, Moubarac and Cannon 3 ), fortified foods and an array of convenience manufactured foods that require very little further preparation or are ready to eat( Reference Kearney 4 ). These have become favourable commodity traits for the increasing number of dual-income families with limited food preparation time( Reference Finkelstein 1 ). Moreover, takeaway meals and dining out now account for more than 23 % of the average Australian household expenditure( Reference Espinel and Innes-Hughes 5 ), with approximately one in three meals prepared outside of the home( Reference Finkelstein 1 ).
Australia is believed to have gone through what is described worldwide as a ‘nutrition transition’, resulting in the adoption of a Western diet pattern, typified by a shift away from diets high in unrefined carbohydrates (CHO) and fibre towards a diet higher in total fats and refined CHO( Reference Drewnowski and Popkin 6 ). Furthermore, nutrition transitions have been described as having two distinct phases, the first involving an increase in energy availability from cheaper vegetable-based products and the second comprising a shift away from a high-CHO diet to the one rich in vegetable oils, animal products and sugars( Reference Kearney 4 ). In Australia, this has been evidenced by the embracing of Asian and European cuisines over the traditional British style of food( Reference Finkelstein 1 ). A nutrition transition is also usually accompanied by an increase in non-communicable diseases such as obesity, type 2 diabetes mellitus, CVD and some types of cancer( Reference Drewnowski and Popkin 6 ), and is generally preceded by a demographic or epidemiological transition( Reference Kearney 4 ). One major impetus for this change in dietary pattern is believed to be an increase in urbanisation, more efficient food import and distribution systems( Reference Popkin 7 ), increasing access to fast food franchises( Reference Kearney 4 ), and a greater reliance on large multinational supermarkets( Reference Kearney 4 ). Moreover, once a nutrition transition has occurred, these foods are cheaper to purchase than traditional staple commodities, making diets rich in unrefined grains, fruits and vegetables often more expensive to obtain than high-fat and refined sugar diets( Reference Kearney 4 , Reference Drewnowski and Popkin 6 , Reference Drewnowski and Darmon 8 ).
In Australia, dietary guidelines are developed and reviewed by the National Health and Medical Research Council in conjunction with other government departments( 9 ), with the first guidelines being published in 1982. The key recommendation of these guidelines was to reduce SFA intake in favour of MUFA and PUFA, with an emphasis placed on plant-based sources( 10 ), with the current American Heart Association recommendations( Reference Harris, Mozaffarian and Rimm 11 ) and the Australian dietary guidelines continuing to reflect this view( 12 ). As dietary guidelines are produced for the general public, differentiations between particular fatty acids (FA) and even between MUFA and PUFA in regard to their physiological roles are not made. This may be an important omission as not all FA in the same class have similar physiological roles( Reference Mattson and Grundy 13 , Reference Grande, Anderson and Keys 14 ).
The eighteen carbon n-6 PUFA, linoleic acid (LA), the most commonly consumed PUFA in the human diet( Reference Alvheim, Torstensen and Lin 15 ), has been considered an essential FA( Reference Holman, Bazán, Brenner and Giusto 16 ) due to its role in modulating cell signalling, gene expression and inflammation( Reference Das 17 ). Furthermore, LA can be converted to arachidonic acid (AA) by human body( Reference Salem, Pawlosky and Wegher 18 ), although the rate of this conversion may be as low as 1 %( Reference Emken, Adlof and Gulley 19 ), with the same metabolic pathway used for the conversion of α-linolenic acid to long-chain n-3 FA, although this is inhibited by intakes of high LA( Reference Burdge and Calder 20 ). Early research has determined an intake of 1–2 % of dietary energy from LA as being adequate to prevent deficiency symptoms( Reference Holman 21 , Reference Hansen, Wiese and Boelsche 22 ), although recent research has shown that requirements may be as low as 0·3 % of total energy intake( Reference Choque, Catheline and Rioux 23 ). As LA is a precursor for inflammatory mediators( Reference Turpeinen, Basu and Mutanen 24 , Reference James, Gibson and Cleland 25 ), intakes above what is required by the body can result in a pro-inflammatory state, which is further exacerbated in obesity due to the production of inflammatory substances by adipose tissue( Reference Furukawa, Fujita and Shimabukuro 26 ). LA is also the precursor of the two main endocannabinoid system mediators, anandamide and 2-arachidonoyl glycerol( Reference Naughton, Mathai and Hryciw 27 ), which regulate appetite and metabolism( Reference Cota, Marsicano and Tschop 28 ), although the system is dysregulated in overweight and obese individuals( Reference Matias, Gonthier and Orlando 29 ). High-LA diets have also been found to correlate with the prevalence of obesity( Reference Moussavi, Gavino and Receveur 30 ), the promotion of obesity in both animals and human subjects( Reference Massiera, Barbry and Guesnet 31 , Reference Massiera, Saint-Marc and Seydoux 32 ) and are correlated with increased fasting blood glucose and insulin( Reference Madigan, Ryan and Owens 33 ) and insulin resistance( Reference Simopoulos 34 ). Recently, reanalysis of data from the Sydney Diet Heart Study was performed after the identification of missing data points and mortality data. This re-analysis identified that in men with a history of a recent coronary event, replacing dietary SFA with LA resulted in greater CVD events and mortality rates than the control group (no dietary change)( Reference Ramsden, Zamora and Leelarthaepin 35 ). This is supported by a recent meta-analysis finding that, in studies that elevated dietary LA only, there is no evidence of a decrease in cardiovascular risk( Reference Ramsden, Zamora and Leelarthaepin 35 ).
As the majority of plant-based fats are rich in LA (sunflower and safflower >65 %, cottonseed, maize and soya >50 % of total weight(35)), it has been hypothesised that LA intake has increased at a population level, although recent research investigating this in Australia is lacking. Therefore, the aim of the present study was to assess the changes in the intake of macronutrients, PUFA and specific FA: LA; AA, the most commonly consumed MUFA oleic acid (OA) and the most commonly consumed SFA; palmitic acid (PA). In addition, food sources that have contributed to LA availability in the Australian diet will also be determined.
Methods
Data sources
Annual food supply data in the form of food balance sheets (FBS) for the time period 1961–2009 (all available data at the time of analysis) for Australia was obtained from the UN FAO Statistics (FAOSTAT) division (http://faostat.fao.org/) utilising Australian Bureau of Statistics population data (including infants). FBS show trends in the intake at a population level, and although primarily produced to monitor food availability, they are also useful in monitoring trends in intake over time( Reference Vandevijvere, Monteiro and Krebs-Smith 36 ). Data were expressed as g/d per capita, and showed the supply of seventy-five base foods standardised to raw unprocessed commodities/foods (e.g. ‘bananas with skin’). These quantities were adjusted by FAOSTAT to reflect importation and exportation and to account for amounts used for seed; fed to livestock or used for non-food products; losses during storage and transportation; farm waste and post-harvest losses and technical losses occurring during the production of processed foods. FAOSTAT performed standardisation on the commodities, with similar products such as ‘chicken’ and ‘turkey’ being horizontally standardised to ‘poultry’. Commodities were also converted back to quantities expressing raw state (vertical standardisation) to avoid inconsistencies due to differing production processes greatly altering yield and wastage (http://faostat.fao.org/). Commodities with a broad definition (e.g. vegetables – other) were further broken down using Australian Bureau of Statistics ‘Apparent Consumption of Foodstuffs’ publications produced in 1961–99 (http://www.abs.gov.au/) to provide an accurate representation of foods commonly consumed by the Australian population. Seafood commodity groups were populated based on FAOSTAT definitions and comprised foods commonly available in Australia, in both fresh and processed forms. Where categories were broken down using additional information, all supply was evenly divided between constituent foods. Adjustment to reflect edible quantities was performed using United States Department of Agriculture (USDA) Food Yields data( Reference Matthews, Garrison and Pecot 37 ). Commodities that were not shown to be consumed in measurable quantities at any of the time points analysed were removed from the analysis, as were commodities that made negligible contributions to available energy (e.g. tea).
Nutritional analysis
The nutritional composition of each commodity was determined using Xyris FoodWorks Professional 7 (Xyris Software Pty Limited), encompassing CHO, protein, lipid, PUFA, LA, AA, PA and OA. Primary databases used were from The Royal Melbourne Institute of Technology, Australian FA database, the NUTTAB 1995 and 2010 databases produced by Food Safety Australia and New Zealand (© Food Standards Australia New Zealand Organisation) and the AUS (Australia) FA database. As the data resulting from this analysis are highly dependent on the integrity of the nutrition databases used, Australian databases were used primarily to remove variations as a result of analytical, geographical, nutrient and temperature variations. If complete data sets for a particular commodity were not available, the New Zealand FoodFiles database (© Copyright the Ministry of Health (New Zealand) and the New Zealand Institute for Plant and Food Research Limited, 2014) or the USDA National Nutrient Database SR24 database (US Department of Agriculture, Agricultural Research Service, 2011. USDA National Nutrient Database for Standard Reference, Release 24. Nutrient Data Laboratory Home Page, http://www.ars.usda.gov/ba/bhnrc/ndl) were utilised. Where possible, conjugated LA was separated from LA content due to its differing structure and physiological roles.
Availability of specific nutrients was calculated by multiplying the per 100 g/ml quantity of each commodity by the average annual g/d per capita availability. Following this, per capita annual intake of measured nutrients was calculated and expressed as g/d per capita. Average energy availability per capita in kJ/d was calculated by summing the energy contribution from available macronutrients to determine the contribution of the focus macronutrients to total available energy as a percentage. The contribution of the remaining FA not measured in the present study was calculated by summing the average annual intake of investigated FA and subtracting this value from the total available lipids g/d per capita, with the percentage of contribution to total available energy then calculated and this labelled as ‘other FA’. Data are expressed as percentage of total available energy to take into account the differences between disappearance (which FBS show) and actual consumption( Reference Sasaki and Kesteloot 38 ). This has been done as FBS methodology results in inherent overestimation( Reference Kearney 4 ) when compared with other forms of dietary monitoring( Reference Serra-Majem, MacLean and Ribas 39 ).
Statistical analysis
Statistical analysis and AUC calculations were performed using GraphPad Prism (version 6.02; GraphPad Software, Inc.). Linear regression was performed, and Pearson's correlation was determined for change over time. Linearity and significance were set at P≤ 0·0001.
Cumulative change over time was calculated using the formula:
 $$\begin{eqnarray} cumulative\,change\,(\%) = \frac {(actual\,AUC - baseline\,AUC)}{baseline\,AUC}\times 100. \end{eqnarray}$$
This method was used as it assesses all changes that occurred during 1961–2009, allowing peaks and troughs in availability to be taken into account. In this formula, the 1961 value is used to determine a ‘baseline’ AUC, which is a flat line hypothesising that availability was at a constant rate from 1961 to 2009. The actual AUC was calculated using data obtained from the analysis, allowing all change throughout the time period to be taken into account( Reference Carden and Carr 40 ). These two AUC measurements were then used in the above formula to determine the differences between the two AUC (and as such change from baseline), expressing the percentage of cumulative change, with negative values indicating a decrease. Relative change was also calculated using the formula:
 $$\begin{eqnarray} relative\,change\,(\%) = \frac {(2009\hairsp value - 1961\hairsp value)}{1961\hairsp value}\times 100. \end{eqnarray}$$
This was performed so that the comparison between the two methods of assessment of change could be made.
Results
Macronutrient contribution to total available energy
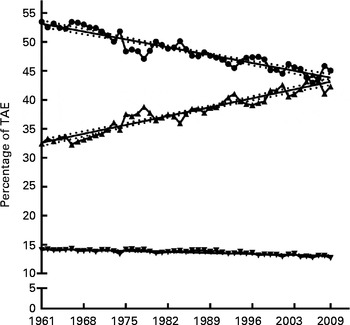
All macronutrients showed a significantly linear relationship to time over the period 1961–2009 (see Fig. 1), with the slope of linear regression being − 0·19 for CHO, − 0·02 for protein and +0·2 for lipid. The cumulative changes during the period 1961–2009 were − 9·3 % for energy from CHO, − 2·8 % from protein and +16·7 % from lipid (see Table 1). The relative change over the period 1961–2009 for CHO, protein and lipid was − 15·7, − 9·8 and +30·5 %, respectively.
Macronutrient contribution to total available energy (TAE). The contribution of carbohydrate (![]() ), lipid (
), lipid (![]() ) and protein (
) and protein (![]() ) to TAE expressed as average annual percentage for the period 1961–2009 with linear regression showing 95 % CI bands. For carbohydrate: Y= − 0·1941X+433·7, slope = − 0·19 ± 0·01, R
2 0·88 (P≤ 0·0001). For lipid: Y= 0·2192X − 397·3, slope = 0·22 ± 0·01, R
2 0·91 (P≤ 0·0001). For protein Y= − 0·02517X+63·62, slope = − 0·02 ± 0·002, R
2 0·697 (P≤ 0·0001). X = calendar year.
) to TAE expressed as average annual percentage for the period 1961–2009 with linear regression showing 95 % CI bands. For carbohydrate: Y= − 0·1941X+433·7, slope = − 0·19 ± 0·01, R
2 0·88 (P≤ 0·0001). For lipid: Y= 0·2192X − 397·3, slope = 0·22 ± 0·01, R
2 0·91 (P≤ 0·0001). For protein Y= − 0·02517X+63·62, slope = − 0·02 ± 0·002, R
2 0·697 (P≤ 0·0001). X = calendar year.
Cumulative change of selected macronutrients and fatty acids*
AE, available energy; FA, fatty acid; LA, linoleic acid.
* Cumulative change over time was calculated using the formula:
 $$\begin{eqnarray} Cumulative\,change\,(\%) = \frac {(actual\,AUC - baseline\,AUC)}{baseline\,AUC}\times 100. \end{eqnarray}$$
Specific fatty acid contribution to total available energy
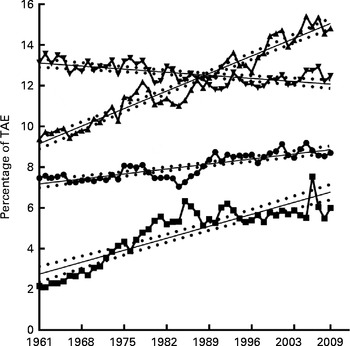
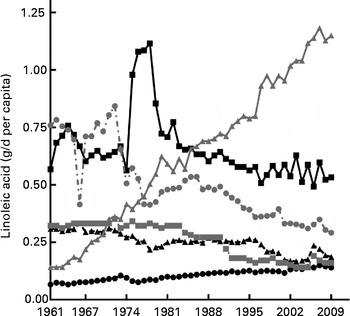
PA, OA, AA and LA all showed significantly linear relationships to time over the period 1961–2009 (see Fig. 2, AA data not shown), with the slope of linear regression being 0·03 for PA, 0·1 for OA, 0·08 for LA and − 0·0002 for AA (AA data not shown). The slope of linear regression for the remaining FA not specifically measured in the present study was − 0·02. As shown in Table 1, the cumulative changes in energy from specific FA during this period were 7·4 % from PA, 29·1 % for energy from OA, − 3·6 % from AA, 120·5 % from LA and − 4·1 % from the remaining unmeasured FA. The relative change of these FA for 1961–2009 were 16·5 % available energy from PA, 58 % from OA, 176·8 % from LA and − 20·5 % from AA, showing similar trends to the cumulative change data.
Specific fatty acid contribution to total available energy (TAE). Contribution of oleic (![]() ), palmitic (
), palmitic (![]() ), linoleic (
), linoleic (![]() ) and other (
) and other (![]() ) fatty acids to TAE expressed as average annual percentage for the period 1961–2009 with linear regression showing 95 % CI bands. For oleic acid: Y= 0·1230X − 232·0, slope = 0·12 ± 0·005, R
2 0·94 (P≤ 0·0001). For palmitic acid: Y= − 0·02159X+55·46, slope = − 0·02 ± 0·004, R
2 0·42 (P≤ 0·0001). For linoleic acid: Y= 0·03503X − 61·51, slope = 0·03 ± 0·003, R
2 0·7 (P≤ 0·0001). For other fatty acids: Y= 0·08396X − 161·9, slope = 0·08 ± 0·007, R
2 0·76 (P≤ 0·0001). X = calendar year.
) fatty acids to TAE expressed as average annual percentage for the period 1961–2009 with linear regression showing 95 % CI bands. For oleic acid: Y= 0·1230X − 232·0, slope = 0·12 ± 0·005, R
2 0·94 (P≤ 0·0001). For palmitic acid: Y= − 0·02159X+55·46, slope = − 0·02 ± 0·004, R
2 0·42 (P≤ 0·0001). For linoleic acid: Y= 0·03503X − 61·51, slope = 0·03 ± 0·003, R
2 0·7 (P≤ 0·0001). For other fatty acids: Y= 0·08396X − 161·9, slope = 0·08 ± 0·007, R
2 0·76 (P≤ 0·0001). X = calendar year.
Linoleic acid contribution to total PUFA availability
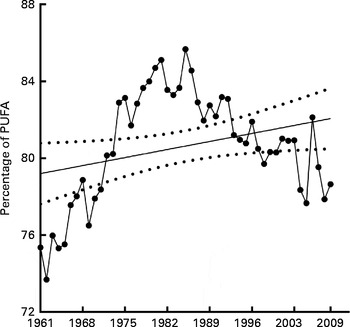
The cumulative change in contribution of LA to total PUFA availability over the time analysed was 7·1 % (see Table 1) and the relative change was 4·4 %. This low cumulative change is most probably due to the contribution of LA to total available PUFA rising sharply from 73·4 % in 1961 to 85·7 % in 1985, following which it dropped back to 78·6 % by 2009 (see Fig. 3), although the slope of the regression varied between 0·003 and 0·12.
Linoleic acid contribution to total available PUFA. Contribution of linoleic acid to the total available PUFA expressed as an average annual percentage for the period 1961–2009 with linear regression showing 95 % CI bands. Y= 0·05964X − 37·75, slope = 0·003 to 0·12, R 2 0·8 (P≤ 0·05). X = calendar year.
Linoleic acid availability from specific dietary sources
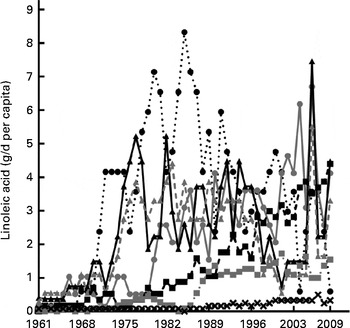
The change in contribution of specific foodstuffs to LA availability in the Australian diet was determined using the FBS commodity lists and was divided into plant and animal sources as shown in Figs. 4 and 5. The cumulative change data (Table 2) shows that the change in LA availability (g/d per capita) from the plant-based cottonseed, palm, sunflower and soya oils was 1470·9, 2510·5, 611·9 and 2016·7 %, respectively. The relative change for these commodities was 2820 % for cottonseed, 6105 % for palm, 265 % for sunflower and 995 % for soya oils. The cumulative change of contribution from peanut oil was − 70·1 % and wheat was − 17·7 %. Relative change calculations show that peanut oil decreased 100 % as it was not available at a measurable level in 2009, with wheat having a relative change of − 74·25 %. As rapeseed oil was not available at a measureable level in 1961, cumulative change could not be calculated, nor could relative change. Despite this, as shown in Table 2, by 2009, it provided the highest amount of LA from any single food source. The availability of LA from animal sources analysed showed a cumulative change of 345·2 % from poultry, 16·3 % from beef, 58·7 % from pork, − 34·0 % from lamb and − 19·8 % from eggs. Relative change of these sources has found that poultry increased 707·7 %, and pork 110·7 %, although lamb decreased 61·56 % and eggs decreased 50 %. Relative change for beef was a decrease of 6·2 %, in disagreement with cumulative change data. This is most likely due to beef-derived LA availability, as shown in Fig. 4, peaking in 1978 and then subsiding back towards baseline by 2009, showing the limitation of using relative change to determine trends in nutrient availability over time.
Linoleic acid content in animal products. Linoleic acid availability from major animal source expressed as average annual g/d per capita of linoleic acid for the period 1961–2009. ![]() , Eggs;
, Eggs; ![]() , pork;
, pork; ![]() , poultry;
, poultry; ![]() , milk;
, milk; ![]() , lamb;
, lamb; ![]() , beef.
, beef.
Plant-derived linoleic acid intake. Linoleic acid availability from major plant oil expressed as average annual g/d per capita of linoleic acid for the period 1961–2009. ![]() , Olive oil;
, Olive oil; ![]() , cottonseed oil;
, cottonseed oil; ![]() , rapeseed oil;
, rapeseed oil; ![]() , soya oil;
, soya oil; ![]() , safflower oil;
, safflower oil; ![]() , palm oil;
, palm oil; ![]() , sunflower oil.
, sunflower oil.
Cumulative change of selected linoleic acid (LA) sources*
N/A, not available.
* Cumulative change over time was calculated using the formula:
 $$\begin{eqnarray} Cumulative\,change\,(\%) = \frac {(actual\,AUC - baseline\,AUC)}{baseline\,AUC}\times 100. \end{eqnarray}$$
† Total plant oils comprise coconut, cottonseed, groundnut, maize, palm, rapeseed, sesame seed, soya, safflower, sunflower seed and olive oils.
‡ Major animal sources comprise beef, lamb, pork, poultry, eggs and milk.
Linoleic acid availability from total plant-derived oils and major animal sources and their contributions to the total dietary linoleic acid availability
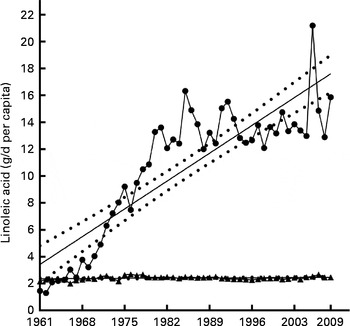
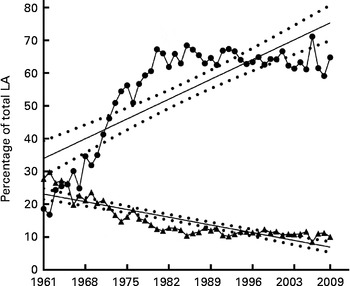
Total plant oil LA availability (average annual g/d per capita) was calculated (encompassing coconut, cottonseed, groundnut, maize, palm, rapeseed, sesame seed, soya, safflower, olive and sunflower seed oils) and showed significant linearity (see Fig. 6) with a slope of 0·29. As shown in Table 2, the cumulative change in plant oil-derived LA (g/d per capita) over the time analysed was 627·1 %, relative change in plant oil-derived LA showed an increase of 992·9 %. Analysis of the major animal sources (beef, pork, poultry, lamb, eggs and milk) of LA have found that the cumulative change of their total LA contribution (g/d per capita) during the time period analysed was 11·3 %, with the relative change being an increase of 13·67 %. As seen in Fig. 6, combined animal sources provided a relatively stable amount of available LA over the time period analysed, having an R 2 0·05 and a non-significant slope of 0·002. Analysis of the contribution of total plant-derived oils to total dietary LA availability has shown a cumulative change of 195·6 % and major animal sources − 46·0 % over the time period analysed (see Table 3). Relative change analysis has shown a 248·8 % increase from plant sources to total LA availability and a 63·7 % decrease from animal sources. As shown in Fig. 7, the annual average contribution of total plant oils to total LA showed a significantly linear relationship over time with a slope of 0·86, with the contribution of major animal sources having a slope of − 0·34.
Combined animal and plant oil contribution to grams of available linoleic acid. Cumulative total of major plant oil (coconut, cottonseed, groundnut, maize, palm, rapeseed, sesame seed, soya, sunflower seed, olive and safflower oils) (![]() ) and major animal source (milk, poultry, pork, beef, lamb and eggs) (
) and major animal source (milk, poultry, pork, beef, lamb and eggs) (![]() ) linoleic acid availability expressed as average annual g/d per capita for the period 1961–2009 with linear regression showing 95 % CI bands. For cumulative total of major plant oil: Y= 0·2955X − 576·2, slope = 0·29 ± 0·025, R
2 0·75 (P≤ 0·0001). For cumulative total of major animal source: Y= 0·002106X − 1·774, slope = 0·002 ± 0·001, R
2 0·05 (P≤ 0·0001). X = calendar year.
) linoleic acid availability expressed as average annual g/d per capita for the period 1961–2009 with linear regression showing 95 % CI bands. For cumulative total of major plant oil: Y= 0·2955X − 576·2, slope = 0·29 ± 0·025, R
2 0·75 (P≤ 0·0001). For cumulative total of major animal source: Y= 0·002106X − 1·774, slope = 0·002 ± 0·001, R
2 0·05 (P≤ 0·0001). X = calendar year.
Cumulative change of linoleic acid from plant oils and major animal product contribution to total linoleic acid availability*
LA, linoleic acid.
* Cumulative change over time was calculated using the formula:
 $$\begin{eqnarray} Cumulative\,change\,(\%) = \frac {(actual\,AUC - baseline\,AUC)}{baseline\,AUC}\times 100. \end{eqnarray}$$
† Total plant oils comprise coconut, cottonseed, groundnut, maize, palm, rapeseed, sesame seed, soya, safflower, sunflower seed and olive oils.
‡ Major animal sources comprise beef, lamb, pork, poultry, eggs and milk.
Combined animal and plant oil contribution to total linoleic acid (LA). Cumulative plant oil (coconut, cottonseed, groundnut, maize, palm, rapeseed, sesame seed, soya, safflower, sunflower seed and olive oils) (![]() ) and major animal source (milk, poultry, beef, pork, lamb and egg) (
) and major animal source (milk, poultry, beef, pork, lamb and egg) (![]() ) contribution to total LA expressed as average annual percentage of total available LA for the period 1961–2009 with linear regression showing 95 % CI bands. For cumulative plant oil: Y= 0·8621X − 1657, slope = 0·86 ± 0·097, R
2 0·63 (P≤ 0·0001). For cumulative major animal source: Y= − 0·3373X+684·5, slope = − 0·34 ± 0·03, R
2 0·74 (P≤ 0·0001). X = calendar year.
) contribution to total LA expressed as average annual percentage of total available LA for the period 1961–2009 with linear regression showing 95 % CI bands. For cumulative plant oil: Y= 0·8621X − 1657, slope = 0·86 ± 0·097, R
2 0·63 (P≤ 0·0001). For cumulative major animal source: Y= − 0·3373X+684·5, slope = − 0·34 ± 0·03, R
2 0·74 (P≤ 0·0001). X = calendar year.
Discussion
Over the time period 1961–2009, Australia experienced a major dietary change, or nutrition transition, resulting in an increase in the contribution of lipids to total energy availability, and an increase in both LA availability and the contribution of plant-based oils to LA availability. The present study is the first (to the authors' knowledge) to assess the changes in specific SFA, MUFA and PUFA and their sources over such a long time period.
The 16·7 % increase in energy availability from lipids found in the present study shows a similar trend to a study investigating cumulative change of energy from macronutrients in the USA, which found a 14·6 % increase in the contribution from lipids from 1970 through 2009( Reference Carden and Carr 40 ). Furthermore, the present study also shows comparable findings to several similar studies conducted in other Westernised countries such as Ireland( Reference Sheehy and Sharma 41 ), Barbados( Reference Sheehy and Sharma 42 ), Switzerland, France( Reference Guerra, Paccaud and Marques-Vidal 43 ) and Europe( Reference Balanza, García-Lorda and Pérez-Rodrigo 44 ), as well as China, which has recently gone through a nutrition transition( Reference Popkin 7 ). Despite this, the percentage of energy available from lipids in Australia identified in the present study in 2001 (42·5 %) was higher than in Austria, Belgium, Denmark, Germany, Greece, Spain and Sweden, which were also determined by FAOSTAT FBS analysis( Reference Schmidhuber 45 ). The mechanism behind increased fat intakes worldwide has been extensively debated, with some schools of thought believing that a preference for high-fat foods is innate or developed in childhood, although others believe that fat intake is influenced purely by the amount of fat available in the food supply, and that people will consistently consume the same weight of food, regardless of energy density( Reference Drewnowski and Popkin 6 , Reference Blundell and Macdiarmid 46 , Reference Popkin, Siega-Riz and Haines 47 ). Despite this, the cause of the increase in availability of fats in the food supply is generally believed to be the natural result of an increase in production and therefore availability of plant-derived oils( Reference De Haen, Stamoulis and Shetty 48 ). Supporting this are the findings from the WHO that the increase in energy availability in Australia is primarily due to an increased availability of fats( Reference Silventoinen, Sans and Tolonen 49 ), reflecting the results found in the present study.
The increase in the availability of energy from fat found in the present study is a result of an increase in the availability of the most common FA of the SFA, MUFA and PUFA classes, being PA, OA and LA. Furthermore, the finding of the present study that OA is the most highly consumed FA of those measured is similar to American results that found OA to be the most highly consumed FA, providing 12 % of total energy in 2010( Reference Vannice and Rasmussen 50 ). This is most likely a result of OA being present in the lipid fraction of a wide range of foods, from animal products and dairy through plant-based oils and a range of vegetables, albeit at lower levels in the latter. Although OA accounted for the highest proportion of the FA surveyed here, the greatest cumulative change in FA energy availability was from LA, with a cumulative change of 120·5 % and a relative change of 176·8 % over the time period analysed. A similar trend was found in the USA by Blasbalg et al. ( Reference Blasbalg, Hibbeln and Ramsden 51 ), who found an increase of 158 % in LA availability over the time period 1909–99 when assessing relative change. Comparing the average annual contribution of investigated FA from 1995 found here to similar Australian research conducted by Hibbeln et al. ( Reference Hibbeln, Nieminen and Blasbalg 52 ), there is comparable energy availability from both LA (4·7 % compared with the 5·3 % found here) and AA (0·07 % compared with 0·06 %), with differences possibly attributable to the use of different food composition databases in the analysis. Interestingly, although we now have a wider range of foods available than in 1960( 53 ), which in itself leads to a greater proportion of energy from lipids( Reference Drewnowski and Popkin 6 ), the results of the present study show that over the time period analysed, the contribution of the three main dietary FA to total lipids has increased (with the ‘other FA’ group showing a reduction), possibly reflecting a decrease in FA diversity.
Australian dietary guidelines recommend less than 10 % of energy intake from LA, which is a figure based on the 90th centile of intake in the population surveyed in the 1995 Australian National Nutrition Survey, as this level of intake did not appear to have negative effects on health( 54 ). Although the results of the present study indicate that current levels are below this, the intake level above which a negative impact occurs is strongly debated( Reference Choque, Catheline and Rioux 23 ). One population group that demonstrates the effects of excessive LA consumption is Israelis following kosher diets, consuming LA intakes of between 10 and 12 % of total energy( Reference Dubnov-Raz, Berry, Meester and Watson 55 ). This is due in part to the high reliance on plant oils, especially soya( Reference Dubnov-Raz, Berry, Meester and Watson 55 , Reference Guggenheim and Kaufmann 56 ), and the consumption of high-LA nuts such as pecans, pistachios and almonds( Reference Dubnov-Raz, Berry, Meester and Watson 55 ). Interestingly, despite this population having one of the lowest total fat intakes in Westernised countries and a high intake of fruit and vegetables, they have one of the highest rate of diabetes mortality in the world( Reference Dubnov-Raz, Berry, Meester and Watson 55 ). Moreover, with LA being promoted as being cardioprotective, it has been found that the standardised mortality rate of atherosclerosis is similar to that in America( Reference Dubnov-Raz, Berry, Meester and Watson 55 ), indicating that increasing LA intake further may not result in improved CVD prevalence.
Further analysis of the commodities listed in the FBS has found that the main source of the increased energy availability from LA was primarily plant oils (by both volume and percentage). This also identified cottonseed, palm and sunflower seed oils as having the greatest increases in availability over the time period analysed, with rapeseed oil contributing the highest amount of LA from any single food source in 2009. This demonstrates the increase in worldwide availability and decreased cost of plant-based oils, with the price of an energy-dense high-fat diet currently being much lower than a less-energy-dense diet with adequate fresh fruit and vegetables( Reference Drewnowski and Darmon 8 , Reference Lee, Ralston and Truby 57 ). Research into worldwide plant oil production in 1984 has shown that plant oils accounted for 63 % of total fat production, with soyabean oil being the most produced, providing nearly half of the worldwide intake of LA( Reference Adam, Galli and Simopoulos 58 ), with more recent research conducted by FAO showing an increase in vegetable oil supply of 121 % in developed countries from 1961 to 2003( 59 ). This increase in plant oil production has been facilitated by trade organisation and government support programs( Reference Popkin 7 , Reference Morgan 60 ), provision of food aid and credit guarantees( Reference Drewnowski and Popkin 6 ) and also due to technological advances, including the development of low-erucic acid rapeseed oil( Reference O'Keefe, Kiple and Ornelas 61 ).
In comparison, the contribution to total LA availability from combined major animal sources decreased as a percentage over the time period analysed, although its contribution when expressed in volume has remained relatively steady. This, coupled with the somewhat constant level of AA found over the time period analysed here indicates that meat intake, which primarily supplies dietary AA, has remained relatively steady throughout the nutrition transition. Despite this steadiness, when looking at individual animal sources of LA, the trend of increased poultry intake in Australian diets( 62 ) is evident by the 345·2 % cumulative and 707·7 % relative increase in LA from this source. Westernisation and an expanding population has led to an increased demand for meat and animal products and has spurred agricultural change such as the replacement of grass in livestock feed with grains such as maize and soya( Reference Thornton 63 ). This results in higher feed LA levels, leading to an increase in LA in animal tissues and products, which has been found to negatively affect the n-6:n-3 of consumers( Reference Weill, Schmitt and Chesneau 64 ). Furthermore, modern farming techniques have resulted in traditionally lean animals, such as chicken, having a higher fat content and a higher n-6:n-3( Reference Crawford, Wang, Lehane, De Meester, Zibadi and Watson 65 ). In addition, farmed fish have a higher fat content, less DHA and EPA and more LA than their wild counterparts( Reference van Vliet and Katan 66 , Reference George and Bhopal 67 ). Importantly, cellular phospholipid content is strongly determined by dietary FA intake, with LA and DHA/EPA competing for incorporation. In addition, the synthesis of both AA and DHA/EPA (from α-linolenic acid) requires the same enzyme, which preferentially converts LA to AA, indicating that a diet high in LA is capable of decreasing tissue DHA/EPA levels( Reference Abbott, Else and Atkins 68 ), further increasing the risk of pro-inflammatory states, endocannabinoid system over-activity and the development of obesity( Reference Naughton, Mathai and Hryciw 27 ).
During the time period 1961–2009, there was a cumulative change of 7·1 % and a relative change of 4·4 % in the contribution of LA to total PUFA availability. Interestingly, Meyer et al. ( Reference Meyer, Mann and Lewis 69 ) when investigating PUFA intake using 24 h recall data found that in 1995, LA contributed to approximately 88 % of total PUFA, about 8 % higher than that found at this time point in the present study, possibly due to the intrinsic differences between the two dietary analysis methods. The contribution of LA to total PUFA availability found here is slightly less than the approximately 84 % found in studies assessing American diets( Reference Blasbalg, Hibbeln and Ramsden 51 , Reference Kris-Etherton, Taylor and Yu-Poth 70 , Reference Harris and Klurfeld 71 ). This is most likely due to soya oil being the most commonly consumed oil in the US( Reference Blasbalg, Hibbeln and Ramsden 51 ) accounting for approximately 20 % of energy intake( Reference Hibbeln, Nieminen and Blasbalg 52 ), while the results of the present study indicate that rapeseed, sunflower and cottonseed oils in combination with soya oil comprise the majority of plant oil availability, with soya oil having a higher proportion of PUFA than MUFA when compared with the other commonly used plant oils found here.
As a population, Australians have adopted the dietary guideline recommendations of consuming reduced fat dairy products( Reference Dobson, Porteous and McElduff 72 , 73 ), lean meat and trimming visible fat( Reference Dobson, Porteous and McElduff 72 , Reference Williams and Droulez 74 ); however, the Western diet pattern is high in invisible fat sources such as baked and fried foods( Reference Popkin, Siega-Riz and Haines 47 ) and highly processed foods utilising butter fat as an ingredient. As a result, the intake of fat from dairy sources has not reduced( Reference Sanders 75 ). Furthermore, consumption of processed products such as sausages and meat patties/burgers still account for almost half of all meat consumed in Western countries( Reference Kearney 4 ), which may show the influence of price as these products are often cheaper than their leaner counterparts. This is supported by a study utilising data obtained from the 1995 Australian National Nutrition Survey, which found a trend towards more frequent intake of luncheon meats and sausages in lower income groups( Reference Worsley, Blasche and Ball 76 ). This demonstrates how cost is a core influencing factor in food choice( Reference Lee, Ralston and Truby 57 , Reference Brimblecombe and O'Dea 77 ), with constraint of food expenditure generally leading to an increase in the energy density of food choices( Reference Drewnowski and Darmon 8 , Reference Lee, Ralston and Truby 57 , Reference Brimblecombe and O'Dea 77 ) and, in turn, a significant increase in Australian dietary energy intake( Reference Lee, Ralston and Truby 57 , Reference Brimblecombe and O'Dea 77 , Reference Beatriz, Sherry and Alexandra 78 ).
One criticism of using FBS for determining trends in food supply changes is that they do not show differences between population groups( Reference Vandevijvere, Monteiro and Krebs-Smith 36 ), although research comparing male Australians who were vegan, ovo-lacto vegetarian or who habitually consumed large amounts of meat has found no significant differences in LA and total PUFA intakes( Reference Mann, Pirotta and O'Connell 79 ). Alcohol levels were not able to be quantified due to categorising of beverages incorporating a wide range of alcohol contents and the data being presented as per capita, not just for the adult population. Also, FBS do not take into account household food wastage, which may artificially increase the availability of energy or particular nutrients( Reference Vandevijvere, Monteiro and Krebs-Smith 36 ). Although this has not been investigated in Australia, data from the UK show that household waste, fats and oils account for only approximately 1 % of total waste, with the majority of waste comprising fresh fruit and vegetables and drinks( Reference Quested, Ingle and Parry 80 ). A limitation of the present study is the use of current nutritional content data, which reflect modern farming and production practices for all time points, due to the absence of appropriate data from the 1960s. As a result, changes to livestock rearing and plant oil production that occurred over the time period analysed, specifically those that increased the LA content of a large number of commodities( Reference Blasbalg, Hibbeln and Ramsden 51 ), have not been able to be shown, indicating that the changes in the availability of nutrients, especially LA, may actually be greater than what is found here.
In Australia, an increase in food diversity and multiculturalism coupled with food technology advances triggered a nutrition transition over the time period 1961–2009, which resulted in changes to dietary intake at a population level. The most important of these changes identified here is an increase in energy availability from fats, mostly due to the greater availability and lower cost of vegetable-based oils. This is also evident by looking at the LA contribution to total available fat, which showed a greater change than the other major dietary FA. Analysis of the dietary sources that contributed to this increase in LA identified plant-derived oils as having the greatest contribution, helping to confirm our hypothesis. Although as a population the available energy from LA is below that recommended as an upper level by dietary guidelines, the evidence of the role of LA in increased inflammation, obesity development and CVD risk indicates a need for caution in any changes, which may lead to further increases in intake.
Acknowledgements
Scholarship funding was provided by the Australian Postgraduate Award (S. S. N.). A. J. M. is supported by an Australian government collaborative research network program.
The authors' contributions are as follows: S. S. N., M. L. M. and A. J. M. contributed equally to formulating the research question and designing the study; S. S. N. completed the data and statistical analyses with review by A. J. M., D. H. H. and M. L. M.; S. S. N., M. L. M., D. H. H. and A. J. M. contributed equally to the writing of this research paper.
None of the authors has any conflicts of interest to declare.


