

A variety of plant-based diets have demonstrated health benefits for intermediate risk factors such as LDL and total cholesterol, BMI and blood glucose, as well as incidence and mortality from IHD and incidence of total cancer( Reference Dinu, Abbate and Gensini 1 ). A vegetarian diet has been defined previously as an eating pattern that does not include meat (including poultry, game birds and seafood), although it may include eggs or dairy products( Reference Le and Sabate 2 , Reference Craig and Mangels 3 ). The position of the Academy of Nutrition and Dietetics is that well-planned vegetarian diets can confer health benefits for the prevention and treatment of some diseases and that vegetarian diets are appropriate for individuals during all stages of life( Reference Craig and Mangels 3 ). The Dietary Guidelines for Americans has consistently included the message that well-planned vegetarian diets can meet recommended nutrient intakes( 4 – 7 ). Importantly, the 2010 iteration of the Dietary Guidelines for Americans was the first to include a statement that vegetarian diet patterns confer greater health benefits compared with non-vegetarian diets( 7 ), and was the first to model a vegetarian diet pattern as one of several healthy eating patterns for adults( 8 ). Compared with omnivorous diets, vegetarian diets have been linked with lower risk of IHD( Reference Tao, Bin and Jusheng 9 ), type 2 diabetes( Reference Kahleova and Pelikanova 10 ), metabolic syndrome( Reference Turner-McGrievy and Harris 11 ) and some cancers( Reference Tao, Bin and Jusheng 9 , Reference Gilsing, Schouten and Goldbohm 12 – Reference Tantamango-Bartley, Knutsen and Knutsen 14 ), as well as lower blood pressure( Reference Yokoyama, Nishimura and Barnard 15 ), lower body weight( Reference Barnard, Levin and Yokoyama 16 , Reference Huang, Huang and Hu 17 ) and higher nutritional quality( Reference Clarys, Deliens and Huybrechts 18 , Reference Clarys, Deriemaeker and Huybrechts 19 ).
Recent consumer surveys find that approximately 3·4 % of US adults report consuming vegetarian diets( 20 , Reference Stahler 21 ), compared with approximately 2·3 % in 2006( 22 ) and 1 % in 1997( 23 ). Consumer behaviour, as illustrated by online search activity in Google, shows rising interest in plant-based diets over the past 10 years (see online supplementary material). In addition, about 36 % of individuals choose to eat some meatless meals( Reference Stahler 21 ). The rising interest in vegetarian eating makes the analysis of dietary quality of vegetarian diets of mounting public health relevance. Health benefits are cited as one of the primary reasons people adopt vegetarian diets( Reference Pribis, Pencak and Grajales 24 – Reference Clonan, Wilson and Swift 26 ). However, the mere absence of meat or other foods does not necessarily equate to a diet pattern of high quality( Reference Clarys, Deliens and Huybrechts 18 , Reference Turner-McGrievy, Wirth and Shivappa 27 ).
Several observational studies of Flemish adults( Reference Clarys, Deliens and Huybrechts 18 , Reference Clarys, Deriemaeker and Huybrechts 19 ) found that vegetarians scored better on several diet quality indices (the Healthy Eating Index-2010 (HEI-2010) and Mediterranean Diet Score) compared with omnivores. In a randomized controlled trial of overweight and obese US adults, Turner-McGrievy et al.( Reference Turner-McGrievy, Wirth and Shivappa 27 ) found that when randomized to vegan, vegetarian, semi-vegetarian (red meat no more than once weekly and poultry no more than five times weekly), pesco-vegetarian and omnivorous diets, only participants consuming the vegan, vegetarian and pesco-vegetarian diets improved their inflammation scores over a 2-month period; in that same intervention, the vegan and vegetarian groups lost more weight compared with the pesco-vegetarian, semi-vegetarian and omnivorous groups( Reference Turner-McGrievy, Davidson and Wingard 28 ).
These studies demonstrate that vegetarian diets are associated with greater diet quality and more favourable health outcomes compared with omnivorous diets, yet the range of diet quality among vegetarians has not been fully examined. Eschewing meat and seafood does not, by itself, define a healthy diet because overall diet quality is influenced by the totality of dietary choices( Reference Lim, Vos and Flaxman 29 , Reference Mozaffarian, Hao and Rimm 30 ). Therefore, not all vegetarian diets are equally healthy. While others( Reference Orlich, Singh and Sabate 13 , Reference Orlich, Jaceldo-Siegl and Sabate 31 ) have published analyses of food and nutrient intakes of vegetarian subgroups using data from the Adventist Health Study II, the largest prospective cohort study (~96000 participants) that includes substantial numbers of vegetarians (approximately 25 % of the cohort), the generalizability of these findings to the general US population may be limited because of cultural values among Seventh Day Adventists to eat more unrefined foods, to avoid smoking and alcohol, and to exercise regularly. Thus, there is a research gap to characterize contemporary, more mainstream eating patterns of individuals who report not consuming meat some or all of the time, and how various foods and nutrients in a meatless eating pattern are associated with overall dietary quality.
The objectives of the present study were to: (i) compare diet quality scores between adult non-meat eaters and meat eaters in order to provide a contemporary comparison of dietary quality between these two populations; and (ii) compare the consumption of diet components across quintiles of diet quality, as assessed by the HEI-2010 and the Alternative Healthy Eating Index-2010 (AHEI-2010), among non-meat eaters. Overall HEI-2010 and AHEI-2010 scores correlate well in both men and women, and greater scores of both indices are linked with lower incidence of chronic disease in prospective cohort studies( Reference Liese, Krebs-Smith and Subar 32 , Reference Harmon, Boushey and Shvetsov 33 ). We utilized both of these indices to quantify diet quality because they include distinct food components, thereby providing more information about consumption of specific food groups when used together than alone. Characterizing the consumption of non-meat eaters sampled from among typical American consumers is an important step in understanding how various eating patterns may fall short in dietary quality. This is important for developing public health messages for people who have adopted vegetarian diets, as well as those who may choose to eat meatless on certain days or for certain meals.
Methods
National Health and Nutrition Examination Survey
Data on individual nutrient intake, food consumption, demographic characteristics and health behaviours were acquired from the National Health and Nutrition Examination Survey (NHANES) cycles 2007–2008, 2009–2010 and 2011–2012. NHANES is a repeated, cross-sectional, continuous survey that collects health and dietary data from a nationally representative sample of 10000 individuals per two-year cycle( 34 ). Participants complete a 24 h recall (24HR) administered by a trained interviewer using the US Department of Agriculture’s Automated Multiple Pass Method( Reference Moshfegh, Rhodes and Baer 35 ) and a subset of the study population completes a subsequent 24HR by telephone on a non-consecutive day.
Dietary data compilation
Individual-level data from 2007–2008, 2009–2010 and 2011–2012 were merged to create a single data file for the 27528 individuals who completed surveys on diet, demography, body composition and physical activity. Individuals not completing two 24HR (n 3679), those aged less than 18 years, those providing dietary data deemed unreliable by a trained NHANES interviewer and those with missing dietary data (n 7039) were excluded from the analysis. The final sample included 16810 individuals; of these, non-meat eaters were identified as those who reported not consuming any meat (including poultry, game birds and seafood) on both 24HR (n 280) and meat eaters were identified as those who reported consuming some meat on either 24HR (n 16530). Although individuals were categorized as non-meat eaters and meat eaters according to two 24HR, only dietary data from the first 24HR were used for the analysis, as recommended by the National Cancer Institute( 36 ). A single 24HR is a reasonable approximation of intake at the population level. The sample of non-meat eaters included vegetarians as well as those who may not have followed a vegetarian diet consistently, but reported not consuming any meat on either of two non-consecutive 24HR. For example, approximately half (44·8 %) of participants in the 2007–2008 and 2009–2010 NHANES cycles who reported not consuming any meat on both 24HR considered themselves to be vegetarian, as defined by the question ‘Do you consider yourself to be a vegetarian?’ (The 2011–2012 cycle did not include this question.) Individuals who reported consuming meat on either 24HR but indicated they were vegetarian were classified as meat eaters. All individuals in the current analysis provided dietary data that were deemed to be reliable by trained interviewers.
Data on demographics and lifestyle behaviours were collected and categorized as follows: age (18–30, 31–50, ≥51 years), sex, race/ethnicity (non-Hispanic White, non-Hispanic Black, non-Hispanic other, Hispanic), education (less than high school, high school or equivalent, some college, college graduate), annual household income (<$US 10000; $US 10000–24999; $US 25000–54999; $US 55000–74999;≥$US 75000) and BMI (<25·0, 25·0–29·9, ≥30·0 kg/m2).
Healthy Eating Index–2010
Diet quality for each individual was estimated using the HEI-2010( Reference Guenther, Casavale and Reedy 37 ), which provides a measure of compliance with the 2010 Dietary Guidelines for Americans( 38 ). The HEI-2010 includes twelve components, nine of which assess adequacy (total fruit; whole fruit; total vegetables; greens and beans; whole grains; dairy; total protein foods; seafood and plant proteins; fatty acids) and three of which assess moderation (refined grains; sodium; empty calories such as solid fat, added sugars and alcohol; Table 1). Each component has its own scoring standards, such that a minimum and maximum possible score for each component is associated with a certain consumption amount (e.g. intake of 0 cup-equivalents of total vegetables is associated with 0 points; consumption of 1·1 cup-equivalents of total vegetables is associated with 5 points). Consumption amounts that fall between the minimum and the maximum possible scores are awarded points proportional to their consumption amount (e.g. consumption of 0·5 cup-equivalents of total vegetables is associated with 2·3 points). All consumption amounts are standardized to a basis of 1000 kcal (4184 kJ). Some components are scored on a scale of 0 to 5 (total fruit; whole fruit; total vegetables; greens and beans; total protein foods; plant protein), some are scored on a scale of 0 to 10 (whole grains; dairy; fatty acids; refined grains; sodium) and one is scored on a scale of 0 to 20 (empty calories). Moderation components are reverse-scored so that ultimately greater scores are favourable( Reference Guenther, Casavale and Reedy 37 ). The component scores were summed to compute the overall HEI-2010 score, which ranges from a minimum of 0 to a maximum of 100 points. The HEI-2010 was designed to assess the dietary quality of a wide range of diets including vegetarian diets( Reference Guenther, Casavale and Reedy 37 ) and has been used previously for this purpose( Reference Clarys, Deliens and Huybrechts 18 , Reference Clarys, Deriemaeker and Huybrechts 19 ).
Components and optimal scoring standards for each component of the Healthy Eating Index-2010 (HEI-2010) and Alternative Healthy Eating Index-2010 (AHEI-2010)
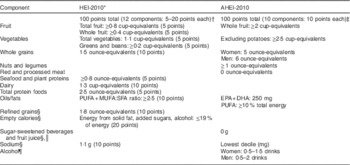
Table adapted from: Am J Clin Nutr (2015) 101, 587–597, American Society for Nutrition, with permission.
* Energy-adjusted using the density method, all amounts are per 1000 kcal (4184 kJ) except oils/fats.
† Cup-equivalents and ounce-equivalents from the US Department of Agriculture Food Pattern Equivalents Database.
‡ Scoring standards, cup-equivalents and ounce-equivalents from Chiuve et al.( Reference Chiuve, Fung and Rimm 39 ).
§ Reverse-scored, such that higher intake is associated with a lower score.
║ Non-alcoholic beverages with added sugars having≥50 kcal per 8 ounce serving.
¶ Moderate drinkers (amounts in table) received maximum points, heavy drinkers (more than amounts in table) received 0 points and non-drinkers received 2·5 points.
Alternative Healthy Eating Index-2010
Diet quality for each individual was estimated using the AHEI-2010, an index of diet quality based on foods or food constituents associated with chronic disease risk( Reference Chiuve, Fung and Rimm 39 ). The AHEI-2010 includes eleven components, six of which assess adequacy (vegetables; fruit; whole grains; nuts and legumes; long-chain n-3 fatty acids; PUFA) and five of which assess moderation (sugar-sweetened beverages and fruit juice; red/processed meat; trans-fat; sodium; alcohol; Table 1). Each component is scored on a scale of 0 to 10, and each component has its own standards for the amount of points awarded for consumption amount. Consumption amounts that fall between the minimum and maximum possible scores are awarded points proportional to their consumption amount. Consumption amounts are not energy-adjusted. Higher scores are favourable for each component and moderation components are reverse-scored, with the exception of alcohol, which awards greater scores for moderate consumption. All components except sodium are scored on an absolute basis; sodium scores are derived from deciles of sodium consumption in the sample population.
The trans-fat component was not included in the AHEI-2010 score because NHANES does not provide data on trans-fat consumption. Others( Reference Wang, Leung and Li 40 ) have used external population estimates of trans-fat consumption when computing AHEI-2010 scores using NHANES data, and presented these scores on a 110-point scale (with population-level trans-fat data) and also on a 100-point scale (without trans-fat data). This approach was not useful for the present study because greater data resolution is needed to estimate consumption among subgroups (i.e. by quintile of AHEI-2010 score). Therefore, AHEI-2010 scores are presented on a 100-point scale here.
Analyses
Participants were grouped by quintile of HEI-2010 score and AHEI-2010 score; quintile 1 contains the lowest scores and quintile 5 contains the greatest scores. Differences in mean component scores between quintiles were tested using post hoc pairwise tests (i.e. the means of all possible pairs of quintiles were compared iteratively) if statistical significance was indicated by a global test of differences (i.e. the means of all quintiles were compared simultaneously). Following others( Reference Rehm, Monsivais and Drewnowski 41 ), HEI-2010 scores for each quintile were computed using the population-ratio method( Reference Freedman, Guenther and Krebs-Smith 42 ); because this method does not allow for estimation of degrees of freedom, differences in mean component scores between HEI-2010 quintiles were tested using z tests. Differences in component scores between AHEI-2010 quintiles were tested using Wald tests. Differences in demographic characteristics between quintiles 1 and 5 were tested using the Pearson χ 2 statistic. Statistical significance was tested at P<0·05 with a two-tailed distribution. The statistical software package SAS version 9.4 was used to compute AHEI-2010 scores and to estimate population-ratio HEI-2010 scores using the code and macros provided by the National Cancer Institute( 43 ). The Stata 14 statistical software package was used for data management and all other analyses. All analyses were adjusted for the complex sampling design and sample weights of NHANES data.
Results
The present study included 16810 individuals, including 280 (1·7 %) non-meat eaters and 16530 (98·3 %) meat eaters from NHANES 2007–2012. Among the entire sample (non-meat eaters and meat eaters), most non-meat eaters were in HEI-2010 quintile 5 (44·9 %) and quintile 4 (21·1 %), and the fewest were in quintile 1 (9·6 %; Table 2). Meat eaters were evenly distributed across the HEI-2010 quintiles (approximately 20 % in each quintile). Similar findings were observed for AHEI-2010 scores: among the entire sample, most non-meat eaters were in quintile 5 (51·3 %) and quintile 4 (24·9 %), and the fewest were in quintile 1 (3·4 %) and quintile 2 (5·5 %; Table 2). Meat eaters were evenly distributed across the AHEI-2010 quintiles (approximately 20 % in each quintile).
Proportion of non-meat eaters and meat eaters in Healthy Eating Index-2010 (HEI-2010) quintiles and Alternative Healthy Eating Index-2010 (AHEI-2010) quintiles, National Health and Nutrition Examination Survey (NHANES), 2007–2012 (n 16 810)
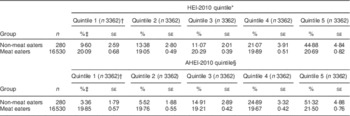
* Range of HEI-2010 scores for each quintile, out of a maximum score of 100 points: quintile 1, 4·40–35·53; quintile 2, 35·54–44·18; quintile 3, 44·19–52·36; quintile 4, 52·37–62·04; quintile 5, 62·05–95·89.
† Sample sizes are unweighted.
‡ Percentages within each row adjusted for survey weights.
§ Range of AHEI-2010 scores for each quintile, out of a maximum score of 100 points: quintile 1, 3·34–26·50; quintile 2, 26·51–33·95; quintile 3, 33·96–41·01; quintile 4, 41·02–49·33; quintile 5, 49·32–87·72.
The mean HEI-2010 score for the entire sample (non-meat eaters and meat eaters) was 56·8 out of a total possible of 100 points, and the mean AHEI-2010 score for the entire sample was 38·7 out of a total possible of 100 points (Table 3). Mean HEI-2010 scores were 16 points greater among non-meat eaters compared with meat eaters (P<0·001), and AHEI-2010 scores were 11 points greater among non-meat eaters compared with meat eaters (P<0·001). Of the 280 non-meat eaters, 180 were from the 2007–2010 data; of these, 44·8 % responded ‘yes’ to the question ‘Do you consider yourself to be a vegetarian?’ (this question was not asked in the 2011–2012 NHANES cycle; data not shown). Of the 16530 meat eaters in the present study, 11 553 were from the 2007–2010 data; of these, 1·4 % indicated they were vegetarian.
Healthy Eating Index-2010 (HEI-2010) scoresFootnote * and Alternative Healthy Eating Index-2010 (AHEI-2010) scoresFootnote * of US adult non-meat eaters and meat eaters, National Health and Nutrition Examination Survey (NHANES), 2007–2012 (n 16 810)
* HEI-2010 maximum score is 100 points; AHEI-2010 maximum score is 100 points.
† Adjusted for survey weights.
‡ Non-meat eaters compared with meat eaters.
§ Differences tested using the z test.
║ Differences tested using the Wald test.
Among the non-meat eaters, those in HEI-2010 quintile 5 were more likely to be older than those in quintile 1 (P=0·013; Table 4). More than half of the respondents in quintile 1 (60·5 %) and quintile 5 (63·5 %) were female, but no differences (P=0·797) in sex were observed between these quintiles. The race/ethnic composition of each quintile did not differ (P=0·618), with most (68·0–69·4 %) participants being non-Hispanic White. More (P=0·019) respondents in quintile 5 graduated college compared with respondents in quintile 1. Annual household income did not differ (P=0·221) between quintiles 1 and 5. BMI did not differ (P=0·587) between quintiles.
Characteristics of US adult non-meat eaters by quintile of Healthy Eating Index-2010 (HEI-2010) scores and Alternative Healthy Eating Index-2010 (AHEI-2010) scores, National Health and Nutrition Examination Survey (NHANES), 2007–2012 (n 280)
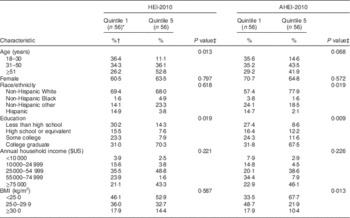
* Sample sizes for quintiles are unweighted.
† Percentages within each column adjusted for survey weights.
‡ Differences between quintiles tested using the two-tailed design-adjusted Pearson χ 2 statistic.
The age distribution between non-meat eaters in AHEI-2010 quintile 1 and quintile 5 was not different (P=0·068; Table 4). Most respondents in quintile 1 (70·7 %) and quintile 5 (64·8 %) were female (P=0·572). Individuals in quintile 1 were more likely to be non-Hispanic White, and less likely to be all other race/ethnicities, than individuals in quintile 1 (P=0·019). Educational attainment was different (P=0·009) between respondents in quintiles 1 and 5, with most (67·5 %) respondents in quintile 5 completing college. Annual household income was not different (P=0·226) between quintiles 1 and 5. Individuals in quintile 5 were less likely (P=0·013) to be overweight (BMI=25·0–29·9 kg/m2) or obese (BMI≥30·0 kg/m2) compared with individuals in quintile 1.
The mean HEI-2010 score by quintile ranged from 38·4 in quintile 1 to 90·3 in quintile 5, out of a total possible score of 100 points (Table 5). Energy intake did not differ significantly across quintiles. The greatest number of pairwise differences between mean scores in quintiles was observed for empty calories such as solid fat, added sugars and alcohol, and for unsaturated:saturated fatty acids (each with eight pairwise differences), with a two- to fourfold difference between quintile 1 and quintile 5 scores; followed by whole grains and total protein foods (each with seven pairwise differences), refined grains (six pairwise differences), total vegetables (five pairwise differences), total fruit (four pairwise differences), plant proteins and sodium (each with three pairwise differences), greens and beans and dairy (each with two pairwise differences), and whole fruit (zero pairwise differences).
Healthy Eating Index-2010 (HEI-2010) component scores among US adult non-meat eaters by quintile, National Health and Nutrition Examination Survey (NHANES), 2007–2012 (n 280)
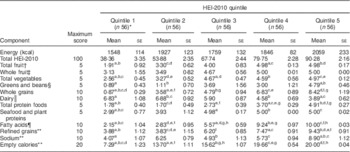
All component scores adjusted for energy using the density method (per 1000 kcal); 1 kcal=4·184 kJ.
a–hMean values within a row with the same superscript letter were significantly different in the global and pairwise z test (P<0·05).
* Sample sizes are unweighted.
† Includes fruit juice.
‡ Includes all forms except juice.
§ Includes beans and peas not counted as protein foods.
║ Includes milk substitutes.
¶ Ratio of unsaturated fatty acids to saturated fatty acids.
** Reverse-scored so that higher number represents lower consumption.
The mean AHEI-2010 score by quintile ranged from 32·0 in quintile 1 to 64·2 in quintile 5, out of a total possible score of 100 points (Table 6). Energy intake did not differ significantly across quintiles. The greatest number of pairwise differences between quintiles was observed for nuts and legumes (nine pairwise differences), with a nearly fourfold difference between quintile 1 and quintile 5 scores; followed by vegetables and PUFA (each with seven pairwise differences); whole grains (six pairwise differences); sugar-sweetened beverages and fruit juice (five pairwise differences); whole fruit (four pairwise differences); red and processed meat, EPA and DHA, sodium and alcohol (each with zero pairwise differences).
Alternative Healthy Eating Index-2010 (AHEI-2010) component scores among US adult non-meat eaters by quintile, National Health and Nutrition Examination Survey (NHANES), 2007–2012 (n 280)
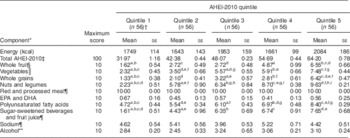
Component scores are not adjusted for energy; 1 kcal=4·184 kJ.
a–iMean values within a row with the same superscript letter were significantly different in the global and pairwise Wald test (P<0·05).
* Excludes trans-fatty acids due to lack of data availability in NHANES.
† Sample sizes are unweighted.
‡ Excludes component score for trans-fatty acids.
§ Includes all forms except juice.
║ Excludes white potatoes.
¶ Reverse-scored so that higher number represents lower consumption.
** Highest scores reflect moderate consumption and lowest scores reflect heavy consumption.
Discussion
In the current study we analysed the diet quality of two populations: individuals who did not report consuming meat on either of two 24HR (non-meat eaters) and individuals who reported consuming some meat on either of two 24HRs (meat eaters). Non-meat eaters had greater diet quality scores compared with meat eaters. Among non-meat eaters, the consumption of empty calories and unsaturated:saturated fatty acids differed more than all other food components across HEI-2010 quintiles; and the consumption of nuts and legumes, followed by consumption of vegetables and PUFA, differed more than all other food components across AHEI-2010 quintiles. Non-meat eaters should improve their consumption of these food components in order to increase their dietary quality.
The higher diet quality of non-meat eaters has been demonstrated using data from Flemish populations( Reference Clarys, Deliens and Huybrechts 18 , Reference Clarys, Deriemaeker and Huybrechts 19 ), although these differences were of greater magnitude in the present study. While HEI-2010 scores for meat eaters/omnivores were similar across studies, we observed much higher scores (by 14–19 points) for non-meat eaters/vegetarians than other studies. Much of this difference is due to the higher mean score for empty calories in the present study (17 out of 20; data not shown) compared with others (6 out of 20 in Clarys et al.( Reference Clarys, Deliens and Huybrechts 18 ) and 7·3 out of 20 in Clarys et al.( Reference Clarys, Deriemaeker and Huybrechts 19 )). Farmer et al.( Reference Farmer, Larson and Fulgoni 44 ) used the HEI-2005 to compute diet quality scores for vegetarians and non-vegetarians using one 24HR from NHANES 1999–2004 and, interestingly, found no difference in overall score between these populations. This is partly due to the scoring system for HEI-2005, which includes a ‘meat and beans’ component that awards points for higher meat consumption; the authors note that this index may not be well-suited for vegetarian populations. Additionally, Farmer et al.( Reference Farmer, Larson and Fulgoni 44 ) categorized vegetarians as individuals not reporting any meat consumption on a single 24HR; this would have a higher rate of misclassification compared with the present study that used the more conservative two 24HR to categorize non-meat eaters. The AHEI-2010 score for meat eaters in the present study is similar to the score Wang et al.( Reference Wang, Leung and Li 40 ) reported for the general population using NHANES 1999–2010, yet about 12 points lower than the score for the general population reported by Chiuve et al.( Reference Chiuve, Fung and Rimm 39 ) using data from the Nurses’ Health Study and Health Professionals Follow-Up Study.
It has been previously demonstrated that the HEI-2010 is a valid and reliable method for quantifying diet quality( Reference Guenther, Kirkpatrick and Reedy 45 ). Consistent relationships have been observed in prospective cohort studies between higher diet quality scores and lower risk of chronic disease in men, women, multiple race/ethnicities and older adults, using the HEI-2010 and AHEI-2010( Reference Liese, Krebs-Smith and Subar 32 , Reference Harmon, Boushey and Shvetsov 33 , Reference Reedy, Krebs-Smith and Miller 46 ). These studies also show high correlation between HEI-2010 and AHEI-2010 scores. We are therefore confident that, in the present study, diet quality has been effectively measured with the best tools currently available.
To the best of our knowledge there are no other studies that have compared diet quality component scores across different quintiles of diet quality among a national sample of US consumers eating meatless meals. We observed a wide variation in diet quality and diet patterns among non-meat eaters. HEI-2010 scores ranged from a mean of 38 in quintile 1 to a mean of 90 in quintile 5 (out of a maximum score of 100 points). AHEI-2010 scores ranged from a mean of 32 in quintile 1 to a mean of 64 in quintile 5 (out of a maximum score of 100 points). Others( Reference Harmon, Boushey and Shvetsov 33 ) have shown that, compared with individuals in the lowest HEI-2010 and AHEI-2010 quintile, those in the highest quintile have a 20–25 % lower risk of CVD mortality, 10–25 % lower risk of cancer mortality and 20–25 % lower risk of all-cause mortality. Importantly, our data suggest that a meatless diet is not necessarily a healthy diet, even though plant-based and vegetarian diets have been associated with greater health benefits than omnivorous diets in previous studies( Reference Dinu, Abbate and Gensini 1 , Reference Craig and Mangels 3 , Reference Orlich, Jaceldo-Siegl and Sabate 31 ). As others have noted( Reference Jacobs and Tapsell 47 – Reference Jacobs, Gross and Tapsell 49 ), diet quality is defined by the totality of foods consumed rather than by the presence or absence of a single food or nutrient.
At the same time, although the inclusion or exclusion of a single food or nutrient component cannot alone define overall diet quality, there is a large difference in the consumption of some foods and nutrients across diet quality scores. Therefore, in terms of creating focused and clear public health messages, there is value in emphasizing particular foods or nutrients for which there is a wide range in consumption. Although non-meat eaters have higher diet quality scores than meat eaters, public health messages aimed at those consuming meatless meals should focus on reducing consumption of empty calories (such as solid fat, added sugars and alcohol), and increasing consumption of unsaturated:saturated fatty acids, and nuts and legumes, because the consumption of these food components differs the most across diet quality quintiles. The 2015 Dietary Guidelines Advisory Committee( 50 ) reported that, for the general population, the source of most empty calories is fast-food restaurants, from foods such as hamburgers (solid fats) and soda (added sugars). Among non-meat eaters, diet quality could be improved if individuals replaced consumption of added sugars with less processed foods such as nuts and legumes which are a good source of unsaturated fatty acids. The food group recommendations provided by the Dietary Guidelines for Americans are the same for vegetarians and omnivores, but a distinct US Department of Agriculture Food Pattern has been developed to help guide vegetarians toward making food choices consistent with recommended protein intake (such as higher intake of nuts, seeds and soya products than is recommended for omnivores)( 8 ). As more individuals become interested in adopting vegetarian or other plant-based diets( 20 – 23 ), developing effective and targeted public health messages for these subgroups becomes more important. Our results here demonstrate the opportunity to emphasize potential targets for improving overall diet quality among these groups. Therefore, vegetarians, like all consumers, would benefit from intentional planning and purposeful choices to construct nutritionally adequate diets.
The relationship between the HEI-2010 and AHEI-2010 is complementary rather than comparative. Even though both indices are presented on 100-point scales (AHEI-2010 is conventionally presented on a 110-point scale when the trans-fat component is included), the components and their scoring are different. For example, even though both indices include whole fruit, HEI-2010 uses a 5-point scale whereas AHEI-2010 uses a 10-point scale; and total vegetables in HEI-2010 include white potatoes whereas in AHEI-2010 the vegetables category omits white potatoes. Both indices were used in the present study in order to gain information on more food components than could be gained by using only one index.
The present study has several limitations. The modest sample size for the non-meat eaters prevented stratified analyses, which limited our ability to assess effect modification by age, sex and other variables. However, even with this modest sample size, the differences between quintiles and between food components (i.e. foods and nutrients) were large enough to observe results at the level of P<0·05. A related consideration is that the proportion of non-meat eaters in the study (1·7 %) is lower than what has been reported by the Vegetarian Resource Group for the prevalence of vegetarianism (3·4 %)( Reference Stahler 21 ). This difference is in large part due to differences in data collection methodology, and both methods can result in bias, albeit of a different nature. Although data collected using a single 24HR represent mean usual intake at the population level( 36 ), categorizing individuals as meat eaters or non-meat eaters based on even two 24HR may result in misclassification. And, even an otherwise nationally representative data set may not accurately represent populations with rare behaviours, such as vegetarianism. In cases where the sample size is small, external validity can be reduced. In the Vegetarian Resource Group poll, data were collected using a seven-question screener and those that responded affirmatively to the question ‘I never eat meat, fish, seafood or poultry’ were classified as vegetarians. Data collected using this method, which focuses on predetermined food groups, may over-represent vegetarian status because respondents may modify their answers to improve their self-perceived standing with the interviewer. FFQ, which include more food categories than screeners and in this way can reduce bias, are still prone to large systematic bias and often require calibration with a less biased dietary assessment method in order to fully characterize diet patterns( 51 ). Because there is no unbiased method of estimating food intake, results obtained from multiple methods should be considered when drawing conclusions about the prevalence of vegetarianism and meatless eating.
Trans-fat consumption was not included in the AHEI score because of a lack of data availability in NHANES( Reference Wang, Leung and Li 40 ), yet we believe this would have a minor effect on overall AHEI scores because population-level estimates show that trans-fat consumption has decreased substantially from about 2 % of daily energy in 1999–2000 to about 0·5 % in 2009–2010( Reference Wang, Leung and Li 40 ). Importantly, because NHANES asked about self-reported vegetarian status only in the years 2007–2010, it is not possible to characterize a ‘true’ vegetarian population in this sample, but rather one with substantial overlap (roughly half of respondents consider themselves to be vegetarian) with a self-defined vegetarian population. At the same time, in some respects this partial overlap is a strength because it means these results may address the question ‘What do Americans eat when they don’t eat meat?’ The novel contribution of the present study is that it compares scores of food and nutrient consumption between quintiles of diet quality among a population of individuals consuming meatless meals.
Conclusion
Non-meat eaters have higher diet quality than meat eaters, yet a meatless diet is not necessarily a healthy diet. In the present sample of US adults who reported meatless eating, we found that individuals consumed different amounts of empty calories and unsaturated:saturated fatty acids when categorized by quintile of HEI-2010 score, and consumed significantly different amounts of nuts and legumes, vegetables and PUFA when grouped by quintile of AHEI-2010 score. Meatless eaters should be advised to improve their consumption of these food components, consistent with the concerns surrounding the general US population. Public health messages directed at the vegetarian/meatless eating population should emphasize these food groups as a way to improve dietary quality.
Acknowledgements
Acknowledgements: The authors thank LuAnn Johnson for her assistance with statistical analyses. Financial support: This research was funded in part by the US Department of Agriculture, Agricultural Research Service (grant number USDA 3062-51000-51-00D). The authors listed above had exclusive responsibility for the design, analysis and writing of this article. Conflict of interest: M.K. is on the Board of Directors for the Plant-Based Prevention of Disease Annual National Conference, and has received honoraria from the International Plant-Based Nutrition Healthcare Conference in 2014 and 2015. Authorship: Z.C. conceived of the study and its design. Statistical analyses were performed by Z.C., M.K. and K.C. All authors participated in data interpretation. Z.C., M.K. and K.C. drafted the manuscript. All authors provided critical revision of the manuscript for important intellectual content. Ethics of human subject participation: This study involved secondary data analysis and no personally identifiable information about individuals was available to the researchers. Therefore, ethical approval was not required.
Supplementary materials
To view supplementary material for this article, please visit http://dx.doi.org/10.1017/S136898001700026X


