


INTRODUCTION
How do citizens’ policy preferences vary across countries? How do they differ across issue domains? How have they changed over time? What are the sources of these ideological differences? How do mass preferences affect electoral and policy outcomes? Which political institutions inhibit or enhance government responsiveness to citizens’ preferences? Such questions lie at the heart of the field of European politics and of political science generally. To study them, scholars require measures of mass policy preferences that can be compared across countries and over time. Despite decades of cross-national survey research in Europe, however, measures that meet these standards remain elusive.
The key barrier to cross-national measures is a lack of survey questions repeated consistently across years and European countries. As a consequence, cross-national research on representation and related topics in European politics has relied instead on indirect proxies for mass policy preferences. By far the most common of these proxies are, first, the average citizen’s self-placement on a left–right scale (Huber Reference Huber1989; Inglehart and Klingemann Reference Inglehart, Klingemann, Budge, Crewe and Fairlie1976) and, second, the left–right location of the median voter as inferred from the ideological scores of party manifestos (De Neve Reference De Neve2011; Kim and Fording Reference Kim and Fording1998). The development of these measures was an understandable response to the limitations of existing data and statistical methods, and many excellent and influential studies of the role of mass ideology in European politics would hardly have been possible without them. With these measures, scholars have examined such central issues as governments’ ideological congruence with the mass public (Huber and Powell Reference Huber and Powell1994; Mayne and Hakhverdian Reference Mayne and Hakhverdian2017; McDonald and Budge Reference McDonald and Budge2005; Schmitt and Thomassen Reference Schmitt and Thomassen1997), their responsiveness to ideological shifts in popular preferences (Adams et al. Reference Adams, Clark, Ezrow and Glasgow2006, Reference Adams, Clark, Ezrow and Glasgow2004; Ezrow et al. Reference Ezrow, De Vries, Steenbergen and Edwards2010), and how these relationships are influenced by electoral rules and institutions (Blais and Bodet Reference Blais and Bodet2006; Ferland Reference Ferland2016; Golder and Stramski Reference Golder and Stramski2010; Powell Reference Powell2000, Reference Powell2009).
But as even many scholars that use them admit, these proxies are not ideal measures of citizens’ policy preferences per se. Left–right self-placement can depend greatly on political context, imperiling comparison across countries and time, and like other measures of ideological identification is often driven as much by partisan and symbolic attachments as by “operational” policy preferences (Inglehart and Klingemann Reference Inglehart, Klingemann, Budge, Crewe and Fairlie1976; Thorisdottir et al. Reference Thorisdottir, Jost, Liviatan and Shrout2007; see also Ellis and Stimson Reference Ellis and Stimson2012). For their part, median-voter scores hinge on assumptions about party manifesto scores’ comparability across countries and the primacy of left–right ideology in determining voters’ partisan choices (Kim and Fording Reference Kim and Fording1998, 76–7), thus begging some of the very questions that we wish to answer. Moreover, both of these proxies presume that ideological variation in Europe takes place along a single left–right dimension, an assumption that, however plausible in earlier eras, is called into question by the increasing salience of political conflict over non-economic issues (Inglehart Reference Inglehart1990; Kitschelt Reference Kitschelt1994; Knutsen Reference Knutsen1995; Kriesi et al. Reference Kriesi, Grande, Lachat, Dolezal, Bornschier and Frey2006). There is, in short, a clear need for summary measures of mass ideology that are derived directly from citizens’ policy preferences, can be compared across time and countries, and reflect the multidimensional character of European politics.
This article introduces measures of mass ideology in European publics designed to meet this need. Taking advantage of recent advances in ideological scaling methods, we estimate the domain-specific policy conservatism of men and women in three age categories and twenty-seven European countries in each biennium between 1981–82 and 2015–16. Specifically, we estimate an ordinal variant of Caughey and Warshaw’s (Reference Caughey and Warshaw2015) dynamic group-level item response theory (DGIRT) model on a comprehensive dataset of multi-country public opinion surveys, distinguishing among economic, social/postmaterial, and immigration/nationalism issues. For economic issues, we further distinguish between policy “mood,” which captures citizens’ preferences for less government activity relative to current policy (Stimson Reference Stimson1991), and “absolute” conservatism, which does not depend explicitly on the policy status quo. Because the DGIRT model estimates conservatism at the level of population groups rather than individuals, it surmounts the problem of sparse and uneven question availability that has until now stymied the creation of time-series–cross-national (TSCS) measures of policy ideology in Europe. This allows us to paint a rich new portrait of the conservatism of European mass publics across multiple issue domains.
Although most of our findings are consistent with previous survey research on issue-specific attitudes, many diverge sharply from the ideological patterns implied by self-placement or median-voter scores. According to our estimates, the European public has become more economically conservative in absolute terms since the 1980s, but its economic mood—that is, its conservatism relative to the policy status quo—has shifted leftward. Europeans have also become somewhat less conservative on immigration and much less so on social issues. Cross-sectionally, we find that men have always been substantially more conservative than women on economic issues, but not on immigration or (until recently) social issues. On social and immigration issues, conservatism increases markedly with age. On economics, age differences are more muted, but Europeans older than 60 tend to be less conservative than their younger counterparts.
All four measures exhibit a rich–poor gradient across countries that generally divides countries in Northern Europe from those in the South and East. On social and immigration issues, Northern Europeans are the most progressive and Southern and Eastern Europeans are the most conservative. On economic issues, the gradient is reversed. Most Northern publics are more economically right-wing, especially in terms of mood. By contrast, Southern Europe and most of Eastern Europe, with the exception of a few wealthier countries, tend to be very left-wing on economics. Across countries, economic mood thus has a strong negative association with social and immigration conservatism (which are positively correlated with each other), whereas absolute economic conservatism covaries with economic mood but is essentially uncorrelated with social and immigration conservatism. These patterns indicate that a single left–right dimension cannot capture cross-national ideological variation in Europe. In line with this, we find that self-placement and median-voter scores are at best weakly associated with policy conservatism in any domain (as well as with each other).
To demonstrate the validity of our measures of policy conservatism, we show that they have a strong cross-sectional correlation with responses to highly ideological survey questions in their respective domains. Our conservatism scores also faithfully reflect longitudinal trends in mass conservatism as estimated by Stimson’s (Reference Stimson1991) Dyad Ratios algorithm. In addition, we evaluate the relationship between our mass ideological measures and government policies. Cross-sectionally, mass-level social progressivism strongly predicts the strength of countries’ gay rights policies, and progressivism on immigration does so on pro-immigrant policies. Moreover, within country, variation in economic mood predicts variation in welfare generosity. Notably, our conservatism scores are more highly correlated with each of these policy outcomes than are self-placement and median-voter scores. We also show that mass economic conservatism predicts voting behavior. Overall, we conclude that the ideological constructs measured by our mass conservatism scores are both substantively important and fundamentally distinct from those measured by self-placement and median-voter scores.
POLICY IDEOLOGY IN EUROPEAN MASS PUBLICS
The correspondence between citizens’ preferences and government policies lies at the core of normative justifications for democracy, if not its very definition, and is thus a central concern of comparative politics (Dahl Reference Dahl1989; for an empirical review, see Powell Reference Powell2004). Scholars of European politics, site of many of the world’s longest-standing democracies, have accordingly developed a rich literature on the content and structure of mass policy preferences.
Citizens’ specific attitudes are typically presumed to be structured along one or more ideological dimensions, rooted in divergent interests and values. The cleavage over the distribution of economic resources has always played a central role in structuring ideological conflict and party competition in Europe. Since the seminal work of Lipset and Rokkan (Reference Lipset, Rokkan, Lipset and Rokkan1967), however, the literature on parties and mass behavior has recognized “the importance of alternative, ‘second’ dimensions of political conflict” over religion and other cultural issues (Häusermann and Kriesi Reference Häusermann, Kriesi, Beramendi, Häusermann, Kitschelt and Kriesi2015, 202). These two main ideological dimensions, typically labeled economic and cultural, have survived or even been reinforced by the rise of new issues such as environmentalism and gay rights, with their content evolving over time as new issues arise (e.g., Inglehart Reference Inglehart, Dalton, Flanagan and Beck1984; Kitschelt Reference Kitschelt1994). One possible exception to this pattern is the recent emergence of issues of national identity, particularly as related to immigration, which some scholars argue has now become a distinct third dimension of political conflict (Heath et al. Reference Heath, Taylor, Brook and Park1999; Kitschelt and Rehm Reference Kitschelt and Rehm2014; but see Kriesi et al. Reference Kriesi, Grande, Lachat, Dolezal, Bornschier and Frey2006).
The content and relative importance of these ideological dimensions has varied across time and countries. As Inglehart (Reference Inglehart1990) argues, the increasing salience of “postmaterialist” concerns has been tied to rising levels of wealth. Younger generations, socialized in more affluent circumstances, have placed greater emphasis on postmaterialist values and have tended to be more left-libertarian than their forebears (Inglehart Reference Inglehart1985; Kriesi Reference Kriesi1998, 174–6). Moreover, postmaterialism has emerged at different rates across countries depending on their level of economic development. For this and other reasons, scholars have found substantial ideological variation in issue attitudes across European publics, with much of the cross-national variation falling along north–southeast, rich–poor lines.
On economic issues, the publics of Southern and Eastern European countries have generally been found to be more left-wing than their Northern European counterparts. Bonoli (Reference Bonoli2000), for example, shows that Southern Europe, along with France, stands out as particularly supportive of government intervention in the economy. Similarly, Papadakis and Bean (Reference Papadakis and Bean1993) and Kenworthy and McCall (Reference Kenworthy and McCall2008) find Italians to be more supportive of economic redistribution than Northern European publics. Renwick and Tóka (Reference Renwick, Tóka, Jowell, Curtice, Park, Brook, Thomson and Bryson1998), Lipsmeyer and Nordstrom (Reference Lipsmeyer and Nordstrom2003), and Dallinger (Reference Dallinger2010) find that, with the possible exception of the Czech Republic, Eastern European countries are more left-wing on government spending and other economic issues than countries in Western Europe. Paradoxically, there is at best mixed evidence that the generosity of welfare states is positively correlated with mass support for economic redistribution, government provision of social benefits, or related issue positions (Jaeger Reference Jaeger2006). In particular, Scandinavians, despite enjoying arguably the most generous welfare states in the world, express less support for redistributive policies than Germans, Austrians, and other Central Europeans (Jaeger Reference Jaeger2009).
The cross-national patterns uncovered by research on cultural and postmaterial issues tend to be the opposite of the patterns on economic issues. Generally speaking, studies of these issues have found that Northern European countries are the most socially progressive, while Southern and Eastern European countries are the most conservative. On gender issues, for example, a small set of countries have highly egalitarian views: the Scandinavian countries plus the Netherlands. Southern and Eastern European countries are the most traditional, with other countries in the middle (Renwick and Tóka Reference Renwick, Tóka, Jowell, Curtice, Park, Brook, Thomson and Bryson1998; Sjöberg Reference Sjöberg2004; Treas and Widmer Reference Treas and Widmer2000). Likewise, studies of support for gay rights find a clear north–south and east–west income gradient across countries. Most European countries saw big rises in support for gay rights over the period we examine, with the Scandinavian countries (excluding Finland) and the Netherlands showing the biggest rises. By contrast, aside from Spain, Southern and Eastern European countries did not see substantial rises in support and remain quite opposed to homosexuality (Akker, Ploeg, and Scheepers Reference Akker, van der Ploeg and Scheepers2013; Andersen and Fetner Reference Andersen and Fetner2008; Pew Research Center 2017). Environmental issues exhibit similar cross-national patterns (Franzen and Vogl Reference Franzen and Vogl2013; Inglehart Reference Inglehart1995).
As noted above, some scholars have advocated treating immigration and related issues of national identity as a distinct ideological dimension. Multi-nation survey research of immigration has been comparatively rare, but what work exists finds cross-country patterns similar to those on social issues. Austria, Greece, Hungary, Poland and Portugal stand out as relatively conservative on immigration, and Sweden, Denmark and Switzerland as relatively progressive (Meuleman, Davidov, and Billiet Reference Meuleman, Davidov and Billiet2009; Semyonov, Raijman, and Gorodzeisky Reference Semyonov, Raijman and Gorodzeisky2008). While correlated with social/cultural attitudes in cross section, immigration attitudes have not been found to share the social issues’ clear liberalizing trend over time. In fact, different cross-national studies have documented a mix of increasing, decreasing, and stable trends in anti-immigration attitudes since the late 1980s (Ceobanu and Escandell Reference Ceobanu and Escandell.2010, 312–3).
Previous Approaches to Summarizing Mass Ideology
Despite the wealth of cross-national opinion data that have accumulated over the past several decades, scholars of European politics have faced substantial hurdles to summarizing general ideological trends across time and countries. The problem, notes Dalton (Reference Dalton, Dalton and Anderson2010, 105), is that the “diversity of issues across elections and nations [makes it] difficult to systematically and meaningfully compare” mass ideology across political contexts. To surmount these difficulties with direct survey measures of mass issue attitudes, scholars of European politics have turned to proxy measures intended to summarize mass ideology in ways that are comparable across countries and over time. The two most important are citizens’ self-placement on a left–right ideological scale and the ideological location of the median voter as inferred from election results and party manifestos.
Self-Placement on a Left–Right Scale
Beginning with the European Community’s 1973 Eurobarometer survey, a large number of cross-national surveys in Europe have included a question asking respondents to place their political views on a ten-point left–right scale, making it the only question that has been asked regularly and consistently across countries and over time. Since their introduction, left–right self-placement scores have been used by numerous works to summarize ideological differences across countries and time (e.g., Huber Reference Huber1989; Knutsen Reference Knutsen1998) and to test substantive theories of democratic politics (Adams et al. Reference Adams, Clark, Ezrow and Glasgow2004; Blais and Bodet Reference Blais and Bodet2006; Huber and Powell Reference Huber and Powell1994; Schmitt and Thomassen Reference Schmitt and Thomassen1997). From the beginning, however, scholars have expressed skepticism toward “the classic view of the left–right dimension…as a super-issue which summarizes the programmes of opposing groups,” arguing instead that citizens’ ideological self-placement reflects partisan and other group identities, as well as symbolic associations, at least as much as it does issue preferences (Inglehart and Klingemann Reference Inglehart, Klingemann, Budge, Crewe and Fairlie1976, 244; see also Huber Reference Huber1989; Knutsen Reference Knutsen1997).Footnote 1
Self-placement scores have also been criticized for differential item functioning, as the meaning of ideological labels can vary substantially across countries and even across individuals and social groups within the same country (Bauer et al. Reference Bauer, Barbera, Ackermann and Venetz2017; Lo, Proksch, and Gschwend Reference Lo, Proksch and Gschwend2014; Thorisdottir et al. Reference Thorisdottir, Jost, Liviatan and Shrout2007).Footnote 2 “Thus, to a German blue-collar worker,” writes Dalton (Reference Dalton, Dalton and Anderson2010, 105), “Left may still mean social welfare policies; to a young German college student it may mean environmental protection and issues of multiculturalism.” If policy preferences are multidimensional, this last fact is particularly problematic because it implies that an individual’s self-placement can depend on which policy issues they associate with those labels. In short, although left–right self-placement is the best single-question indicator of mass ideology, it is far from an ideal summary of citizen’s policy preferences.Footnote 3
Inferred Median-Voter Locations
In response to the perceived inadequacies of self-placement scores, Kim and Fording (Reference Kim and Fording1998) developed an alternative measure of voter ideology: the median voter’s inferred position on a left–right scale (see also De Neve Reference De Neve2011). This measure is premised on a spatial model of elections in which the only systematic determinant of vote choice is voters’ proximity to parties on a left–right ideological dimension. Under this model, the location of the median voter can be inferred from the distribution of vote share across parties with different ideological positions, which Kim and Fording (Reference Kim and Fording1998) measure using the Comparative Manifesto Project (CMP) ideological ratings of party platforms (Budge et al. Reference Budge, Klingemann, Volkens, Bara and Tanenbaum2001). Assuming that this unidimensional spatial model holds and that the coding of party positions is comparable across countries and over time, median-voter scores are valid measures of mass policy preferences. Median-voter scores’ calculability in years and countries without survey data make them particularly powerful measures, and they have been used by a large number of substantive studies (e.g., Adams and Somer-Topcu Reference Adams and Somer-Topcu2009; Kim, Powell, and Fording Reference Kim, Powell and Fording2010; McDonald and Budge Reference McDonald and Budge2005; Pontusson and Rueda Reference Pontusson and Rueda2010; Stevenson Reference Stevenson2001).
Notwithstanding their usefulness, median-voter scores have been subject to a number of criticisms (for a compelling summary, see Warwick and Zakharova Reference Warwick and Zakharova2012). Some of these criticisms stem from problems with the CMP coding that underlies the median-voter scores (Curini Reference Curini2010; Mikhaylov, Laver, and Benoit Reference Mikhaylov, Laver and Benoit2012). But even granting the validity of the CMP measure of party positions, the spatial-voting assumptions required to infer the location of the median voter from party vote shares are arguably quite strong because they rule out any systematic influences on vote choice aside from ideology. More to the point, insofar as median-voter scores are used to evaluate mass–elite linkages, these assumptions risk begging the question by presuming what they seek to demonstrate.
Finally, both median-voter and self-placement scores share the assumption that European politics takes place along a single left–right dimension. Whether or not this assumption is reasonable for elite politics (for evidence against, see Warwick Reference Warwick2002), it runs counter to the large literature reviewed earlier that emphasizes the multidimensionality of societal cleavages and mass policy preferences. Given that the issue-specific evidence suggests that many countries are left-wing on some issues but right-wing on others, the inadequacy of the assumption of unidimensionality is particularly glaring if the goal is cross-national comparison.
Inferring Ideology from Issue Preferences
The limitations of self-placement and median-voter scores are widely recognized, and even works that employ them sometimes admit that a direct survey-based measure of mass policy ideology would be preferable. Several recent reviews have called for more attention to and better measures of (multidimensional) issue preferences in the mass public (Powell Reference Powell2004, 290–1; Evans Reference Evans2010, 636–7; Franklin Reference Franklin2010, 654). At present, however, self-placement and median-voter scores are pretty much the only available options for scholars who require a time-varying, cross-national measure of mass ideology. Stevenson (Reference Stevenson2001, 623–4), for example, laments that while scholars of US politics have measured mass ideology by “combining information from thousands of different survey questions,” in other democracies “the available survey data on the policy opinions of citizens…are not nearly as comprehensive…, rendering similar measurements for these countries impossible” and requiring the use of proxy measures instead. The crux of the problem, as Kim and Fording (Reference Kim and Fording1998, 75) put it, is the lack of “enough identical questions…across enough countries to provide a reasonable basis for a survey-based measure of ideology.” Though survey-based time-series of mass policy ideology have been constructed for single countries (Bartle, Dellepiane-Avellaneda, and Stimson Reference Bartle, Dellepiane-Avellaneda and Stimson2011; McGann Reference McGann2014; Stimson, Thiébaut, and Tiberj Reference Stimson, Thiébaut and Tiberj2012), to date there has been no equivalent measure available for TSCS analyses across multiple countries.
In the following sections, we describe a strategy for measuring mass ideology that overcomes the problem of sparse survey data and yields dynamic, cross-national, domain-specific measures of mass policy ideology across European countries. Our approach shares elements in common with both existing methods. Like self-placement scores, our measures are based on self-reported assessments of political preferences. Like the median-voter approach, however, we do not measure mass ideology directly, but rather treat it as a latent trait whose distribution can be inferred from aggregate data on citizens’ political preferences. Unlike prior approaches, we do not assume a priori that mass ideology is unidimensional, but rather allow it to differ across issue domains. Generating these measures requires both a great deal of survey data and a measurement model linking the data to latent policy ideology. Below, we describe each of these in turn.
SURVEY DATA AND ISSUE DOMAINS
We constructed a comprehensive dataset containing all multi-year cross-national surveys conducted in Europe between 1981 and 2016. These include the European Social Survey (ESS), various modules of the International Social Survey Program (ISSP), the European Values Survey (EVS), the Pew Global Attitudes Survey, and some special editions of the Eurobarometer. Almost all Western and Southern European countries and nine countries from the former Eastern Bloc appear in the data, for a total of 27 nations in all.Footnote 4 For most of Western Europe, the dataset begins in 1981 with the first cross-national surveys with usable issue questions, but many countries, including Greece, Cyprus, and most of Eastern Europe, do not appear in the data until the end of the 1980s. Every survey question in the dataset concerns domestic policy issues and was asked with identical wording across multiple years and countries.
In light of the debates over the dimensionality of Europeans’ issue preferences, we sorted questions into three substantive domains: economic, social, and immigration. The economic domain captures the classic left–right divide over the size and scope of government and its role in mitigating inequality. The social domain comprises postmaterial and cultural issues such as gender equality, abortion, gay rights, environmental protection, and libertarianism versus authoritarianism.Footnote 5 The immigration domain encompasses questions related to nationalism and national identity as well as those pertaining to immigration specifically.
Within the economic domain, we further distinguish between questions that ask about policy values or outcomes directly and those that ask about the direction of change relative to current policy.Footnote 6 We refer to questions in the first category as absolute and those in the second as relative. This second category roughly corresponds to James Stimson’s concept of public policy mood—the public’s desire for the government to “do more or less, spend more or less, and tax more or less” (Stimson Reference Stimson2012, 25). Because relative preferences depend on the policy status quo, two individuals from countries with different policies may well differ in their relative preferences even if they share the same absolute preferences. Lipsmeyer and Nordstrom (Reference Lipsmeyer and Nordstrom2003, 340), for example, report that Eastern and Western Europeans do not differ on average in their opinions regarding the scope of state responsibility for the needy, but support for increases in state welfare spending is nevertheless significantly higher in Eastern Europe. In short, there are both conceptual and empirical reasons to measure absolute and relative economic conservatism separately from one another.
We thus created four separate datasets with non-overlapping question sets: absolute economic, relative economic, social, and immigration. As Table 1 indicates, each dataset contains at least 17 survey questions and half a million unique respondents. The absolute economic and social datasets extend back to 1981 while the relative economic and immigration data begin in 1985 and 1990, respectively.Footnote 7 By estimating our measurement model separately on each dataset, we produce four distinct measures of mass conservatism.
Summary Statistics
We emphasize that our categorization of questions was based on ex ante substantive judgment and not on statistical criteria for selecting the “correct” number of latent dimensions, making it analogous to confirmatory rather than exploratory factor analysis. As we report in the SI (Figure S7), however, we find that nearly all questions in the same dataset are positively correlated, and there is a clear drop-off in explanatory power between the first principal component and higher-order ones. We therefore consider it reasonable to summarize the variation in each dataset with a single latent trait. We recognize, however, that other scholars might make different choices, and to facilitate this we are making our full code available online, together with instructions for how survey questions could be combined differently to produce estimates for other domains or for different numbers of dimensions.
Illustrative Survey Questions
To illustrate the patterns in our survey data, Figure 1 plots opinion trends on three survey items in each domain (absolute economic, relative economic, social, and immigration). Results are shown for four countries—Hungary, Italy, Norway, and Great Britain—from different parts of Europe. As this figure makes clear, ideological differences across countries differ substantially depending on the issue domain.
Opinion Trends on Illustrative Survey Questions for Four Countries
Note: The horizontal axis Indicates the proportion of respondents in the country who were more conservative than average on that question.
The top row of Figure 1 plots trends on three questions that tap into absolute economic preferences: whether the government should be responsible for mitigating income inequality, tax the rich at a higher rate than the poor, and be responsible for providing for the unemployed. The relative positioning of the countries differs somewhat depending on the question. Great Britain is usually the most conservative country on all three questions, especially since 2000, whereas Italy and Hungary tend to be further left. Norway, by contrast, is relatively conservative on income inequality and progressive taxation, but the most leftwing on providing for the unemployed. In general, Hungary and Italy drifted leftward between the 1990s and 2000s, whereas Norway and Great Britain remained stable or became more conservative. The overall pattern, however, is that opinions on absolute economic issues have remained fairly consistent over time.
Opinion change tends to be larger on questions concerning change relative to the status quo (second row). This makes sense, since relative preferences are a function both of absolute preferences and of current conditions. For example, the British public’s position on whether income differences are too large and taxes on the rich too high (second row, first and second columns) shifted sharply rightward between the early and late 1990s, despite little change in the British public’s general opposition to government responsibility for inequality and progressive taxation (top row, first and second columns). Hungary exhibited an even more striking leftward shift on these relative questions between the communist-era 1980s and the 2000s. The influence of the status quo may also explain why Norwegians are consistently leftwing on responsibility for the unemployed (first row, third column) but rightwing on whether to spend more on the unemployed (second row, third column), for even someone who leans left relative to most Europeans might nevertheless regard Norway’s unusually expansive welfare state as overly generous.
Cross-national differences on social and immigration questions are almost directly opposite to those on economics. On both non-economic domains, Norwegians are clearly the most progressive of the four publics, especially in recent years. On the other end of the ideological spectrum, Hungarians express by far the greatest conservatism on immigration and (except for abortion) social issues. Unlike the other three domains, social issues exhibit an overall trend toward greater progressivism over time, particularly with regard to homosexuality. On immigration, there is some evidence of countervailing opinion trends across countries. Most strikingly, during the refugee crisis of the 2010s, support for banning immigrants from poor countries jumped in Hungary and Italy but fell sharply in Great Britain and to a lesser extent Norway.
As this analysis illustrates, the idiosyncratic variation on individual survey items and their uneven availability across countries and time can make it difficult to discern common trends. Nevertheless, suggestive patterns do emerge when we analyze questions within domains and compare across them. In the next section, we describe a measurement strategy that enables us to bring these patterns into clearer relief using data on many more questions and countries.
MEASUREMENT MODEL
Using survey responses to estimate citizens’ ideology requires a measurement model that connects the (observed) data to the (unobserved) latent trait. Item response theory (IRT) provides a convenient framework for this task. In an IRT model, subjects’ responses are jointly determined by their score on the latent trait—in our case, their domain-specific conservatism—and by the characteristics of the particular question. Because most survey items in our dataset offer ordered response options (e.g., strongly agree, agree, neither agree nor disagree, etc.), we employ an ordinal IRT model. In the probit version of this model, subject i’s probability of responding to question q with response option k ∈ 1…K q is
 $$\Pr \left( {{y_{iq}} \!=\! k{\rm{|}}{\theta _i},{\beta _q},{{\bi{\boldalpha }}_q}} \right) \!= \!\Phi \left( {{\beta _q}{\theta _i} - {\alpha _{q,k - 1}}} \right) - \Phi \left( {{\beta _q}{\theta _i} - {\alpha _{q,k}}} \right),$$
where Φ is the normal cumulative distribution function, θ i is i’s domain-specific conservatism, β q is the “discrimination” of item q with respect to that trait, and the K q + 1 thresholds αq are ordered as −∞ = α q,0 < α q,1 < … < α q,K−1 < α q,K = ∞ (Fox Reference Fox2010, 12–4).Footnote 8
In a typical application, an individual-level IRT model would be used to estimate each respondent’s conservatism based on his or her responses to multiple issue questions in a given domain (e.g., Treier and Hillygus Reference Treier and Hillygus2009). Unfortunately, because European surveys conducted in different countries and time periods have included different survey questions, and each respondent usually answers no more than a handful of questions, an individual-level approach is not feasible in the European context. Our solution to this difficulty is to marginalize over the distribution of conservatism across individuals and instead estimate average conservatism in different segments of the public, using a group-level IRT model (Mislevy Reference Mislevy1983). Although our main focus in this application is cross-national comparison, we estimate conservatism at a lower level of aggregation, in groups defined by the cross-classification of country, gender, and age categories. In addition to being substantively interesting, these population groups were chosen because they are measured in a standardized way across countries and surveys and because their population proportions are available from census data, which means that national conservatism can be estimated by weighting the group estimates to match their distribution in the population.
The specific model we use is an ordinal variant of the Bayesian dynamic group-level IRT model developed by Caughey and Warshaw (Reference Caughey and Warshaw2015).Footnote 9 In an ordinal DGIRT model, the probability that in period t a randomly sampled member i of population group g selects response option k to item q is
 $$\eqalign{\Pr \left( {{y_{iq}} = k{\rm{|}}{{\bar{\theta }}_{g[i]t[i]}},{\beta _q},{{\bi{\boldalpha }}_q},\sigma _\theta ^2} \right) = \Phi \left( {{{{\beta _q}{{\bar{\theta }}_{g[i]t[i]}} - {\alpha _{q,k - 1}}} \over {\sqrt {1 + \beta _q^2\sigma _\theta ^2} }}} \right) \cr- \Phi \left( {{{{\beta _q}{{\bar{\theta }}_{g[i]t[i]}} - {\alpha _{q,k}}} \over {\sqrt {1 + \beta _q^2\sigma _\theta ^2} }}} \right) = {\pi _{tgqk}},$$
where  ${\bar{\theta }_{gt}}$ is the average of θ i in group g at time t and $\sigma _\theta ^2$ is the variance of θ i within groups. The vector of probabilities ${{\bi{\pi }}_{tgq}} = \left( {{\pi _{tgq1}}, \ldots ,{\pi _{tgq{K_q}}}} \right)$ can then be linked to the data via a multinomial sampling model,
 $${{\bi{s}}_{tgq}} \,\,\sim\,\, {\rm{Multinomial}}\left( {{{\bi{\pi }}_{tgq}}} \right),$$
where  ${{\bi{s}}_{tgq}} = \left( {{s_{tgq1}}, \ldots ,{s_{tgq{K_q}}}} \right)$ is the number of respondents in group g who in period t selected category k in response to question q.
In each period, the prior distribution for  ${\bar{\theta }_{gt}}$ is given by a local-level transition model, ${\bar{\theta }_{gt}} \sim N\left( {{{\bar{\theta }}_{g,t - 1}},\sigma _{\bar{\theta }}^2} \right)$. In periods when data are sparse (or absent), this transition model smooths (or imputes) estimates of ${\bar{\theta }_{gt}}$ based on the estimates for adjacent years. To identify the polarity of the latent conservatism space, we restrict each β q to be positive (and recode the survey data so that higher responses are more conservative). To identify its location and scale, we normalize the ${\bar{\theta }_{tg}}$ to have zero mean and unit variance across groups and time periods. We sampled from the posterior distribution of this model using the Bayesian programming language Stan (Stan Development Team 2018), as implemented in R by the dgo package (Dunham, Caughey, and Warshaw Reference Dunham, Caughey and Warshaw2019). We ran four chains with 2,000 iterations each, with the first half of each chain as warmup, and based inferences on 4,000 samples from the posterior distribution. For further details on the derivation and implementation of the model, see Sections 8 and 9 of the SI.
ESTIMATES OF MASS POLICY CONSERVATISM
By applying the ordinal DGIRT model to each of our four datasets, we obtained four biennial measures of the average conservatism of men and women aged 16–34, 35–59, and 60+ in each European country.Footnote 10 As noted above, our decision to estimate conservatism at the level of gender × age groups was based on a combination of substantive considerations and data availability. First, ideological differences between sexes and age groups are theoretically and politically important. Second, these demographic variables are measured consistently across surveys, and data on each group’s population share are available for all countries and periods from Eurostat (http://ec.europa.eu/eurostat/data/database). The latter data are necessary in order to poststratify the group estimates into estimates of national averages. Other potentially interesting variables, such as party identification or education, were not examined because they either were measured differently across surveys or did not appear in the Eurostat data, precluding poststratification.Footnote 11
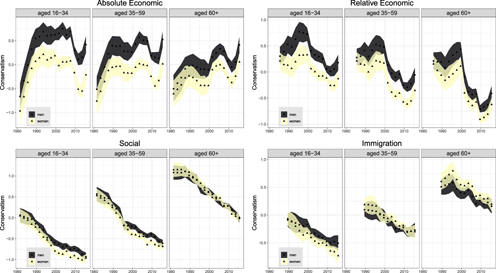
We begin by examining ideological trends for men and women and for the three age groups. In line with existing literature (e.g., Iversen and Rosenbluth Reference Iversen and Rosenbluth2006), we find that on economic issues, European men, especially young men, have consistently displayed greater conservatism than their female counterparts (Figure 2, top panels).Footnote 12 By contrast, on social and immigration issues (bottom panels), men and women are much more similar. There is tentative evidence that a gender gap has developed recently on social issues, as well as hints among young men and women that a similar gap may be emerging on immigration. Overall, however, gender differences are much less pronounced on social and immigration issues than on economics.
Trends in Mass Conservatism by Gender, Age Group, and Issue Domain
Note: Triangles and lighter color indicate women; circles and darker color indicate men.

Age divides European publics as well, but in different ways across issue domains.Footnote 13 On economic issues, the elderly have been a little more left-wing than the two younger age groups across most of the period, with the young and middle-aged holding very similar positions. For social and postmaterial issues, there is a very clear gradient by age. The youngest people have always been much more socially progressive than the middle-aged, who in turn have always been much more progressive than the oldest. Similarly, on immigration, the elderly are more conservative than the two younger age groups across the whole period.
The four conservatism measures also differ in their trends over time. After increasing substantially in the 1980s, mass economic conservatism plateaued, changing little between 1990 and the early twenty first century. During and immediately after the 2008–09 economic crisis, all groups shifted sharply leftward on economics. This change proved only temporary, however, as economic conservatism reverted to its pre-crisis levels by the time our data end in 2016. In contrast, economic mood has trended in a liberal direction since the mid-1990s among all age groups. The divergence between absolute conservatism and policy mood on economic issues could be due to the general retrenchment of the welfare state that occurred across Europe at this time. This retrenchment could have led to thermostatic responsiveness, whereby the public reacts to the decline in the size of government by preferring greater government spending (Soroka and Wlezien Reference Soroka and Wlezien2010).
Social conservatism, on the other hand, declined steadily over the whole thirty-six years of our data, with the most rapid changes occurring in the 1980s and 1990s for the two younger age groups. Due to lack of survey data, we can estimate immigration conservatism only since 1989. We find that it too decreased over the period, albeit less than social conservatism did. Over the past decade, as the immigration crisis in Europe has intensified, this leftward movement appears to have stalled among most age groups.
To estimate mean conservatism in each country-biennium, we average the estimates for gender-age strata, weighted in proportion to their composition of national populations at each point in time. Figures 3 and 4 plot these estimates over time, separately for each country. Within each panel, countries are ordered according to their average conservatism across years on the respective measure.
Economic Conservatism and Mood within Countries Over Time
Note: Within each plot, countries are ordered by their conservatism. Each country's time series begins in the first biennium with survey data from that country. Subsequent biennia without survey data are indicated with hollow circles.

Social and Immigration Conservatism within Countries Over Time
Note: Within each plot, countries are ordered by their conservatism. Each country's time series begins in the first biennium with survey data from that country. Subsequent biennia without survey data are indicated with hollow circles.
All four figures show a clear north–south ideological divide, but the direction of this cleavage differs across domains. Southern European countries, most notably Greece, tend toward the left-wing end of the economic scales (Figure 3) but are closer to the conservative end of the social and immigration scales (Figure 4). In contrast, Northern countries, such as Denmark and the Netherlands, are the least conservative on social issues and immigration but are more conservative on economics, particularly mood. Meanwhile, on social issues and immigration, Eastern European countries are almost all amongst the most conservative and tend to be similar to Southern European countries. On economic issues, most Eastern European countries also share greater progressivism with their Southern counterparts, although the Czech Republic (with its highest GDP per capita in Eastern Europe), Estonia, and Lithuania are markedly more conservative on absolute economic questions.
Figure 5 plots the cross-national relationships between the four conservatism measures. As the top-left panel shows, social and immigration conservatism have a strongly positive correlation across countries. Moreover, although their trends have differed somewhat over time, there is little sign that immigration conservatism is emerging as a distinct dimension. In 2015–16, for example, the correlation between the two measures (R = 0.78) was as high as it has ever been. There is also a robust positive correlation between absolute and relative conservatism on economic issues (top-right). There is, however, a distinct cluster of Eastern European nations whose relative conservatism is much lower than their absolute conservatism would suggest, as well as a few Northern countries (most notably Denmark) whose relative conservatism is anomalously high. Again, the differences between the two economic measures probably reflect the different economic policies in place in the two sets of countries.
Cross-Country Correlations Between Ideological Measures
Note: Abbreviations indicate countries' average domain-specific conservatism across all biennia. Gray crosses indicate 95% credible intervals.
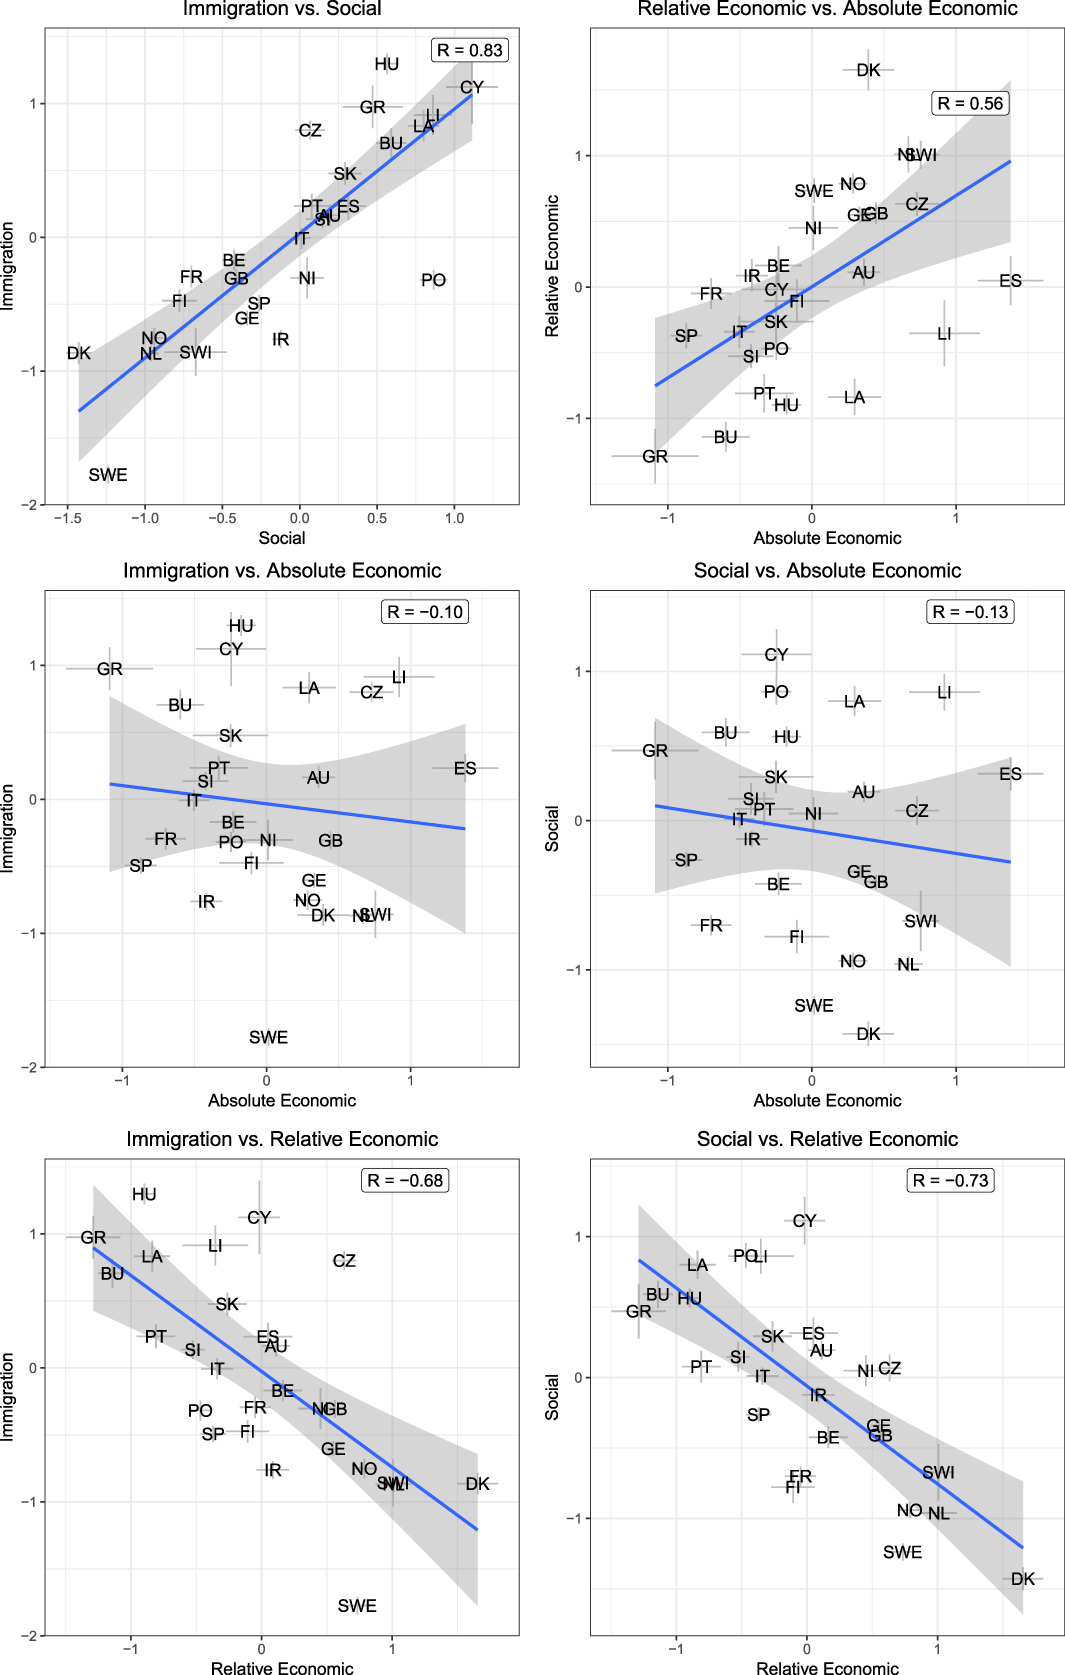
Although conservatism is highly correlated within the economic and non-economic domains, this is not true across the domains. As the middle panels show, absolute economic conservatism is essentially unrelated to social and immigration conservatism. Even more strikingly, relative economic conservatism has a strong negative association with both social and immigration conservatism. These negative correlations imply that it is not meaningful to say that certain European publics are conservative across the board. Rather, in contemporary Europe, countries that are conservative on relative economic issues are nearly all fairly progressive on social and immigration issues, and countries that have leftwing economic mood tend to be right-wing on social and immigration issues (compare Malka, Lelkes, and Soto Reference Malka, Lelkes and Soto2017). These patterns thus provide empirical justification for measuring conservatism separately by domain.
VALIDATION
We provide evidence for the validity of our measures of mass policy conservatism with two kinds of validation: convergent and construct (Adcock and Collier Reference Adcock and Collier2001). The purpose of convergent validation is to show that a new measure is empirically associated with alternative measures of the same concept. We do this by comparing our conservatism estimates with responses to individual survey questions and with alternative longitudinal measures of mass conservatism. We then turn to construct validation, the goal of which is to demonstrate the empirical association between a new measure of a given concept and an existing measure of another (distinct) concept believed to be causally related to the concept of interest. We do this by evaluating the relationships between mass conservatism and government policies in the same domain. Overall, we find abundant evidence that our measures are valid summaries of mass policy preferences in a given domain.
Convergent Validation: Comparison with Survey Measures
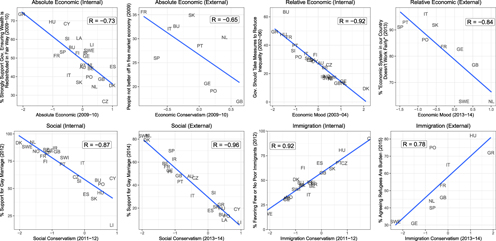
We begin with convergent validation, demonstrating that our measures are strongly correlated with alternative indicators of domain-specific policy preferences. Specifically, we compare our conservatism estimates with responses to highly ideological survey questions in each domain. Figure 6 shows the correlation of our estimates on each domain with one “internal” issue question that is included in the data used to estimate our conservatism scores and one “external” issue question that does not contribute to our estimates.Footnote 14 All of these comparisons show a strong correlation between our ideology estimates and specific issue questions on each domain (see SI, Section 10 for more details).
Correlations Between Domain-Specific Conservatism and Individual Issue Questions
Note: The first and third columns validate the scale against “internal” issue questions included in the data used to estimate the corresponding conservatism scores, whereas the second and fourth columns validate against “external” questions not included in the original data.

To complement the cross-sectional comparisons above, we also evaluate the over-time dynamics in our conservatism scores. We do so by using Stimson’s (Reference Stimson1991) Dyad Ratios algorithm to estimate aggregate trends in domain-specific conservatism and comparing the results with our estimates of average conservatism at each point in time. Since we apply both methods to the same set of data, the primary purpose of this comparison is to show that our results are not driven by the particular model that we use.Footnote 15 The Dyad Ratios algorithm is similar to the DGIRT model in that its goal is to summarize broad ideological patterns across many issue-specific questions. The most important difference between the two methods is that Dyad Ratios leverages only longitudinal variation, whereas the DGIRT model accounts for cross-sectional variation as well. Even though this distinction leads the methods to give items different implicit weights, the two sets of estimates are quite similar. As Figure 7 shows, standardized versions of the two time series generally track each other and are robustly correlated, especially on social and relative economic conservatism. This congruence between the two series provides reassurance that our model faithfully represents longitudinal as well as cross-sectional variation in mass conservatism.
Comparing Our Domain-Specific IRT Estimates of Mass Conservatism in Western Europe (Averaged Across Countries in Each Biennium) with Analogous Estimates Calculated Using Stimson’s Dyad Ratios Algorithm
Note: Both models use the same data. All series have been standardized to have zero mean and unit variance within country, and are coded so that higher scores are conservative.
Construct Validation: Policy Representation and Voting
We now evaluate the relationships between our estimates, and voting and policy outcomes. Assuming that government policies are indeed influenced by mass policy preferences (see Powell Reference Powell2004, 282–91) and that mass ideology predicts voting behavior, evidence for these theoretical relationships should provide construct validation for our measures. Considering one policy area each for social issues, immigration, and economic mood, we find that domain-specific ideology not only predicts government policies but also does so better than the two most commonly used measures of mass ideology in the literature to date: left–right self-placement and median-voter positions. We first report cross-sectional analyses of the social and immigration domains and then describe a panel analysis of economic policy.Footnote 16 Finally, we show that absolute economic conservatism is correlated cross-sectionally with voting in European Parliament elections, although here our measure performs about as well as left–right placement.
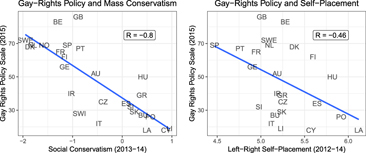
Social Conservatism and Gay Rights Policy
First, we examine policy responsiveness on gay rights issues using the European Region of the International Lesbian, Gay, Bisexual, Trans and Intersex Association’s “Rainbow Map” of the liberalism of countries’ gay rights policies. This index is based on over 50 gay rights policies on topics such as same-sex marriage, non-discrimination laws, and family rights. As the left panel of Figure 8 shows, across countries there is a strong negative association between mass conservatism and the expansiveness of gay rights policies (r = −0.80). In other words, countries where the public has more progressive social views have more progressive policies. As the right panel shows, this is also true of countries where citizens are more likely to place themselves on the “left”, but the correlation is about half as strong (r = −0.46) and not statistically significant.Footnote 17 This suggests that gay rights policies are more responsive to domain-specific mass conservatism than to general ideological identification.Footnote 18
Cross-Sectional Responsiveness of Gay Rights Policies to Mass Social Conservatism (Left Panel) and Average Self-Placement on the Left–Right Scale (Right Panel)

Immigration Conservatism and Migrant Integration
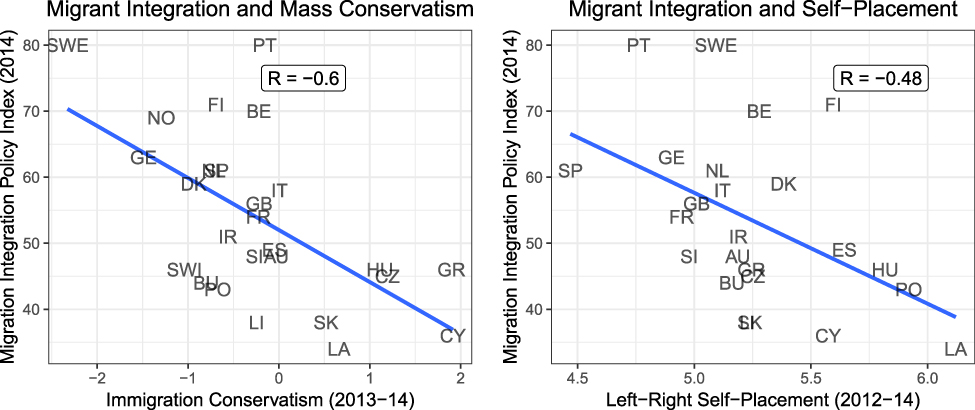
We next conduct an analogous analysis of immigration policy. To capture ideological variation in countries’ immigration policy we use the Migrant Integration Policy Index (MIPEX), which measures policies to integrate migrants in all EU Member States as well as many other countries around the world. The MIPEX is based on 167 policies related to labor market mobility for migrants, anti-discrimination laws, and many other areas related to migration. As Figure 9 shows, the correlation between government policy and mass conservatism is again stronger than its correlation with left–right self-placement (r = −0.60 versus r = −0.48). Thus, like gay rights, policies designed to integrate migrants into society appear to respond to citizens’ immigration-specific conservatism in the receiving country.
Cross-Sectional Responsiveness of Migrant Integration Policies to Mass Immigration Conservatism (Left Panel) and Average Self-Placement on the Left–Right Scale (Right Panel)
Economic Mood and Wage Replacement Rates
Our next piece of construct validation analyzes the over-time relationship between the generosity of welfare policies and publics’ economic mood, taking advantage of the greater availability of time series data on economic policies. We regress policy on opinion while controlling for country- and biennium-specific intercepts, thus ruling out persistent country-specific factors (as well as continent-wide trends) as confounders to the opinion–policy relationship.Footnote 19 The specific policy indicator we analyze is the gross replacement rate—the percent of wages replaced by benefits when a worker loses their job—in each biennium.Footnote 20 A score of 100% on this metric implies an extremely generous welfare system that replaces all lost income, and a score of 0% a very stingy one.
Figure 10 summarizes the results of two sets of analysis.Footnote 21 For each measure, we conducted two sets of analysis. The first consisted of two-way fixed-effects regression for each of the three measures in turn, containing all possible observations. The sample sizes and coverage differ across these regressions, mainly because median-voter scores are often missing and are only available up to 2004, forcing us to drop almost 70% of country-biennia for that measure.Footnote 22 The second analysis also consisted of three regressions, this time with a dataset consisting only of complete observations, so that the samples were identical in each case. The figure shows the coefficients on each of the ideology variables: the predicted response of welfare generosity to a one-unit increase in conservatism (for all three ideology measures, more positive numbers imply greater conservatism).
Point Estimates and Confidence Intervals from Two-Way Fixed-Effects Regressions of Welfare Replacement Rate on Left–Right Self-Placement Score (Top Row), Median-Voter Location (Middle Row) and Our Estimated Measure of Economic Mood (Bottom Row)
Note: All variables are coded so that higher values are more conservative. The unit of analysis is the country-biennium. The effects have been standardized by rescaling all variables to have unit variance across the observations used in the estimation. Confidence intervals are calculated using the wild bootstrap, clustered by country. The available sample size differs for each measure. In each case, the lighter gray measure uses all available data for the item, and the darker measure shows results from a balanced dataset of only complete observations for all three items.
Regardless of the specification, our measure of mass economic mood exhibits negative covariation with the wage replacement rate, as should be expected (bottom panel of Figure 10): When the public moves to the right in relative economic terms, demanding less spending, welfare spending becomes less generous. The location of the median-voter, on the other hand, has a within-country relationship with the replacement rate that is close to zero (middle panel). Finally, contrary to what would be expected if policy responded to ideological identification, an increase in the proportion of citizens’ placing themselves on the right is positively associated with welfare generosity (top panel). In short, the only variable whose covariance with economic policies is consistent with responsiveness to citizens’ preferences is our measure of economic mood. It should be noted that this finding contrasts with the cross-sectional patterns across countries, where the highest-spending countries are often the most supportive of spending cuts. Only when we add country-specific intercepts to control for these stable cross-sectional differences is the positive covariation between conservative economic policymaking and public mood revealed.
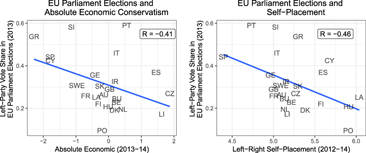
Economic Conservatism and European Parliament Elections
Our final piece of construct validation conducts an analogous analysis of absolute economic conservatism. To capture ideological variation in election outcomes, we use data on the share of left-wing parties in the 2013 EU Parliamentary Elections. As Figure 11 shows, the correlation between EU Parliamentary Elections and mass conservatism is moderately strong, though slightly less so than the correlation between election results and self-placement. Thus, EU elections appear to respond to citizens’ economic-specific conservatism, but there is no evidence of a superior relationship to self-placement.
Cross-Sectional Responsiveness of EU Elections to Mass Economic Conservatism (Left Panel) and Average Self-Placement on the Left–Right Scale (Right Panel)

COMPARISON TO PROXIES FOR MASS POLICY PREFERENCES
We now turn to a direct comparison between our estimates and left–right self-placement and median-voter positions. As noted above, self-placement scores capture citizens’ identification with different ideological labels, and median-voter positions are inferred from election results under assumptions of spatial voting. Moreover, both existing measures presume that mass policy preferences in Europe vary along a single left–right dimension. It is therefore reasonable to suspect that self-placement and median-voter scores may have weak relationships with at least one and possibly all four of our measures.
This is in fact what we find. The first thing to note is that despite purportedly measuring the same concept, left–right self-placement and median-voter scores are almost uncorrelated with each other (R = 0.14 across countries; R = −0.02 across country-biennia). Both Danes and Norwegians, for example, tend to place themselves almost identically toward the center-right end of the ideological scale. But according to median-voter scores, the median Danish voter is centrist whereas the median Norwegian is extremely left-wing. Similarly, the median voter in both Italy and Bulgaria is estimated to be very right-wing, but citizens in both countries place themselves on the left. It appears likely that citizens in different countries are thinking of different ideological dimensions when describing their ideological positions. Danes and Norwegians, for example, may be thinking of economic issues given that most place themselves toward the right. On the other hand, Greeks and Poles also consistently rate themselves as relatively right-wing, which is in line with their stance on social issues and immigration but not on economics.
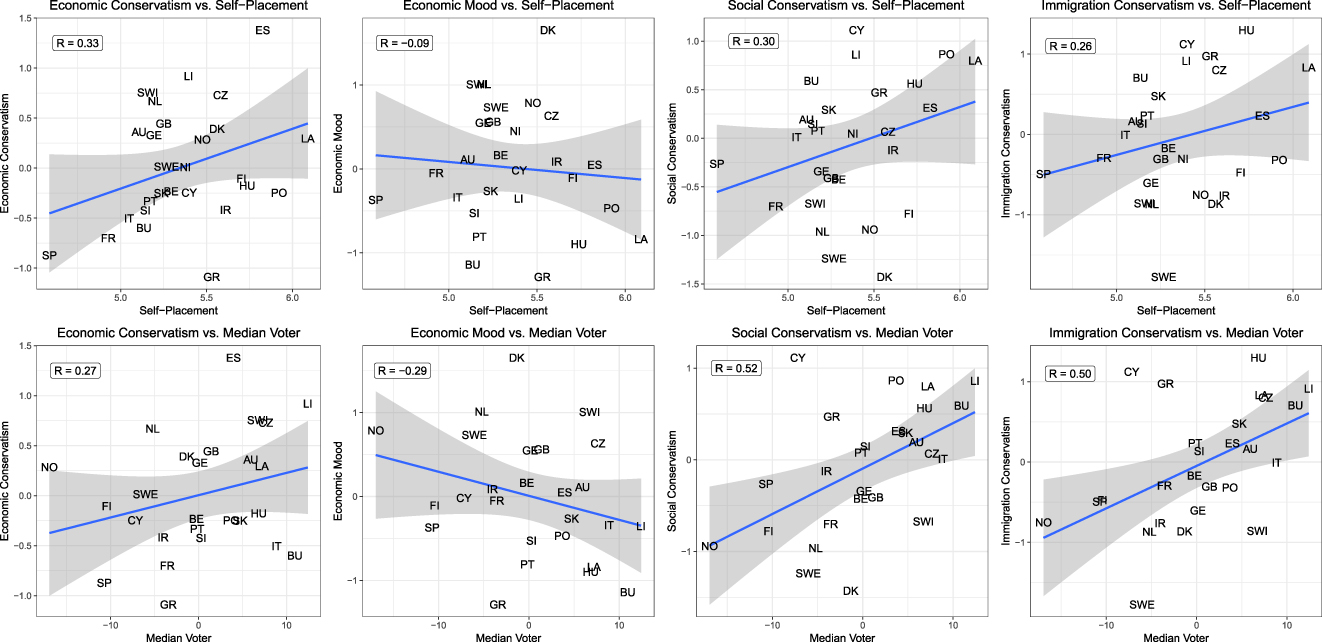
Figure 12 summarizes the bivariate relationships between self-placement and median-voter scores and our four domain-specific measures. With the exception of relative economic conservatism (economic mood), all of our measures display a positive cross-national correlation with both self-placement and median voter scores. The correlations are generally modest, however, only topping 0.5 in the case of median-voter scores’ correlations with immigration and social conservatism. Regressions using our domain-specific measures to explain the two proxies for ideology reveal the same patterns. Although there are modest positive correlations in most cases, the predictive power of our survey-based measures is not great: collectively, they explain only 17% of the variation in self-placement scores and 13% of the variation in median voter scores in a multivariate regression.Footnote 23
Correlations Between Self-Placement Scores, Median-Voter Locations, and Our Measures of Domain-Specific Conservatism
Note: Each observation is an average for the relevant country across years. The data end in 2004 for the median voter scores and in 2016 for all other plots.
The temporal patterns in the measures contrast with each other as well. As others (e.g., Knutsen Reference Knutsen1998; Medina Reference Medina2015) have observed, over the past decades there has been little aggregate movement toward the left or right in citizens’ ideological self-placement. Median-voter scores, by contrast, are in many countries much more variable over time. As Warwick and Zakharova (Reference Warwick and Zakharova2012, 174) note, some of this variation is implausibly large. Portugal, for example, is estimated to have gone from having one of the most right-wing electorates in Europe to one of the most left-wing in just twelve years (1987 to 1999). Similarly, between 1998 and 2001 Denmark moved about a standard deviation to the right on the median-voter scale. Neither country’s survey-based ideological positions changed over those periods in so dramatic a fashion. A likely explanation is that these large shifts are caused by changes in vote shares that may not reflect voters moving closer to certain parties ideologically, but rather the effect of economic conditions, shifts in party positions, or other valence considerations.
In summary, self-placement and median-voter scores, in addition to being essentially uncorrelated with each other, are at best weakly related to survey-derived summaries of the public’s domain-specific conservatism. This suggests that the two existing measures are not especially good proxies for mass policy preferences and in fact measure distinct concepts.
CONCLUSION
We have described the first dynamic, cross-national summaries of mass conservatism derived from Europeans’ issue preferences. The measures cover 27 countries, 36 years, and four issue domains: absolute economic, relative economic, social, and immigration. We have validated our measures against individual issue questions, time series of domain-specific policy mood, and policies themselves, finding robust evidence of their validity.
Our measures indicate that since the 1980s, European publics have moved markedly leftward on social issues and modestly so on immigration. Europeans’ support for conservative revisions to existing economic policies declined as well, even as their absolute economic conservatism slightly increased. On economics, men have consistently taken more conservative positions than women, but only recently has any sign of an analogous gender gap emerged on social and immigration issues. Social and immigration conservatism increases strongly with age, but on economics, age matters little for absolute conservatism and if anything is associated with lower values of relative conservatism. All four measures exhibit a clear regional divide across countries. Compared to Southern and Eastern Europeans, Northern Europeans tend to be more progressive on social and immigration issues but more conservative on economics.
The negative relationship between economic conservatism and social and immigration conservatism indicates that cross-national variation in European mass ideology cannot be captured with a single left–right dimension, at least as those labels are commonly understood. Thus, in many contexts our domain-specific measures of policy conservatism may be preferable to unidimensional measures such as self-placement and median-voter. While the latter remain valuable as measures of ideological identification and electoral preferences, applied scholars should consider whether they capture the construct of theoretical interest.
Given the central place that citizens’ policy preferences play in normative and positive theories of politics, the scope of potential applications of our measures is vast. In addition to facilitating descriptive inferences about ideological patterns in the mass public, they can also be used to examine governments’ responsiveness to citizens’ preferences, as we have shown. These analyses could of course be extended to examine the institutional and contextual moderators of policy representation. Additional topics include the role that mass policy preferences play in electoral outcomes and these preferences’ responsiveness to shifting economic and social conditions. We hope and expect that other researchers use our estimates to explore these and other important questions. To facilitate this, we have made our estimates available to the public and will continue to update them as more survey data are released.
SUPPLEMENTARY MATERIAL
To view supplementary material for this article, please visit https://doi.org/10.1017/S0003055419000157.
Replication materials can be found on Dataverse at: https://doi.org/10.7910/DVN/H9XGEB.


Comments
No Comments have been published for this article.