
Many theories in political economy posit that government redistribution ought to be a function of the income distribution. The number of citizens who stand to gain from redistribution increases with inequality, so it seems intuitive to suppose that electoral competition would translate this into more redistributive policy. When the market earnings of the affluent increase relative to the market earnings of the less affluent, democratically elected governments ought to compensate low- and middle-income citizens by increasing redistribution. Put formally, the pivotal median income earner will prefer more redistribution as the upper half of the income distribution becomes dispersed and his/her distance from the mean increases (Meltzer and Richard Reference Meltzer and Richard1981).
And yet cross-national comparisons do not seem consistent with this basic intuition. Instead, government policy actually tends to be less redistributive in more unequal countries (see, e.g., Iversen and Soskice Reference Iversen and Soskice2009), in what Lindert (Reference Lindert2004) famously calls the Robin Hood paradox.Footnote 1 Defenders of the theory retort that broad inequality measures, such as the Gini coefficient, do not necessarily capture variation in the median–mean distance at the heart of the model, or that its implications should really be tested by looking at over-time changes within countries rather the cross-national variation.Footnote 2
In response, scholars studying how inequality affects citizens’ preferences for redistribution and how governments respond to those preferences (including several contributors to this volume) frame their work in terms of change over time. Income inequality, they argue, especially at the top of the income distribution (Piketty Reference Piketty2014), has risen sharply in advanced capitalist societies in recent decades, and elected governments have failed to compensate low- and middle-income earners for this development. The puzzle, then, is why rising income inequality has failed to translate into either increased demand for redistribution among the public or greater supply of redistributive policies from elected governments.
This chapter begins by taking a closer look at this conventional framing and arguing that it needs to be qualified in two important ways. The first concerns temporality. Income inequality rose sharply in the fifteen years before the financial crisis of 2007 to 2008 in advanced democracies. But there has been no uniform trend of rising inequality in the period since the crisis. The conventional claim that inequality has risen consistently in these countries for the last three decades is somewhat misleading.
The second qualification concerns the effects of government policy on inequality. Although the puzzle of rising inequality is typically framed in terms of governments failing to compensate citizens for a market-driven phenomenon, the data suggest that this trend is partly also a function of policy decisions. Governments across the ideological spectrum reduced the generosity of welfare states during the precrisis period. Tax and transfer systems not only failed to respond to the exogenous forces expanding market inequality, but they themselves became less redistributive and drove inequality higher. In addition, changes to the social structure and labor market meant that existing welfare-state benefits, such as unemployment insurance, also became less redistributive. In other words, the puzzle of rising inequality lies not only in the failures of democratically elected governments to respond to market forces but also in the political choices of those governments to abandon redistributive policies or to ignore societal changes that were rendering welfare states less redistributive.
The conventional story of a steady rise in income inequality generated by market forces and a political failure to offset these forces must be qualified, but it remains the case that advanced capitalist societies are, with few exceptions, more unequal today and their tax and transfer systems are less redistributive than they were in the early 1990s.
Two streams of recent research, developed along separate tracks, shed some light on the political puzzle of rising inequality. The first focuses on elites and the policymaking process yielding unequal representation of voter preferences. Voters may demand redistribution, but it could be that policymakers do not listen. They may fail to perceive the changing winds of public opinion. Or they may just not be all that responsive to the preferences of most voters, acting only upon the priorities and preferences of the very wealthy, especially when it comes to economic issues. This could be because the affluent fund political campaigns and lobbying, because less-affluent citizens are less likely to vote, or because elected representatives are typically themselves affluent, among other possibilities.
A second approach to explaining the political puzzle posed by the trend of rising inequality focuses instead on voters’ preferences for redistribution. If canonical theories are wrong about the effects of rising inequality on redistribution, then one explanation could be that they wrongly assume that rising inequality will make voters demand more redistribution. This could be because voters lack information about or misperceive rising inequality, because the media offers biased assessments of such economic conditions, or because they prioritize other policy dimensions (such as immigration) or other political considerations (such as partisanship). Alternatively, it could be that voters do respond to rising inequality with stronger preferences for redistribution, but they fail to translate those preferences into votes or mobilize around the issue in ways that might influence policymaking.
This volume seeks to bring these two research agendas into conversation in an effort to better understand what it is about the political process that has led to rising inequality. Doing so allows us to address some of the shortcomings of prior work but also to highlight the unresolved tensions between different arguments as well as their persistent limitations.
One shortcoming of prior research in this field is the isolated way in which research about the United States is typically conducted. Studies of preferences for redistribution have become commonplace among scholars of comparative political economy, and many of these studies use cross-national datasets that are strictly European. At the same time, studies of unequal representation were pioneered by students of the United States, and comparative scholars have only very recently begun to catch up. And yet the puzzle of rising inequality applies as much in Europe as it does in the United States, as we show in this chapter.
If we are going to make strides toward resolving this puzzle, it seems fruitful to bring the United States into comparative perspective. Do the explanations for this puzzle offered by scholars of US politics generalize to other contexts as well? If they do not, this may suggest that other factors are actually more important. Conversely, comparative explanations could benefit from paying more attention to the factors emphasized in American politics. While the United States is certainly different from other affluent democracies in a variety of ways, we do not think it is so unique that it cannot be fruitfully compared. Or, if it is unique, we think social scientists should seek to theorize what it is about the United States that makes it exceptional. Both endeavors require bringing scholars of American politics into direct dialogue with scholars of comparative politics.
The chapters in this volume grapple with finding answers to the political puzzle of rising inequality. They do so by focusing either on the voter side of demand for redistribution or on the elite side of representation and the policymaking process. Many focus either on the US case or on some comparison across European cases. But they do so by clearly engaging with theories from across these arbitrary divides, offering a more nuanced and more generalizable set of findings to push forward this important research agenda. Together, they suggest important directions for future research and raise new questions and disagreements about everything from methodological choices to broader interpretations of the implications of their findings.
Changes in Income Inequality and Redistribution
Research on unequal representation and the politics of redistribution often begins by noting that income inequality has risen sharply across advanced democracies and proceeds to ask why governments have done so little to offset that trend. This conventional framing serves useful heuristic purposes but also misses important nuances.
The Luxembourg Income Study (LIS), the European Union Statistics on Income and Living Conditions (EU-SILC), and the World Inequality Database (WID) allow us to track the evolution of income inequality and redistribution over time. For reasons of data availability and simplicity, our descriptive analysis covers the period from 1995 to 2019 and is restricted to twelve countries: the United States, Australia, and the UK (commonly characterized as liberal market economies or liberal welfare states); the four Nordic countries (Denmark, Finland, Norway, and Sweden); and five continental European countries (Belgium, France, Germany, the Netherlands, and Switzerland). The European countries in this sample commonly serve as explicit or implicit comparative reference points in the literature that explores the politics of inequality in the United States. These countries are more egalitarian than the United States and they are often assumed to have done more than the United States to counteract rising inequality.
LIS and EU-SILC provide survey-based measures of household income that allow us to compute various measures of the distribution of household income before and after taxes and transfers as well as the redistributive effects of taxes and transfers. Combining information from labor-force surveys with administrative tax data, the WID adjusts for the fact that people at the very top of the income distribution are underrepresented in surveys. WID data represent an advance on LIS/EU-SILC data in that they provide a more accurate picture of top-end inequality. At the same time, the WID only provides measures of pretax income and disposable personal income, with public pensions and unemployment benefits included in pretax income, and does not readily enable us to distinguish between economically active and retired individuals.Footnote 3 As a result, measures of redistribution based on WID data are effectively restricted to redistribution through taxes and cash transfers other than public pensions and unemployment benefits.Footnote 4
Rather than choosing one or the other data source, we take advantage of the strengths of each by looking at top-10-percent income shares for the population as a whole based on WID data alongside Gini coefficients for the working-age population based on LIS/EU-SILC data.Footnote 5 Following conventional practice, we measure redistribution among working-age households as the percentage change between the Gini coefficient for market income and the Gini coefficient for disposable income, or, in other words, the percentage reduction of Gini coefficient brought about by taxes and government transfers. Based on WID data, we also report on redistribution as the percentage reduction in the top-10-percent income share of total (personal) income brought about by taxes and targeted social assistance.
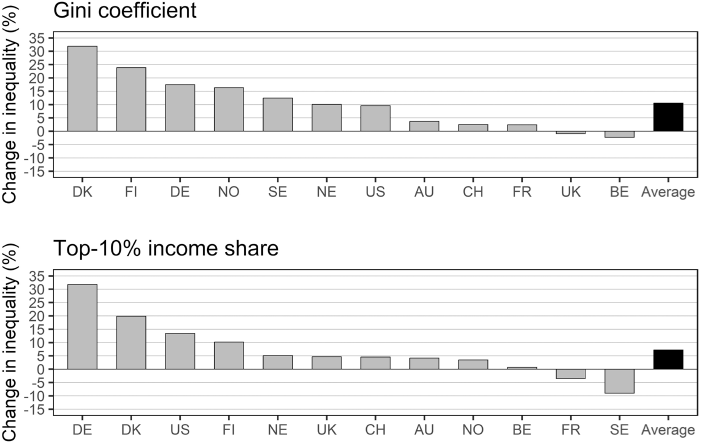
Figure 1.1 provides an overview of what happened to overall inequality of disposable income, measured by the Gini coefficient, and top-end inequality of disposable income, measured by the share of the richest 10 percent, between 1995 and the late 2010s. Both panels show that disposable income inequality has risen in recent decades; taken together, they indicate that rising income inequality cannot be attributed to rising top-income shares alone. Averaging across countries, the Gini coefficient for working-age disposable income increased by 10.6 percent while the top-10-percent share increased by 7.2 percent. It is also interesting to note that Gini coefficients rose sharply in all the Nordic countries and that the United States does not stand out as having a particularly inegalitarian trajectory. Disposable income inequality among working-age households increased more in Germany and the Nordic countries than it did in the United States over this period. Of course, we are measuring changes in inequality relative to their starting levels, and inequality was much higher in the United States than in the Nordic countries in the mid-1990s. The Nordic countries remain less unequal than the United States, but they have to some extent converged on the United States in this respect.
Income inequality growth, 1995–2018/2019
Note: Bars plot the percentage change in disposable income Gini coefficients and top-10-percent income shares between 1995 and 2018 (Gini coefficients) or 2019 (top-10-percent shares).
Most observers suppose that the trends displayed in Figure 1.1 result entirely from rising market inequality and then ask why governments have not responded. But as Tables 1.1–1.4 show, this misses two important elements of the story: the role of policy changes to tax and transfer systems in reducing redistribution, and the differences in these trends before and after the financial crisis.
| Country | Starting levels | Change (%) | Change in redistributive effect | ||
|---|---|---|---|---|---|
| Market income | Disposable income | Market income | Disposable income | ||
| Finland | 0.434 | 0.222 | −5.5 | +19.4 | −13.5 |
| Germany | 0.391 | 0.252 | +10.7 | +17.5 | −3.9 |
| Denmark | 0.378 | 0.210 | +0.3 | +13.3 | −7.2 |
| Netherlands | 0.402 | 0.248 | +3.0 | +9.3 | −3.8 |
| Norway | 0.351 | 0.233 | +7.7 | +7.3 | +0.2 |
| Australia | 0.417 | 0.294 | +1.9 | +7.1 | −3.6 |
| Switzerland | 0.336 | 0.278 | +1.5 | +4.0 | −2.0 |
| United States | 0.437 | 0.345 | +1.4 | +3.8 | −1.9 |
| Sweden | 0.428 | 0.241 | −14.3 | +3.7 | −11.8 |
| France | 0.424 | 0.290 | +0.2 | +2.1 | −1.3 |
| Belgium | 0.401 | 0.262 | +3.2 | −0.4 | +2.3 |
| UK | 0.467 | 0.324 | −5.6 | −1.9 | −2.7 |
| Average | 0.406 | 0.267 | +0.1 | +7.1 | −4.1 |
Notes: Values indicate the starting levels and changes in market and disposable income inequality measured as the Gini coefficients for working-age households. Bolded values represent regressive changes to redistributive policy.
Table 1.1 shows how inequality and redistribution among working-age households changed from 1995 to 2007.Footnote 6 For each country, the columns show initial levels of inequality (measured by the Gini coefficient), percentage changes in inequality, and absolute changes in the redistributive effect of taxes and transfers over this precrisis period. The key observation that emerges from this table is that disposable income inequality increased more than market income inequality in ten out of twelve countries. This pattern represents a regressive turn in redistributive policy. Market income inequality actually fell in three countries over this period. In two of these (Sweden and Finland), disposable income inequality nonetheless increased significantly and in a third (the UK), disposable income inequality declined by only 1.9 percent, while market income inequality declined by 5.6 percent. Belgium stands out as the only country in which the tax-transfer system clearly became more redistributive between 1995 and 2007.
Table 1.2 repeats the exercise for top-10-percent income shares. Here we observe a universal trend of increasing market income inequality, albeit with a very wide range of cross-national variation (from Belgium at 2.5 percent to Germany at a whopping 31.8 percent). In France and Sweden, increases in tax progressivity and targeted social assistance effectively cancelled out the impact of rising market income inequality on disposable income inequality measured this way. In five other countries (Australia, Denmark, Germany, Norway, and the United States), redistribution also increased, but not enough to offset the effects of rising market inequality. In the remaining five countries (Belgium, Finland, the Netherlands, Switzerland, and the UK), changes in redistribution reinforced the rise of top-10-percent income shares. Regardless of whether we look at Gini coefficients or top-income shares, governments across these countries either failed to respond to market inequality or adopted policies that reduced redistribution.
| Country | Starting levels | Change (%) | Change in redistributive effect | ||
|---|---|---|---|---|---|
| Market income | Disposable income | Market income | Disposable income | ||
| Germany | 28.0 | 24.4 | +31.8 | +23.4 | +5.6 |
| Norway | 27.5 | 22.6 | +22.9 | +15.9 | +4.7 |
| UK | 34.5 | 27.7 | +12.5 | +14.8 | −1.7 |
| Switzerland | 29.8 | 28.1 | +12.8 | +13.9 | −0.9 |
| Netherlands | 27.6 | 23.4 | +12.3 | +13.3 | −0.7 |
| Finland | 29.9 | 24.6 | +10.7 | +12.1 | −1.1 |
| Belgium | 32.5 | 23.9 | +2.5 | +10.4 | −6.4 |
| United States | 39.9 | 34.4 | +10.3 | +7.9 | +1.9 |
| Denmark | 28.5 | 25.1 | +7.7 | +4.4 | +2.3 |
| Australia | 28.2 | 23.9 | +11.7 | +1.3 | +7.9 |
| Sweden | 31.5 | 27.8 | +4.8 | +0.4 | +3.7 |
| France | 32.0 | 28.6 | +4.8 | 0.0 | +3.0 |
| Average | 30.8 | 26.5 | +12.2 | +9.8 | +1.8 |
Notes: Values indicate the starting levels and changes in market and disposable income inequality measured as the top-10-percent income share. Bolded values represent regressive changes to redistributive policy.
Tables 1.3 and 1.4 show that these trends changed markedly in the wake of the financial crisis. Averaging across countries, market income inequality among working-age households increased more from 2007 to 2018 than it had from 1995 to 2007. But disposable income inequality among working-age households increased much less in this postcrisis period. Confronted with rising market income inequality, measured by the Gini coefficient, tax-transfer systems in this period became less redistributive in Denmark, Finland, Norway, Sweden, and the United States. In other countries (Germany, the Netherlands, and the UK), market inequality declined but tax-transfer systems also became less redistributive. Finally, progressive turns of redistributive policy offset rising market income inequality in France, Switzerland, and Belgium and reinforced declining market inequality in Australia. In the postcrisis period, inequality measured by Gini coefficients has been rising less sharply, and some governments do seem to have compensated for market forces.
| Country | Starting levels | Change (%) | Change in redistributive effect | ||
|---|---|---|---|---|---|
| Market income | Disposable income | Market income | Disposable income | ||
| Denmark | 0.433 | 0.296 | +7.1 | +16.4 | −5.4 |
| Norway | 0.378 | 0.250 | +3.2 | +8.4 | −3.2 |
| Sweden | 0.367 | 0.250 | +2.7 | +8.4 | −3.8 |
| United States | 0.443 | 0.358 | +5.0 | +5.6 | −0.5 |
| Finland | 0.410 | 0.265 | +2.4 | +3.8 | −0.8 |
| UK | 0.441 | 0.318 | −0.7 | +0.9 | −1.2 |
| Netherlands | 0.414 | 0.271 | −4.1 | +0.7 | −3.3 |
| France | 0.425 | 0.296 | +2.1 | +0.3 | +1.2 |
| Germany | 0.433 | 0.296 | −5.3 | 0.0 | −3.8 |
| Switzerland | 0.341 | 0.289 | +3.5 | −1.4 | +4.0 |
| Belgium | 0.414 | 0.261 | +0.5 | −1.9 | +1.5 |
| Australia | 0.425 | 0.315 | −1.7 | −3.2 | +1.2 |
| Average | 0.410 | 0.292 | +1.3 | +3.2 | −1.2 |
Notes: Values indicate the starting levels and changes in market and disposable income inequality measured as the Gini coefficients for working-age households. Bolded values represent regressive changes to redistributive policy.
| Country | Starting levels | Change (%) | Change in redistributive effect | ||
|---|---|---|---|---|---|
| Market income | Disposable income | Market income | Disposable income | ||
| Denmark | 30.7 | 26.2 | +8.1 | +14.9 | −5.3 |
| Germany | 36.9 | 30.1 | +1.6 | +8.3 | −5.4 |
| United States | 44.0 | 37.1 | +3.9 | +5.1 | −1.0 |
| Australia | 29.9 | 24.6 | +3.5 | +2.9 | +0.5 |
| Finland | 33.1 | 28.7 | 0.0 | −1.7 | +1.5 |
| France | 34.1 | 28.6 | −5.0 | −3.5 | −1.3 |
| Netherlands | 31.0 | 26.5 | −5.2 | −7.2 | +1.8 |
| Switzerland | 33.6 | 32.0 | −8.3 | −8.1 | −0.2 |
| Belgium | 33.3 | 29.7 | −0.9 | −8.8 | +7.1 |
| UK | 38.8 | 31.8 | −7.7 | −8.8 | +0.9 |
| Sweden | 33.0 | 27.9 | −7.6 | −10.0 | +2.3 |
| Norway | 33.8 | 26.2 | −10.6 | −10.7 | 0.0 |
| Average | 34.5 | 29.1 | −2.4 | −2.3 | +0.1 |
Notes: Values indicate the starting levels and changes in market and disposable income inequality measured as the top-10-percent income share. Bolded values represent regressive changes to redistributive policy.
In all these countries, top-10-percent shares of market income fell sharply during the financial crisis. As shown in Table 1.4, they were still lower at the end of the 2010s than they had been in 2007 in most countries. Measured by their impact on top-10-percent shares, taxes and targeted social assistance have become more redistributive in Belgium, Sweden, Finland, the Netherlands, and the UK, while they have become less redistributive in Denmark, France, Germany, and the United States, and have remained essentially unchanged in Australia, Norway, and Switzerland since 2007. Measured in this way, it becomes less clear that we can characterize the postcrisis era as a period of rising inequality, although some governments have continued to reduce the redistributive effects of taxes and targeted social assistance.
Tables 1.1–1.4 display a lot of cross-national variation as well as differences between the precrisis period and the postcrisis period. As such, they call into question the conventional notion that market forces favor the rich while democratic politics favor low- and middle-income citizens (an idea encapsulated by the title of Esping-Andersen’s Reference Esping-Andersen1985 book, Politics against Markets). Measured before taxes and income transfers, top-income shares indeed rose sharply in most countries in the precrisis period, but the same is not true for overall income inequality among working-age households. In the years since the financial crisis, even these market top-income shares have not risen consistently.Footnote 7
We can get a sense of political dynamics by treating each row in Tables 1.1–1.4 as a separate observation and looking at the redistributive effects of government policy. This yields twenty-one cases – a majority – in which changes to the distributive effects of taxes and transfers contributed to rising disposable income inequality and another six cases in which reductions in market income inequality did not fully pass through as reductions in disposable income inequality.Footnote 8 By contrast, we only observe thirteen cases in which increases in market income inequality were fully offset by taxes and transfers or declines in market inequality did fully pass through. The remaining ten cases are cases of partial offsets or very little change in disposable as well as market income inequality. In most countries across both the pre- and postcrisis eras, governments appear to be allowing income inequality to rise.
The inequality and redistribution estimates presented in Tables 1.1–1.4 convey an overall picture partly at odds with the findings presented by Elkjær and Iversen in their contribution to this volume. According to their analyses, taxes and transfers have compensated low- and middle-income citizens for rising market income inequality more than our estimates suggest. There are several differences between their measures and ours. Most obviously, their analysis includes more countries over a longer period of time than our analysis here. A second difference has to do with the way we deal with retirees. While our inequality estimates are based on excluding households headed by people above the age of 64, Elkjær and Iversen deal with this issue by excluding households without any labor income. Lastly, Elkjær and Iversen’s estimates of income transfers take in-kind benefits into account. While this seems valuable, how we attribute government spending on education, health, childcare, and elderly care to income deciles involves making many assumptions about who consumes these services.Footnote 9 Our (more conventional) estimates remain, we think, informative about trends in inequality and redistribution since the early 1990s.
There is also a noteworthy conceptual difference between our approaches. While our analysis focuses on the impact of taxes and transfers on the distribution of income, Elkjær and Iversen focus on transfer rates, measured as (a) the percentage of market income of the upper income group that is transferred to low- and middle-income groups through the tax-transfer system, and (b) transferred income as a percentage of the disposable income of low- and middle-income groups. Transfer rates are useful metrics for some applications, but as measures of redistributive effects, they leave something to be desired.
Consider two societies, each consisting of a low-income household and a high-income household that jointly earn the same total income. In one society, a more egalitarian one, the low-income household earns 150 and the high-income household earns 250 before taxes and transfers; in the other, a less egalitarian society, the low-income household earns 100 and the high-income household earns 300 before taxes and transfers. Now suppose that the government transfers 10 percent of the high-income household’s income to the low-income household in both cases. Measured as a proportion of the high-income household’s pretransfer income, the transfer rate is the same in the two cases (10 percent). Measured as a proportion of the low-income household’s posttransfer income, the transfer rate is higher in the society with a more unequal distribution of pretransfer income (23 percent compared to 14 percent). Yet the low-income household’s posttransfer share of total income is lower in the more inegalitarian case (33 percent compared to 44 percent), and the low-income household is worse off in absolute terms as well (with a posttransfer income of 130 instead of 175). The transfer from rich to poor would have to be increased for the inegalitarian society to achieve the same distribution of disposable income as the egalitarian one. Put differently, an increase in the high-income household’s share of pretransfer income without an increase in the transfer rate should be considered a political victory for the rich.
The question of whether income transfers from the rich have increased enough to offset rising top-end inequality of market income is an empirical one. While Elkjær and Iversen unambiguously answer this question in the affirmative, our analysis yields a more nuanced answer. In the precrisis period, top-10-percent market income shares increased across all twelve countries included our analysis, and top-10-percent disposable income shares increased significantly in ten countries. In several countries, the transfer rate from the rich increased, but not enough to offset rising top-end inequality. It should also be noted that seven of the thirteen country-period cases in which increases in market income inequality were fully offset by taxes and transfers or declines in market inequality fully passed through pertain to top-10-percent income shares in the 2010s. Still, the estimates in Tables 1.1–1.4 suggest that market and/or political dynamics have, in general, become more favorable to the rich over time.
Political Inequality and Representation
If overall policy outputs have become less redistributive in recent decades, they have also become more closely aligned with the preferences of affluent citizens. In just about every democracy, surveys show that more-affluent respondents are less likely to support government redistribution than less-affluent respondents. Affluent citizens have not necessarily become more politically influential, but they appear to have gotten their way in the domain of redistributive policy.
A crucial assumption in theories of political economy is that democratic governments respond to the preferences of the majority. Because politicians and political parties want to be reelected, governments are expected to respond to citizen demands for redistribution by delivering more redistribution. Why, then, are affluent citizens in advanced democracies getting their way when it comes to redistribution?
A growing body of research shows that at least part of the story may lie with political inequalities in the process of representation itself (see Burgoon et al. Reference Burgoon, Pontusson, Lupu and Schakel2022).Footnote 10 Scholars of representation typically distinguish between two aspects of the representative process (see Achen Reference Achen1978; Miller and Stokes Reference Miller and Stokes1963): whether elections produce representative bodies that reflect the preferences of citizens (through descriptive representation or opinion congruence) and whether those bodies produce legislation that responds to the wishes of citizens. Recent studies have documented income- or class-based inequalities on both scores. Across many electoral democracies, elected representatives’ own political preferences and positions seem to reflect more closely the preferences of more-affluent citizens than they do the preferences of less-affluent citizens (e.g., Bernauer et al. Reference Bernauer, Giger and Rosset2015; Giger et al. Reference Giger, Rosset and Bernauer2012; Lupu and Warner Reference Lupu, Warner, Joignant, Morales and Fuentes2017, Reference Lupu and Warner2022a). Of course, even if legislators themselves largely agree with more-affluent citizens, we might expect electoral incentives to induce them to still respond to the demands of a majority of citizens – assuming they have some information about citizens’ preferences (see Butler Reference Butler2014).
And yet, a number of studies, inspired by pioneering work on the United States by Gilens (Reference Gilens2012), have found that policy outcomes in a number of affluent democracies appear to respond unequally to different income or class groups (Bartels Reference Bartels2017; Elkjær Reference Elkjær2020; Elsässer, Hense, and Schäfer Reference Elsässer, Hense and Schäfer2021; Lupu and Tirado Castro Reference Lupu and Tirado Castro2023; Mathisen Reference Mathisen2023; Persson Reference Persson2021; Rosset et al. Reference Rosset, Giger and Bernauer2013; Rosset and Stecker Reference Rosset and Stecker2019; Schakel Reference Schakel2021; Wagner Reference Wagner2021). The chapter in this volume by Mathisen, Schakel, Hense, Elsässer, Persson, and Pontusson uses survey data from four Northern European countries – Germany, the Netherlands, Norway, and Sweden – to compare mass preferences to actual policy outcomes following the Gilens (Reference Gilens2012) research design. Having confirmed that governments in all four countries are on average more responsive to the preferences of high-income citizens than to those of middle- and low-income citizens, they proceed to test whether government partisanship affects the degree of unequal representation.
Parties appear to cater to the preferences of their core constituencies, such that Left and Right parties in advanced democracies end up pursuing very different levels of social spending and redistribution. To the extent that Left parties cater to less-affluent core constituencies and Right parties to more-affluent ones, we might expect unequal responsiveness to depend in part on the partisanship of the national government – particularly in Northern European parliamentary systems. Moreover, this might be especially true prior to the moderation of many Social Democratic parties in the 1990s.
What Mathisen and coauthors find is that unequal responsiveness does appear to be less pronounced when Left-leaning governments are in power in Germany, the Netherlands, and Sweden. Norway seems to be a puzzling case, although that may have to do with differences in responsiveness across types of policies. At the same time, Left-leaning governments in all four countries are still much more responsive to the affluent than they are to the poor. Moreover, Mathisen and coauthors go on to offer tentative evidence that the partisan filter has shifted over time. Whereas Left-leaning governments had been more equally responsive on economic and welfare issues prior to 1998, since then they and Right-leaning governments have converged in their pro-affluent bias. On other policy domains, Left- and Right-leaning governments were equally biased before 1998, but Left-leaning governments have become more equally responsive since then. Mathisen and coauthors speculate that this suggests Left-leaning governments may be trying to use noneconomic policy responsiveness to compensate their core constituencies for their lack of responsiveness on economic issues.
Studies showing unequal responsiveness to voter preferences have their share of skeptics, notably Elkjær and Iversen (Reference Elkjær and Iversen2020, Reference Elkjær and Iversen2023). As discussed earlier, Elkjær and Iversen’s contribution to this volume presents data and analysis suggesting that governments have actually done much to compensate low- and especially middle-income citizens for rising inequality in market earnings, just as canonical theories of redistribution would expect. They argue that we should focus on the (objective) interests of citizens rather than their stated (subjective) preferences, a conceptual question also taken up by Bartels in his chapter and Hacker, Pierson, and Zacher in theirs. According to Elkjær and Iversen, then, if we look at certain distributional outcomes rather than stated preferences, there is no general puzzle to be explained.
In his chapter, Bartels reviews the body of work on unequal representation from both a conceptual and a methodological perspective. Bartels notes a host of complications involved both in how empirical scholars define representation and in how they measure unequal representation. Drawing on Dahl (Reference Dahl2006), he argues that there are good normative reasons to care about the relative political influence of different groups, although he highlights the numerous inferential difficulties in attributing influence. Despite these challenges, he argues convincingly that we should do the best we can with the available data and suggests, in particular, that analyses should account for the indirect influence citizens can have on policymaking via political parties and interest groups.
Political parties become a centerpiece of the analysis by Hacker, Pierson, and Zacher in their chapter on the United States. Like Elkjær and Iversen, they focus on interests rather than preferences, in particular on what they call the place-based economic interests of the knowledge economy: the interests of American residents of metro areas thriving in the new economic model and those of residents of the nonmetro areas largely being left behind. They identify a puzzling feature of contemporary American politics, one that contrasts the arguments made in comparative political economy about how the knowledge economy is reshaping political competition (see Ansell and Gingrich Reference Ansell, Gingrich, Hacker, Hertel-Fernandez, Pierson and Thelen2022; Iversen and Soskice Reference Iversen and Soskice2019). Republicans increasingly represent nonmetro residents but continue to pursue policies that benefit the urban affluent and large corporations based in metro areas. Democrats, meanwhile, increasingly represent city dwellers, but continue to pursue policies that disproportionately benefit the rural residents who are more and more reliably Republican. Why are both parties failing to represent the interests of their electoral bases?
Hacker, Pierson, and Zacher argue that the answer has to do with features of the American political system that they refer to as filters, features that determine whether interests become reflected in national political competition. The particular filters they focus on include the nonmetro skew of American political institutions like the Electoral College and the Senate, the polarized and nationalized character of party coalitions that create incentives to cater policy toward interest groups rather than voters, and the local character of many important policy areas that inhibits national interventions. Unequal representation in the United States is a product of the territorial distribution of inequality and the ways territorial interests get filtered out of getting represented in national politics by features of the American political system. Not all policies and not all policy areas get reflected in national politics, either because they are not all equally important to voters or because the political context filters them out. These features make the United States unique in some respects, but Hacker, Pierson, and Zacher’s chapter highlights the filtered nature of representation and invites us, like Bartels, to consider what those institutional filters might be in other contexts as well.
The role of interest groups is the focus of Becher and Stegmueller’s contribution, largely concerned with the money interest groups pour into American politics. If these groups influence policymaking and disproportionately reflect the preferences of the affluent, then they may sway government policies away from the less-affluent’s demands for redistribution. In previous work, Becher and Stegmueller (Reference Becher and Stegmueller2021) showed that the presence of labor unions can enhance political equality. Here, they consider whether the reverse might also obtain: namely, that the activities of monied interests increase political inequality.
Empirical researchers studying US policymaking have largely concluded that lobbying and financial contributions to political candidates appear not to influence legislative outcomes, suggesting that we should not look to interest groups to explain political inequality. But Becher and Stegmueller note that interest groups can influence different political processes: they can influence who gets elected through their role in supporting campaigns, and they can influence policy outcomes through lobbying. Moreover, they demonstrate formally that these roles are in fact complements, and that interest groups can make strategic decisions about where to invest their resources. The upshot of this theoretical framework is that it highlights that even studies that can identify the causal effect of an interest group on legislative behavior may underestimate it – something Becher and Stegmueller also demonstrate with simulations. As a result, they argue, we should not rule out the possibility that the role of monied interests in both the selection of candidates and the legislative process may be partly responsible for unequal policy responsiveness.
Two contributions to this volume, one by Curto-Grau and Gallego and the other by Carnes and Lupu, take up the issue of candidate selection. Political scientists have become increasingly interested in the personal characteristics of politicians in recent years (Carnes and Lupu Reference Carnes and Lupu2023b). On the one hand, descriptive representation by politicians who share voters’ ascriptive characteristics may itself be normatively important (Mansbridge Reference Mansbridge2003). On the other hand, there is growing evidence that those characteristics inform what those legislators do once they take office, with consequences for the kinds of policies that make it through the legislative process (e.g., Carnes Reference Carnes2013; Carnes and Lupu Reference Carnes and Lupu2015). In their chapter, Curto-Grau and Gallego convincingly show that Spanish mayors with university degrees pursue more fiscally conservative policies than those with lower levels of educational attainment. At the same time, they find no differences between these mayors in terms of their performance. The implication for understanding unequal representation is that if politicians are themselves more affluent than the people they represent – a pattern Carnes and Lupu demonstrate in their chapter – then policy outcomes may skew in favor of their personal preferences, which are more closely aligned to the preferences of the affluent. The fact that less-affluent citizens are descriptively underrepresented in politics may help to explain why governments have failed to address rising inequality.
Why, then, are less-affluent citizens descriptively underrepresented? This is the question Carnes and Lupu set out to consider in their contribution to this volume, focusing specifically on politicians with working-class backgrounds. Using data on the personal characteristics of national legislators across the OECD, they consider whether country-level factors might help to explain why working-class people do not run for public office. They find that economic factors – wealth, inequality, and unionization – do matter, but they only go so far in explaining variation. One reason for this is that all countries wildly underrepresent working-class people, so it may make more sense to look for factors that are common to all advanced democracies than to try to explain variation at the margin. At the same time, Carnes and Lupu show considerable variation within countries across parties – and they suggest that examining this variation, the differing roles party gatekeepers play, may be a more fruitful way forward.
One important issue this final analysis raises is whether elite-centered explanations about unequal representation can account for the temporal changes in governments’ attention to economic inequality. As we showed at the outset, inequality has risen in nearly every advanced democracy during the last three decades, although that growth is not uniform or unidirectional. If governments are about as unresponsive to the preferences of less-affluent citizens today as they were three or four decades ago, if interest groups are about as influential now as then, and if less-affluent people were just as descriptively underrepresented then as they are today, then can these explanations help us understand why elites took more measures to address inequality in the past than they have in recent decades? There may be reasons to think so, but it will be important for future elite-centered research on representation to address these temporal changes directly, as Mathisen and his coauthors begin to do in this volume.
A final explanation for the representation gap is that it reflects disproportionalities in political participation. Analyzing survey data from twenty-nine European democracies, Mathisen and Peters show that less-affluent citizens are not only less likely to vote in elections, but they are also substantially less likely to engage in other political activities, including signing petitions, contacting politicians, and working in civic organizations. All of these forms of participation serve to communicate public preferences to elected representatives, and if less-affluent citizens are doing less communicating, then a potential explanation for government inaction in the face of rising inequality is that representatives are simply more likely to hear from more-affluent citizens. Even if less-affluent citizens would prefer more redistribution, those preferences are not getting communicated to governments effectively or consistently.
The fact that less-affluent citizens participate less in politics is well known (Gallego Reference Gallego2010, Reference Gallego2015; Schlozman et al. Reference Schlozman, Verba and Brady2012), but it is typically associated with the fact that less-affluent citizens have fewer of the resources – time, money, and skills – needed to participate. What Mathisen and Peters show in their chapter is that while these resources certainly matter, part of the participation gap – at least with regard to voting and a couple of other activities – can also be explained by the fact that less-affluent citizens are also less likely to trust their political system. If less-affluent citizens were as satisfied with their governments as are more-affluent citizens, these participation gaps would decline significantly. This suggests, as in Cramer’s chapter, that trust in government is a crucial moderator of mass demand for redistribution, but also that there may be a counterintuitive vicious cycle in which the less governments respond to rising inequality, the less citizens either demand redistribution or communicate those preferences to elected officials.
Voters and Demand for Redistribution
Focusing on representation alone may not provide us with a full understanding of why governments in advanced democracies have allowed inequality to rise in recent decades. Another straightforward possibility, anticipated by Mathisen and Peters’ chapter, is that voters have not responded to rising inequality by demanding more redistribution, as canonical theories might have expected. According to Kenworthy and McCall (Reference Kenworthy and McCall2007), inequality of individual earnings and household income increased across a number of advanced democracies from 1980 to 2000, yet the percentage of survey respondents who agreed with proposition that, “it is the responsibility of the government to reduce the differences in income between people high incomes and people with low incomes,” hardly changed at all in any of these countries.
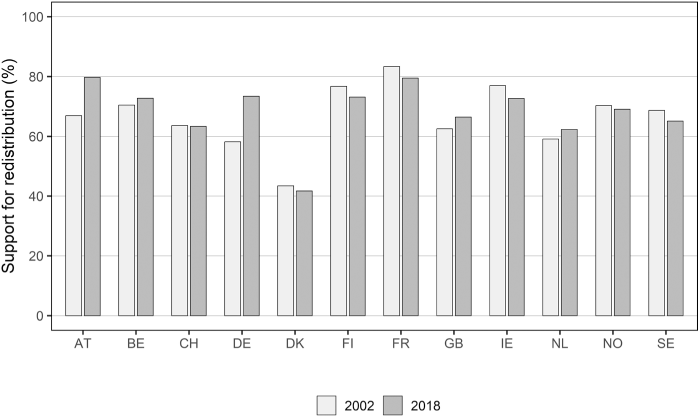
Figure 1.2 shows the proportion of respondents to the European Social Survey (ESS) who agreed or strongly agreed with a similar statement in the countries we examined earlier in 2002 and 2018. Although a couple of cases exhibit more substantial increases in support for redistribution over this period, the overall message from these data is that support for redistribution hardly changed at all over the first two decades of the twenty-first century. Equally noteworthy, survey data do not seem to lend much, if any, support for the intuitive idea that rising inequality has rendered low- and middle-income citizens more supportive of redistribution while it has reduced support for redistribution among affluent citizens. Analyzing ESS data for the period 2006–2012, Gonthier (Reference Gonthier2017) finds that the redistribution preferences of different income groups have moved in tandem, to the extent they have moved at all.
Support for redistribution, by country
Note: Bars plot the proportion of respondents who say they agree or strongly agree with the statement, “the government should take measures to reduce income differences.”
The apparent stability of demand for redistribution in the face of rising inequality has motivated many scholars to explore subjective perceptions of inequality (e.g., Gimpelson and Treisman Reference Gimpelson and Treisman2018; Osberg and Smeeding Reference Osberg and Smeeding2006; Page and Goldstein Reference Page and Goldstein2016). The common expectation that democratically elected governments should respond to rising inequality by undertaking redistributive measures rests on two propositions: (1) that government policy responds to the preferences of the majority of voters and (2) that low- and middle-income voters recognize that they stand to gain more from redistribution as inequality rises. The latter proposition in turn assumes that voters know where they are in the income distribution, that they understand what the income distribution looks like, and that they perceive changes in the income distribution. Research on perceptions of inequality teaches us that these assumptions do not necessarily hold. Specifically, two persistent biases might explain the stability of demand for redistribution in the face of rising inequality: people tend to underestimate the extent of inequality in their country (Trump and White Reference Trump and White2018) and people tend to think they are closer to the median than they actually are.
Still, while studies of perceptions of inequality offer important insights, research also consistently finds that support for redistribution falls with relative income. It is difficult to see how this persistent finding would come about if people were completely confused about their place in the income distribution. And research on perceptions has yet to address the fact that redistribution has declined over time. Did citizens use to perceive inequality and their own positions more accurately than they do today? And, if so, what would explain these changes? Finally, rising inequality should be relevant to individuals even if they do not perceive it. Most obviously, rising inequality translates into slower income growth for low-income households and more rapid income growth for high-income households. As long as individuals perceive and care about changes in their own income, they ought to be responsive to changes in inequality.
Another strand of work tackles the puzzle of stable redistribution with methodological critiques of our measures of public opinion (see the review by Dallinger Reference Dallinger2022). The standard survey item is broad and vague, arguably capturing normative dispositions rather than support for any specific redistributive policies. Some respondents are bound to interpret the statement with reference to the status quo, that is, to register their agreement with the statement that “government should do more to reduce income differences” as compared to what it is currently doing. Also, as illustrated by Figure 1.2, the question elicits very high levels of support for redistribution in most advanced democracies, creating an obvious concern about ceiling effects. With 60 to 70 percent of survey respondents supporting redistribution already in the early 2000s, it is perhaps not so surprising that it does not increase much further in the subsequent two decades.
Cavaillé’s contribution to this volume makes a related critique building on her prior work (Cavaillé and Trump 2015): namely, that the standard measure fails to distinguish between support for redistribution from the rich (“redistribution from”) and support for redistribution to the poor (“redistribution to”). Analyzing 2008 ESS data, Cavaillé and Trump (2015) demonstrate that the individual-level determinants of attitudes on the two dimensions of support for redistribution are strikingly different. In marked contrast to the stability of overall support for redistribution shown in Figure 1.2, Pontusson et al. (Reference Pontusson and Weisstanner2018) document a broad-based public opinion shift in favor of flat-rate or low-income-targeted pension and unemployment benefits (away from earnings-differentiated benefits) across eleven West-European countries from 2008 to 2019. Also noteworthy, Rosset and Pontusson (Reference Rosset and Spohie Kurella2021) as well as Limberg (Reference Limberg2020) present evidence suggesting that the financial crisis of 2007–2008 and the ensuing recession boosted public support for progressive income taxation in many countries.Footnote 11
Though it does not feature prominently in this volume, the question of how changes in inequality affect specific policy preferences among different income groups represents an important research agenda for scholars interested in the comparative politics of inequality and redistribution. But pursuing this question requires recognizing, as we have already seen, that changes in inequality are not simply a story of ever-rising inequality. It also means that we may need to pay more attention to the structure of inequality than to levels of inequality. Following the logic set out in Lupu and Pontusson (Reference Lupu and Pontusson2011) as well as Meltzer and Richard (Reference Meltzer and Richard1981), we might expect pivotal middle-income voters to respond to rising top-end inequality (measured by top income shares or the 90–50 ratio) by demanding more compensatory redistribution, but it is less obvious that they would respond to rising bottom-end inequality (the 50–10 ratio) in this manner.
Still, voters seem to contradict these kinds of theoretical expectations. As Matthews, Hicks, and Jacobs show in their chapter, low- and middle-income voters are more likely to vote for incumbent parties when the incomes of the rich grow fast while their propensity to vote for incumbents does not respond to average income growth in Western Europe (Hicks, Jacobs, and Matthews Reference Hicks, Jacobs and Scott Matthews2016) as well as the United States (Bartels Reference Bartels2016). Not only do low- and middle-income voters fail to punish incumbents who preside over unfavorable shifts in the distribution of income, they actually seem to reward these incumbents.
Matthews, Hicks, and Jacobs argue convincingly that the tone of economic news provides a key mechanism linking rising top-income shares to the electoral behavior of low- and middle-income citizens. According to their analysis, the tone of economic news is more positive when incomes at the top of the income distribution grow more rapidly, and that positive tone prompts average voters to support incumbents. An extensive literature attributes the pro-rich bias of news coverage to the interests and ideological dispositions of news media owners and executives, but Matthews, Hicks, and Jacobs instead argue that journalists of all stripes are preoccupied with economic aggregates – unemployment and GDP growth as well as stock prices – that are correlated with income growth at the top.
One interpretation of Matthews, Hicks, and Jacobs’ findings is that citizens might care about the distribution of income as well as economic performance, but the latter concern dominates the former, and news media reinforce this dominance. Or, alternatively, that economic performance weighs particularly heavily in the voting decisions of critical swing voters (Kayser and Wlezien Reference Kayser and Wlezien2011). If news media paid more attention to distributive issues, politicians would have to pay more attention to the distributive preferences of low- and middle-income citizens. The question this raises is whether mainstream news coverage of the economy has changed in ways that might explain why voters no longer seem to punish incumbents that preside over disproportionate income growth at the top. Although Matthews, Hicks, and Jacobs’ empirics indicate that the ideological orientation of media outlets does not condition the positive effect of top-income growth on the tone of their reporting, it may be that mainstream media of all stripes have become increasingly focused on those economic aggregates that are closely correlated with top-income growth – most obviously, stock prices – at the expense of other aggregates, such as the rate of unemployment. Alternatively, media outlets may give greater coverage to market-oriented or corporate policy views (Guardino Reference Guardino2019). It is noteworthy that support for redistribution tends to be lower in countries with more concentrated media ownership (Niemanns Reference Niemanns2023).
While Matthews, Hicks, and Jacobs invoke economic news coverage to explain government neglect of distributive issues, Cavaillé’s chapter engages with the extensive literature on how fairness considerations shape citizens’ attitudes toward inequality and redistribution. The main strand of the fairness literature proceeds from the observation that people consider income differences to be fair to the extent that they reflect differences in individual effort, while they consider income differences to be unfair to the extent that they derive from luck or privilege, let alone government favors (e.g., Alesina and Guiliano Reference Alesina, Giuliano, Benhabib, Bisin and Jackson2011; Bénabou and Tirole Reference Bénabou and Tirole2006; Scheve and Stasavage Reference Scheve and Stasavage2016). As Cavaillé points out, this fairness norm, which she refers to as the proportionality norm, is broadly shared across all advanced capitalist societies: people do not disagree about the norm itself, but they disagree about the extent to which the income differences that they observe around them are proportional to effort. The balance between those who think that education systems and labor markets generate fair outcomes and those who do not think so in turn varies across countries.
Cavaillé’s key contribution is to argue that support for redistribution also involves a second fairness norm, the reciprocity norm, which prescribes that all members of a group should contribute collective efforts and that freeriding should be punished. Again, the norm itself is broadly shared, but citizenries differ in their assessments of whether the primary beneficiaries of social insurance schemes and other redistributive policies – in the first instance, the poor – deserve to be supported. Documenting that fairness assessments according to the reciprocity norm are orthogonal to fairness assessments according to the proportionality norm, and that both kinds of assessments are stable over time, Cavaillé identifies three country types among liberal democracies: (1) income differences are considered fair and the poor are deemed to be undeserving in the UK and the United States, (2) income differences are considered unfair, but the poor undeserving in Southern Europe, and (3) income differences are considered fair and the poor deemed to be deserving in the Nordic countries. (The fourth combination, unfair income differences and deserving poor, is represented in Cavaillé’s analysis by some former communist countries.)
How does taking fairness considerations into account help us explain the apparent lack of government efforts to reverse rising inequality? It stands to reason that citizens who think income differences are proportional to effort are less likely to demand compensatory redistribution when inequality rises. To the extent that inequality has grown most rapidly in countries where many citizens believe that income differences are proportional to effort, this provides an obvious solution to the puzzle that motivates much of the literature on the politics of inequality and, in particular, the Nordic puzzle identified by our descriptive discussion. Fairness assessments pertaining to the reciprocity norm might in turn be invoked to explain reforms that have reduced the redistributive effects of tax-transfer systems, but this line of reasoning would seem to suppose that fairness assessments, as distinct from fairness norms, are more malleable than Cavaillé’s discussion suggests.Footnote 12 Most importantly, Cavaillé’s contribution to this volume invites us to explore cross-national differences in how public opinion responds to changes in bottom- and top-end inequality.
The question of whether the poor are deserving of redistribution is also closely bound up with the extent to which poverty is concentrated among immigrants and racial/ethnic minorities (see Alesina and Glaeser Reference Alesina and Glaeser2004). Our volume does not engage with the extensive comparative literature on the effects of immigration on demand for redistribution in Europe (e.g., Burgoon Reference Burgoon2014; Finseeras Reference Finseeras2008), but it includes a chapter by Cramer on how race and economic concerns are intertwined in the thinking of white Americans living in rural areas. Cramer’s distinctive research strategy involves listening to local talk radio shows addressing the murder of George Floyd on May 25, 2020 and the ensuing protests against racial injustice. Her careful reconstruction of these conversations uncovers an interactive process through which right-wing talk-show hosts and their listeners deflect from race relations to focus on the neglect of “hard-working Americans” by urban political elites identified with the Democratic Party. In right-wing talk-show discourse, racism is first and foremost a trope used by Democrats to advance their political goals. The hosts and callers deflect from racism by emphasizing law and order and free markets, expressing a kind of parochial patriotism and nostalgia that defines “real Americans” as white, rural, and Christian.
What these narratives reveal to Cramer is how aversion to redistribution becomes intertwined with racism. In right-wing talk-show discourse, Democrats are portrayed as using accusations of racism to garner support for redistribution and expanding the federal government as part of a political project to undermine American capitalism. Rather than Republicans deflecting from uncomfortable conversations about systemic racism in the United States, their portrayal equates accusations of racism and redistribution as profoundly un-American. Even in the left-wing talk shows that Cramer analyzes, rural whites clearly see themselves as the true victims of neglect by policymakers in Washington. For them, economic policies are a zero-sum game in which people of color seem to be benefiting and they seem to be losing out, undermining the kind of multiracial class-based coalition that might support redistribution in the United States. There is a fundamental lack of trust in the government among rural whites that shapes how citizens’ policy preferences respond to rising inequality (Cramer Reference Cramer2016; see also the chapter in this volume by Hacker, Pierson, and Zacher).
The chapter by Ares and Häusermann also relates to trust in government by exploring perceptions of political representation by social class. Focusing on perceptions of representation by political parties in the broad domain of welfare-state politics, Ares and Häusermann proceed from the observation that “social policy conflict today revolves as much around prioritizing particular social policy fields as around contesting levels of benefits, redistribution and taxation in general.” Their empirical analysis is based on an original survey in eight West-European countries that asked respondents to prioritize benefit improvements across different social programs and then asked them to assess the priorities of their preferred party and one other party in the same manner. They show that working-class respondents perceive themselves to be less well represented by political parties, including their preferred political party, than middle-class and especially upper-middle-class respondents (see also Rennwald and Pontusson Reference Rennwald and Pontusson2022).
Ares and Häusermann’s analysis focuses on perceptions of political inequality rather than economic inequality, but it highlights the relationship between the two. Citizens who perceive themselves as poorly represented by political parties are less likely to trust government. And if trust in government is an important determinant of support for government redistribution (see Goubin and Kumlin Reference Goubin and Kumlin2022; Macdonald Reference Macdonald2020), then class gaps in perceptions of unequal representation might explain why low-income and working-class citizens have not responded to rising income inequality by demanding more redistribution. Whereas Mathisen and coauthors speculate that Left-leaning governments may be trying to use noneconomic policy responsiveness to compensate their core constituencies for their lack of responsiveness on economic issues, Ares and Häusermann show that those core constituents may not be convinced.
Looking Ahead
The remainder of the volume proceeds in three parts. We begin with four chapters that debate how to think about representation and the degree to which the recent past in advanced democracies offers evidence of unequal representation. The next two parts mirror the two types of explanations of the political puzzle of rising inequality: those that focus on elites and the process of representation and those that focus on voters and demand for redistribution. Although each chapter engages in specific scholarly debates, they also offer answers to our central motivating question: why governments in advanced electoral democracies have largely allowed economic inequality to rise during the last three decades.
Together, these chapters offer some plausible political explanations for the puzzle of rising inequality in advanced democracies, but they also leave some possibilities unexplored. None of the chapters in this volume, for instance, take up the possibility that rising immigration has undermined support for redistribution or that elites misperceive the preferences of citizens. There are also many possible explanations for the puzzle of rising inequality that have nothing to do with voters or the process of representation like the role of interest groups in policymaking or external constraints on governments, on which the chapters in this volume say little. Our goal, of course, is not to give a holistic treatment of every possible explanation, but to focus on those that seem especially plausible and to invite more direct engagement between those that focus on voters and those that focus on elites.
Even within this subset of explanations, the contributions to this volume leave some questions unaddressed. Most glaring is the heterogeneity, across both space and time, in rising inequality across advanced democracies that we illustrated earlier. Although each of the chapters in this volume offers a compelling way to explain the overall puzzle of inequality, it would be harder to deploy them to explain that variation. Why, for instance, did the Nordic countries become much less redistributive at the same time that France became more progressive? It is not clear that arguments about fairness norms, media coverage, or descriptive representation (to name just a few) can explain these differences. Why did some countries respond to the financial crisis by reversing course and becoming more redistributive? Again, we are not convinced that the arguments in this volume shed much light. There is still much work to be done to understand this variation.
One debated dimension of this heterogeneity is the comparability of the United States with other advanced democracies. By inviting scholars of American and comparative political economy to contribute to this volume, we evinced our conviction that it would be fruitful to consider the United States as one case among many and that treating the United States as an exception hinders more than it helps out understanding of political economy. As we noted previously, at least since the mid-1990s, the US experience of rising inequality has not been particularly exceptional as compared to other affluent democracies. At the same time, there are differences between the United States and its counterparts, differences that some chapters in this volume emphasize. Still, we think it is more productive to theorize about these differences, as with other cross-country variation, than to consider them in isolation. We hope that this volume encourages such an approach.
The studies in this volume also define inequality in a variety of ways, each of which draws on different conceptions about relevant social groups. Cavaillé, Elkjær and Iversen, and Mathisen and coauthors compare income groups; Curto-Grau and Gallego study education groups, while Mathisen and Peters examine both income and education; and Ares and Häusermann and Carnes and Lupu focus on occupational categories. Political economy has for years been dominated by theories that focused on income groups, so it is important that the analysis of social class is making a return. But our discipline has yet to grapple with the concept of social class and how to measure it in consistent or standardized ways.
Our volume focuses on these class- and income-based inequalities, and why and when governments tolerate them. But as Bartels usefully points out in his chapter, there are surely also racial, ethnic, and other political inequities that may be more pronounced and possibly more consequential than the ones we are concerned with here. There may also be reasons to think that economic inequality and political inequality are not entirely independent. The wealthy may be able to exert disproportionate influence on policymakers where economic resources are distributed unequally (Erikson Reference Erikson2015; Rosset et al. Reference Rosset, Giger and Bernauer2013). In their cross-national analysis, Lupu and Warner (Reference Lupu and Warner2022b) indeed find that economic inequality is related to inequalities in opinion congruence between citizens and representatives. Ares and Häusermann’s chapter in this volume also highlights the possibility that political inequalities, if they disempower and disengage certain groups of voters, can lead to policies that exacerbate economic inequality. We hope scholars take up studying these complex relationships and that this volume’s efforts to explain the political puzzle of rising economic inequality might help to inform those efforts as well.


 Open access