

1. Introduction
The demographic transition can be defined as the passage of a population from a situation where fertility and childhood mortality are high to one where both are low. Since the theory of the demographic transition was proposed,Footnote 1 an extensive literature has accumulated linking the fall in childhood mortality to the fall in fertility.Footnote 2 The traditional explanation offered is that as average family size increased, parents became aware that childhood mortality was declining, and took the decision to control their fertility. However, scholars know little about what happened between the fall in childhood mortality and the fall in fertility. Were parents really aware that childhood mortality had fallen and, if so, when did they gain this awareness? Was there a temporal gap between this realisation and the widespread use of stopping and spacing as fertility control strategies?Footnote 3
Not all scholars believe that parents were aware of the reduction in childhood mortality. Montgomery states that parents could not have been fully aware of it, especially in the early stages of the demographic transition, when evidence of the reduction may not have been easy to see, especially for populations with low educational levels (because they were not educated enough to see the decline).Footnote 4 According to Montgomery's hypothesis, the fertility transition was not primarily the result of a reduction in childhood mortality. Studies measuring parents’ perceptions of their children's increasing chances of survival during the demographic transition are scarce.Footnote 5 In this article we analyse a variable that has seldom been studied, especially in the case of Spain: the number of days between the birth of a child and his or her baptism.
Patterns of baptism vary from one religious group to another. Opinions differ between denominations over the importance of baptism and whether a person has to be baptised before they can be admitted to heaven. Many Christians consider that individuals cannot enter heaven if they have not been baptised,Footnote 6 as the ceremony is seen as a rite of purification, to cleanse people of their sins.Footnote 7 The Catholic Church holds that everyone carries original sin, and therefore if a child dies unbaptised it will be left in limbo, unable to reach heaven.Footnote 8 Fortunately, for Catholic babies in imminent danger of dying, it was not necessary to wait for a priest to perform the baptism; any birth attendant, such as a doctor, midwife or parent, with understanding of the ceremony could pour baptismal water over the baby's head.
The need to receive baptism to ensure entrance to heaven meant that almost all children born alive in Catholic Spain were quickly baptised and registered in the parish records, although there was a problem of a slight under-registration, especially of girls.Footnote 9 Other Christian denominations, who do not believe in original sin, or who hold that babies are without sin, do not view immediate baptism as being essential to ensure that a child will enter heaven. In these churches the period between birth and baptism can be relatively long.
Social norms and the recommendations of religious authorities can thus be seen to influence the time elapsing between birth and baptism. Before 1650, for example, the Anglican Church recommended that children be baptised within seven days of birth. After that date ‘within 14 days of birth’ was recommended. Berry and Schofield found no clear baptismal patterns among Anglicans in pre-industrial England,Footnote 10 reporting that the average birth-baptism interval was only a few days until the end of the eighteenth century but then increased as social changes related to attitudes and religious practices took place.Footnote 11
During the early centuries of Christianity, baptisms were common in adulthood and took place on just two days of the year: the Saturdays preceding Easter and Pentecost. Individuals in danger of dying were baptised as necessity dictated.Footnote 12 In the centuries that followed, infant baptism (during the first months of life) became the most common practice.Footnote 13 From the end of the Middle Ages, the majority of baptisms in the Catholic Church were conducted on a quamprimum, or ‘as soon as possible’, basis.Footnote 14 This practice was endorsed by the Council of Trent (1545–1563)Footnote 15 and remained the preferred custom across southern Europe in the eighteenth and early nineteenth centuries.Footnote 16 In Italy,Footnote 17 France,Footnote 18 and Spain both boys and girls were baptised very soon after birth, usually within the first 24 hours of life. In France, a Royal Act of 1698 stated that parents had to pay a fine if they did not baptise their children within 24 hours of birth. During the eighteenth century, almost all parents followed this ruling up until the French Revolution (1789) when the gap between birth and baptism began to increase.Footnote 19 In Italy, early baptism continued into the first half of the nineteenth century.Footnote 20 During the eighteenth and nineteenth centuries, intellectuals of Catholic countries warned of the dangers of taking newborn babies to church to be baptised in the first hours of life, as this not only exposed them to inclement weather, especially in winter,Footnote 21 but also involved pouring cold water over their heads. These opinions seem to have been ignored, at least in our study area, until the late nineteenth century when the interval between birth and baptism began to widen. In other Catholic countries, such as France and Italy, this time-gap had started to widen decades before. Unfortunately, we cannot tell whether parents in our study area were aware of the supposed dangers to their children and, if so, how they had come by this knowledge. Nor do we know how concerned they might have been. In the discussion section below, we use the indirect evidence we have available to consider how such knowledge might have affected parents’ behaviour in the study area.
Most Catholics in rural Spain, faced with the risk that their offspring might die suddenly, had them baptised quickly, regardless of the day of the week. Even today almost all children in the study area are baptised, even those whose parents were married in a civil ceremony. Nowadays, however, baptisms tend not to take place until several months after the birth, probably because with the increase in survival rates parents are less anxious that their child might die shortly after birth. Catholic baptismal registers may therefore be seen as a valuable source of information regarding parents’ perceptions about the risk of death of their children. The analyses reported in this article were based on microdata from the parochial registers of ten communities in rural Spain. The entire population of each locality were practicing Catholics. The registers for the period 1830–1949 from the villages of Alfamén, Botorrita, Jaulín, Longares, Mezalocha, Mozota, Muel, Torrecilla de Valmadrid, Valmadrid and Villanueva de Huerva (hereafter Alfamén and Middle Huerva), in the north-eastern province of Aragon (shown in Figure 1) were used; the data on births, baptisms, marriages and deaths being linked by standard family reconstitution methods.Footnote 22
Location of the Alfamén and Middle Huerva study area.
Source: prepared by the author.

As Figure 2 shows, mortality under the age of 5 began to decrease in the 1860s in our study area. Our initial hypothesis was that parents reacted to this by increasing the gap between their children's births and baptisms. We further hypothesised that this was because the lower rates of mortality reduced their anxiety about the risk of their children dying. The increase in the interval between birth and baptism was thus the consequence of human agency, of the parents’ increased willingness to delay baptising a new-born child. The fertility transition in Alfamén and Middle Huerva did not begin until the 1900s (Figure 2), so parents began to increase birth-baptism intervals before fertility began to fall.Footnote 23 We therefore started from the premise that there was a causal relationship between the reduction of child mortality and the increase of the birth-baptism gap in our study area. Previous studies have shown that these two processes proceeded in parallel in other parts of Europe during the eighteenth and nineteenth centuries, but scholars have not always been able to demonstrate a relationship between them.Footnote 24
The average number of children born to families with completed fertility, the average number of child deaths under age 5 in the same families, by decadal marriage cohort, and the average birth-baptism interval in days, by birth cohort, Alfamén and Middle Huerva study area, 1830–1940.
Source: AMHDB See Table 1.
Note: N = 815.

Minello, Dalla-Zuanna and Alfani proposed that where the relationship between an increase in child survival and an increase in the birth-baptism interval exists it may take one of three forms.Footnote 25 First, the relationship may be a direct one: if children were less exposed to poor weather or cold water immediately after birth – by being baptised later – this would reduce mortality. Second, the relationship may work in the reverse direction: as the proportion of very young children at risk of death fell, this led to lower rates of early baptism, lengthening the birth-baptism interval. Third, the relationship may be a spurious one and other factors, such as improvements in infant care, might explain both trends, which were, in fact, unrelated. In the article, we will explore these three possibilities in greater detail although we have to bear in mind that it may prove very difficult to separate the three forms of the relationship, which may, in many cases, be intertwined.
In relation to the possibility that the relationship may be spurious, Gourdon considers three factors which may have contributed to an increase in the birth-baptism interval: secularisation, medical improvements, and changes in social and family relations.Footnote 26 Social and behavioural changes, as well as reduced mortality, may have led parents to move away from the baptismal traditions of earlier decades and delay baptising their children. It should be noted that parents did not stop baptising their children; the first unbaptised children were not recorded in Alfamén and Middle Huerva registers until the 1930s during the Second Spanish Republic, which was characterised by a movement towards secularism. The process of secularisation moved very slowly in Spain. It began in the eighteenth century, when the Catholic Church ceded some of its power and societal control to the national government. Secularisation then continued during the nineteenth and twentieth centuries, although its progress varied in intensity over time and depending on who held political power.Footnote 27 According to Pérez-Agote, it washed over Spanish society in three waves.Footnote 28 The first surge arrived during the nineteenth century and ran until the Spanish Civil War in 1936–1939. The second followed between the 1960s and 1980s, as Spain became more economically developed and embraced mass consumption. The third wave developed in the twenty-first century; religious behaviour has been transformed in recent years. In this study we focus on the first wave.
All ten villages in our study area sit in the Archbishopric of Zaragoza. where baptismal practices were regulated by the Synodal Constitutions of 1697. In a ruling which remained in place until 1943, the Synod dictated that baptism was to be free of charge and should be performed as soon as possible after birth so that no baby should die unbaptised. As almost the entire population of Spain was Catholic many aspects of daily life, such as obtaining a passport or being able to get married, relied on each person involved being recorded in their local baptism register. Civil institutions used the ecclesiastical registers for statistical, military and fiscal purposes. Even though civil registers of baptisms, marriages and deaths had been established officially with the Royal Order of 1871 (with a structure similar to the parish registers but under the control of the civil authority of each municipality), after tensions between the Catholic Church and the civil government had arisen, it was the parish rather than the civil registers that were still the source of national statistical information at the beginning of the twentieth century. In her study of a number of villages in the province of Zamora, María Pilar Brel Cebrián found that the data held in the parish records were more reliable than the data contained in the civil registers, at least until the beginning of the twentieth century. The civil registration of births presented the greatest problems.Footnote 29 By law, every child should have had their birth registered in the civil register before they were 72 hours old. Failure to do so meant a fine for the parents. Up until 1889 newborn infants had to be physically presented to the registrar. There were two additional, but contradictory, rules regarding children who died within 24 hours of birth. When civil registration was established, the regulations stated that the births of such children should be registered, but in January 1871 a Royal order stipulated that only children who had survived 24 hours outside of their mother's womb were to be defined as persons and required to have their birth registered. This conflict in the legislation remained for decades, as there were no significant changes affecting the civil registration process. As baptism remained obligatory for Spain's Catholics, the parish registers remained the preferred source for administrative purposes. It should be noted that the ecclesiastical registers and the civil registers of baptisms were quite separate, managed by two different institutions; the secularisation process that characterised the Second Spanish Republic had no discernible impact on the compilation of the civil registers.
Despite the abundant literature on the demographic transition, the decades between the reduction in childhood mortality and the decline in fertility have received little attention from researchers. Birth-baptism intervals have also seldom been used as a source by historical demographers, especially those interested in Spain, although sociologists studying Catholicism, and French Catholicism in particular, have developed an interesting and abundant literature on this topic.Footnote 30 Our research therefore contributes with new insights into the timing of parents’ realisation that childhood mortality was falling and how they changed their behaviour in response, revealing how the demographic transition may have occurred in one part of rural Spain. We offer new perspectives on – and a new methodological approach to – one of the major transformations of society in recent centuries.
2. The demographic transition: the cornerstone of historical demography
The demographic transition marked the origin of some of the most profound social and economic changes of recent centuries. Classic demographic transition theory links the drop in childhood mortality with the subsequent fall in fertility as couples reacted to increasing family size.Footnote 31 However, this theory does not postulate when or how parents first became aware of their children's improving chances of survival, nor does it suggest whether couples reacted immediately to the fall in mortality by implementing fertility control strategies, or whether there was a gap between parents’ recognition of the decline and the reduction of their fertility.
Over the last century, vast amounts of research has been conducted into the causes, evolution and consequences of the demographic transition.Footnote 32 Studies on its cultural aspects have emphasised how the changes in ideas, such as individualism and secularisation, encouraged individual decision-making, compared to previous periods when group decisions were of comparable or greater importance than individual decisions as proposed by some leading historians.Footnote 33 The diffusion of these new ideas and the development of fertility control strategies have also been studied,Footnote 34 as have changes in the perception of the value of children.Footnote 35
In general, the period before the demographic transition is viewed as having a regime of imperfect natural fertility and slow population growth; a period of high fertility and high infant and child mortality.Footnote 36 Recent studies have confirmed that fertility was not entirely natural, as some form of fertility control, either voluntary or involuntary, did exist and could be deployed at moments of crisis, such as those brought on by short-term economic shocks.Footnote 37
According to classic demographic transition theory, childhood mortality declined before fertility, increasing family sizes. This, the theory suggests, may have encouraged couples to control their fertility.Footnote 38 While several scholars, including members of the Princeton European Fertility Project, have questioned the tenets of the theory, many others have argued their validity.Footnote 39 There is little consensus among researchers on why families began to control their fertility. To answer this question in full first-hand information from those who pioneered the use of fertility control is needed. In the absence of such data, however, we can work towards an approximation of the answer using individual and longitudinal data.
The connection between the birth-baptism interval and decreased childhood mortality has been analysed for some southern European countries. Minello, Dalla-Zuanna, Alfani and PiccioneFootnote 40 have, for example, demonstrated that in Italy there was a relationship between the families experiencing the most intense decline in early baptisms and those who saw mortality in the first three months of life fall most steeply between 1816 and 1870. Residori finds a similar relationship between mortality and birth-baptism intervals in the Italian town of Dueville, between 1824 and 1889,Footnote 41 as did Zannini and Gazzi observing the same in the municipality of Seren del Grappa, also in Italy, during the nineteenth century.Footnote 42 Jones found a relationship between mortality and baptismal practices in North Shropshire, England between 1510 and 1810,Footnote 43 but studies of England, France and Rome in the nineteenth century found no such relationship.Footnote 44
The demographic transition was a period of transformation of society with many different forces at work. Most political parties favoured traditional demographic behaviour and opposed fertility control.Footnote 45 Conservatives, and the influential Catholic Church, supported traditional values and therefore encouraged high fertility and the practice of Catholic rites. More left-wing parties, including the Socialists, also promoted decidedly pro-birth policies, believing that a growing working class that was both poor and hungry would foster revolution.Footnote 46 However, in the second half of the nineteenth century the neo-Malthusians, an international pro-fertility control movement, emerged. They argued that high fertility was unsustainable; many young factory workers were being exploited because of the excessive labour supply.Footnote 47 Neo-Malthusianism did not gain a large following in Spain; it was associated only with anarchism and some minor socialist movements.
3. Area of study and sources
In total, 20,923 births were recorded in the parish registers of the ten villages of Alfamén and Middle Huerva between 1830 and 1949. In our analyses we only included those individuals whose dates of birth and baptism both appear on the baptismal certificate. In this way, we were able to ensure that each child was born and baptised on the date or dates recorded. Baptism certificates are filled out by the priest on the day of the ceremony and usually give the child's date of birth as well as that of the baptism. All baptisms, including emergency baptisms (performed by someone other than the priest), should have been recorded by the parish priest.
The study area had a total of 5,205 inhabitants in 1801 and 5,569 in 1860. By 1910 the population had risen to 7,308 but this had decreased to 6,987 by 1960. We constructed an ‘Alfamén and Middle Huerva Database’ (hereafter AMHDB) containing all individuals born in or who had migrated into the parishes analysed between the sixteenth and the twenty-first centuries. We have little or no data on out-migrants. We then linked the records in the database, following the family reconstitution method. The villages of Alfamén and Middle Huerva lie in the Ebro Valley, near the foot of the Algairén mountains. The landscape is a mixture of plains and foothills. During our study period, the area was characterised by the production of wine and grains – particularly wheat – and sheep grazing. To analyse the occupations of family heads, we used the occupations reported for these individuals in the population censuses for 1857 and 1860, the electoral censuses of 1890, 1894, 1900 and 1910, the population lists recorded between 1820 and 1830, and the parish records. The information on occupation was linked to the registers of demographic events. Individuals were assigned an occupation if they were assigned to the same occupation in all available sources throughout their adult life, otherwise they were included in the ‘others’ group.
We considered only those families in which both parents lived to be at least 49 years old, where the marriage date was known, and information on the dates of birth and death of all children was recorded. If we did not find an individual's date of death, we assumed that they had survived until adulthood (this may lead to a small bias if the parents migrated temporarily and the child died in another location or if exceptionally the priest forgot to register the death). These stringent requirements limited the number of families we could include in our calculations but allowed us to perform in-depth analyses. The AMHDB contains 8,043 families, including 6,820 couples who were married between 1830 and 1949. We have information which shows that in 3,254 cases both the husband and wife reached their 49th birthday (and they had children), but in only 815 cases we do have data showing the history of all the couple's children. Thus, we were only able to analyse 10.1 per cent of all the families appearing in the records between 1830 and 1949. To examine whether these 815 couples were representative of the population of the study area we compared some basic demographic variables. The average age at first marriage between 1830 and 1949 for the whole population in the AMHDB was 22.8 years for women and 26.2 years for men. Amongst the 815 couples, women married at 22.4 and men at 26.3. When we considered marital fertility the average number of children amongst all families in which both spouses reached the age of 49 was 6.74 for the couples married between 1830 and 1899, before fertility had begun to fall. The equivalent figure amongst the 815 families was 6.51 children. In general, couples marrying in the AMHDB between 1900 and 1949 had 4.81 children (including their complete life course), on average; compared to 4.68 amongst the 815 couples. The 815 couples and the population thus show very similar values for age at first marriage, but there was a slight bias among the 815 towards smaller families.
When a child died at birth it was common for the death to be recorded in the death register, but no birth was entered in the birth or baptism register.Footnote 48 Children recorded in this way were included in our family reconstitutions. Although the Church did not charge for a baptism ceremony, a child's funeral incurred a cost, although this was relatively small compared to that for an adult's funeral. It is possible that if some parents had a child who was close to death they may have chosen not to have them baptised in order to avoid the funeral fee (at the religious level, unbaptised children did not receive a funeral and were not registered). None of the parish priests in Alfamén and Middle Huerva report such cases, however, so we are unable to say for certain how many parents may have resorted to such measures. The high average marital fertility and the short average birth intervals we observe in our dataset appear to indicate that there was no serious under-registration of all events.
The 815 complete reproductive histories were grouped by the year in which the parents were married. Table 1 shows that the number of histories increases over time. We have data for 29 couples married in the 1830s, compared with 62 in the 1890s and 133 in the 1920s. The changing number of couples was the consequence of the increase in life expectancy seen over the study period. Because of our strict selection criteria, we were confident that we had high quality information on each household and its members. We could be certain that we had a full history of mortality in each family and knew the fate of each child and its previous siblings. Although standard deviations on some of our calculated measures were occasionally large, particularly in the later decades of our study, we were able to observe clear trends which are compatible with the existing literature and our two initial hypotheses.
Numbers of complete reproductive histories included in the analysis, by decade of parents’ marriage; Alfamén and Middle Huerva, 1830–1949

Source: Alfamén and Middle Huerva Database (AMHDB)
The parents of all children born in Alfamén and Middle Huerva before the Second Republic was established in 1931–1936 would have felt duty-bound to have their newborns baptised. Up until the early 1870s, the only registers naming those brought for baptism were those compiled by the Church. At the beginning of the Second Spanish Republic, all the villages in the study area voted for the left-wing republicans, in line with the rest of the country, but this preference for the left gradually declined. In the 1936 elections, Alfamén, Botorrita, Mozota, Muel and Tosos voted for the left, but the conservatives won in Jaulín, Longares and Villanueva de Huerva. During the military uprising of July 1936, which started the Spanish Civil War, all the villages in Alfamén and Middle Huerva supported the pro-Franco side and continued to do so throughout the conflict, although there is little evidence of any political extremism in the area. The Second Republic was characterised by its secular leanings, particularly amongst those on the left, and a small proportion of local families took the decision not to have their children baptised. When the Civil War broke out in 1936, however, a regime of National Catholicism was imposed, and every family was forced to baptise their newly born children during the summer of that year.
Each of the villages in the study area had at least one non-professional midwife to give medical assistance to women in childbirth, during the whole study period. The larger villages generally also had a doctor, while smaller ones only had a nurse and an arrangement with the doctor from a neighbouring village that he would come to assist if there was an emergency.Footnote 49 Rural doctors faced a great number of problems: low salaries, the poverty of the local peasants, poor sanitary conditions and a lack of public health measures, all of which limited their ability to work effectively. As a result, the most prestigious doctors were concentrated in urban areas.Footnote 50
4. Birth-baptism intervals as an indicator of demographic behaviour
The demography of Alfamén and Middle Huerva closely reflects the classic demographic transition, as shown in Figure 2. Mortality amongst the under 5 years old began to decline from the 1860s, and 40 years later this was followed by a rapid drop in marital fertility. Figure 2 also shows the evolution of the interval between birth and baptism in our rural, staunchly Catholic, study area. The birth-baptism interval lengthened considerably during the period analysed, increasing between the fall in mortality and the fall in fertility. Was there a connection between the fall in mortality and the increase in birth-baptism intervals in Alfamén and Middle Huerva?
In our analysis, we assigned a value of zero days to the time-gap between birth and baptism if a child was baptised on the day he or she was born. If the child was baptised the day after birth the birth-baptism interval was calculated as 1 day, regardless of the time of birth, as the time of baptism was seldom recorded. It should be noted, however, that the time of birth could significantly affect the timing of baptism. Table 2 shows the average birth-baptism interval, measured in days, by the time of day at which the birth took place, for four 30-year periods. All births in the AMHDB are included in the calculations shown. The results are clear: babies delivered in the early hours of the morning had short birth-baptism intervals, on average, because there was time to have the children baptised the same day. In the thirty years 1830–1859, almost all children born before noon were baptised on their day of birth. Children born between noon and midnight tended to be baptised the following day. Most births in the study area during the nineteenth century, had quamprimum baptisms, i.e. the ceremony was carried out as soon after birth as possible.
Average interval, in days, between the birth and baptism of all children in the AMHDB, by time of day and year of birth, by 30-year period, Alfamén and Middle Huerva, 1830–1949

Source: AMHDB (see Table 1).
Note: N = all births included in the database, not only those from complete families.
In some places, such as England, the length of the birth-baptism interval differed significantly from one period to another, or between localities.Footnote 51 The length of the interval was very similar in all ten villages in Alfamén and Middle Huerva during our study period, and although data for the late eighteenth and early nineteenth centuries was rather scarcer, they suggest intervals very similar to those presented for the 1830–1859 period in Table 2. Moreover, the intervals observed are similar to those found in other areas of inland and Mediterranean Spain. Given that until the 1890s most children were baptised on the day they were born, and given the high average marital fertility, we do not believe there was any under-recording of children's births or baptisms that would affect the length of the birth-baptism intervals calculated.Footnote 52 We therefore consider that the birth intervals calculated were not affected by selection problems and believe the available data to be of a high quality.
Father's occupation, which we took as a proxy to indicate the family's socio-economic status, had little influence on the length of birth-baptism intervals. As shown in the appendix, Figure A1, the children of men in three large occupational groups (day labourers, farmers and others) showed similar trends in their birth-baptism intervals across the study period.Footnote 53 Figure A2 in the appendix suggests that there were no clear differences between the three occupation groups in either the mean number of children borne or the number dying before their fifth birthday. It should be noted that with only 815 couples in our sample, wide margins of error are to be expected. Figures A1 and A2 suggest, however, that socioeconomic status did not play a fundamental role in explaining the evolution of birth-baptism intervals in Alfamén and Middle Huerva's rural, agrarian society.
Figure 2 indicates that child mortality began to fall in Alfamén and Middle Huerva during the 1860s. This decrease in mortality (approximately from the 1860s) was followed by an increase in the birth-baptism interval, and then by a decline in fertility rates. It is not clear, however, whether there was a direct connection between the decrease in mortality and the subsequent increase in the length of birth-baptism intervals; both might have been the consequence of the improvement in the care of new-borns.Footnote 54 Some scholars have also suggested that an increase in birth-baptism intervals in the early stages of the demographic transition might signal a change in parents’ attitude towards their children.Footnote 55
Sunday has long been the day on which Christians come together to honour God at church services. This, and the fact that it was a public holiday on which work was forbidden until the services had been concluded, allowed families to gather together and made it the preferred day to hold baptisms in most branches of Christianity where quamprimum baptism was not the norm, such as Anglicanism.Footnote 56 When birth-baptism intervals began to increase in our study area we can see a tendency for parents to wait until the Sunday following a birth before celebrating the child's baptism.Footnote 57 Table 3 shows the percentage distribution of baptisms by each day of the week in our study area for six 20-year periods between 1830 and 1949. For most of the nineteenth century, baptisms were evenly distributed across the seven days, with 14.2 per cent of baptisms occurring on Sundays, on average. It was not until 1870–1889, and the late 1880s in particular, that the proportion of children baptised on Sundays began to increase. Over the following decades, the percentage of Sunday baptisms continued to rise, from 18.2 per cent in 1890–1909, to 24.6 per cent in 1910–1929, and then 33.8 per cent in 1930–1949. It is clear that as the mean birth-baptism interval lengthened, the preference for Sunday baptisms also grew. The data in Table 3 suggest that the preference for quamprimum baptism in Catholic Spain may have prevented birth-baptism intervals increasing at an earlier date in Alfamén and Middle Huerva. Even so, we wanted to investigate whether there was another reason why Sunday baptisms only became more common from the late 1880s onwards, well after childhood mortality had begun to fall.
Percentage distribution of baptisms across the days of the week and mean birth-baptism interval (in days), by 20-year period, Alfamén and Middle Huerva, 1830–1949

Source: AMHDB (see Table 1).
5. Results: The effect of mortality on the timing of baptisms
We now turn to examine the role of infant, as opposed to childhood, mortality in baptism patterns as this offers a more precise picture of how family strategies related to baptism. First, we considered whether there was a reverse relationship between infant mortality and the average length of the birth-baptism interval. Were parents able to judge the health, or survival chances, of their new-borns and did they make decisions on when to baptise them based on that knowledge? Table 4 shows, for four 30-year periods 1830–1949, the percentage distribution of the baptisms of those children dying at specified ages within the first year of life across five birth-baptism intervals: 0, 1, 2–3, 4–5, or 6 or more days. The results strongly suggest that parents were able to judge their baby's survival chances and organised their baptism accordingly. In all four periods, most children who went on to die in the first week of life had been baptised on the day of their birth, although the proportion varied between 95 per cent of cases in the earliest period and 66 per cent in the latest. The difference in the timing of baptism by the survival of the infant become less stark amongst those dying in the second week of life or later. In all periods, apart from 1920–1949, infants dying after the first week but within the first month of life had birth-baptism interval distributions similar to those who died in months 1–5. There thus appears to have been a relationship between the apparent state of a child's health at birth and the likelihood that they would be baptised on their first day of life, or in the first few days in the later periods. This relationship appears to have become less marked over time but remains even in the later periods when birth-baptism intervals were longer. If the number of children with poor survival chances fell as maternal nutrition or care improved, this might explain the increasing length of birth-baptism intervals. However, this cannot be the sole explanation, as intervals also increased amongst children who were not in immediate danger. Who were the parents who decided to increase the time between their child's birth and baptism? What reasons did they have for doing so when, even though their children were not visibly at risk of dying shortly after birth, neonatal mortality rates remained high, and the danger remained that if the child died before they were baptised they would be unable to enter heaven.
Percentage of baptisms with a birth-baptism interval of 0, 1, 1, 2–3, 4–5, and 6 or more days by child's age at death within the first year of life, by 30-year period, Alfamén and Middle Huerva, 1830–1949

Source: AMHDB (see Table 1).
Note: N(1830–1859) = 184 observations, N(1860–1889) = 240 observations, N(1890–1919) = 310 observations, N(1920–1949) = 264 observations.
Twins are not included in the analysis.
Humans tend to modify their behaviour as a result of experience. Table 4 strongly suggests that parents who waited several days to have their children baptised made conscious decisions, based on many factors. One of the most important of these factors was their experience of mortality amongst their previous newborn children. Table 5 shows that parents who had previously had a child die during the first five days or 120 hours of life, baptised succeeding children more quickly throughout the 1830–1949 period. While the median birth-baptism intervals in Table 5 range from 0.2 to 4.4 days, in almost all cases the shortest mean intervals at each parity occurred amongst those parents who had previously experienced the death of a child within 5 days of birth. The results shown in Table 5 are consistent with the psychological literature on order effects.Footnote 58 Psychologists report that decision-making is most affected by both the first and the most recent experiences relating to the decision being taken. In this case, parents’ experience of the survival of their first child and of the child born immediately before the one whose baptism they were considering would affect their decision most deeply. In our study the birth-baptism interval was decidedly shorter if the couple's preceding child had died shortly after birth. Despite the small number of families used in our calculations, the confidence intervals for children at parities 2 and 3 leave no room for doubt; parents who had experienced the early death of their previous child opted for a shorter birth-baptism interval for their current newborn.
Average length of the birth-baptism interval, in days, amongst parents who had experienced the death of their previous child in the first 5 days of life, by parity of their most recent child; Alfamén and Middle Huerva, 1830–1889 and 1890–1949. (Standard errors are shown in parenthesis)

Source: AMHDB (see Table 1)
Note: Parity X refers to the birth of the Xth child.
N = 1,853 individual from 815 complete families (for the whole table).
Twins are not included in the analysis.
Not all individuals in the complete families have information on birth-baptism intervals, so they could not be included in the analysis.
Because mortality amongst children aged less than 5 had been falling since the 1860s in Alfamén and Middle Huerva, the observed increase in the length of birth-baptism intervals in the area from 1890s could have occurred because fewer parents were experiencing the mortality of a child in the first few days of life. This would imply that there was a direct relationship between the drop in childhood mortality and the increase of the time between birth and baptism. However, we cannot confirm this simple explanation with the data available to us. Figure 3 shows that the fall in mortality amongst the under-5-years-old did not occur in a homogeneous way across each age group. While mortality for all those aged less than 5 fell rapidly, deaths under a year also decreased, but at a slower pace, and the average numbers of deaths in the first 0–5 days after birth, hardly changed until the 1910s, at least in our rural study area. We therefore have no reason to think that the marked increase in the length of birth-baptism intervals seen from 1890s in Alfamén and Middle Huerva was the consequence of reduced mortality in the first hours, or days, of life, and are thus unable to confirm that the relationship between these two factors observed by Minello et al in northern Italy during the nineteenth centuryFootnote 59 was also present in our study area.
The average number of children dying on the first day of life, and in the first 5 days, 30 days, 1 year and 5 years of life in families with completed fertility; Alfamén and Middle Huerva study area, decadal marriage cohorts 1830–1949.
Source: AMHDB (see Table 1).
Note: N = 815 completed families.

Most literature on societal learning indicates that people's perceptions of events that occur over a long period of time, such as the fall in childhood mortality, are usually highly flawed.Footnote 60 Individuals, particularly those with low levels of education, which would be almost everyone in our study, gain imperfect impressions of events. Furthermore, events with negative connotations, such as the death of a child, tend to affect individuals more than events which are the norm, such as a child's survival.Footnote 61 It must be remembered, however, that the standard of living amongst the inhabitants of rural Spain was close to the bare minimum needed for survival.Footnote 62 For them, the survival of an increased number of children may also have been a negative event, if the family budget came under increasing strain. The parents may well have perceived the adverse effects on their living conditions, even though they were unable to pinpoint the change in mortality patterns as the reason for their situation. The impact of growing family size on household budgets and a population's consequent response forms the basis of neoclassical demographic transition theory.Footnote 63
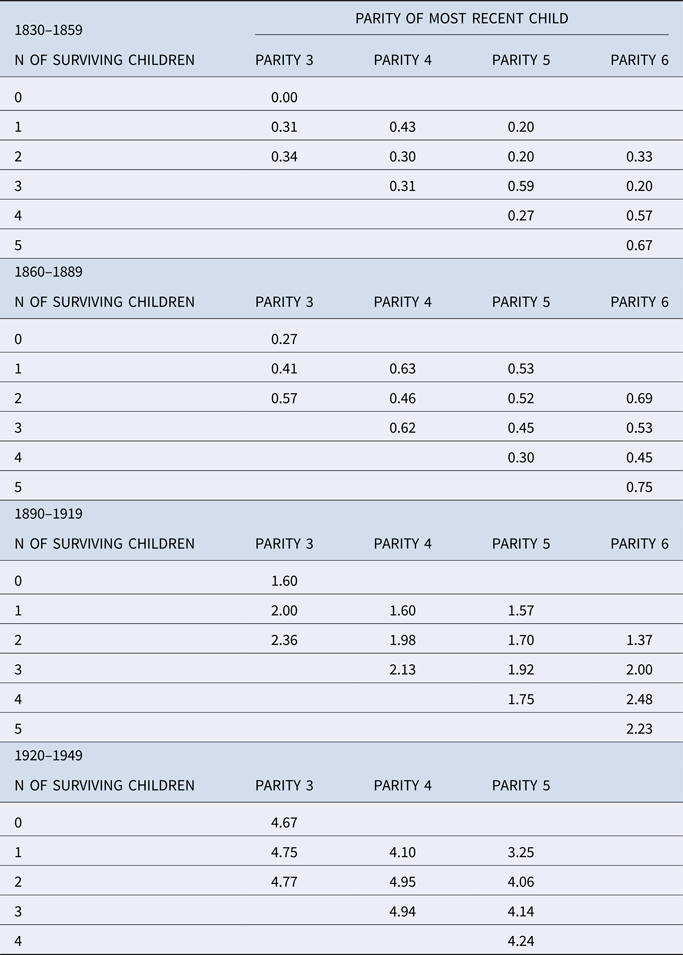
It is possible to analyse the effect of parents’ total experience of childhood mortality on birth-baptism intervals from a number of perspectives. Table 6 shows the average length of birth-baptism intervals in days, controlling for the parity of the newest child and the number of previous children who have survived to the date of that sibling's arrival, in four periods between 1830 and 1949. Each period represents a different stage of the demographic transition: 1830–1859, before the drop in childhood mortality; 1860–1889, after the drop in childhood mortality; 1890–1919, after the birth-baptism intervals began to increase rapidly and the initial stages of the fertility transition; and 1920–1949, the main stage of the fertility transition when there was a rapid decline in marital fertility and childhood mortality. If parents’ experience of childhood mortality was associated with an increase in birth-baptism intervals, we would expect those parents with fewer surviving children to baptise their children most rapidly. Having witnessed the death of previous children, they would want to make sure that if their new baby died it would go to heaven. Parents with the most surviving children might be expected to exhibit slightly longer birth-baptism intervals because their experience of child mortality was more favourable.
Average length of birth-baptism interval, in days, by parity of most recent child and survival status of all previous children, Alfamén and Middle Huerva 1830–1859, 1860–1889, 1890–1919 and 1920–1949
Source: AMHDB (see Table 1).
Note: Parity X refers to the birth of the Xth child.
N of surviving children refers to the number of previous children who survived until the child indicated by parity X.
N = 1,853 individuals from 815 complete families (for the whole table).
Twins are not included in the analysis. Standard errors can be found in Table A1 in the appendix.
The results in Table 6 show that in the two periods before 1890 the birth-baptism intervals follow an almost random pattern, irrespective of the parity of the new-born or the mortality amongst its older siblings. 1890 forms a turning point, however, with the results after that date exhibiting a clear pattern: parents who had experienced the greatest number of deaths amongst their children displayed shorter birth-baptism intervals. They must have been aware of the dangers that existed; they had experienced them. Parents whose previous children had all survived did not always display the longest birth-baptism intervals, but their latest interval was, on average, invariably longer than that of parents with few surviving children. In general, parents whose children all survived to age 5 baptised all their children at more or less the same age, although birth-baptism intervals amongst this group increased over time. Our results suggest, therefore, that parents’ experience of mortality in the first 5 years of life (and especially in the first few days of life) amongst their children did influence birth-baptism intervals, with parents actively seeking to reduce the risk that their child might be unable to enter heaven. This shift in behaviour only occurred after 1890, once the demographic transition was underway and mortality had declined, but before fertility began to fall.Footnote 64
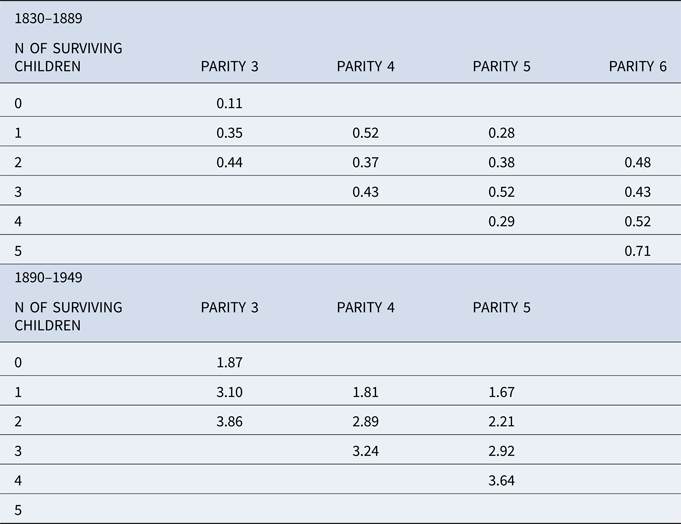
Table 7 repeats the analysis in Table 6 but considers neonatal mortality only. ‘Surviving’ children in Table 7 are those still alive after the first 28 days of life, regardless of whether they died later. Because of small numbers, only two periods are used: 1830–1889, before the increase in the birth-baptism gap; and 1890–1949, when birth-baptism intervals had begun to increase. The results in Table 7 are compatible with those in Table 6; parents who experienced greater neonatal mortality amongst their previous offspring had their newest child baptised more quickly. The results in Table 7 suggest that a relationship between neonatal mortality and prompt baptism may have been present in 1830–1889, but the connection becomes much clearer and stronger from the 1890s onwards.
Average birth-baptism interval, in days by parity of most recent child and the number of previous children surviving at least 28 days of life, Alfamén and Middle Huerva, 1830–1889 and 1890–1949
Source: AMHDB (see Table 1).
Notes Parity X refers to the birth of the Xth child.
‘Surviving children’ are those surviving the first 28 days of life, even if they died later.
N = 1,853 individual from 815 complete families.
Twins are not included in the analysis.
Standard errors can be found in Table A2 in the appendix.
Classic demographic transition holds that parents’ awareness of falling mortality amongst their children was a basic condition for the fall in fertility. Our results from Alfamén and Middle Huerva confirm this principle. With the data available, we were unable to ascertain whether parents who increased the interval between their children's birth and baptism were more aware of the decline in mortality than parents who had experienced the death of one or more children. However, in our opinion, the time between birth and baptism can serve as an indicator of when parents decided to change their behaviour because they believed mortality was improving. In that case, these parents were pioneers, breaking, or at least relaxing, the very close connection between birth and baptism, which had been traditional throughout most of the nineteenth century, some ten years or more before fertility began its unprecedented decline.
A complementary explanation, although one that is difficult to prove, is that secularisation caused the increase in birth-baptism intervals. As society became more secular, it is argued, parents became less concerned about having to guarantee their children's access to heaven; secularisation thus acted as a catalyst, encouraging people to modify their traditional behaviour. Unfortunately, we have few ways to measure any increase in secularism in our study area. In the case of Spain as a whole, the Catholic Church lost power relative to the civil authorities from the eighteenth century onwards. This process accelerated during the revolutionary period between 1868 and 1874, known as ‘Sexenio Democrático’ (Democratic Sexennium).Footnote 65
Of the ten villages in our study area, only Torrecilla de Valmadrid still has a complete series of nineteenth century Status Animarum; annual population lists, drawn up by the Catholic Church. The documents show that in this village no one evaded their catechism (obligations of examination of the doctrine) at Easter or was noted as missing confession or communion before 1869. In 1875, 2.3 per cent of those recorded had stopped fulfilling these obligations; by 1880, it was 6.4 per cent, and in 1890, 7.4 per cent. It is not until the 1930s, however, that we can find documents from Alfamén and Middle Huerva referring to couples who had not married according to the rites of the Catholic church and, by comparing the parish and civil registers, we can identify children who had not been baptised. The parents of these unbaptised children were possibly linked to the growing secularism that characterised Spain's Second Republic, but was then interrupted by the Spanish Civil War and Franco's dictatorship.
Secularisation led some families to follow religious customs, including those linked to baptism, less strictly. Nevertheless, all families continued to baptise their children for many decades, suggesting that secularisation proceeded slowly and created minimal disruption to people's traditional way of life. It may have had some influence on birth-baptism intervals, but our observations suggest that it was not the only factor affecting the speed with which parents baptised their children either in our study area, in Spain or in other southern European countries. This study, along with several others,Footnote 66 has demonstrated that the connexion between the mortality parents experienced amongst their children and the length of birth-baptism intervals owes its existence to more than the rise of secularism.
6. Discussion and conclusions
Our research examined one hypothesis, based on classic demographic transition theory, concerning how the transition evolved. Despite the vast literature on this topic, certain issues and variables, which may have much to contribute, remain relatively unexplored by historical demographers. Here we have proposed a new approach, using a little-studied variable: the average length, in days, of the interval between birth and baptism. Minello, Dalla-Zuanna, Alfani and PiccioneFootnote 67 showed that there was a connection between the decline of mortality amongst children aged less than 1 and an increase in the birth-baptism interval in nineteenth century Italy. In this article, we have demonstrated that in our Spanish study area there was also a connexion between the decline of mortality amongst children aged less than 5 and an increase in birth-baptism intervals. Our results confirmed that birth-baptism intervals were affected by changes in the levels of childhood mortality which families experienced; parents in our rural study area who lost the greatest number of children were the quickest to have their subsequent children baptised. As Catholics, they were concerned that the eternal salvation of their offspring might be at risk if they remained unbaptised. The connection between parents’ experience of mortality amongst their children and the birth-baptism interval was not evident at all periods in our study area; it only began to develop towards the end of the nineteenth century, around 1890, after the initial drop in childhood mortality heralding the start of the demographic transition, but before the subsequent drop in fertility. Further research is needed to understand whether similar results would be found elsewhere and to assess whether it was the fall in infant mortality, rather than in childhood mortality that was the trigger which increased the interval between birth and baptism. Studies with larger numbers of families available would allow us to confirm or reject our results with greater confidence.
In all the periods we analysed, couples who had seen at least one of their children die in the first hours of life waited less time to baptise their subsequent children, on average, than those who had not had this experience. However, it was not until the 1890s that a strong connection between the experience of losing a neonate and the length of the birth-baptism interval was observed.
An alternative explanation as to why parents decided to increase the birth-baptism interval suggests that this was to avoid the adverse effects that might ensue if newborns were exposed to poor weather as they were taken to the church, or were doused with cold water in their first hours of life. We have no evidence from Alfamén and Middle Huerva which helps to confirm or refute this hypothesis. We must ask, however, why the increase in birth-baptism intervals started so late in this area, given that the adverse health effects of quamprimum baptism had been debated in Catholic countries since the eighteenth and early nineteenth centuries, and baptisms had been delayed in neighbouring countries, such as France or Italy, for several decades. These worries over the risk to their children's health may have acted as a catalyst, encouraging parents to increase the interval between birth and baptism, but given that it would have taken most villagers no longer than 5 minutes to walk from their house to the parish church in our study villages, it is also possible that parents saw no need to change their behaviour. Their children would have been exposed only briefly to the elements, and the pouring of water on the baby's head was an unavoidable part of the baptismal ceremony. Moreover, those parents who had experienced the early death of a child baptised their subsequent children very quickly after birth; it does not appear that they viewed cold water or poor weather as major risks. From the late nineteenth century onwards, parents also increasingly chose to have their children baptised on a Sunday, but this preference only became evident once parents felt able to extend the birth-baptism interval.
The evidence presented above confirms the existence of a relationship between the perceived risk that an infant might die and the speed with which that infant was baptised. This could mean that, when mortality amongst newborns fell, there was an increase in the average birth-baptism interval. It seems unlikely, however, that this was the only reason for the increase, given that more than 50 per cent of infants in Alfamén and Middle Huerva were baptised on the day of their birth until the 1890s. Additional separate factors, such as improvements in childcare, may have affected both infant mortality and the birth-baptism interval. At the same time, the spread of ideational change, in the form of increased individualism and secularisation, may have encouraged couples to break with traditional practices.Footnote 68 As well as increasing birth-baptism intervals, such ideational change may have also stimulated the fertility transition.
To sum up, this article offers a new perspective on the demographic transition and the link between the fall in childhood mortality and the reduction in fertility. Our results suggest that parents were aware of the changes that were occurring in child survival and began to adapt their children's birth-baptism intervals in response, approximately ten years before the start of the fertility transition. This is an important contribution to our understanding of parents’ motivations and the process of demographic transition in rural Spain, particularly as there have been no previous quantitative studies of early baptism on the Iberian Peninsula.
Data availability
http://dx.doi.org/10.17632/9zyz2twbv9.1 (Mendeley)
Appendix
Evolution of birth-baptism interval (in days) by occupation of father, 1830–1949.
Source: AMHDB.
Note: Number of complete families (Day labourers) = 258; N (Farmers) = 290; N (Others) = 267. The small sample size means that there are wide confidence intervals, making it impossible to reach confident conclusions.

Indicators of reproduction by occupation of father, organized by marriage-year cohort, 1830–1949.
Source: AMHDB.
Note: Number of complete families (Day labourers) = 258; N (Farmers) = 290; N (Others) = 267. The small sample size means that there are wide confidence intervals, making it impossible to reach confident conclusions.

Standard error of Table 6 by parity and survival status of all previous children, four subperiods (1830–1859, 1860–1889, 1890–1919, 1920–1949)

Standard error of Table 7 by parity and survival status of all previous children, four subperiods (1830–1889 and 1890–1949)


 Open access