

Gluten is a protein complex composed of glutenins and prolamins found naturally in the seed of many cereals such as barley, rye and wheat. It is formed when the insoluble proteins (glutenin and gliadin) are mixed in the presence of water, becoming a viscoelastic mass( Reference Shewry, Halford and Belton 1 ). Studies have shown that gluten is partially digested by enzymes in the gastrointestinal tract, which could lead to the formation of immunogenic peptides as gliadin, a prolamin that composes the gluten( Reference Shan, Molberg and Parrot 2 ). Gliadin could favour the proliferation of pathogenic bacteria( Reference Caminero, Galipeau and McCarville 3 ), which substitutes the native microbiota. This dysbiosis is associated with the reduction of intestinal barrier function, potentially facilitating infection and inflammation( Reference Hawrelak and Myers 4 – Reference Sanz 7 ). Besides, fractions of amylase–trypsin inhibitors (ATI), a family of small homologous proteins capable of triggering symptoms of sensitivity or allergy which are naturally present in wheat can contaminate gluten during the protein isolation process and may contribute to the induction of inflammatory bowel response by increasing pro-inflammatory cell and cytokine levels( Reference Zevallos, Raker and Tenzer 8 – Reference Junker, Zeissig and Kim 10 ).
Adherence to a gluten-free diet is commonly recommended for individuals with coeliac disease, non-coeliac gluten sensitivity or wheat allergy. However, some experimental studies suggest that gluten-free diets might also be useful to prevent or treat rheumatoid arthritis, type 1 diabetes mellitus, obesity and insulin resistance and inflammatory bowel disease (IBD), such as Crohn’s disease, irritable bowel syndrome and ulcerative colitis (UC)( Reference Biesiekierski, Newnham and Irving 11 – Reference Herfarth, Martin and Sandler 15 ).
UC is an idiopathic disease characterised by recurrent episodes of inflammation that predominantly affects the mucous and submucosal layers of the colon, causing gastrointestinal lesions, including ulcers and open wounds on the surface of the lining, diarrhoea and haemorrhage( Reference Abraham 16 , Reference Walton and Alaunyte 17 ). The clinical course is characterised by periods of remission and exacerbation, which may occur spontaneously or in response to treatment( Reference Kornbluth and Sachar 18 ). Although it may affect individuals in all age groups, UC is usually diagnosed between late adolescence and early adulthood and affects both sexes equally( Reference Walton and Alaunyte 17 , Reference Loftus 19 ).
In areas such as northern Europe and North America, the incidence and prevalence of IBD, such as UC, are beginning to stabilise. However, in low-incidence areas, such as southern Europe, Asia, Oceania, and much of the developing world, they continue to grow( Reference Loftus 19 , Reference Ng, Shi and Hamidi 20 ). The incidence has increased in newly industrialised countries in Africa, Asia and South America since 1990( Reference Ng, Shi and Hamidi 20 ) and is estimated that 2·2 million people in Europe and 1·4 million people in the USA suffer from these diseases( Reference Loftus 19 ).
Several mechanisms have been proposed to elucidate the causes of UC, including abnormal immune response to dietary antigens, such as gluten( Reference Hafström, Ringertz and Spångberg 12 , Reference Herfarth, Martin and Sandler 15 , Reference Vieira, Leonel and Sad 21 ). However, few studies have addressed the role of the diet containing wheat gluten and the development of UC.
In this study, we evaluated the effect of the gluten-containing diet on the evolution of UC as well as the morphological and cellular changes in the intestinal mucosa in a model of experimental colitis in C57BL/6 mice.
Methods
Animals and diet
This study was approved by the Ethics Committee on Animal Use the Federal University of Minas Gerais (protocol 253/2015). 8-week-old female C57BL/6 mice were group housed (2–5 animals per cage) in a room with 12 h light cycles and controlled temperature (26 ± 2°C). All mice received an AIN-93M diet for 10 d before the start of the experiment (adaptation period). After adaptation, mice were divided into four groups: control (C), control + gluten (C + G), colitis (Col) and colitis + gluten (Col + G). The C and Col groups received a gluten-free AIN-93M diet. The C + G and Col + G groups received an AIN-93M diet with 4·5 % vital wheat gluten (Granotec). All diets had the same composition (15·8 % proteins, 74·2 % carbohydrates, 10·0 % lipids and 11·54 kJ/g (2·76 kcal/g); online supplementary Tables S1 and S2). The Col groups received sodium dextran sulphate (DSS – molecular weight, 36 000–50 000 Da; MPBiomedicals) solution (1·5 %, w/v) instead of drinking water for the last seven experimental days. DSS was prepared as previously described and administered in aqueous solution( Reference Wirtz, Neufert and Weigmann 22 ). Diet and water (or DSS solution) were provided ad libitum. Body weight and food intake were evaluated weekly. At the end of the experiment (15th day), all animals were anaesthetised and euthanised for collection of blood and organs.
In the initial studies comparing healthy mice fed a diet with or without gluten, gluten intake did not affect the clinical score, intestinal inflammatory infiltrate (online Supplementary Fig. S1), histopathological alterations (online Supplementary Fig. S2) and intestinal permeability (online Supplementary Fig. S3). Since C and C + G groups showed no differences in any result, we believe that the contribution of the C + G group would be modest in face of the number of mice that should be euthanised and, due to ethical reasons, we continued our study using only the C group to be compared with the Col groups.
Clinical score and colon inflammatory status
The clinical score was obtained by analysis of stool consistency and presence of faecal blood detected using a Hemoccult kit (InLab), as previously reported( Reference Wirtz, Neufert and Weigmann 22 ). The colon inflammatory status was evaluated by colonic myeloperoxidase (MPO), eosinophil peroxidase (EPO) and N-acetylglucosaminidase enzymes present in neutrophils and eosinophils and macrophages, respectively, as previously described( Reference Werner and Szelenyi 23 ).
Histological analysis
Colons were collected, measured and fixed in Bouin solution and then immersed in buffered formalin for 2 weeks before inclusion in paraplast. After inclusion, the sections were coded and stained with haematoxylin and eosin for further blind analysis by a trained pathologist. The mucosa integrity was evaluated for the depletion of goblet cells, the presence of mucosal erosion or ulceration, inflammatory infiltrate and oedema. These analyses were blinded and based on the scores system, which ranged from 0 (no injury) to 3 (serious injury) (adapted)( Reference MacPherson and Pfeiffer 24 ). The results are presented as the sum of the score obtained for each parameter. The extension of the area affected by inflammation was filmed for analysis and then measured.
Intestinal permeability
The evaluation of intestinal permeability was performed 4 h after gavage of 0·1 ml of a solution of diethylenetriamenepentaacetate acid (DTPA) labelled using 18·5 MBq of 99mTechnetium (99mTc), as previously described( Reference Andrade, Santos and Soares 25 ). The radioactivity was measured using a gamma counter (PerkinElmer Wallac Wizard 1470-020 Gamma Counter; PerkinElmer Inc.). Final results were expressed as a percentage of the administrated dose per gram of tissue or organ (%Dose/g).
Bacterial translocation
The culture, preparation and labelling of Escherichia coli were performed as previously described( Reference Andrade, Santos and Soares 25 ). On the last day of the experiment, animals received a suspension containing 99mTc-labelled E. coli (108 cells) by gavage. At 45 and 120 min after gavage, mice were anaesthetised and placed in the supine position under the camera range (Nuclide™ TH 22; Mediso). A 20 % window centred at 140 kV and low-energy collimator were used to direct the rays. The images were obtained for 5 min and stored in a matrix 256 × 256 pixels. After that, mice were euthanised and blood, mesenteric lymph nodes, liver, spleen and lungs were collected for radioactivity count in an automated gamma counter (PerkinElmer Wallac Wizard 1470-020 Gamma Counter; PerkinElmer Inc.), as previously described( Reference Andrade, Santos and Soares 25 ). The same protocol was used to investigate bacteria translocation 4 h after 99mTc-E. coli administration, except for the image acquisition that was not performed (only at 45 min and 2 h). The results of radioactivity count were expressed as count/min per g of tissue.
Transmission electron microscopy
Sections of the colon (2 μm) were fixed in 2·5 % glutaraldehyde in phosphate buffer for 6 h. After fixation and processing, the sections were used to select the area of analysis and were cut into ultra-thin sections (60 nm) using an ultramicrotome. These sections were placed on a Cu screen (200 or 300 mesh) contrasted with uranyl acetate and lead citrate, and images for analysis were obtained using transmission electron microscopy (TEM; Tecnai G2-12 – SpiritBiotwin EIF – 120 kV). About five images of each animal were collected for measurement. The number of microvilli was counted and divided by the tissue length (nm). The number of vesicles of the endosome/lysosome system was divided by the tissue area (nm2). The width of the joints and the diameter of the vesicles of the endosome/lysosome system were considered the starting and ending points of each delimiting membrane. Tissue processing and staining were performed by the Acquisition and Image Processing Centre (CAPI-ICB/UFMG), and a trained professional performed analysis at the UFMG CM centre.
Western blotting
Colonic epithelial cells were separated from the muscle layer and lysed in a solution of lysis buffer plus 0·3 % Triton X-100, 0·5 % SDS, and protease inhibitor cocktail (SigmaFAST; Sigma-Aldrich). Protein was measured( Reference Lowry, Rosebrough and Farr 26 ) and separated on the polyacrylamide gel. Proteins were transferred to a nitrocellulose membrane (0·45 μm pore). After blocking, the membrane was incubated overnight at 4°C with the primary antibodies anti-β-catenin (rabbit monoclonal; Sigma-Aldrich) and anti-E-cadherin (mouse monoclonal; BD Biosciences). After washing, the membrane was incubated for 2 h with the anti-rabbit IgG-CFL 647 and anti-mouse IgG-FITC (Santa Cruz Biotechnology). After the incubation, the membranes were scanned (Typhoon™ FLA 9000 apparatus; GE Healthcare Bio-Sciences AB) and the band intensity was evaluated by densitometry using ImageJ software.
Immunofluorescence
The adhesion junction proteins E-caderin, β-catenin and α-E-catenin were analysed by immunofluorescence. The following primary antibodies were used: anti-β-catenin (rabbit monoclonal), anti-α-E-catenin (rabbit polyclonal) and anti-E-cadherin (mouse monoclonal). The secondary antibodies were IgG-FITC (Santa Cruz Biotechnology) and anti-rabbit IgG-CFL 647 (Santa Cruz Biotechnology), which were diluted as indicated by the manufacturers. All slides were mounted with mounting medium containing DAPI (4′,6-diamidino-2-phenylindole, dihydrochloride). The images were captured by a fluorescence microscope at 20 and 100 × magnification. The fluorescence intensity was measured using the Image-J image analyser software.
Real-time quantitative reverse transcription-PCR
Total RNA from colon samples was extracted using TRizol reagent for the C group and NucleoSpin® RNA Clean-up purification kits (MACHEREY-NAGEL GmbH & Co. KG) for the Col groups, according to the manufacturer’s protocols. After obtention of complementary DNA by reverse transcription, samples were placed in the thermocycler at 72°C for 5 min for annealing, then 42°C for 3 h and 72°C for 15 min for transcription. The mRNA was determined using the SYBR Green reagent and specific primers in the ABiPrism 7900HT Sequence Detection System. Glyceraldehyde-3-phosphate dehydrogenase (GAPDH) – forward (F): ACGGCCGCATCTTCTTGTGCA and reverse (R): CGCCCAAATCCGTCCACACCGA; α-E-catenin – F: TCTGAGTAGGCTGAAGTGCC and R: CAGCATCACAACACACGAGC; vinculin – F: TCAGATGAGGTGACTCGGTTGG and R: GGGTGCTTATGGTTGGGATTGG.
Gene expression was normalised to endogenous GAPDH, and the results were expressed as fold increase over control (2–ΔΔC T ).
Statistical analysis
The sample calculation was performed considering 80 % for the power of the test and two-sided significance level (P <0·05). The results were evaluated for normal distribution by the Kolmogorov–Smirnov test and the presence of outliers by the ROUT test, a method based on robust non-linear regression and the false discovery rate. Parametric data were submitted to the one-way or two-way ANOVA test, followed by the Newman–Keuls multiple post-test or Student’s t test for the comparison of two groups. Non-parametric data were analysed by the Kruskal–Wallis test, followed by Dunn’s multiple comparison post-test or the Mann–Whitney test for comparison of two groups. For the co-localisation analysis, the Pearson correlation coefficient (r) was used and, after ANOVA, the Newman–Keuls post-test. Statistical analyses were performed using GraphPad Prism 5.0 software (GraphPad Software).
Results
Animals, diet, clinical score, inflammatory profile and histological analysis
For the initial investigations, water intake, energy intake, weight before and after DSS and clinical score were analysed. The water intake and energy intake were similar between groups and when comparing before or during the administration of DSS (2·8 ml/d and 33·05 kJ/d (7·9 kcal/d), respectively). Body weight was similar (about 17·8 g) in all groups after the first experimental week (before DSS administration) and lower in the Col group during the period of DSS solution intake (Fig. 1(a) and online Supplementary Fig. S1A). This result was already expected since animals with DSS-induced colitis presented lower weight gain or even weight loss when compared with healthy animals( Reference Vieira, Leonel and Sad 21 , Reference Andrade 27 ).
Clinical, inflammatory and histological parameters. (a) Body weight before and after sodium dextran sulphate (DSS). (b) Total clinical score. (c, d) Inflammatory profile. (e, f) Histologic analysis. MPO, myeloperoxidase; EPO, eosinophil peroxidase. There was weight loss in both Colitis (Col and Col + G) groups, worsening of the total clinical score, higher activity of neutrophils and eosinophils, and greater extension of inflamed colonic mucosa in animals of the Colitis + Gluten (Col + G) group. Values are means, with their standard errors represented by vertical bars. One-way ANOVA (a, c–f) and two-way ANOVA (b) and Newman–Keuls post-test. * Statistically different from Control (C) and Col groups and between Col and Col + G group. a,b,c Mean values with unlike letters were significantly different (P <0·05, n 4–6/group). (a) ![]() , C;
, C; ![]() , Col;
, Col; ![]() , Col + G. (b)
, Col + G. (b) ![]() , C;
, C; ![]() , Col;
, Col; ![]() , Col + G.
, Col + G.
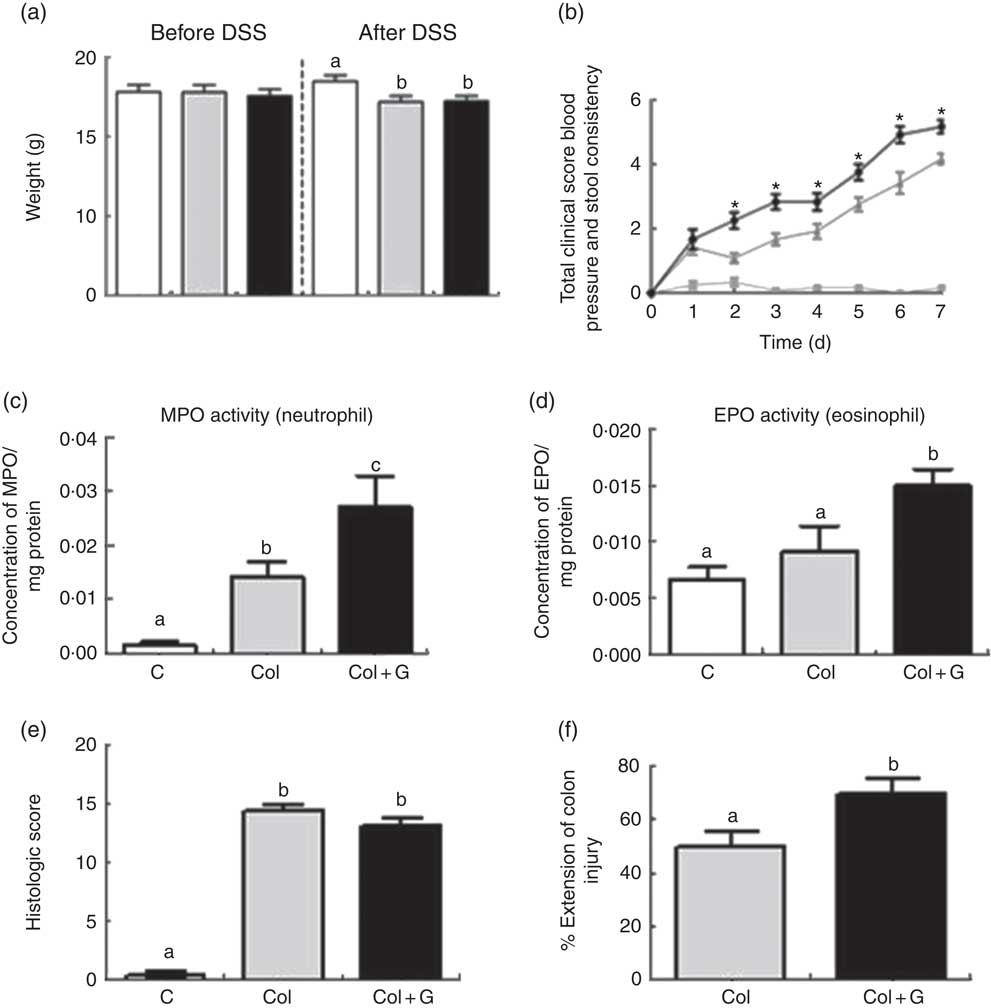
Mice from both colitis groups presented a worse clinical score. However, gluten-containing diet worsened this score from the second until the last day of the DSS administration, compared with the C and Col groups (Fig. 1(b) and online Supplementary Fig. S1B). Only Col + G mice presented visible rectal bleeding. In C + G group (online Supplementary Fig. S1B), no change was observed, suggesting that changes in the clinical score caused by the gluten-containing diet are dependent on colitis and seem to have no relations with the beginning of its signs.
The unfavourable clinical score was associated with infiltration of neutrophils and eosinophils, as suggested by the activity of MPO and EPO, respectively, in both colitis groups, but, again, this was more intense in gluten-supplemented group (Fig. 1(c) and (d) and online Supplementary Fig. S1C and D). These results suggest a possible performance of the gluten-containing diet in the activation of neutrophils, predominant cells in inflamed tissues, and a potential allergen of gluten, which can aggravate inflammation in colitis( Reference Lammers, Chieppa and Liu 28 – Reference Forbes, Murase and Yang 30 ). There was no difference in macrophage infiltration among the groups (data not shown). This result is compatible with others found by our group using the same experimental model( Reference Vieira, Leonel and Sad 21 ). Once again, we did not find any parameter changes in the C + G group (online Supplementary Fig. S1C and D), indicating that the gluten-containing diet does not seem to influence healthy animals, considering the analyses performed.
To investigate the worsening of the clinical score and even rectal bleeding in the Col + G group, we investigated the histopathological parameters. Colitis was associated with histological findings, such as areas of erosion, goblet cell depletion, intense inflammatory infiltrate, abscesses and oedema, with the loss of typical architecture of the intestinal mucosa. Although no difference was seen when the two groups with colitis were compared regarding histological score (Fig. 1(e) and online Supplementary Fig. S2), animals from the Col + G group had a greater extension of inflamed colonic mucosa compared with the Col group (Fig. 1(f)). There was no change in histopathological parameters in the C + G group (online Supplementary Fig. S2), which reinforces the results found previously for this group.
Effects of gluten-containing diet on intestinal permeability and bacterial translocation
After showing a worse clinical score, increased neutrophils and eosinophils infiltration and more extense colon involvement, we next evaluated whether these inflammatory profiles affected intestinal permeability and bacterial translocation. The influence of the gluten-containing diet on intestinal permeability was evidenced by the increased blood radioactivity in those mice performed after 4 h of gavage of 0·1 ml of the suspension containing 99mTc-DTPA (Fig. 2(a) and online Supplementary Fig. S3). The permeability of C + G group was similar the C one (online Supplementary Fig. S3). This result reinforces the idea that the deleterious effects of the gluten-containing diet are relevant only in the presence of colitis. For this reason, we excluded C + G group in our further morphological and cellular analyses.
Intestinal permeability and bacterial translocation. (a) Determination of intestinal permeability using 0·1 ml of 99mtechnetium (99mTc) diethylenetriamenepentaacetate acid (DTPA); (b) a schematic figure representing the animal body reference. (c) In vivo scintigraphy images obtained in the gamma chamber were performed at 45 min and 2 h after gavage of 0·2 ml of 99mTc-Escherichia coli (108 cells; number of images = 3/group). The circled area shows accumulation and dispersion of radioactivity in the abdominal region. (d) Translocation after 2 h after gavage of 0·2 ml of 99mTc-E. coli (108 cells). (e) Translocation after 4 h after gavage of 0·1 ml of 99mTc-E. coli (108 cells). The concentration of 99mTc-E. coli in total body and blood, mesenteric lymph node, liver, spleen and lung at 2 h (d) and 4 h (e) after gavage. Our data suggest that bacteria translocation occurs earlier in Colitis + Gluten (Col + G) group, as demonstrated in Fig. 2(c), showing a higher total bacteria concentration in liver and lung 2 h after 99mTc-E. coli administration (Fig. 2(d)). In the Col group, translocation is also seen, but it initiates later compared with the gluten-fed group since it is higher than that in control group only 4 h after the bacteria administration (Fig. 2(e)). One-way ANOVA test. a,b,c Values with unlike letters were significantly different between groups (P <0·05) (number of animals = 8–10/group). ![]() , C;
, C; ![]() , Col;
, Col; ![]() , Col + G.
, Col + G.
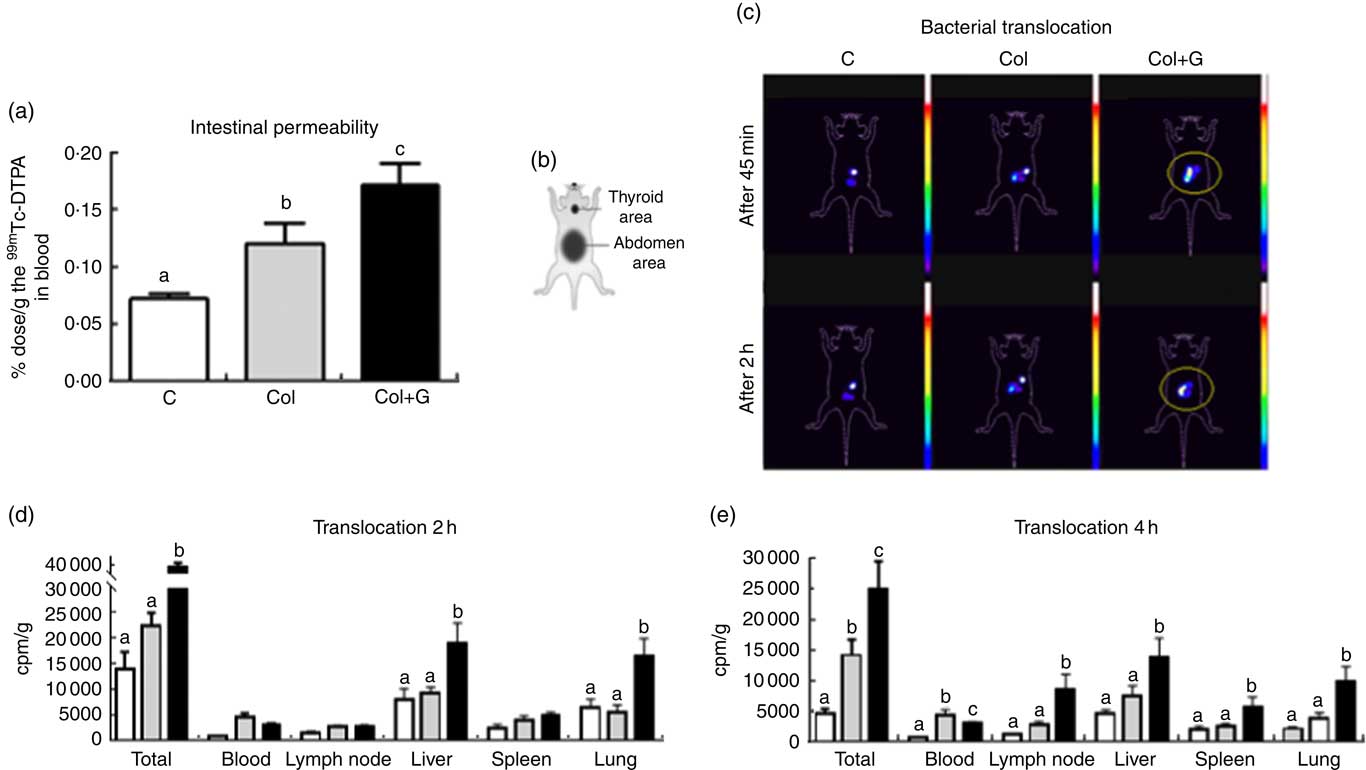
Increased intestinal permeability resulted in increased bacterial translocation. Scintigraphic images obtained 45 and 120 min after administration of suspension containing 99mTc-E. coli (108 cells) showed the radioactivity located in the abdominal region and a higher dispersion of this radioactivity in the Col + G group compared with the others, suggesting a higher bacterial translocation in the Col + G mice (Fig. 2(c)).
The kinetics of distribution of the 99mTc-E. coli in different body tissues showed that 2 h after the gavage of the suspension containing 99mTc-labelled E. coli (108 cells), bacterial translocation is higher in the group receiving gluten-containing diet compared with the Col group. A higher E. coli accumulation is seen mainly in the liver and lung (Fig. 2(d)). After 4 h, the total bacterial translocation was still more significant in the Col + G group in all analysed organs, compared with the Col group (Fig. 2(e)).
Effects of gluten-containing diet on the junctional complex, microvilli and cytoplasmic structures of the colon
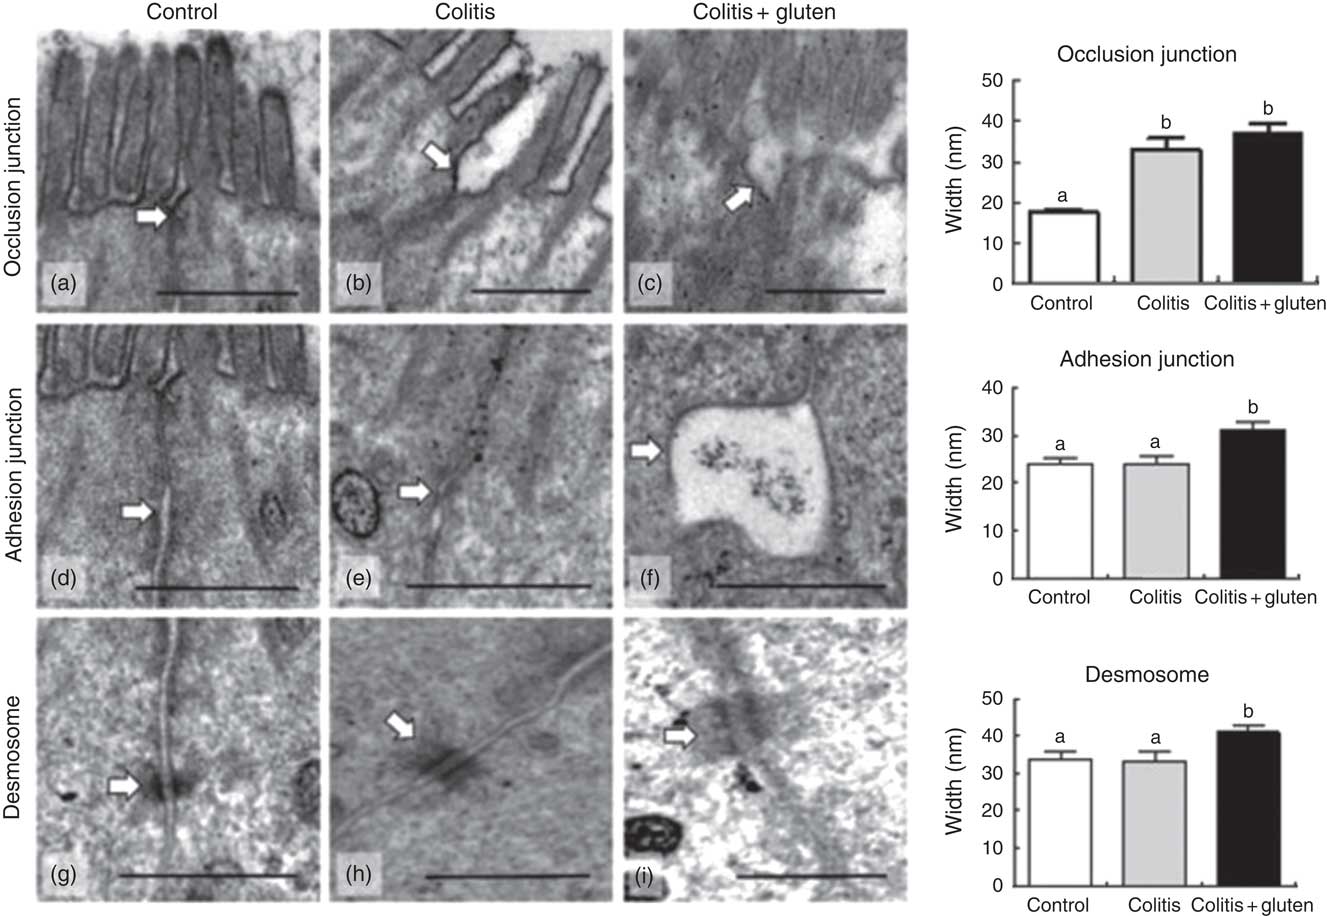
The permeability results were confirmed by TEM, showing the weakness of the occlusion junctions of both Col groups. The occlusion junction, adherent junction and desmosome were analysed separately (Fig. 3). We found that colitis induced a weakness of occlusion junctions without changing adherent junctions and desmosomes compared with control mice (Fig. 3(b), (e) and (h)). Nonetheless, gluten-containing diet caused an alteration in both adherent junctions and desmosomes, in addition to the changes in occlusion junction (Fig. 3(c), (f) and (i)).
Evaluation of cell junctions by transmission electron microscopy. (a–c) For the occlusion junction, we observed closeness of the junction membranes in the control group (a) and distancing of the membranes in the colitis and colitis + gluten (b) and (c) groups; (d–f) for the adhesion junction, we observed closeness of the junction membranes in the control and colitis (d) and (e) groups and distancing of the membranes in the colitis + gluten group (f); (g–i) for desmosomes, we noted the proximity of the membranes of the desmosome in the control and colitis (g, h) groups and distancing of the membranes in the colitis + gluten group (i). Together, the data show fragility of the occlusion junctions of both colitis groups and fragility of the adhesion junction and desmosome only in colitis + gluten group. Values are means, with their standard errors represented by vertical bars. Test: one-way ANOVA and post-test Newman–Keuls. a,b Mean values with unlike letters were significantly different (P <0·05, number of images = 20–25/group, number of animals = 4–5/group). Scale bar = 500 nm. The arrows highlight the evaluated structures.
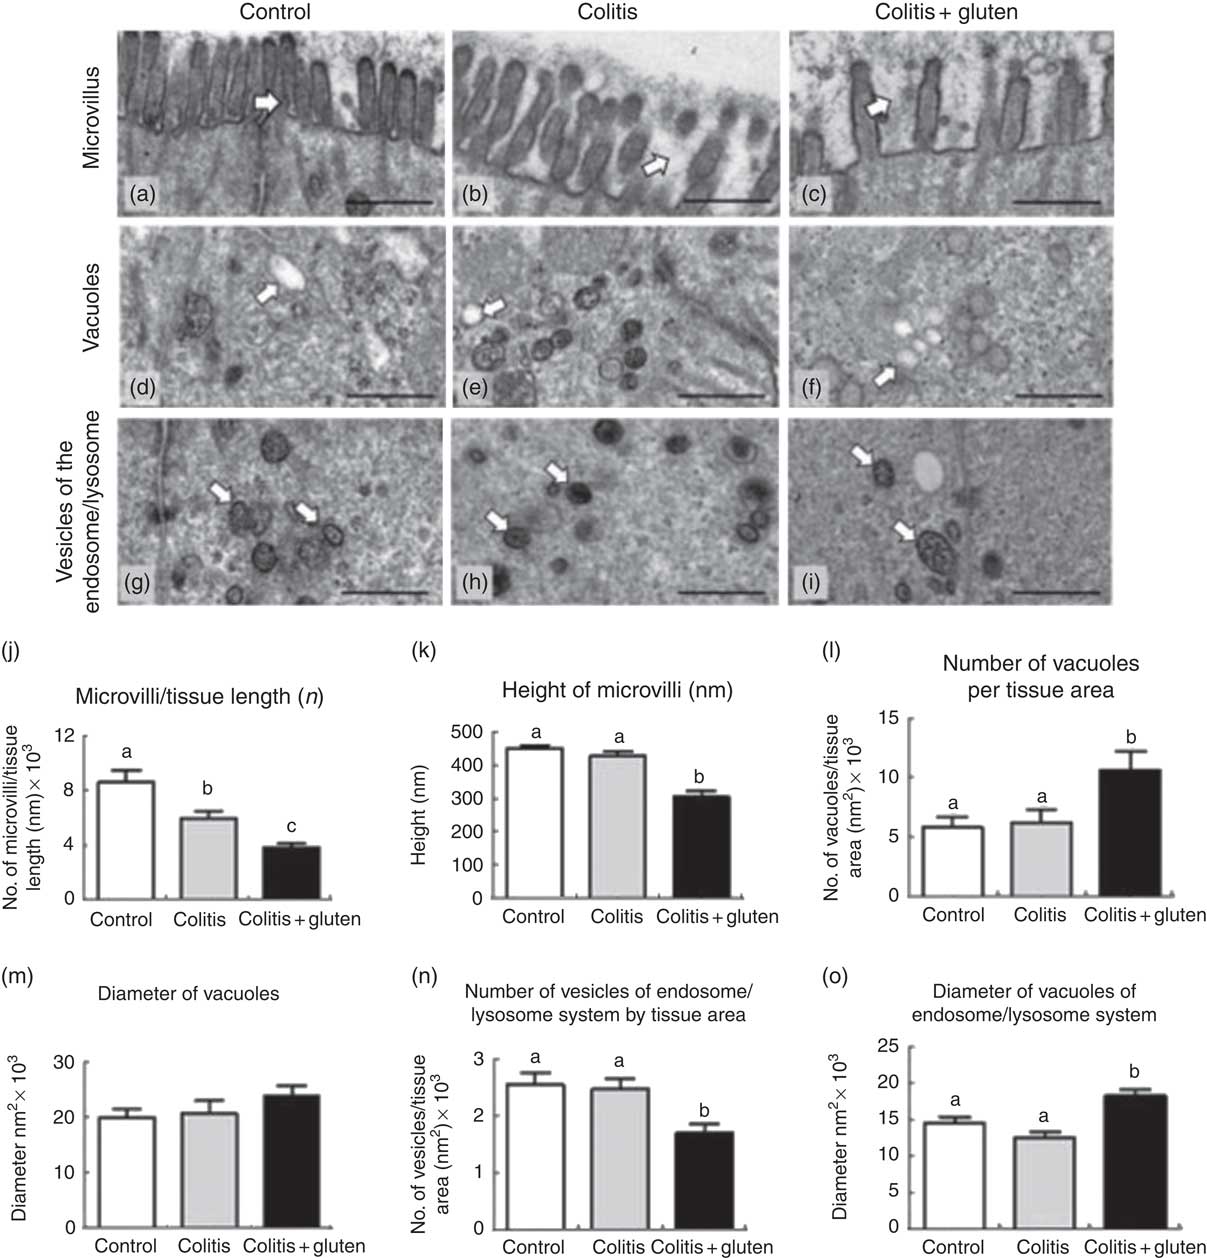
Cell morphology was also analysed (Fig. 4). Mice from the Col group presented cell organisation similar to that found in the control mice, except for the number of microvilli that was reduced in both Col groups. Gluten-containing diet was also associated with a reduction in the length of microvilli and to a larger number of vacuoles. Regarding the vesicles of the endosome/lysosome system, gluten-containing diet was associated with a smaller number of these vesicles but with larger diameters, compared with the other groups (Fig. 4(g)–(i)).
Evaluation of microvilli and cytoplasmic structures of the colon by transmission electron microscopy. (a–c) For the microvilli, we noted the integrity of the microvilli in the control group (a), reduction in the number of microvilli/tissue length in colitis and colitis + gluten groups (b) and (c), and reduction in the height of microvilli in the colitis + gluten group. (d–f) For the number and diameter of vacuoles, we detected similar numbers in the control (d) and colitis (e) groups and increased numbers in the colitis + gluten (f) group. Vacuole diameters were similar for all groups (d–f). (g–i) For the endosome/lysosome vesicle number and diameter, we detected similar numbers in the control (g) and colitis (h) groups and reduced numbers in the colitis + gluten (i) group. We detected similar vesicle diameters in the control and colitis groups (g) and (h) but an increased diameter in the colitis + gluten (i) group. (j) and (k): microvilli; (l) and (m): vacuoles; (n) and (o): vesicles of endosome/lysosome system. Test: one-way ANOVA and post-test Newman–Keuls. a,b,c Mean values with unlike letters were significantly different (P <0·05, number of images = 20–25/group, number of animals = 4–5/group). Scale bar = 500 nm. The arrows highlight the evaluated structures.
Protein analysis of the junctional complex
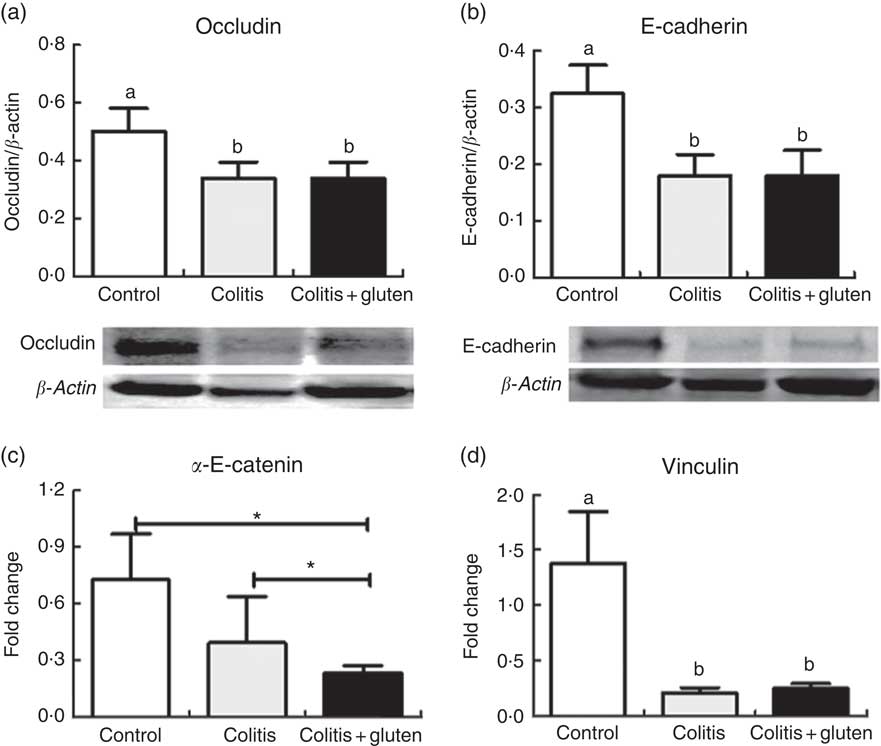
Our next step was to investigate the junctional proteins that could be involved in the changes of adherent junction and desmosome. The occlusion junction protein occludin and the adhesion junction protein E-cadherin were evaluated and were less expressed in both the colitis groups (Fig. 5(a) and (b)). Since the expression of E-cadherin was not responsible for the loosening of the adherent junction, we investigated other adhesion junction-related proteins, such as α-E-catenin and vinculin, by real-time quantitative reverse transcription-PCR. The α-E-catenin gene transcription was reduced in the Col + G group compared with the Col group, and this was compared with control one (Fig. 5(c)). The expression of the vinculin gene was reduced in both the colitis groups (Fig. 5(d)) and was not affected by the occlusion junction protein occludin. The adhesion junction protein E-cadherin was less expressed in both the colitis groups (Fig. 5(b)).
Proteins of the junctional complex. (a) Occludin, (b) E-cadherin, (c) α-E-catenin, (d) vinculin. Occludin and E-cadherin proteins and vinculin gene protein were similar in both colitis groups and were reduced in relation to the control group. α-E-catenin was reduced in both colitis groups in relation to the control group, but was lower in the colitis + gluten group. Western blots (a) and (b); real-time-PCR (c) and (d). Reference value (fold change = 1). Values are means, with their standard errors represented by vertical bars (n = at least 4/group). Test: one-way ANOVA and post-test Newman–Keuls. * P <0·05 using Student’s t tests between control × colitis + gluten and colitis × colitis + gluten groups. a,b Mean values with unlike letters were significantly different (P <0·05).
Immunofluorescence
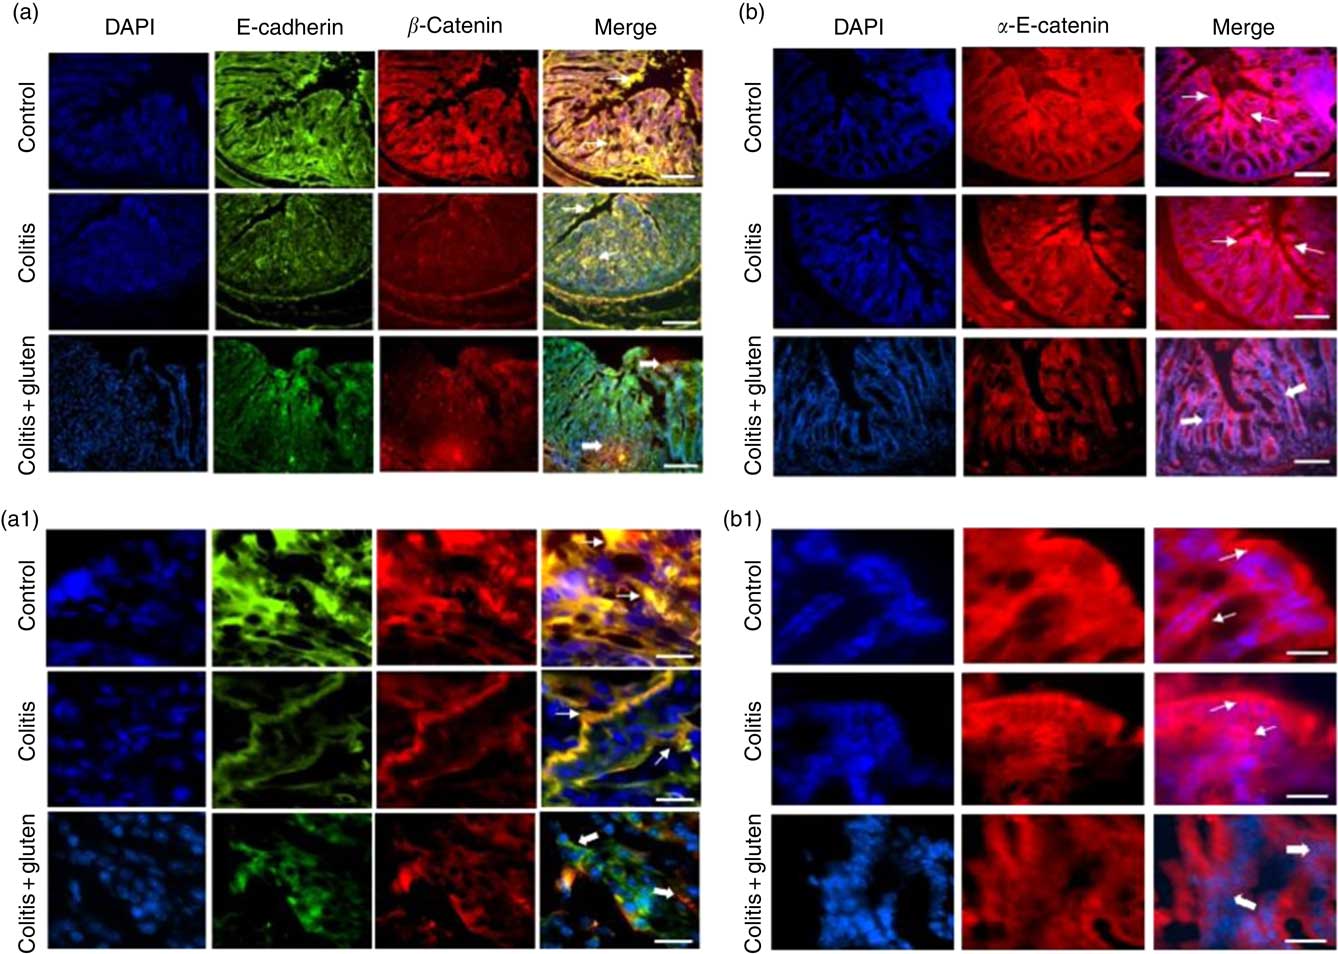
Since the E-cadherin adhesion junction proteins were similarly expressed in both the colitis groups, we investigated whether these proteins might be displaced from their usual location. Furthermore, we analysed the localisation of the E-cadherin, β-catenin and α-E-catenin in the colon epithelium by immunofluorescence. We confirmed the lower expression of the E-cadherin protein and also found lower expression of β-catenin in both the colitis groups. Although the expression of these proteins was similar in both the groups, we found that they are less co-located in the Col + G compared with the Col group (Fig. 6). Furthermore, we observed lower expression of the α-E-catenin protein only in the Col + G group. These data were confirmed by fluorescence intensity analysis (Fig. 7).
Expression of adhesion junction proteins by immunofluorescence: (a, a1) Expression of E-cadherin (green) and β-catenin (in red) in groups. Fine arrows indicate normal co-localisation of proteins in the control and colitis groups and thick arrows indicate loss of the colocalization in the colitis + gluten group. (b, b1) α-E-catenin (in red). Fine arrows indicate the normal protein localisation in control and colitis groups and the thick arrows indicate the decrease in the protein in the colitis + gluten group. In all figures, blue indicates 4′,6-diamidino-2-phenylindole, dihydrochloride (DAPI)-labelled nuclei (number of images = 16–20/group). The bars represent 100 μm (a and b) or 20 μm (a1 and b1) scale.
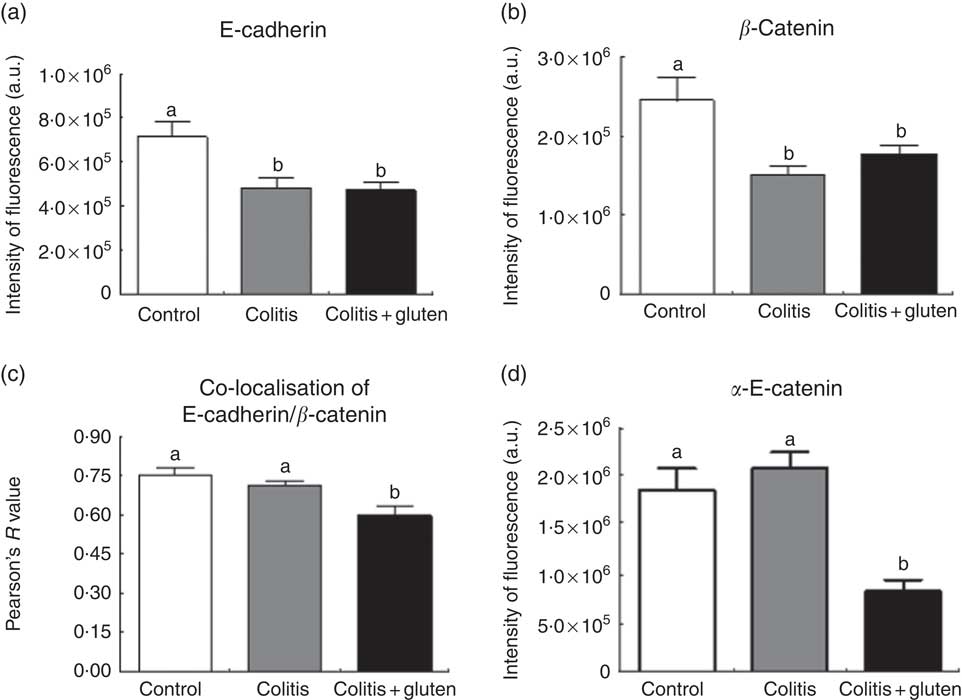
Expression of adhesion junction proteins by immunofluorescence intensity: the fluorescence intensity measurements of E-cadherin (a) and β-catenin (b), their co-localisation (c) and α-E-catenin (d). The expression of E-cadherin and β-catenin proteins was similar in both groups colitis, but they were less co-located in the colitis + gluten compared with the control and colitis groups. There was lower expression of the α-E-catenin protein only in the colitis + gluten group. Values are means, with their standard errors represented by vertical bars (n 5/group). Test: one-way ANOVA and post-test Newman–Keuls. a,b Mean values with unlike letters were significantly different (P <0·05). a.u., Arbitrary units.
Discussion
In this study, we evaluate the effects of gluten as used in food preparations. We did not intend to investigate the effect of gluten peptides and its products of fermentation by intestinal microbiota as well as the presence of ATI in our diet. Here, we aimed to observe the effect of gluten-containing diet in the severity of colitis symptoms rather than in the genesis of this disease. Although some studies have observed some inflammatory effects of gluten in experimental colitis models with ATI( Reference Zevallos, Raker and Tenzer 8 , Reference Bellinghausen, Weigmann and Zevallos 9 ), to our knowledge, this study is a pioneer in assessing the impact of wheat gluten-containing diet and some of its possible mechanisms associated with the morphological and cellular alterations in the colon, demonstrating that its ingestion was able to influence the evolution of UC negatively.
We have demonstrated that gluten-containing diet intensifies DSS-induced colitis, aggravating intestinal inflammation and increasing intestinal permeability and bacterial translocation. These effects were associated with changes in the organisation of adherent junctions and desmosomes as well as with a more intense colonic mucosa damage. This damage was characterised by a reduction in number and length of microvilli, an increase in intracellular digestive vacuoles and alteration of the endosome/lysosome system.
In DSS-induced colitis, visible rectal bleeding is more frequent when DSS is given in higher concentrations (3–10 %), while it is uncommon at lower DSS concentrations, such as used in the present study (1·5 %)( Reference Vieira, Leonel and Sad 21 , Reference Wirtz, Neufert and Weigmann 22 , Reference Yan, Kolachala and Dalmasso 31 – Reference Okayasu, Hatakeyama and Yamada 33 ). We observed that there was shortening of the colon length and worsening of the histopathological score in the animals of both Col groups and, although the intensity of the lesion was similar, the group that received gluten-containing diet (Col + G) had a greater extension of the injury when compared with the exempt group (Col). Both the worsening of the clinical score and the increased extent of colonic mucosal inflammation in the Col + G group may be due to hyperosmolarity or increased intestinal cell permeability caused by colitis in combination with a gluten-containing diet( Reference Shan, Molberg and Parrot 2 , Reference Schwartz, Abolhassani and Pooya 34 ).
Fractions of ATI, potential contaminants of vital gluten during the protein isolation process, may contribute to the severity of inflammatory response by increasing the levels of pro-inflammatory cells and cytokines( Reference Zevallos, Raker and Tenzer 8 ). The presence of peptides generated by the poor digestion of gluten could favour pathogenic bacteria growth, dysbiosis and the consequent disruption of the intestinal barrier; weakening the tight junctions and increasing intestinal permeability( Reference Hawrelak and Myers 4 , Reference de Lorgeril and Salen 5 , Reference Volta, Caio and Tovoli 35 – Reference Tovoli, Masi and Guidetti 38 ). Besides the increase in lipopolysaccharide production by unbalanced microbiota activates several pro-inflammatory pathways contributing to the severity of colitis( Reference Daulatzai 37 ). However, the action of gluten in intestinal microbiota is still controversial and needs to be more explored( Reference Sanz 7 , Reference De Palma, Nadal and Collado 39 ).
Moreover, many of the effects of gluten in the intestinal tract are linked to the presence of gliadin in the intestinal lumen. Gliadin is not completely digested by intestinal enzymes, and its peptides could contribute to the increase in osmolarity and intestinal fermentation. This fact can be accounted for by the aggravation of diarrhoea and rectal bleeding after the introduction of gluten-containing diet.
Gliadin is also related to zonulin release( Reference Fasano, Not and Wang 40 , Reference Drago, El Asmar and Di Pierro 41 ). Previous studies showed that the link of gliadin in its (CXCR3) receptor activates a signalling pathway culminating in zonulin release and weakening the intestinal barrier function. This mechanism is seen mainly in patients with gluten intolerance( Reference Fasano, Not and Wang 40 ). The mechanism with which zonulin increases intestinal permeability seems to be related to the reorganisation of actin filaments and expression of occlusion junction proteins( Reference Drago, El Asmar and Di Pierro 41 , Reference Lammers, Lu and Brownley 42 ). In our study, increased permeability related to gluten intake was mainly related to the adhesion junction rather than occlusion junction when compared with the Col group. It suggests that the occlusion junction is not the primary target of gluten effects and could be the consequence of the inflammatory process itself.
Thus, zonulin increases intestinal permeability by changing the expression of some tight junction proteins, which leads to rupture of the intestinal barrier and passage of immunogenic molecules (including those derived from gliadin) forward systemic circulation( Reference Lammers, Lu and Brownley 42 , Reference Sander, Cummins and Henshall 43 ).
In our study, we observed enlargement of the tight junction space in both colitis groups, which was associated with a lower expression of occludin, as already described in patients with IBD and coeliac disease( Reference Ménard, Cerf-Bensussan and Heyman 44 – Reference Shawki and McCole 47 ). Although tight junctions were similarly enlarged in both the Col groups, gluten-containing diet also caused an adherent junction and desmosomes space in Col + G animals. The main effect of the gluten-containing diet in this junction was alteration in the organisational arrangement of proteins. Adhesion junction proteins E-cadherin and β-catenin were equally expressed in Col and Col + G groups, but immunofluorescence analyses show that they were not co-localised (as expected) in the C and Col groups. Studies have shown that gliadin can alter the function of the epithelial barrier by changing the expression of E-cadherin and occludin( Reference Sander, Cummins and Henshall 43 , Reference Bidmon-Fliegenschnee, Lederhuber and Csaicsich 48 ). Decreased E-cadherin and β-catenin proteins were also observed in patients with IBD and animal models of DSS-induced colitis( Reference Grill, Neumann and Hiltwein 49 , Reference Zhang, Liu and Sun 50 ). We also found that α-E-catenin expression was reduced only in the Col + G group, suggesting that the reduction of this protein is associated with an increase in the distance between the adhesion junctions and the misplaced localisation of E-cadherin and β-catenin found in this group. The α-E-catenin plays a crucial role in E-cadherin-mediated adhesion by binding to β-catenin, actin and vinculin filaments, and its dysfunction is linked to weakening of the adhesion junction of epithelial cells and might be related to a higher degree of inflammation and increased activity of IBD( Reference Vermeulen, Bruyneel and Bracke 51 – Reference Li, Newhall and Ishiyama 53 ). The α-E-catenin protein binds to E-cadherin by β-catenin and binds to vinculin and actin filaments( Reference Thiery and Sleeman 54 ). It suggests that the lower expression of α-E-catenin might have altered the localisation of the E-cadherin and β-catenin proteins and, consequently, caused the weakening of the adhesion junction.
On the other hand, the vinculin gene protein, which binds α-E-catenin and actin filaments, was similarly expressed in the Col + G compared with the Col group, which suggests that the increase in the distance between the adhesion joints should be related primarily to the reduction in α-E-catenin and not to this actin filament-binding protein.
The α-E-catenin protein is also required for desmosome formation and functions in its assembly into epithelial cells( Reference Taniguchi, Miyazaki and Miyashita 55 ). Furthermore, the specific localisation of the plakoglobin complexes probably depends on their ability to bind α-E-catenin( Reference Choi, Estarás and Moresco 56 ). There is also evidence that a weakening of desmosomes occurs due to defects in epidermal polarity and cell proliferation as a direct and specific consequence of the decrease of α-E-catenin( Reference Vasioukhin, Bauer and Degenstein 57 ). In our study, the loosening of desmosomes was also higher in the Col + G group, suggesting that the reduction in α-E-catenin could be related to the desmosome alteration.
When analysing the results of bacterial translocation, we observed that the Col + G group appears to have a translocation profile both by the paracellular pathway (via the hepatic portal system) and by the transcellular route (via mesenteric lymph nodes)( Reference Ménard, Cerf-Bensussan and Heyman 44 , Reference Matte and Pasqualim 58 – Reference Wang, Wang and Saxena 60 ). The same is not observed in the Col group, whose translocation profile seems to have been predominantly paracellular, since there were more bacteria in the blood and not in the organs at times evaluated. In addition, because of the radiation dispersion pattern (greater gastric emptying) observed in the images and because we found more bacteria present in the organs at times analysed, it is possible that the translocation of the bacteria occurred more rapidly in the Col + G group, which may indicate a probable deleterious action of gluten-containing diet in the inflamed colon and a possible explanation for not finding high concentrations of bacteria in blood as in the Col + G group.
The mechanism by which gluten worsens intestinal permeability and increases bacterial translocation in colitis appears to be related to increased transcellular and mainly paracellular transport, especially at the adherent junction and desmosomes. It is known that gliadin may lead to alteration of the occlusion junction by a mechanism related to the release of zonulin and reorganisation of actin filaments( Reference Sander, Cummins and Henshall 43 , Reference Hollon, Puppa and Greenwald 61 ). In coeliac patients, alteration of the mechanisms of paracellular and transcellular transport may be related to gliadin. However, it has been proposed that gliadin should first cross the occlusion junction before being absorbed by the transcellular pathway( Reference Sander, Cummins and Henshall 43 ). In our study, we observed by TEM the increase between the occlusion junctions in both Col groups. However, there was a significant increase in the distance between adhesion joints and desmosomes in the animals of the Col + G group. We believe that the damage imposed at the occlusion junction due to colitis allowed for greater paracellular absorption of bacteria, molecules and fragments of gliadin or gluten peptides, causing fragility of both adhesion junction and desmosomes.
Antigens and bacteria can cross the epithelial barrier through paracellular pathways regulated by occlusion junctions and, alternatively, might pass through the transcellular layer by endocytosis( Reference Zimmermann, Rudloff and Lochnit 62 ). It has been described that, in addition to the effects of immunogenicity, gliadin might induce villous hypotrophy, which would lead to an increase in intracellular molecule trafficking( Reference De Re, Caggiari and Tabuso 63 ). After intracellular absorption, the contents of the endocytic vacuole, which might contain fragments of gliadin or micro-organisms, are degraded by lysosomes and then released as amino acids or degradation products. Our results agree with this study, since the number of vacuoles was higher in the Col + G group, suggesting greater endocytic activity. The lytic activity and formation of lysosomes at a later stage in that group were also suggested by the increase in the diameter of the vesicle of the endosome/lysosome system.
In conclusion, our results show that gluten-containing diet has a deleterious effect on colitis, worsening the clinical score (including the presence of rectal bleeding) and increasing inflammation in the intestinal mucosa. One of the mechanisms by which gluten-containing diet exacerbates colitis appears to be related to changes in adhesion junction and desmosomes, especially α-E-catenin protein. These alterations compromise the localisation and efficiency of E-cadherin, β-catenin and desmosome functions, thus disrupting the junctional complex. Added to this is the greater epithelial damage caused by gluten-containing diet, with alteration of microvilli, a higher number of digestive vacuoles and alteration of the endosome/lysosome system. All these factors contribute to increased intestinal permeability and bacterial translocation, both by the paracellular and by the transcellular pathways.
Therefore, our results show that wheat gluten-containing diet exacerbates the mucosal damage caused by colitis, reducing intestinal barrier function and increasing bacterial translocation. These effects are related to the induction of weakness and disorganisation of adhesion junctions and desmosomes as well as shortening of microvilli and modification of the endocytic vesicle route. Although we have demonstrated that gluten-containing diet intensifies DSS-induced colitis, it is still necessary to better clarify the mechanisms that may directly interfere with colitis worsening, especially in those related to gluten peptides, ATI and intestinal microbiota.
Acknowledgements
The authors would like to acknowledge Maria Helena Alves for animal care, Gleydes Gambogi Parreira for helping in the analysis of images of TEM, all LABiN (Laboratório de Aterosclerose e Bioquímica Nutricional) members for their contributions and assistance, the Centre for Acquisition and Image Processing (https://www2.icb.ufmg.br/capi/) and the Centre of Microscopy at the Universidade Federal de Minas Gerais (http://www.microscopia.ufmg.br) for providing the equipment and technical support for experiments involving electron microscopy.
P. L. R. M. designed and conducted the research, analysed the data and prepared the manuscript. P. C. L. L. and E. C. A. helped in conducting the research. M. E. R. A. and V. N. C. helped in performing intestinal permeability and bacterial translocation experiments. P. C. L. L., J. R. F. and M. T. S. D. helped in performing cytokine ELISA assays and clinical score analysis. D. C. C. helped in conducting the histological analysis. L. F. B. assisted in the analysis of images of TEM. L. S. A. C. assisted in the analysis of images of immunofluorescence. J. I. A.-L. supervised, analysed the data and prepared the manuscript. All authors read and approved the final manuscript.
This study is supported by PRPq (Pro-reitoria de Pesquisa of UFMG), FAPEMIG (Fundação de Amparo à Pesquisa de Minas Gerais), CNPq (Conselho Nacional de Desenvolvimento Científico e Tecnológico) and CAPES (Coordenação de Aperfeiçoamento de Pessoal de Nível Superior – Finance Code 001).
On behalf of all authors, the corresponding author states that there is no conflict of interest.
Supplementary material
For supplementary material/s referred to in this article, please visit https://doi.org/10.1017/S0007114518003422


