


Introduction
While listening comprehension is primarily an internal process of meaning construction, listening assessment requires additional skills, such as reading items or constructing written or oral responses (Buck, Reference Buck2001), which draws on a range of cognitive and linguistic resources beyond listening itself. These additional demands raise questions about how the different test methods used to elicit meaning construction interact with and potentially disrupt the internal processes that support comprehension. In particular, the timing of item presentation, whether items appear while listeners are listening (while-listening performance [WLP]) or only after listening concludes (post-listening performance [PLP]), can shape how attention is allocated during the task (Aryadoust et al., Reference Aryadoust, Foo and Ng2022). While the WLP condition may direct listeners to key segments of the input, it also risks fragmenting attention and encouraging a search for answers rather than fostering the construction of a coherent mental representation of the listening input (Field, Reference Field, Lynda and Weir2012). The cognitive demands of the WLP and PLP conditions may vary depending on the item format. Multiple-choice questions (MCQs) typically contain more textual elements that support recognition, whereas open-ended questions (OEQs) impose greater cognitive demands by requiring test-takers to actively draw on their linguistic resources to reconstruct what they heard in words, phrases, or sentences (Cheng, Reference Cheng2004).
While previous studies have focused on comparing test performance under these test conditions (e.g., Bagheri & Bahadori, Reference Bagheri and Bahadori2014; Cheng, Reference Cheng2004; In’nami & Koizumi, Reference In’nami and Koizumi2009; Koyama et al., Reference Koyama, Sun and Ockey2016; Wagner, Reference Wagner2013), few have investigated cognitive processing under these test conditions (e.g., Aryadoust et al., Reference Aryadoust, Foo and Ng2022; Buck, Reference Buck2001; Field, Reference Field, Lynda and Weir2012). Further study is warranted to examine test-takers’ cognitive processing under these test methods and provide evidence on whether the intended listening processes are elicited (Field, Reference Field, Geranpayeh and Taylor2013; Messick, Reference Messick1995).
The present study addresses this gap by using eye-tracking technology to examine how different test methods, defined by item presentation (WLP vs. PLP) and item format (MCQ vs. OEQ), affect test-takers’ gaze behaviors during an L2 listening assessment while controlling for extraneous variables. By analyzing eye-tracking data, we aim to understand how test methods influence listeners’ interactions with listening input and test items.
Test method effects on test-takers’ cognitive processing
Listening comprehension is a cognitively intensive skill that involves the dynamic integration of bottom-up processing (e.g., phonological and lexical decoding and surface-level comprehension) and top-down processing (e.g., inferencing and discourse construction) (Buck, Reference Buck2001; Field, Reference Field2008). However, listening is rarely assessed in isolation in assessment contexts. The need to assess listening ability through response modes such as reading or writing, combined with specific test method characteristics, can influence how these cognitive processesFootnote 1 are elicited.
Specifically, the WLP condition requires test-takers to process auditory input while simultaneously reading items or constructing their responses. This dual-task condition imposes cognitive demand by taxing working memory to divide attentional resources between modalities (Aryadoust, Reference Aryadoust2020; Field, Reference Field, Lynda and Weir2012; O’Grady, Reference O’Grady2024; Wagner, Reference Wagner2013). In a study comparing test and lecture conditions, Field (Reference Field, Lynda and Weir2012) reported that approximately one-third of the participants perceived the test task (analogous to the WLP condition) as more cognitively challenging than the lecture-summary task (analogous to the PLP condition). In response to the cognitive demand to navigate between the two sources of input, test-takers often prioritize reading the written items over attending to the auditory input, engaging in lexical matching strategies, and focusing on local, item-triggered details rather than constructing a global understanding of the discourse (Field, Reference Field, Lynda and Weir2012; O’Grady, Reference O’Grady2024; Wu, Reference Wu1998). Supporting this, Kho et al. (Reference Kho, Aryadoust and Foo2022) found that participants’ fixations on keywords of items, defined as nouns, verbs, and adjectives, during the WLP condition, significantly predicted test performance. Similarly, Yeager and Meyer (Reference Yeager and Meyer2022) found that test-takers scored higher with “trivial” (detail-focused) test items targeting a subset of local information such as dates and names under the WLP condition due to scanning of answers to the items, whereas they may have filtered this trivial information under PLP. These studies suggest that strategic attention to written prompts under the WLP condition may drive test performance, potentially undermining the construct validity of listening assessments.
The PLP condition, on the other hand, is cognitively challenging because limited or no scaffolding from written text is provided to support selective listening. Field (Reference Field, Lynda and Weir2012) noted that participants often viewed written questions as a useful roadmap for structuring attention during listening, which stands in contrast to the lecture summary condition, wherein listeners were required to identify, organize, and prioritize relevant information without external guidance (Field, Reference Field, Lynda and Weir2012). This challenge is particularly pronounced when the input is densely packed with propositions, making it difficult to distinguish major points from minor ones (Field, Reference Field, Lynda and Weir2012). It should be noted that Field (Reference Field, Lynda and Weir2012) compared the WLP with the PLP condition while simultaneously varying the item formats: MCQs and gap-filling tasks for WLP, in contrast to the summary task for PLP. It remains unclear whether the cognitive challenges reported by participants were attributable solely to item presentation or to a combination of item presentation and item format effects.
To identify the statistical differences in cognitive load between WLP and PLP conditions, Aryadoust et al. (Reference Aryadoust, Foo and Ng2022) combined eye-tracking with neuroimaging techniques. Their results showed that brain regions involved in bottom-up and top-down processing were significantly more activated during the listening phase of the PLP condition than during the WLP condition. Eye-tracking measures further revealed significantly longer total fixation durations, higher fixation counts, and longer total visit durations on written items in the WLP condition than in the PLP answering phase. This may imply that the PLP condition allows more cognitive resources to be devoted to auditory input processing, while the WLP encourages more engagement with written items, potentially undermining the listening construct.
Additionally, the effects of item presentation may be moderated by item format (i.e., MCQs and OEQs). While studies that used gap-filling and MCQs, both of which involve structured written input, tended to identify differences between the WLP and PLP conditions (e.g., Aryadoust et al., Reference Aryadoust, Foo and Ng2022; Field, Reference Field, Lynda and Weir2012), studies that adopted short-answer questions did not (e.g., Buck, Reference Buck1991; Sherman, Reference Sherman1997). For instance, Buck (Reference Buck1991) found no substantial differences in listening processes based on general content recall during interviews, although participants acknowledged searching for specific information related to the question stems while using WLP. Similarly, Sherman (Reference Sherman1997) identified no statistical differences in test-takers’ performance, although participants expressed a preference for WLP due to its guiding function in listening while acknowledging that it could also be distracting. These findings imply that while WLP may support learners by highlighting question-related content, its influence on processing may be less pronounced in constructed-response formats.
This hypothesized attenuated effect of item presentation may be attributed to the distinct characteristics of MCQs and OEQs. While MCQs have long been criticized for encouraging test-specific strategies that may bypass authentic comprehension process (Field, Reference Field, Lynda and Weir2012; Wu, Reference Wu1998), OEQs arguably prompt greater attention to auditory input, as they offer minimal textual elements to guide or scaffold responses. In a direct comparison of these formats, Cheng (Reference Cheng2004) found that MCQs provided external retrieval cues that facilitated recall, whereas OEQs placed greater demands on test-takers’ linguistic and memory resources than MCQs. Although test-takers reported higher confidence in their accuracy rates with MCQs, their success was frequently attributed to test-wise strategies such as guessing and option elimination rather than an understanding of the auditory input (Cheng, Reference Cheng2004). Similar findings were reported in Rukthong’s (Reference Rukthong2021) study, where participants engaged in more inferential and integrative listening under the summary task while adopting more test-wiseness strategies, such as keyword matching, option elimination, and guessing with MCQs. These studies suggest that item format may also influence the depth and authenticity of cognitive processing in listening tests.
It is important to note that previous research suggests that both listener proficiency and material difficulty can be extraneous variables that warrant careful control in the experimental design. Sherman (Reference Sherman1997) found that lower-proficiency participants expressed a greater preference for the WLP over the PLP condition when answering OEQs, possibly due to the perceived support provided by the structured items. In addition to language proficiency, material difficulty may be a moderating factor. Field (Reference Field, Lynda and Weir2012) found that participants perceived the WLP condition to be more manageable when the listening input was relatively simple; however, when the listening passages were propositionally dense and complex, the written items became overwhelming. These findings underscore the importance of controlling for both proficiency level and input difficulty when examining test-takers’ cognitive processing under different test methods.
Typing speed and text length as covariates
In the present study, participants were required to type their notes or responses to OEQs. Therefore, typing speed was included as a covariate to account for individual variations in gaze behaviors that may arise from differences in motor coordination during computer-based test-taking. Research on computer-based writing assessments has consistently shown that keyboarding skills and computer familiarity affect both cognitive processing and test performance (e.g., Barkaoui, Reference Barkaoui2014; Gong et al., Reference Gong, Zhang and Li2022; Horkay et al., Reference Horkay, Bennett, Allen, Kaplan and Yan2006; Russell & Haney, Reference Russell and Haney1997; Wolfe & Manalo, Reference Wolfe and Manalo2005; Yu et al., Reference Yu, He and Isaacs2017). This positive association may reflect that proficient keyboarding skills allow cognitive resources to be freed from the coordination of motor skills to be allocated to higher-order processes, such as idea generation and organization (Gong et al., Reference Gong, Zhang and Li2022).
Moreover, empirical studies have found that less proficient typists tend to shift their gaze more frequently between the screen and keyboard, which may reduce the time spent processing task-relevant on-screen information (Chukharev-Hudilainen et al., Reference Chukharev-Hudilainen, Saricaoglu, Torrance and Feng2019; Papoutsaki et al., Reference Papoutsaki, Gokaslan, Tompkin, He and Huang2018). In contrast, more proficient typists tend to fixate closer to the caret/cursor and allocate more attention to revisiting their constructed texts (Chukharev-Hudilainen et al., Reference Chukharev-Hudilainen, Saricaoglu, Torrance and Feng2019). Translating this into the context of a listening test requiring typed responses or notes, proficient typing skills may allow test-takers to more effectively allocate their cognitive resources toward aligning auditory input with written text, constructing or revisiting notes or responses, or searching for correct options on the screen, as indicated by their increased gaze behaviors.
Another covariate that should be controlled for is word count, because text length (i.e., items, notes, or responses) may shape gaze dynamics. Processing more text, either inherent in the items or produced by test-takers, may require more frequent re-revisiting and more integration or verification with the listening input, which could manifest in increased gaze behaviors (Aryadoust et al., Reference Aryadoust, Foo and Ng2022). Previous eye-tracking research on reading has shown that text length and complexity are positively associated with increased total fixation duration and fixation count, indicating heightened cognitive effort (Brunfaut & McCray, Reference Brunfaut and McCray2015). In Brunfaut and McCray’s (Reference Brunfaut and McCray2015) study on A1-B2 level reading tests, the participants exhibited progressively more gaze behaviors as task difficulty increased. Likewise, previous eye-tracking studies on listening assessment included items or listening test sections as random effects in their linear mixed-effects modeling (LMM) to control for the complexity or length of the material (Holzknecht et al., Reference Holzknecht, McCray, Eberharter, K.emmel, Zehentner, Spiby and Dunlea2021; Kho et al., Reference Kho, Aryadoust and Foo2022; Qiu & Aryadoust, Reference Qiu and Aryadoust2024).
Apart from longer written texts, texts generated by test-takers have been shown to elicit increased eye movements (Hacker et al., Reference Hacker, Keener and Kircher2017). Eye-tracking research in composition settings suggests that complex text output, when writers engage in local and global revision, leads to more fixations and regressions to previously written sections (de Smet et al., Reference de Smet, Leijten and Van Waes2018). For example, when writers slow down their typing in response to spelling corrections or sentence-level reworking, they tend to exhibit longer fixations and more frequent regressions (de Smet et al., Reference de Smet, Leijten and Van Waes2018).
In listening assessment tasks that require typed notes and responses under time constraints, such factors may similarly affect gaze behaviors. Specifically, greater item length or more typed notes and responses may require more cognitive processing, as reflected in increased gaze measures. However, to the best of our knowledge, in the context of listening assessment, few studies have examined the relationship between eye-tracking measures and typing speed and text length.
The present study
The literature review shows that previous research on the varying levels of cognitive demand imposed by test methods has remained inconsistent. Additionally, while previous studies suggest that item presentation (WLP vs. PLP) and item format (MCQs vs. OEQs) may jointly affect test-takers’ cognitive processing, the interaction between these test method variables in listening tasks has yet to be examined. To address these gaps, the present study investigates how item presentation and item format interact to impact test-takers’ cognitive processing, as indexed by eye-tracking measures.
In this study, all written elements of the listening test, including test items and digital notes, were displayed on the computer screen, enabling the eye tracker to capture participants’ processing of the items and notes during both the listening and answering phases in the PLP condition. To control for potential confounding variables, we employed a Graeco-Latin square design to counterbalance participants, task order, and test materials. The listening passages were carefully selected based on linguistic and psychometric features to ensure comparability across the four experimental conditions. In addition, participants’ language and typing proficiency were examined to confirm that there were no significant differences between the groups. Based on the abovementioned research gaps, we propose the following research questions:
RQ1: How do item presentation and item format affect test-takers’ gaze behaviors in listening assessments? Is there a significant interaction effect between item presentation and item format on test-takers’ gaze behaviors?
RQ2: Is there a relationship between test-takers’ gaze behaviors and the length of the text that test-takers read or produce, as well as their keystroking skills (typing proficiency)?
Methodology
Context and participants
After signing the consent forms, 72 learners of English as a foreign language (EFL) with Mandarin as their first language (L1) participated in this study at a university laboratory. The participants were aged between 21 and 39 years (M = 26.58, SD = 3.93), with 21 males (29.2%) and 51 females (70.8%). Their length of stay in English-speaking environments varied from 1 month to 204 months (M = 24.21, SD = 35.00). Most participants were postgraduates, with four undergraduates. The four undergraduates had studied in English-medium programs and were transitioning to postgraduate studies, rendering their listening experiences comparable. A total of 32 participants were enrolled in science, technology, engineering, and mathematics (STEM) disciplines, with the remaining 40 participants coming from non-STEM backgrounds. They scored an average of 6.92 (SD = 1.93) out of 10 in a general reading test and an average of 32.03 (SD = 5.53) out of 40 in a general listening test, indicating intermediate to advanced levels of English proficiency.
Instruments
Keyboarding skill test
A 3-minute online typing test (https://www.typing.com/student/tests) was used to assess the test-takers’ typing speed. The timer started when the participants began typing, and a paragraph appeared on the screen in faintly colored text. The participants superimposed their typing over faintly colored words and were able to monitor their progress via a cursor and blue-colored letters. In this study, errors in capitalization and punctuation were counted. Upon completion of the time limit, the typing speed and accuracy measures were presented on the screen.
The short-talk listening test
For experimental manipulation, four short-talk (monologue) listening testlets were selected from 21 short-talk testlets across 7 forms of the Michigan English Test (MET) listening tests developed by Michigan Language Assessment (hereafter referred to as MLA). These four testlets were selected and adapted for systematic manipulation using the Graeco-Latin square design. The decision was informed by the Mahalanobis distance based on linguistic features and testlet difficulty, as well as the topics of the 21 testlets. The 4 selected short-talk testlets averaged 95 seconds in length (approximately 247 words each). The topics covered in the short-talk listening testlets included a field trip, a short story, a science class, and a sculpture garden, with the first three situated in classroom settings and the last delivered by a tour guide in an outdoor context (see Supplementary Material 1 for the steps taken to identify the four testlets, as well as their psychometric properties and linguistic features).
General listening and reading tests
As reviewed earlier, test-takers’ language proficiency may impact the test method effect. A test form of the MET Listening was administered to measure the participants’ general listening proficiency (Michigan Language Assessment, 2020). The MET listening test is designed to represent the language used in daily life situations and assess test-takers’ ability to understand speech in public, interpersonal, educational, and workplace contexts (Michigan Language Assessment, 2020). The listening section consisted of three parts: (1) 17 short conversations, (2) 5 long conversations, and (3) 3 mini talks. All sections followed a four-option MCQ format, and test items were accessible to participants during listening, while note-taking was not allowed, as per the original MLA format.
Additionally, a reading test was administered to measure and control for the test-takers’ general reading proficiency, as answering the listening test items is partially dependent on the listeners’ reading skills. A sample reading test adapted from the MET sample reading test was administered to measure the test-takers’ general reading ability. The reading test consisted of two passages, each with five MCQs, in which Passage 1 discussed a new type of health care service and Passage 2 discussed the evolution of language. The linguistic complexity of the two passages was examined, and overall, the two texts were similar in their linguistic features and within the range typical for academic or formal texts (Cutts, Reference Cutts2020; Richards, Reference Richards1987; Zamanian & Heydari, Reference Zamanian and Heydari2012). Supplementary Material 2 presents the linguistic complexity metrics and Supplementary Material 3 presents the test validation of the general listening and reading tests.
Experiment setup and data collection procedures
Eye movements were recorded using a Tobii Pro X3-120 screen-based eye tracker operating in binocular mode at a sampling rate of 120 Hz (binocular accuracy 0.4°, binocular precision 0.24) (Tobii AB, 2019). Without a chinrest to stabilize the participants’ heads, the eye tracker’s large head-movement box accommodates participant mobility during recording while ensuring accuracy and precision (Tobii AB, 2019), thus aligning with the imperative for ecological validity in the research. The eye tracker was affixed to a secondary 23-inch desktop monitor with a resolution of 1920 × 1080 pixels. The eye tracker and monitor were linked to a high-performance primary laptop. The primary laptop, running Tobii Pro Lab Version 1.207 (Tobii Pro AB, 2022), was used to monitor and record participants’ eye movements. To avoid overloading the primary laptop, a secondary laptop was used to play audio files of the listening tests through a video conferencing omnidirectional desktop speaker.
Data were collected in two sessions, with a minimum of a one-day interval. Each session involved approximately one hour of tasks for each participant. In Session 1, after signing the consent form, the participants completed computer-based demographic questionnaires. Participants first completed the 3-minute typing test, after which their typing speed and accuracy were automatically calculated and displayed on the screen for recording purposes.
The participants then moved on to the short-talk listening test. As each of the four testlets was administered under a distinct test method, the data collection followed the same procedures for each testlet, including:
-
(1) Test method instructions. The participants read the instructions to understand the test task.
-
(2) Test method practices. This was to ensure that the participants were clear about what to do under the test method and to familiarize them with the test page interface.
-
(3) Eye tracker calibration. A nine-point eye-tracker calibration was performed before each test. Participants were instructed to maintain a distance of 60–65 cm from the screen and refrain from large movements during recording.
-
(4) Formal short-talk listening tests. The audio input began with a one-sentence direction that provided a brief description of the talk’s context (6–10 seconds). Participants completed a short-talk listening testlet, during which their gaze behaviors were recorded. Participants were told to take their own pace in submitting the answers and were given a 6-minute time limit for each short-talk listening testlet.
The Graeco-Latin square design was used to control three blocking factors (Richardson, Reference Richardson2018): participants, order of testlets, and the talk (input and test items). Using the Graeco-Latin square design, each of the four talks was administered in one of the four test conditions in varied sequences, as illustrated in Figure 1. For example, in Group 1, Testlet 1 was administered in WLP and MCQ using Talk 1’s script and its original MCQ items; Testlet 2 was administered in WLP and OEQ using Talk 2’s script and the stems of its original MCQ items; Testlet 3 was administered in PLP and MCQ using Talk 3’s script and its original MCQ items; and Testlet 4 was administered in PLP and OEQ using Talk 4’s script and the stems of its original MCQ items.
A visualization of the research design.
Note. “Talk” refers to the script and original items of the Michigan English Test listening sections, whereas “Testlet” refers to the listening testlet adapted for use in the experiment.

Figure 1. Long description
The diagram is organized into three main horizontal sections.
Top Section: Session 1 Experimental study. A horizontal sequence of boxes connected by arrows shows the progression from Demographic information to Typing test, then Short-talk listening test, ending at End of Session 1.
Middle Section: Experimental Matrix. A table shows four groups (Group 1 to Group 4) and their rotation through four test conditions. The conditions are combinations of W L P or P L P with M C Q or O E Q.
* Group 1: W L P plus M C Q (Talk 1), W L P plus O E Q (Talk 2), P L P plus M C Q (Talk 3), P L P plus O E Q (Talk 4).
* Group 2: W L P plus O E Q (Talk 4), P L P plus M C Q (Talk 3), P L P plus O E Q (Talk 2), W L P plus M C Q (Talk 1).
* Group 3: P L P plus M C Q (Talk 2), P L P plus O E Q (Talk 1), W L P plus M C Q (Talk 4), W L P plus O E Q (Talk 3).
* Group 4: P L P plus O E Q (Talk 3), W L P plus M C Q (Talk 4), W L P plus O E Q (Talk 1), P L P plus M C Q (Talk 2).
Below the matrix, four boxes labeled Testlet 1 through Testlet 4 align with the columns. A sub-flowchart indicates that for all four testlets, the procedure follows: Direction, Practice, Calibration, and Test.
Bottom Section: Session 2 Baseline assessment. A horizontal sequence shows General listening test followed by General reading test, ending at End of Session 2.
In Session 2, the participants took the general listening test, followed by the general reading test (see Figure 1 for a visual representation of the research design). All language tests were presented on Google Sheets using the Arial font size 12.
Data processing
Eye-tracking measures
After analyzing the gaze plots and heat maps (Tobii Pro, 2015), we observed that in the WLP conditions, the stem, options for MCQs, or response boxes for OEQ constituted the main focus of attention, while in PLP conditions, the note area comprised another AOI. The AOIs were delineated accordingly (see Figure 2 for a visualization of the AOIs).
A visualization of AOIs for four test conditions.
Note. MCQ = multiple-choice question; OEQ = open-ended question; PLP = post-listening performance; WLP = while-listening performance. The actual items were replaced with Sample Test 1001 provided on the Michigan English Test official website for confidentiality.

Figure 2. Long description
The six panels illustrate different configurations of A O I s on a computer screen interface.
* Top-Left Panel: W L P plus M C Q A O I s. Shows a vertical stack of eight horizontal rectangular A O I s in alternating colors (red, green, blue, yellow) covering multiple-choice questions and options.
* Top-Middle Panel: P L P plus M C Q (Listening Phase) A O I. Features a single large purple rectangular A O I centered on the screen.
* Top-Right Panel: P L P plus M C Q (Answering Phase) A O I s. Displays a split screen with a vertical stack of colored A O I s on the left for questions and a large pink rectangular A O I on the right.
* Bottom-Left Panel: W L P plus O E Q A O I s. Shows four large horizontal rectangular A O I s in green, blue, and pink, covering open-ended questions.
* Bottom-Middle Panel: P L P plus O E Q (Listening Phase) A O I. Features a single large yellow rectangular A O I centered on the screen.
* Bottom-Right Panel: P L P plus O E Q (Answering Phase) A O I s. Displays a split screen with four colored rectangular A O I s on the left and a large blue rectangular A O I on the right.
Each A O I contains technical labels such as W L P, M C Q, P L P, and O E Q followed by numerical identifiers.
In the analysis, each stem and its corresponding options/response box were treated as separate AOIs rather than the entire question area (comprising all stems and options/response boxes) being treated as a single AOI. This distinction was made based on gaze plot observations, which indicated that participants’ attention shifted between different stems and options/response boxes. Thus, separating these AOIs allowed for partitioning the observed variance in gaze behavior across them and for a more precise measurement of eye movements.
A uniform approach was adopted to define the AOIs to enhance comparability between OEQs and MCQs. Additionally, to ensure that attention allocation was measured under comparable parameters across various test conditions, the AOIs were standardized in terms of placement, height, and width using Google Sheets.
Following AOI delineation, the Tobii I-VT fixation filter was used to process the eye-tracking data, with a window size of three samples for noise reduction, a minimum fixation duration of 60 ms, and a velocity threshold of 30°/s (Tobii Pro AB, 2021). Four key eye-tracking measures were extracted for each AOI across the four test conditions: (1) total fixation duration, (2) fixation count, (3) total visit duration, and (4) visit count. Total fixation duration refers to the total time spent fixating on an AOI and is commonly treated as an indicator of how deeply test-takers process the information in that area (i.e., depth of processing). In the listening and reading test contexts, it reflects the cognitive effort invested when they match auditory input with written items, take notes, or formulate responses (Bax, Reference Bax2013; Kho et al., Reference Kho, Aryadoust and Foo2022; Winke & Lim, Reference Winke and Lim2014). The fixation count refers to the total number of fixations within an AOI (Hu & Aryadoust, 2024). A higher number of fixations typically signals more frequent shifts in attention and repeated processing attempts directed at the area (Bax, Reference Bax2013; Suvorov, Reference Suvorov2015; Winke & Lim, Reference Winke and Lim2014). In contrast, while fixation measures capture relatively stationary gaze behaviors on an AOI, visit measures encompass both fixations and saccades (Hessels et al., Reference Hessels, Niehorster, Nyström, Andersson and Hooge2018). Total visit duration refers to the total time of fixations and time between fixations (saccades within the AOI) and is used as a proxy for the total time test-takers spend reading, scanning, and rechecking items, options, responses, and notes (Holzknecht et al., Reference Holzknecht, McCray, Eberharter, K.emmel, Zehentner, Spiby and Dunlea2021; Hu & Aryadoust, 2024). The visit count refers to the number of times a participant’s gaze enters an AOI and reflects the navigation of attention among AOIs as it shows how test-takers’ gaze moves between and within AOIs, including transitions between items, between stems and response options, and between notes and items (Kwon & Yu, Reference Kwon and Yu2024; Suvorov, Reference Suvorov2015).
Given the variability in the time intervals of the eye-tracking data arising from the inherent differences in test methods and participants’ submission times, the measures were normalized by dividing each eye-tracking measure by the corresponding duration of the interval (Holmqvist et al., Reference Holmqvist, Nyström, Andersson, Dewhurst, Jarodzka and Van de Weijer2011).
Word count
The word count on the short-talk listening testlet pages for each testlet, which participants viewed while taking the test, was computed to examine its impact on participants’ gaze behavior. We counted the number of words either embedded in the item prompts (i.e., MCQs and OEQs) or produced by test-takers (i.e., notes and answers to OEQs) that appeared in the AOIs (see Figure 2).
Statistical analysis
Examining differences in test-takers’ language and typing proficiencies
Participants’ general listening proficiency, general reading proficiency, and typing speed were measured and compared using a one-way ANOVA using Jamovi, Version 2.3.28.0 (The Jamovi project, 2024) to identify any significant differences among the four groups of participants. This was done to reduce the influence of potential extraneous variables stemming from individual differences, thereby enhancing confidence in attributing the results of the subsequent linear mixed-effects modeling estimation to the independent variables of interest in this study. The assumptions of normality of the residuals and homogeneity were examined, and the F-value, p-value (where applicable), and descriptive statistics were reported.
Linear mixed-effects modeling
Using the R package lme4 (Bates et al., Reference Bates, Mächler, Bolker and Walker2015) in RStudio 4.3.2 (R Core Team, 2023), four linear mixed-effects modeling (LMM) analyses were performed on the four eye-tracking measures. For each of the four LMM analyses, we conducted model selection, model diagnostics, and model interpretation (Brown, Reference Brown2021; Gries, Reference Gries2021b; Winter, Reference Winter2019).
Model selection. For model selection, we adopted the strategy of the “best” random-effects structure and then the “best” fixed-effects structure (Gries, Reference Gries2021a). To obtain the best random-effects structure, we followed the principle of “keeping it maximal” (Barr et al., Reference Barr, Levy, Scheepers and Tily2013) when establishing the initial model. The initial maximal model incorporated the fixed effects of item presentation, item format, their interaction, and the covariate variables of typing speed and word count. The random-effects structure then included a random intercept and random slopes for participants and talks.
Specifically, before model fitting, all continuous variables were scaled to facilitate model interpretation, convergence, and effect size comparison (Winter, Reference Winter2014). To identify the “best” random-effects structure, we adopted a backward stepwise approach to simplify the model until it converged (Gries, Reference Gries2021b), adding an optimizer called “bobyqa” (Bates et al., Reference Bates, Mächler, Bolker and Walker2015; Brown, Reference Brown2021). Variables with (near-)perfect correlation or that contributed the least to the variance were deleted one at a time, as they indicated redundancy or overfitting of the model to the data (Bates et al., Reference Bates, Mächler, Bolker and Walker2015). We adopted the maximum likelihood (ML) estimation for model comparisons. Each updated model was compared with the prior model using the likelihood ratio test with a traditional threshold of p = .05 (Gries, Reference Gries2021b). Additionally, the Akaike Information Criterion (AIC) and Bayesian Information Criterion (BIC) were compared, and a converged model with lower AIC and BIC values was selected as the better-fitting model. For all four eye-tracking measures, the models converged before the fixed effects were trimmed. Once we arrived at the best-fitting model, we refitted the model with the restricted ML (REML) estimation to determine the parameters for the final model, as REML helps avoid the inflation of Type I error (Gries, Reference Gries2021b).
Model diagnostics. The normality of the residuals, multicollinearity, and influential data points of the best-fitting model were examined for model diagnostics (Aryadoust & Jia, Reference Aryadoust and Jia2026; Gries, Reference Gries2021a; Winter, Reference Winter2013). To examine the normality of the model residuals, we examined the Q-Q plot and histogram, along with the Kolmogorov-Smirnov (K-S) test. Multicollinearity indicates the presence of highly correlated variables, which can inflate the variance of the coefficient estimates and lead to a less reliable interpretation (Shrestha, Reference Shrestha2020). The vif() function was used to estimate the VIF, with a VIF higher than 5 or 10 indicating the presence of strong multicollinearity (Gries, Reference Gries2021a; Shrestha, Reference Shrestha2020). Influential data points were examined using Cook’s distance with the influence.ME package (Nieuwenhuis et al., Reference Nieuwenhuis, Te Grotenhuis and Pelzer2012). R uses 0.5 and 1 as guide cutoffs for potential influential data points and highly likely influence data points, respectively (Rummerfield & Berman, Reference Rummerfield and Berman2017; Werth, Reference Werth2024).
Model interpretation. To examine the overall model quality, the final model was compared with the null model (final model without fixed effects) to check for model significance. Additionally, marginal R 2 coefficients (the proportion of variance explained by the fixed effects) and conditional R 2 coefficients (the proportion of total variance explained by both fixed and random effects) were examined (Nakagawa & Schielzeth, Reference Nakagawa and Schielzeth2013).
Next, the main and interaction effects of the test methods were examined using likelihood ratio tests (LRTs) with the mixed() function in the afex package (Singmann et al., Reference Singmann, Bolker, Westfall, Aust, Ben-Shachar, Højsgaard, Fox, Lawrence, Mertens, Love, Lenth and Christensen2024), and a formatted model summary was generated using the sjPlot package (Lüdecke et al., Reference Lüdecke, Bartel, Schwemmer, Powell, Djalovski and Titz2025). Information on all fixed effects (coefficients, standard errors, 95% confidence intervals, test statistics, and p-values) and random effects (intraclass correlation coefficient (ICC)Footnote 2) was reported. The ICC was used to assess the proportion of the total variance in the dependent variable attributable to the random effects in the model (Nakagawa et al., Reference Nakagawa, Johnson and Schielzeth2017). An ICC coefficient falls between 0 and 1, with a higher ICC indicating a greater proportion of variance contributed by random effects, which indicates the significance of considering both fixed and random effects in the modeling process (Nakagawa et al., Reference Nakagawa, Johnson and Schielzeth2017).
Results
Language and typing proficiency across four groups
Table 1 presents three separate one-way ANOVAs conducted to investigate potential group differences in (1) general reading proficiency, (2) general listening proficiency, and (3) typing speed. For general reading proficiency, the normality assumption for the residuals was met (skewness = –.83, kurtosis = .62), and the four groups were homogeneous (p = .170). ANOVA revealed no significant differences among the four groups (F(3, 68) = 1.10, p = .356). Similar to the general proficiency test, the analysis of general listening proficiency indicated no violation of the normality of residuals (skewness = –1.30, kurtosis = 1.69) and homogeneity of variance (p = .565). The ANOVA did not yield statistically significant differences between the four groups (F(3, 68) = 0.31, p = .817). Regarding typing speed, the assumption of normality (skewness = .23, kurtosis = –.39) and equal variance were met (p = .561). No significant differences were observed among the four groups (F(3, 68) = 1.17, p = .328). Please refer to Supplementary Material 4 for the descriptive statistics of the language and typing proficiencies of the four groups.
ANOVA Results of the Four Groups’ Language and Typing Proficiencies

Table 1. Long description
The table consists of five columns: Variable, Skewness, Kurtosis, Levene's test, and A N O V A result. There are three rows of data corresponding to different variables.
* Row 1: Variable G R P (general reading proficiency). Skewness is minus .83. Kurtosis is .62. Levene's test p equals .170. A N O V A result F(3, 68) equals 1.10, p equals .356.
* Row 2: Variable G L P (general listening proficiency). Skewness is minus 1.30. Kurtosis is 1.69. Levene's test p equals .565. A N O V A result F(3, 68) equals 0.31, p equals .817.
* Row 3: Variable T S (typing speed). Skewness is 0.23. Kurtosis is minus .39. Levene's test p equals .561. A N O V A result F(3, 68) equals 1.17, p equals .328.
Note. GLP = general listening proficiency; GRP = general reading proficiency; TS = typing speed
Linear mixed-effects modeling of eye-tracking measures
Fixed effects: the effect of test method, word count, and typing speed on gaze behaviors
Figure 3 presents the mean scores for the eye-tracking measures across both testlets and specific AOIs, including stems, options (for MCQs), responses (for OEQs), and notes during the listening and answering phases of the PLP conditions. Participants exhibited significantly longer and more frequent fixations and visits to the options than to the stems with large effect sizes, and those measures were significantly higher on the responses compared to the stems with small-to-medium effect sizes. In the PLP conditions, while fixation and visit measures for note-taking during the listening phase were comparable across item formats (p > .05), these measures for reference to notes during the answering phase were generally higher for OEQs than for MCQs, with small to medium effect sizes (p < .001). During the answering phase of the PLP conditions, participants’ eye-tracking measures were highest for options (for MCQs) or responses (for OEQs), followed by stems and notes (p < .001). In both the WLP and PLP conditions, participants showed longer and more frequent fixations and visits to MCQ options than to OEQ responsesFootnote 3 (p < .001) (see Supplementary Material 5 for further descriptives and inferential statistics for AOI comparisons).
Mean of the eye-tracking measures for testlets and AOIs across conditions.

Figure 3. Long description
A multi-panel figure containing 16 bar charts arranged in a 4 by 4 grid. The charts compare eye-tracking measures across four conditions: W L P plus M C Q, P L P plus M C Q, W L P plus O E Q, and P L P plus O E Q.
Rows 1 and 2 display Total fixation duration in seconds and Fixation count. Rows 3 and 4 display Total visit duration in seconds and Visit count.
Columns 1 and 3 represent W L P (while-listening performance). Columns 2 and 4 represent P L P (post-listening performance).
Key findings across the charts:
- Testlet (blue bar) consistently shows the highest values across all metrics, ranging from 22.86 to 158.34.
- In P L P conditions, the Testlet category is split into Note (listening) in light blue and Note (answering) in red. Note (listening) values are high (e.g., 80.27 fixation count), while Note (answering) values are the lowest in the set (e.g., 1.75 to 9.62).
- Stem (green bar) shows moderate engagement, typically lower than Testlet and Option/Response.
- Option (orange bar, used for M C Q) and Response (purple bar, used for O E Q) show higher engagement in M C Q conditions compared to O E Q conditions. For example, in W L P fixation count, Option is 121.48 while Response is 61.86.
The legend at the bottom identifies the A O I (Areas of Interest): Testlet (dark blue), Stem (green), Option (orange), Note listening (light blue), Response (purple), and Note answering (red).
LMMs were fitted for each of the four eye-tracking measures. Details of the model selection and diagnostics are provided in Supplementary Material 6. The main and interaction effects were investigated using the mixed() function. A significant main effect of item presentation was observed across all four eye-tracking measures: total fixation duration (F(1, 113.49) = 32.69, p < .001), fixation count (F(1, 117.6) = 94.67, p < .001), total visit duration (F(1, 112.66) = 21.45, p < .001), and visit count (F(1, 227.31) = 145.65, p < .001). Regarding item format, a significant difference was observed in the fixation count (F(1, 220.87) = 30.84, p < .001) and a marginally significant difference in the visit count (F(1, 207.15) = 3.56, p = .061). In contrast, no significant main effects were identified for total fixation duration (F(1, 193.43) = 0.26, p = .611) and total visit duration (F(1, 192.37) = 2.17, p = .143). Importantly, an interaction effect between item presentation and item format was found for all four eye-tracking measures: total fixation duration (F(1, 71.87) = 26.42, p < .001), fixation count (F(1, 143.21) = 50.07, p < .001), total visit duration (F(1, 71.47) = 20.45, p < .001), and visit count (F(1, 210.70) = 14.41, p < .001).
Given the significant interaction effects across all four eye-tracking measures, the coefficient estimates are reported to illustrate the direction and magnitude of the effects relative to the reference condition. Table 2 summarizes the LMM results for the four eye-tracking measures, with WLP + MCQ serving as the reference condition (intercept). Negative coefficients indicate lower values relative to the baseline, whereas positive coefficients indicate higher values. The interaction terms indicate how the effect of item presentation varies by item format.
Summary of the Fixed and Random Effects for the Eye-tracking Measures (with WLP + MCQ Condition as the Reference Level)

Table 2. Long description
The table presents results for four eye-tracking measures using Linear Mixed Models L M M. The columns are Final L M M models, Fixed effects, Estimate, S E, t, p, Random effects, I C C, and Marginal R super 2 (Conditional R super 2).
1. Total fixation duration (T F D): The model is T F D ~ I P * I F + W C + T S + (1 + I P + I F | I D). Significant fixed effects include Intercept (29.58), I P [P L P] (-7.64), I F [O E Q] (-3.11), W C (1.98), T S (2.86), and the interaction I P [P L P] : I F [O E Q] (5.13). Random effects include sigma squared (17.64) and tau 00 I D (79.84). I C C is .80. R super 2 is .185 (.836).
2. Fixation count (F C): The model is F C ~ I P * I F + W C + T S + (1 + I P | I D). Significant fixed effects include Intercept (157.01), I P [P L P] (-50), I F [O E Q] (-40.81), T S (8.71), and the interaction (34.32). W C is not significant (p = .132). Random effects include sigma squared (418.07) and tau 00 I D (693.29). I C C is .59. R super 2 is .374 (.742).
3. Total visit duration (T V D): The model is T V D ~ I P * I F + W C + T S + (1 + I P + I F | I D). Significant fixed effects include Intercept (42.21), I P [P L P] (-7.01), W C (4.51), and the interaction (4.93). I F [O E Q] and T S are not significant. Random effects include sigma squared (21.02) and tau 00 I D (35.77). I C C is .67. R super 2 is .212 (.744).
4. Visit count (V C): The model is V C ~ I P * I F + W C + T S + (1 | I D) + (1 | Talk). All fixed effects are significant: Intercept (44.62), I P [P L P] (-18.21), I F [O E Q] (-6.66), W C (-3.46), T S (2.55), and the interaction (7.01). Random effects include sigma squared (60.49) and tau 00 I D (30.99). I C C is .35. R super 2 is .480 (.664).
Note. The reference level is the WLP + MCQ condition; CI = confidence interval; FC = fixation count; ICC = intraclass correlation; IF = item format; IP = item presentation; OEQ = open-ended question; PLP = post-listening performance; SE = standard error; TFD = total fixation duration; TS = typing speed; TVD = total visit duration; VC = visit count; WC = word count. The bold text was used to signal significant results.
For the total fixation duration, a significant main effectFootnote 4 of item presentation was observed, indicating that the total fixation duration was significantly lower for the PLP than for the WLP (β = –7.64, SE = .99, t = –7.76, p < .001). A significant main effect of item format was also found, indicating that OEQ items elicited shorter total fixation durations than MCQ items (β = –3.11, SE = 1.22, t = –2.54, p = .012). The interaction between item presentation and item format was also significant (β = 5.13, SE = 1.00, t = 5.14, p < .001), suggesting that the effect of item presentation on the total fixation duration differed by item format, with the reduction from WLP to PLP being 5.13 units smaller for OEQs than for MCQs.
Regarding the fixation count, there was a significant main effect of item presentation, with PLP items yielding significantly fewer fixations than WLP items (β = –50, SE = 4.02, t = –12.43, p < .001). A significant main effect of item format was also found, indicating that OEQ items elicited fewer fixations than MCQ items (β = –40.81, SE = 5.09, t = –8.02, p < .001). The interaction between item presentation and item format was statistically significant (β = 34.32, SE = 4.85, t = 7.08, p < .001), indicating that the reduction in fixation count for PLP relative to WLP was 34.32 units less pronounced for OEQ items than for MCQ items.
For the total visit duration, the model revealed a significant main effect of item presentation, with PLP items eliciting a shorter total visit duration than WLP items under the MCQ format (β = –7.01, SE = 1.09, t = –6.45, p < .001). However, the main effect of item format was not significant (β = –.78, SE = 1.32, t = –.59, p = .559). A significant interaction was observed between item presentation and item format (β = 4.93, SE = 1.09, t = 4.52, p < .001), suggesting that the reduction in total visit duration for PLP items was attenuated by 4.93 units in the OEQ condition compared to the MCQ condition.
Finally, regarding the visit count, there was a significant main effect of item presentation, with PLP items resulting in fewer visits than WLP items (β = –18.21, SE = 1.47, t = –12.38, p < .001). A significant main effect of item format was also observed, with OEQ items producing fewer visits than MCQ items (β = –6.66, SE = 1.99, t = –3.35, p = .001). The interaction between item presentation and item format was statistically significant (β = 7.01, SE = 1.85, t = 3.80, p < .001), indicating that the reduction in visit count for PLP compared to WLP was moderated by item format, such that the negative effect of PLP was attenuated by 7.01 units in the OEQ condition (see Figure 4 for a visualization of test method effects).
Eye-tracking measures by item presentation and item format.

Figure 4. Long description
The figure consists of four panels arranged in a two-by-two grid. Each panel has a horizontal X-axis labeled Item Presentation with two points: W L P and P L P. Each panel is split vertically into two sections: I F equals M C Q on the left and I F equals O E Q on the right. Data points include vertical error bars.
* Top-left panel: Total Fixation Duration in seconds. For M C Q, the duration drops sharply from approximately 29.5 at W L P to 22 at P L P. For O E Q, the duration drops from approximately 26.5 at W L P to 24 at P L P.
* Top-right panel: Fixation Count. For M C Q, the count drops from approximately 157 at W L P to 107 at P L P. For O E Q, the count drops from approximately 116 at W L P to 100 at P L P.
* Bottom-left panel: Total Visit Duration in seconds. For M C Q, the duration drops from approximately 42 at W L P to 35 at P L P. For O E Q, the duration drops from approximately 41.5 at W L P to 39.5 at P L P.
* Bottom-right panel: Visit Count. For M C Q, the count drops from approximately 44.5 at W L P to 26.5 at P L P. For O E Q, the count drops from approximately 38 at W L P to 27 at P L P.
Legend at the bottom defines M C Q as multiple-choice question, O E Q as open-ended question, W L P as while-listening performance, and P L P as post-listening performance.
Regarding the two covariate variables, as presented in Table 2, a higher word count was associated with a longer total fixation duration (β = 1.98, SE = 0.63, t = 3.15, p = .002), longer total visit duration (β = 4.51, SE = 0.68, t = 6.59, p <.001), and fewer visits (β = –3.46, SE = 1.02, t = –3.40, p = .001). However, word count was not associated with fixation count (β = 3.87, SE = 2.56, t = 1.51, p = .132).
A higher typing speed was significantly associated with a longer total fixation duration (β = 2.86, SE = 0.97, t = 2.94, p = .004), more fixation counts (β = 8.71, SE = 3.10, t = 2.81, p = .005), and more visits (β = 2.55, SE = 0.83, t = 3.07, p = .002). However, typing speed was not a significant predictor of total visit duration (β = 0.83, SE = 0.73, t = 1.13, p = .262) (Figure 5).
Effects of word count and typing speed on eye-tracking measures.

Figure 5. Long description
The figure consists of four rows of two panels each. Each panel contains a linear regression line with a shaded confidence interval and a rug plot along the x-axis representing data density.
Row 1: Total Fixation Duration (s). The left panel shows a positive linear increase from approximately 22 to 32 seconds as Word Count increases from -2 to 3. The right panel shows a positive linear increase from 20 to 31 seconds as Typing Speed increases from -2 to 2.
Row 2: Fixation Count. The left panel shows a positive linear increase from 112 to 132 as Word Count increases. The right panel shows a positive linear increase from 103 to 138 as Typing Speed increases.
Row 3: Total Visit Duration (s). The left panel shows a steep positive linear increase from 30 to 53 seconds as Word Count increases. The right panel shows a shallow positive linear increase from 38 to 41 seconds as Typing Speed increases.
Row 4: Visit Count. The left panel shows a negative linear trend, decreasing from 41 to 23 as Word Count increases. The right panel shows a positive linear increase from 29 to 39 as Typing Speed increases.
Random effects
As shown in Table 2, the models demonstrated substantial explanatory power, with the conditional R 2 (reflecting both fixed and random effects) being .836, .742, .744, and .664 for total fixation duration, fixation count, total visit duration, and visit count, respectively. The corresponding marginal R 2 (reflecting fixed effects only) were .185, .374, .212, and .480. The ICCs of the models were .80, .59, .67, and .35 for total fixation duration, fixation count, total visit duration, and visit count, respectively, suggesting the contribution of random effects to the total variance in the eye-tracking measures. Overall, most of the variance in the random effects was attributed to participants, with talk included as a random intercept only for visit count. Across the models, random intercepts explained more variance than random slopes. The correlation between random intercepts and slopes for participants was moderately negative, suggesting that participants with higher overall eye-tracking measures tended to show weaker effects of item presentation and item format.
Discussion
Research question 1: Effects of Item Presentation and Format on Gaze Behaviors
The first research question examined the effects of test methods on test-takers’ gaze behavior. As hypothesized, item presentation significantly affected gaze behaviors, with an interaction between item presentation and item format observed across all four eye-tracking measures (p < .001). Specifically, under MCQs, all four metrics, including total fixation duration, fixation count, total visit duration, and visit count, showed significant decreases from the WLP to the PLP condition (p < .001). In contrast, under OEQs, the differences were less pronounced: while fixation counts and visit counts were significantly higher under the WLP condition (p = .001 and p < .001, respectively), total fixation durations and total visit durations were not (p = .084 and p = .278, respectively).
The significant decrease in gaze measures from the WLP to the PLP condition is consistent with previous findings (e.g., Aryadoust et al., Reference Aryadoust, Foo and Ng2022; Field, Reference Field, Lynda and Weir2012; O’Grady, Reference O’Grady2024) and can be attributed to the heightened cognitive demands associated with dual-modality processing in WLP tasks (Mayer & Moreno, Reference Mayer and Moreno2003; Sweller, Reference Sweller, Mestre and Rose2011). Specifically, the higher fixation durations and fixation counts under the WLP + MCQ condition suggest that test-takers were effortfully aligning the auditory input with the written options. This pattern parallels that of Holzknecht et al. (Reference Holzknecht, McCray, Eberharter, K.emmel, Zehentner, Spiby and Dunlea2021), who reported a decline in attentional allocation from the first to the last MCQ options. The present findings reflect the increased cognitive effort required to manage competing written stimuli while processing auditory inputs in real time. Such dual-modality demands may encourage test-takers to prioritize written information over auditory input (O’Grady, Reference O’Grady2024), thereby reducing listening to fragmentary processing, with the keyword matching strategy used for scoring a point rather than developing a global understanding of the discourse (Field, Reference Field, Lynda and Weir2012; Kho et al., Reference Kho, Aryadoust and Foo2022). This suggests that part of the cognitive demand observed in the WLP + MCQ condition stems from engagement with the written items rather than from processing auditory input. This can undermine the test’s cognitive validity (Field, Reference Field, Geranpayeh and Taylor2013), as tasks intended to measure listening ability should primarily elicit comprehension of auditory input rather than depend heavily on test-takers’ interaction with written elements.
The higher total visit durations and visit counts suggest that participants may have used the questions and options as a listening guide, a strategy that is well documented in the literature (Field, Reference Field, Lynda and Weir2012; Li et al., Reference Li, Chen, Wu, Kuo, Tseng, Tsai and Shih2017; O’Grady, Reference O’Grady2024). The higher total visit duration under WLP + MCQ than under PLP + MCQ, which includes both fixations and saccades, indicates that participants spent more time comparing options when searching for the correct answer during WLP. The higher visit counts in WLP, reflected in more frequent entries into and exits from stems and options, imply that participants redirected attention to written items when salient auditory cues were encountered, using these cues to guide their search for relevant written elements.
In contrast, the overall reduction in gaze behaviors under the PLP condition suggests a shift in attentional allocation from divided visual-auditory processing under the WLP condition to more focused auditory comprehension during the listening phase, followed by more efficient processing during the answering phase of the PLP. This interpretation aligns with previous studies that found that test-takers tend to produce better and more extensive notes (Yeager et al., Reference Yeager, Park and Liao2024) and identify more main points (Field, Reference Field, Lynda and Weir2012) when they are not allowed to view the questions while listening, suggesting deeper engagement with the listening input. In the listening phase of the PLP condition, there were approximately eight fixations per visit (AOI of note during listening), in contrast to three to four fixations per visit on the items and answers (AOIs of stems and options or responses) under WLP, suggesting more sustained attention while listening compared to WLP. Likewise, during the PLP answering phase, there were fewer fixations and visit counts on stems and options or responses than in the WLP condition, indicating that participants were less inclined to visually recheck or cross-reference the written elements while answering questions. Together, the reduced visual monitoring of text during the PLP listening phase and diminished visual reinspection of written elements during the PLP answering phase suggest, in principle, lower demands on visual–verbal coordination. However, whether this translates into freed working memory resources or greater attention to the listening task cannot be concluded from eye-movement data alone. Further research is needed to investigate this.
Compared with MCQs, the WLP-PLP differences were smaller for OEQs: fixation and visit counts differed significantly between the WLP and PLP conditions, but the two conditions did not differ significantly in total fixation or visit duration. This aligns with prior research showing that MCQs tend to induce more text-focused processing than OEQs in listening because they provide stems and multiple options that invite comparison and verification (Cheng, Reference Cheng2004). Thus, when listening comprehension breaks down, test-takers are more likely to either answer or leave an OEQ blank, whereas MCQs invite strategic option elimination to maximize the chances of a correct response (Cheng, Reference Cheng, Chan, Chin, Nagami and Suthiwan2011). These two thought processes are fundamentally different and demonstrate how test methods affect listening assessment. This interpretation is supported by the AOI-specific descriptives: while test-takers’ gaze behaviors on MCQ options tripled or doubled those on MCQ stems, with a large effect size, their gaze was split more evenly between stems and responses, with OEQs showing a small to medium effect size.
Notably, despite the less pronounced differences between the two item presentations for OEQs, the findings suggest plausible divided attention under WLP. Although fixation count (p = .002) and visit count (p < .001) remained significantly higher in WLP, total fixation and total visit durations did not differ significantly. This suggests that participants glanced more frequently at OEQ stems and responses under the WLP condition but did not allocate more time to processing them. A plausible explanation is that participants used the written questions as brief reference points to guide their listening during WLP, despite the minimal textual support available in OEQs, consistent with the observations of Buck (Reference Buck1991) and Sherman (Reference Sherman1997).
An additional explanation may be related to the demands of concurrent typing during WLP. Less proficient typists tend to alternate their gaze between the keyboard and tasks on the screen (Papoutsaki et al., Reference Papoutsaki, Gokaslan, Tompkin, He and Huang2018). This may be exacerbated under WLP, where multitasking conditions significantly increase perceived workload and anxiety while degrading typing performance (Wetherell et al., Reference Wetherell, Lau and Maxion2023). Under WLP, the simultaneous need to comprehend, retain, and type responses under time pressure likely exacerbated these effects, contributing to increased fixation and visit counts.
It is also important to consider the influence of written response generation, which is required in both the WLP and PLP conditions for OEQs. Composing responses involves retrieving, organizing, and expressing information, a process that requires substantial cognitive resources. Buck (Reference Buck1991) noted that some test-takers reported knowing the answers but lacking enough time to complete their written responses. The time pressure under WLP may have limited participants’ ability to be deeply engaged in the response construction process, resulting in briefer or less elaborated responses. In contrast, the PLP condition may have afforded participants more cognitive resources and time to formulate more extended responses, which could account for the less pronounced drop in metrics from WLP to PLP.
In comparing MCQs and OEQs, beyond the more even distribution of gaze between stems and responses in OEQs that was noted earlier, participants’ gaze data on their notes during the answering phase for OEQs nearly doubled that for MCQs. This pattern suggests that after listening, test-takers tended to rely primarily on the written options rather than their notes for information retrieval in MCQs, whereas in OEQs, they relied more on their notes to construct responses. Specifically, when external linguistic scaffolding is present in MCQs (i.e., MCQ options), test-takers tend to outsource retrieval to the test format rather than reconstructing meaning from notes. When no such scaffold exists (i.e., in OEQs), test-takers must integrate notes to activate recall and construct answers, which is typically associated with deeper processing. Thus, it may be said that the presence of options does not merely enable option-based reasoning but displaces reliance on self-generated notes.
Despite this difference in the answering phase, participants’ gaze behavior during note-taking in the listening phase showed minimal variation across the two item formats. This finding suggests that the divergence in strategy emerges after listening, not during listening. This is important because it shows that the task format shapes how notes are used, not how they are taken. Collectively, these findings indicate that MCQs tend to shift test-takers toward option-driven, recognition-based strategies at the point of answering, whereas OEQs encourage greater use of self-generated notes and recall-based response construction. For researchers, this highlights that item format influences how listening input is processed and retrieved, even when note-taking behavior during listening is similar. For practitioners, the results suggest that MCQs may inadvertently discourage deeper engagement with the input, whereas OEQs foster more active reconstruction of meaning from notes.
The present findings also partially align with another eye-tracking study on test method effects by Aryadoust et al. (Reference Aryadoust, Foo and Ng2022), who reported that all eye-tracking measures, except for visit count, declined from WLP to PLP in gap-filling tasks. The discrepancy in the visit count pattern may be attributed to the research designs of the two studies. In Aryadoust et al.’s (Reference Aryadoust, Foo and Ng2022) study, participants alternated their attention between handwritten notes and screen-based items, introducing spatial and temporal split-attention demands. In contrast, the present study minimized the split-attention effect by displaying both notes and items on the screen during the answering phase, which likely reduced the number of visits to the notes.
Finally, the current results invite reconsideration of what increased gaze metrics signify in the context of listening tests. While higher fixation and visit metrics are often interpreted as indicators of increased engagement with the test tasks, they may alternatively reflect greater cognitive demand or the challenge of processing textual elements or managing two modalities simultaneously. Aryadoust et al. (Reference Aryadoust, Foo and Ng2022) found that PLP conditions elicited greater activation in brain areas associated with top-down processing in listening, suggesting deeper semantic engagement with auditory input. In contrast, WLP conditions may have taxed visual processing systems more heavily, as test-takers focused on decoding written input to support comprehension or complete answering tasks. Collectively, these eye-tracking and brain imaging studies suggest that under WLP conditions, where items are accessible during listening, test-takers may experience increased processing demands due to either difficulty comprehending the items or reliance on them to guide listening. In either case, such behaviors may introduce construct-irrelevant variance and potentially compromise the cognitive processing of the test items that are intended to be elicited.
Research question 2: Gaze Behaviors, Keystroking Skills, and Text Length
Typing speed and word count were included as covariates in the LMMs to account for individual differences in typing proficiency and written text processing. Aligning with our hypothesis, typing speed showed a positive relationship with all four eye-tracking measures, except for total visit duration. This indicates that participants with typing fluency engaged more intensively with written output. One interpretation is that higher typing fluency enables cognitive resources to be directed toward comprehending the input (Gong et al., Reference Gong, Zhang and Li2022), thus producing and monitoring more written output. Alternatively, they may have adopted a more active response strategy, typing and checking their input more efficiently, thereby increasing their eye movements across the AOIs. Consequently, participants with higher typing fluency may have a greater capacity to allocate attention to task-relevant areas, thereby exhibiting increased eye movements.
The word count, serving as a proxy for the amount of written information from items, notes, or constructed responses, was positively associated with total fixation duration and total visit duration but negatively associated with visit count. The fixation count was not associated with the word count. The positive associations in the duration metrics suggest that longer items or constructed responses take more time to process, thereby increasing the length of eye movements required. Interestingly, the visit count demonstrates a diverging pattern: it decreases as the word count increases. This suggests that participants who produced longer written responses may have engaged in fewer but more sustained visits to AOIs, such as items, notes, and response fields.
Implications for L2 listening assessment design
The observed increase in gaze behaviors under the WLP condition, particularly when paired with MCQs, suggests that requiring test-takers to process auditory input while engaging with written items may result in divided attention. The written text in the WLP condition partially reflects academic contexts such as lectures, where listening is usually accompanied by simultaneous visual processing, such as in PowerPoint slides (Lesnov, Reference Lesnov2022). However, lecture visuals typically do not require listeners to respond to predetermined questions; rather, listeners decide how to engage with the material and what information to note. In contrast, written items in WLP impose a test-specific cognitive demand, as test-takers must master the items by processing and retaining the written prompts while simultaneously listening for targeted details to answer them. Cognitive processing under WLP differs in its nature and cognitive demands from those involved in authentic academic listening, supported by visuals.
The additional cognitive demand imposed by WLP test tasks, beyond that characteristic of authentic academic listening, may introduce construct-irrelevant variance and undermine the validity of score interpretations. Wagner (Reference Wagner2013) argued that the cognitive demands of managing both channels may exceed working memory capacity, especially when multiple answer options are present, potentially impeding comprehension rather than supporting it. Consistent with this view, O’Grady (Reference O’Grady2023) found that test-takers performed better when only the stem was available during listening than when both the stem and options were. As O’Grady (Reference O’Grady2024, p. 1448) aptly noted, incorporating extensive reading demands into listening tests may render them “unnecessarily challenging.” Additionally, the accessibility of MCQs during listening may encourage test-taking strategies, such as keyword matching or item-driven listening strategies.
While the distinction between WLP and PLP is less marked for OEQs, the data suggest less sustained processing of written responses during WLP, likely due to the challenge of response construction under time pressure. In addition, this study identified word count as a significant predictor of gaze behavior. The finding that longer written responses were associated with increased eye movements suggests that tasks requiring extended written output may promote deeper cognitive processing. However, this also implies increased cognitive demands due to information integration, memory retrieval, monitoring, revising, and motor coordination (typing) required of OEQs. If typing speed significantly affects attention allocation during test-taking, this raises questions about whether such formats might disproportionately burden test-takers with lower typing fluency and working memory capacity, thereby threatening the construct validity of test scores if they are influenced by abilities beyond listening comprehension.
To reduce divided attention and construct-irrelevant processing, we recommend administering the listening test in a PLP format by default, particularly for academic listening, where listeners are not typically required to demonstrate comprehension while simultaneously processing the lecture material. To maintain the authenticity of the academic listening experience, the listening phase should mirror natural lecture engagement, with comprehension measured only after the input is received rather than during the act of listening. Furthermore, post-listening comprehension tasks can take the form of integrated tasks rather than discrete items, as OEQ (integrated) tasks have been shown to better elicit listeners’ ability to construct a situation model or mental representation of the passage they have heard (Field, Reference Field, Geranpayeh and Taylor2013). In contrast, when a WLP condition is justified by the demands and task types in the target language use (TLU) domain, limiting item reading during the listening phase to a stem-only preview for MCQs is useful. This preserves the listening purpose without imposing real-time option comparison and prevents the cognitive burden of the test from being placed on items. For OEQs, we suggest that test developers provide clear and bounded prompts (e.g., phrases or short sentences) to limit extraneous written production demands in WLP and allow adequate time for answering.
The present study did not include visual cues, such as facial expressions, gestures, or body language, in the listening tasks. Previous research has shown that visual input can support L2 listening by aiding meaning construction and reducing cognitive demand (Liu & Aryadoust, Reference Liu and Aryadoust2024; Wagner, Reference Wagner2010), and some listening assessments now incorporate video to reflect more authentic communicative contexts. Although the audio-only format aligns with traditional listening assessment practices, future research should compare audio-only and audiovisual task formats to examine whether and how visual cues influence test-takers’ processing and performance.
Limitations and future research
While eye-tracking measures provide useful insights into the trends of participants’ cognitive processing across different test methods, they alone are insufficient to identify the specific underlying cognitive processes and test-taking strategies. Future research should incorporate complementary data sources, such as stimulated verbal reports, to triangulate and deepen our understanding of test-takers’ cognitive processing. This would allow test developers to distinguish more confidently between construct-relevant cognitive processes (e.g., meaning construction) and construct-irrelevant behaviors (e.g., option-search strategies driven by test format). Such evidence would support principled decisions about which item formats and presentation modes genuinely elicit listening comprehension, rather than test-taking strategies. Relatedly, while this study focuses on cognitive processing proxied by eye-tracking measures, future research could explicitly model the relationship between gaze behaviors and test performance to examine how response-process variables are associated with test outcomes.
Additionally, although typing speed and word count were included as covariates to account for individual differences in gaze behavior, these variables may also interact with test-taking behaviors in more complex ways. Future studies could further explore how specific characteristics of written output or answers (e.g., syntactic complexity and lexical diversity) impact gaze behaviors. This would help clarify whether certain response formats unintentionally reward advanced writing ability, rather than listening proficiency. This knowledge can guide the development of scoring approaches that minimize construct confounding due to writing ability in post-listening tasks.
Moreover, the participant sample in this study consisted exclusively of Mandarin L1 speakers accustomed to a logographic writing system. Thus, the generalizability of the findings to learners of syllabic or alphabetic L1s warrants future investigation. Future research should investigate whether similar gaze patterns emerge among test-takers with different orthographic backgrounds. This can yield practical benefits for test development. For example, if learners from alphabetic, syllabic, and logographic backgrounds exhibit distinct gaze patterns or interaction styles with written input, this would signal the need for presentation formats and item designs that are equitable across linguistic groups to accommodate these differences. Insights from such research could inform universal design principles for listening assessments, ensuring that test formats do not inadvertently advantage learners who are familiar with specific visual–orthographic processing routines.
Relatedly, a further direction concerns the influence of script directionality on visual processing during listening tests. English and Mandarin (the L1 of the participants in this study) are both written from left to right, but many learners of English come from right-to-left (RTL) script backgrounds, including Arabic, Hebrew, Persian, and Urdu. Script direction can influence eye-movement patterns, text-scanning habits, and visual search strategies, which may, in turn, affect how test-takers interact with written support during listening tasks. Investigating whether learners with RTL-script backgrounds exhibit different gaze behaviors, processing strategies, or levels of cognitive load when engaging with written items can provide valuable evidence for equitable test design. Such work could inform layout, item formatting, and visual presentation conventions to ensure that listening assessments do not inadvertently favor learners accustomed to left-to-right scripts, thereby contributing to fairer and more inclusive test development in the future.
Conclusion
This study investigated the impact of test methods, specifically item presentation (WLP vs. PLP) and item format (MCQ vs. OEQ), on test-takers’ gaze behavior during an L2 listening assessment. Leveraging eye-tracking measures as real-time indicators of cognitive processing, the findings revealed a significant decrease in visual attention from WLP to the PLP, with this difference being more pronounced for MCQs than for OEQs. Including word count and typing speed as covariates highlights the role of individual response behavior in shaping gaze dynamics. This study contributes to the growing body of research advocating for process-oriented validation in listening assessment, underscoring the critical role of test method design in shaping cognitive processing elicited during assessment. As assessment moves increasingly toward technologically mediated environments, where listeners may manage competing channels of information, test designers need to align their test design with the demands of authentic listening processes to ensure construct validity and meaningful test score interpretation.
Supplementary material
The supplementary material for this article can be found at http://doi.org/10.1017/S0272263126101648.
Acknowledgments
The authors would like to express our appreciation to Azilawati Jamaludin, Binghan Zheng, Franz Holzknecht, and Jubin Abutalebi for their support and advice on the project and the three anonymous reviewers for their insightful and constructive comments.
Funding
This research was supported by the Humanities and Social Sciences Youth Foundation of the Ministry of Education of China (Grant No. 23XJC740004), the Academic Research Fund (AcRF) of the National Institute of Education (Grand ID: RI 2/16 VSA), and Nanyang Technological University (NTU) Research Scholarship.


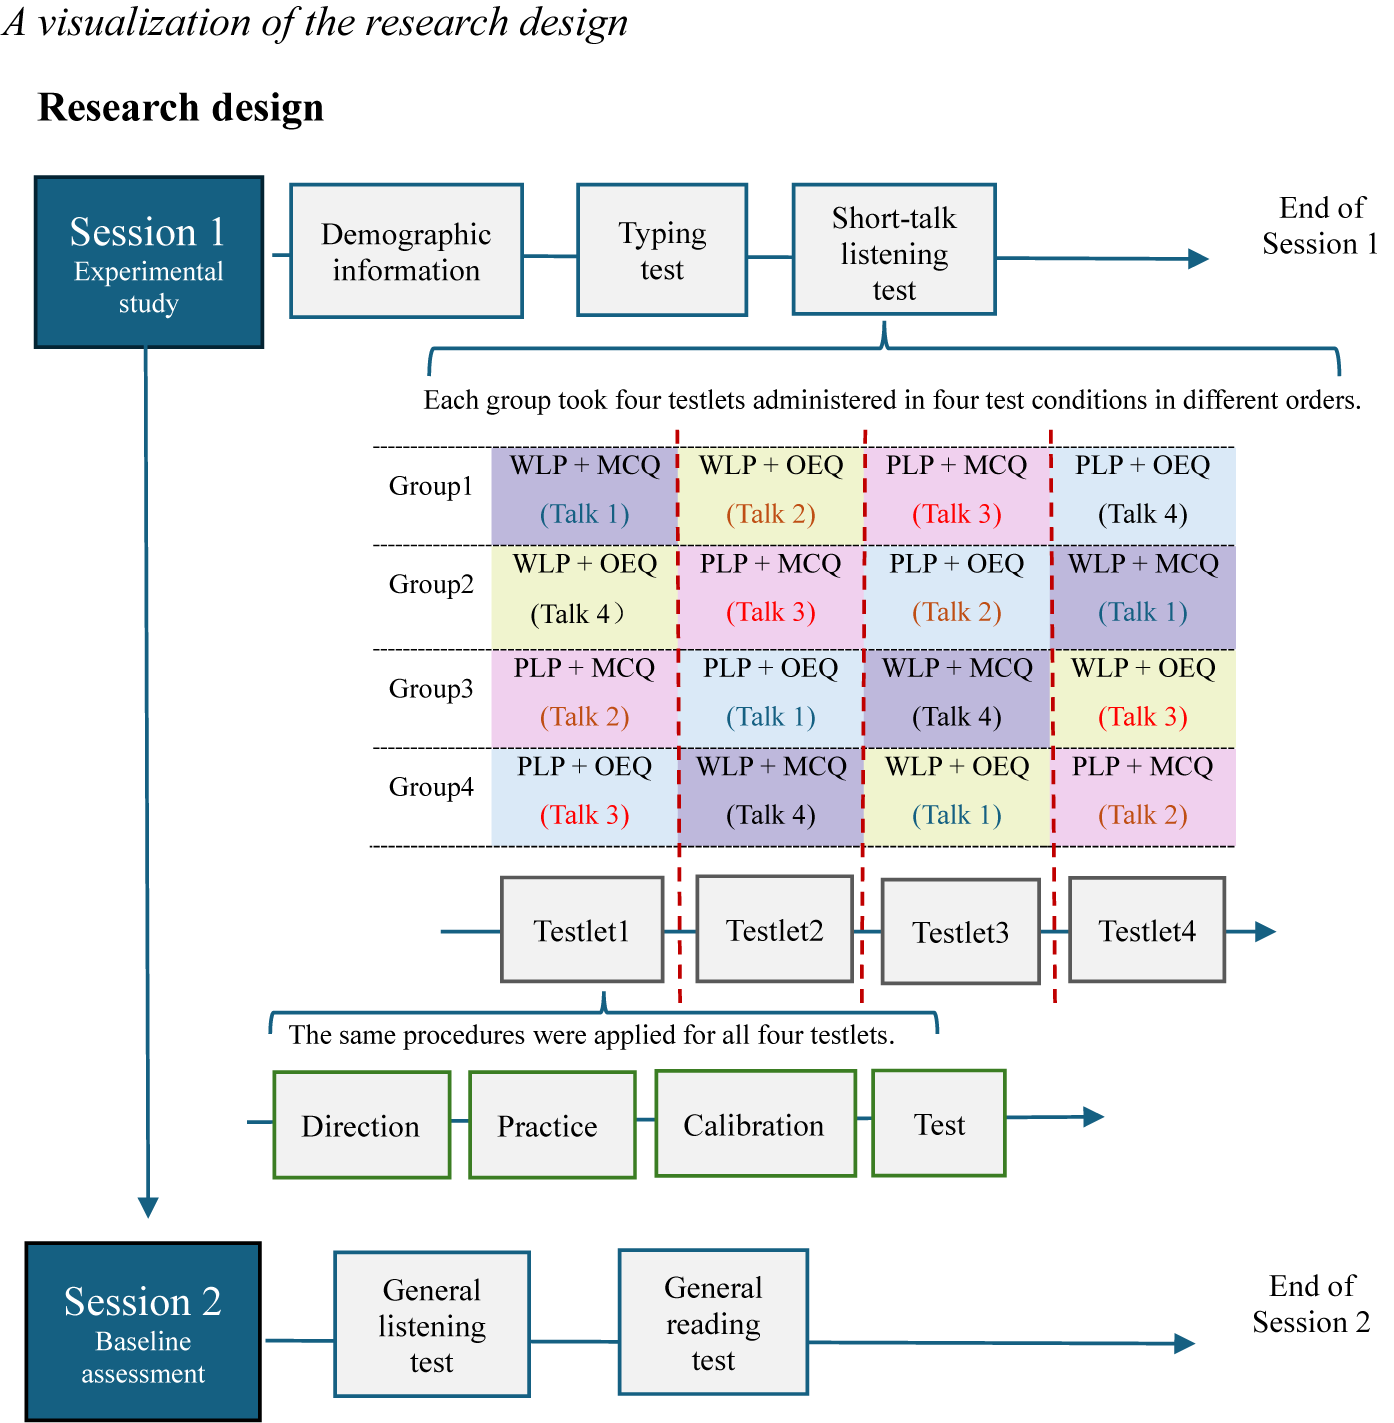

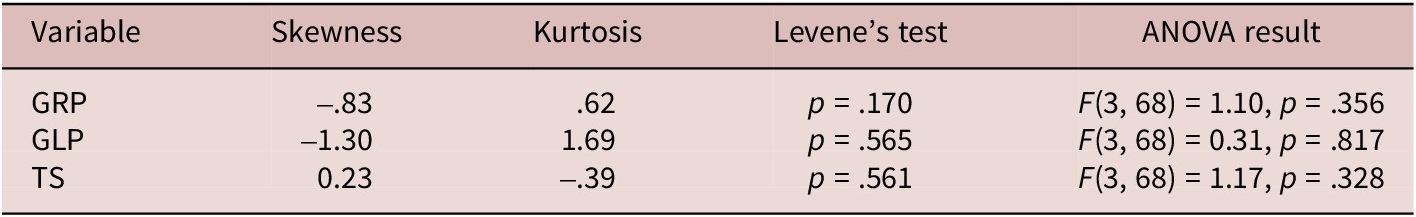
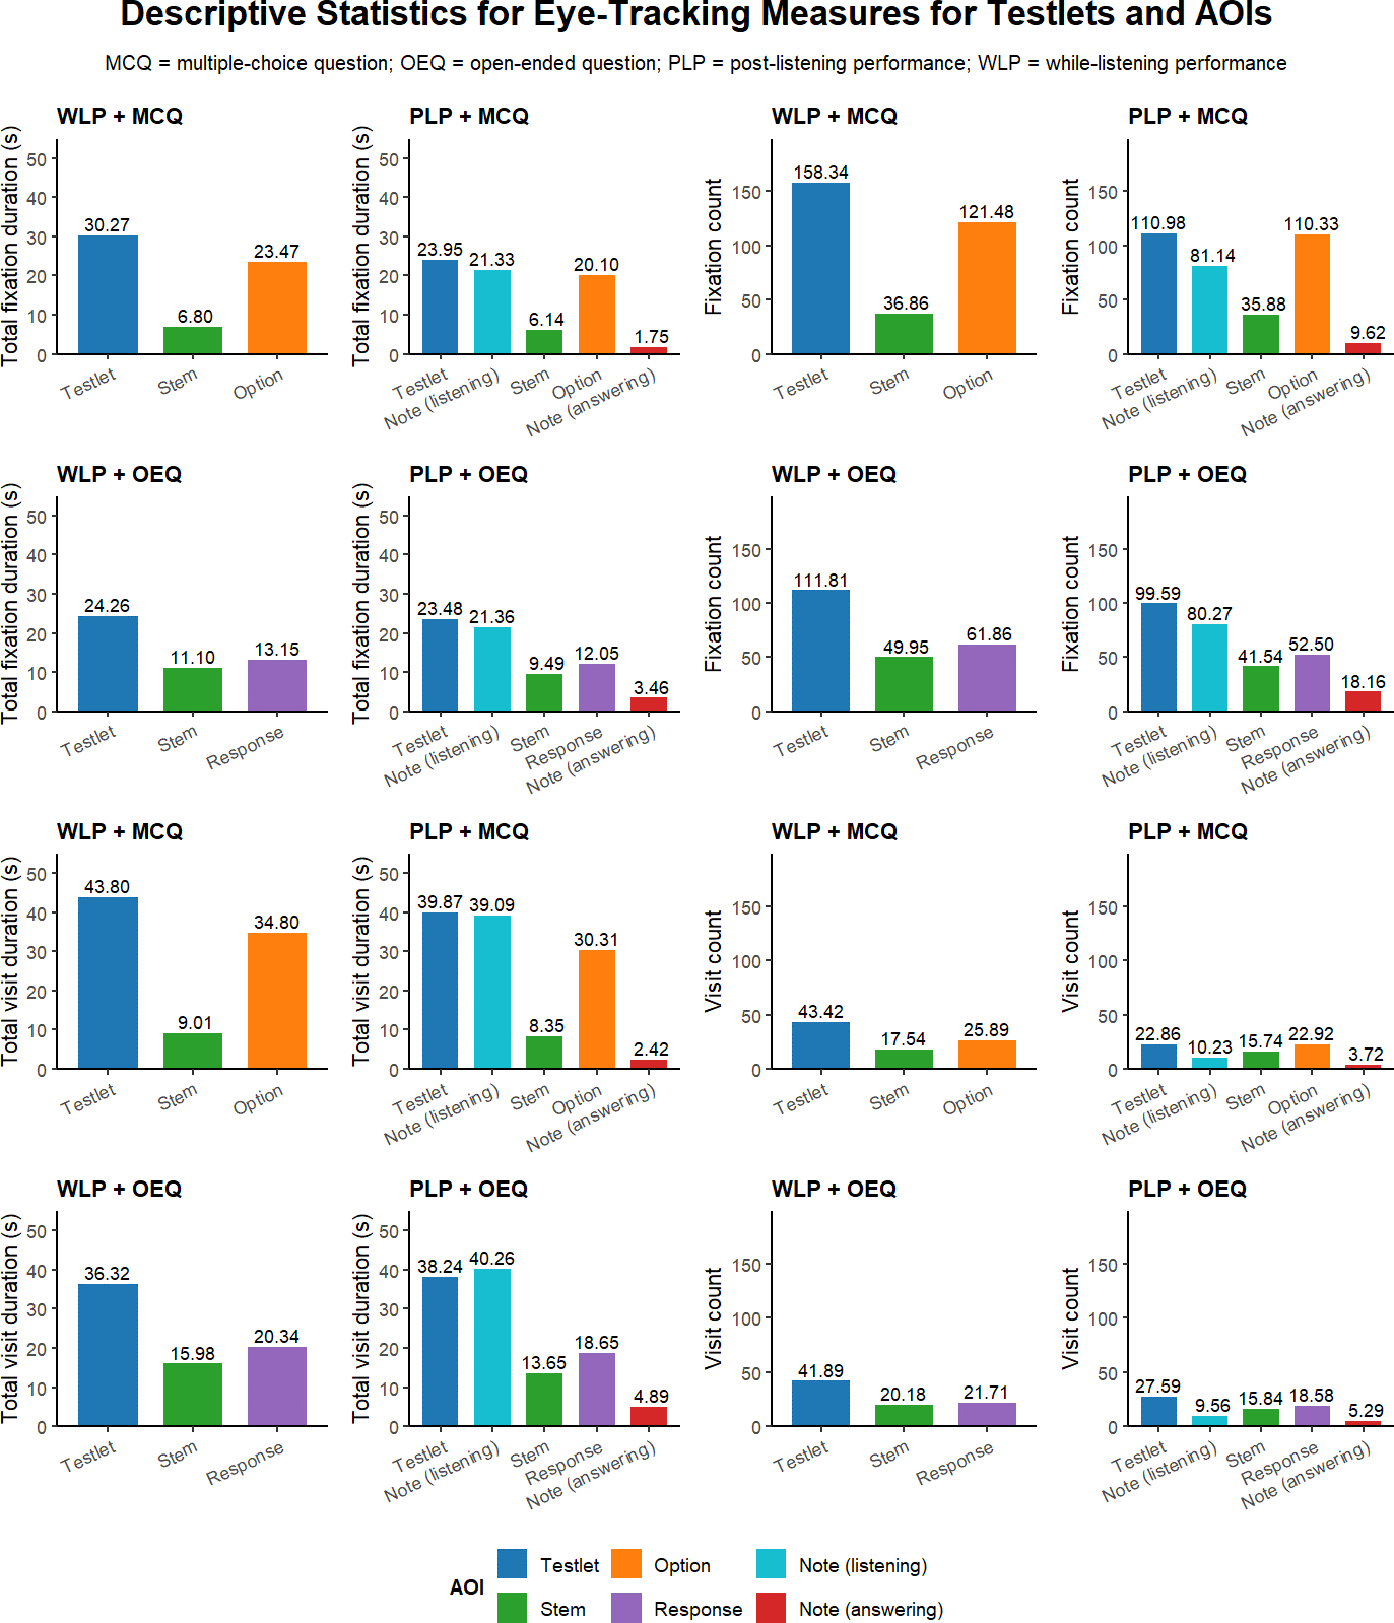


 Open access