Free sugars comprise monosaccharides and disaccharides that are added to foods and beverages, and sugars naturally present in honey, syrups, fruit juices and fruit juice concentrates(1). The WHO recommends that adults and children limit their intake of free sugars to < 10 % of total energy intake and to < 5 % for further health benefits; this is because high free sugar intake is associated with poor dietary quality, obesity and risk of non-communicable chronic diseases(Reference Malik and Hu2). Sugar-sweetened beverages (SSB) are the largest source of added sugars in the diet, and recent conclusive evidence from cohort studies and trials supports an aetiologic role of SSB in relation to weight gain, risk of type 2 diabetes mellitus and CHD(Reference Malik and Hu2). Further, dental caries are the most prevalent non-communicable chronic disease globally(1), and there is consistent evidence supporting a relationship between the amount of sugars consumed and the development of caries(Reference Sheiham and James3,Reference Moynihan and Kelly4) .
Global sales (2000–2013) of beverages with energetic sweeteners show stable but still high levels of consumption in Australasia, North America and some Western European countries. Data also highlight differences in sales trends by type of beverage and region, with consumption of SSB rising fastest in regions beyond Western countries, extending to low- and middle-income countries(Reference Popkin and Hawkes5). Global data from eighty countries on sales of ultra-processed drinks showed that for every sd increase in sales volume, there was a significant increase in mean BMI, with a higher magnitude of association observed for men than for women (0·195 v. 0·072 kg/m2)(Reference Vandevijvere, Jaacks and Monteiro6).
Given the accumulated scientific evidence of the need for actions to reduce consumption of free sugars from foods and beverages, the WHO has recommended reductions in beverage availability and portion sizes, and the reformulation (reduction) in sugar content of products with high sugars, alongside the monitoring of these changes over time(7). In addition, the WHO endorses, among other population interventions, fiscal regulations to reduce the intake of free sugars from foods and beverages(1,8–10) . One example of fiscal regulation aiming at reducing population’s intake of free sugars from beverages is the United Kingdom Soft Drinks Industry Levy (UK-SDIL). The SDIL was implemented in April 2018 and charges manufacturers and importers £0·24/l for beverages over 8 g sugar/100 ml (high levy category), £0·18/l for beverages with 5–8 g sugar/100 ml (low levy category) and no charge for beverages with < 5 g sugar/100 ml (no levy category)(Reference Scarborough, Adhikari and Harrington11). The beverages liable to the UK sugar levy are those that contain sugar or have had sugar added during production, exempting from charges fruit/vegetable juices with no added sugars, milk and milk-based drinks and milk replacement drinks(Reference Malik and Hu2–Reference Scarborough, Adhikari and Harrington11).
Data from Euromonitor International Passport indicated that, in 2019, 71·1 % of the soft drink’s distribution in New Zealand (NZ; including carbonated drinks, juices and waters) was made through supermarket chains(13). In 2012, 83 % of the ready-to-drink beverages available for sale in NZ supermarkets were sugar-sweetened or contained naturally occurring sugars and only 12 % of the non-alcoholic ready-to-drink beverages had serve sizes ≤ 240 ml(Reference Ni Mhurchu and Eyles14).
NZ has the world’s third highest rate of obesity in adults(15) and is ranked second among countries of the European Union and the Organization for Economic Co-operation and Development for the prevalence of childhood overweight/obesity (39·5 %)(16). The most recent NZ Health Survey (2018/2019) found that 10·2 % of children (2–14 years old) were consuming sugar-sweetened soft drinks, fizzy drinks, sports drinks or energy drinks three or more times per week. Consumption of these drinks once or more per week was reported for 31·8 % of the children: 15·6 % for 2–4 –year-olds, 28·9 % for 5–9-year-olds and 44 % for 10–14-year-olds(17).
Since the launch of the Global Strategy on Diet, Physical Activity and Health(8), self-regulation of the availability, reformulation and marketing of SSB has been the approach espoused by the global soft drink industry as part of their solution to obesity(Reference Lacy-Nichols, Scrinis and Carey18–Reference Ronit and Jensen20). In NZ, the only industry pledge made in this context was the ‘Healthy Kids Pledge’ at schools by the New Zealand Beverage Council in 2017 (updated in February 2018). In this pledge, the industry members of the New Zealand Beverage Council committed to sell only bottled water directly to primary and intermediate schools, to not sell sugar-sweetened carbonated soft drinks to secondary schools and to not undertake any commercial advertising in schools(21). In December 2018, the NZ food industry provided a list of fifty-one recommendations to the government as part of the food industry taskforce solution for addressing factors contributing to obesity. Among the recommendations, the New Zealand Beverage Council committed to launch a pledge in the first quarter of 2019 to a 20 % sugar reduction of non-alcoholic beverages available for sale by 2025(22). However, to date, this pledge has not been launched. In addition, NZ lacks information on how the availability, sugar content and serve size of sugary drinks available for sale are tracking overtime; such information is needed in order to guide policies and interventions that aim to improve population’s diet
In the current study, we aimed to: (i) examine trends in the relative availability, sugar content and serve size of single-serve ready-to-drink non-alcoholic beverages available for purchase in NZ supermarkets from 2013 to 2019; (ii) assess if there has been any significant reformulation of sugar content among the SSB that tracked for 2 years or more in the market during the period analysed and (iii) assess in 2019 the proportion of SSB with sugar content exceeding the threshold for the UK-SDIL(Reference Scarborough, Adhikari and Harrington11).
Methods
Data source and definition of single-serve size
Data from 2013 to 2019 on the availability, total sugar content, added sugar content and serve size of ready-to-drink non-alcoholic beverages were extracted from Nutritrack, a branded food composition database. Nutritrack was developed by the National Institute for Health Innovation at the University of Auckland and includes information for packaged foods sold in four major NZ supermarket stores (New World, Four Square, Countdown and PAK’nSAVE)(23). Cross-sectional surveys are conducted annually in Auckland from February to May each year, and product information collected encompasses approximately 75 % of unique packaged foods and beverages purchased in NZ(24). Using a customised smartphone application, trained fieldworkers take photos and collect information from all packaged foods and non-alcoholic beverages that display a nutrition information panel. Names, brands, ingredient and nutrient information are entered into a secure on-line system using photographs of all sides of the product, and all packaged foods and beverages are categorised into a standardised hierarchical structure comprising fifteen foods groups, fifty-nine categories and 177 subcategories(7,Reference Dunford, Webster and Metzler25,Reference Swinburn, Sacks and Vandevijvere26) .
Analyses were limited to ready-to-drink beverages designed to be consumed in one sitting, where label-reported serve size was equal to one and package volume ≤ 600 ml. As in previous work(Reference Cleghorn, Blakely and Mhurchu27), beverages with pack size > 600 ml (with one serve or with two or more serves) were considered as bulk pack sizes and likely to be consumed in more than one occasion; therefore, they were excluded from the current study. In addition, the industry has agreed to a maximum standardised serve size of 600 ml for beverages during the process of development of the voluntary Australasian Health Star Rating front of pack nutrition label(28).
Selection of products and exclusion criteria
The current study included water-based, plant milk-based and dairy milk-based (including plain unflavoured unsweetened dairy milk) ready-to-drink beverages. Thus, the following beverages were not selected: (i) evaporated or condensed milks, beverage powders and concentrated beverages as they are not ready-to-drink and because nutrient data recorded in Nutritrack are ‘as purchased’, prior to reconstitution (n 2592); (ii) products used as ingredients rather than being ready-to-drink, for example, coconut creams and some coconut milks (n 262; (iii) yogurts (n 2238), with the exception of drinking yogurts; (iv) dairy probiotic drinks due to the small number of products under this category (n 23) and (v) beverages specifically targeted to infants and young children (1–3 years old). Among the 8734 selected non-alcoholic beverages from 2013 to 2019, the following were excluded: reconstituted products (n 45), fruit/vegetable juices/drinks used as ingredients (n 59), fruit/vegetable juices/drinks where aloe vera and water were the only ingredients (n 72), products displaying multiple nutrition information panel (n 30) and products with missing information for pack size (n 132) and for serve size (n 263). Additional exclusions were due to the following: pack size ≤ 600 ml and two or more serves/pack (n 399); pack size > 600 ml and two or more serves/pack (n 4980) and pack size > 600 ml and one serve/pack (n 288). In total, 2466 ready-to-drink beverages with single-serve size and packet size ≤ 600 ml were included in the analysis. Among these beverages, 66 (2·7 %) had missing values for sugar content and were therefore excluded from the analysis assessing sugar content and its trends (which included 2400 beverage products) (online supplementary material, Supplemental Figure S1).
Categorisation of the non-alcoholic ready-to-drink-beverages
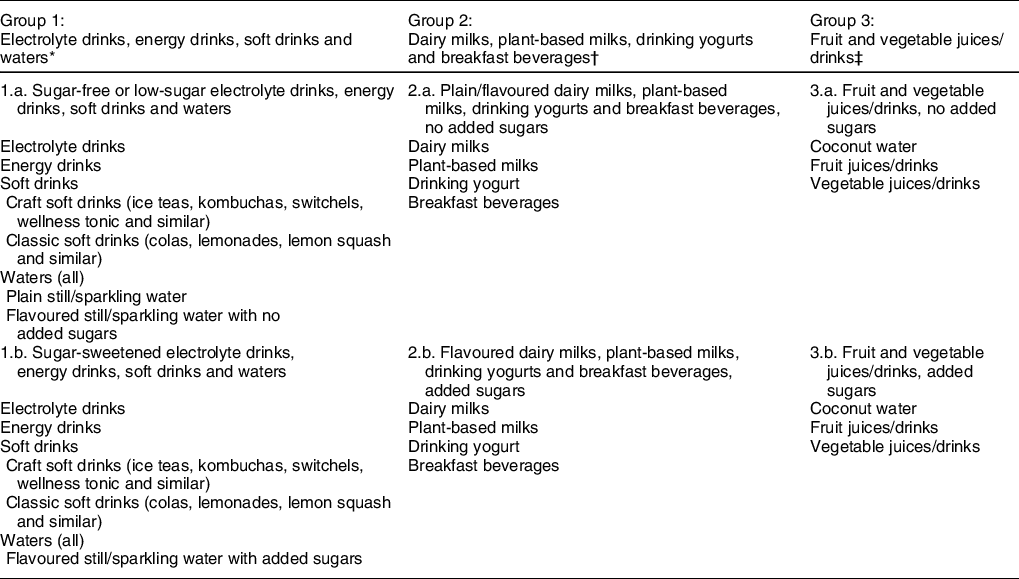
A beverage classification system for the current analysis was developed and applied. Details on the beverage groups and subgroups, as well as the rationale used, are provided in Table 1. This classification system was developed based on the original Nutritrack classification of food group levels(23,Reference Dunford, Webster and Metzler25) , total sugar content reported on nutrition information panel for beverages under group 1 (electrolyte drinks, energy drinks, soft drinks and waters) and by the presence of any of ninety-three types of added sugars in the ingredients list of the products under group 2 (dairy and plant-based milks, drinking yogurts and breakfast beverages), under group 3 (fruit/vegetable juices/drinks) and for flavoured waters (under group 1). The added sugars examined were sourced from previously published list of added sugars from supermarket packaged foods of four countries (including the NZ Nutritrack data)(Reference Dunford, Taillie and Milles29) and from an updated and extended version of this published list, developed by the Global Food Research Program. For the beverages under group 2 and for flavoured waters (group 1), the following ingredients were also considered as added sugars: fruit juices, fruit nectars, fruit purees and fruit concentrates. The developed system classified non-alcoholic beverages into three main groups, six subgroups (level 1) and twenty-two smaller subcategories (level 2). We also classified waters and soft drinks further into a third level as follows: waters (plain still/sparkling, flavoured still/sparkling with no added sugars and flavoured still/sparkling with added sugars) and soft drinks (sugar-free/low-sugar classic, sugar-free/low-sugar craft, sugar-sweetened classic and sugar-sweetened craft). Classic soft drinks included colas, lemonades, lemon squash and similar, while craft soft drinks included ice teas, kombuchas, switchels, wellness tonic and similar (Table 1).
Beverage classification system developed and applied to the non-alcoholic beverages from Nutritrack 2013–2019

* Classification based on the amount of total sugars displayed in the nutrition information panels (NIP) of products, which represents data routinely collected by Nutritrack. Within group 1, products denominated by manufacturer as ‘diet’ and/or with sugar content ≤ 1·0 g/100 ml were classified as sugar-free/low-sugar and products with sugar content > 1·0 g/100 ml were classified as sugar-sweetened. Soft drinks group includes carbonated and non-carbonated drinks, and it was further split in two subgroups to identify classic soft drinks (colas, lemonades, lemon squash and similar) and newer, contemporary soft drinks (named here as craft soft drinks and it includes ice teas, kombuchas, switchels, wellness tonic and similar). For waters, further classification considered the presence of added sugars in products’ ingredients list.
† Classification was made based in the presence of flavours and added sugars. Information on whether the product was plain or flavoured is routinely collected by Nutritrack. Product ingredients lists were consulted to search for the presence of added sugars.
‡ Classification was made based in the presence of added sugars, independently of the concentration of fruit/vegetable juices in the beverages. Product ingredients lists were consulted to search for the presence of added sugars.
Criteria for the assessment of serve size and sugar content
The proportion of single-serve beverages with a serve size ≤ 250 ml was assessed across 2013–2019. The 250-ml threshold was used as this was the most common serve size for SSB available for sale in NZ in 2016(Reference Eyles, Neal and Jiang30), and it was the value used as the cut-off for single-serve beverages in a simulation study estimating the health benefits and cost savings of a cap on the package/serve size of SSB in NZ(Reference Cleghorn, Blakely and Mhurchu27).
The sugar content of beverages was assessed in three different ways. Firstly, we calculated the mean (sd by 100 ml) of sugar content of all beverage groups and subgroups overall and for each year (from 2013 to 2019). We then assessed changes in mean sugar content of beverage groups and subgroups across 2013–2019. Secondly, we assessed if there was any significant sugar reformulation of unique SSB that were available for sale in two or more years for the period of 2013–2019. Thirdly, we assessed the proportion of beverages available for sale in 2019 with sugar levels above the low and high benchmarks established by the United Kingdom (UK) SDIL(31). To allow comparability with other studies, this assessment was limited to the beverages liable to the UK sugar levy(Reference Scarborough, Adhikari and Harrington11,12) .
Statistical analysis
Descriptive statistics were undertaken to determine the number of products, proportions, means, sd and ranges for the following outcomes: relative availability of beverages, their sugar content and serve size. Analyses were undertaken on all available single-serve products from 2013 to 2019 and separately for each year. Samples were considered sufficiently large (≥ 30) for the central limit theorem to apply(32). T tests for independent samples and one-way ANOVA and Tukey HSD post-hoc tests were applied to examine statistically significant differences in mean values of sugar content between beverage subgroups.
Trend analysis for beverages availability, sugar content and serve size were performed only for beverage groups and subgroups with at least 100 products available across 2013–2019. Trends in the relative availability and in the proportion of beverages with serve size ≤ 250 ml within beverage groups and subgroups were examined using χ 2 tests for trends (linear-by-linear associations using Mantel Haenszel tests).
To estimate the average change in sugar contents from 2013 to 2019, linear regression models were performed with the sugar content of all beverages as the dependent variable. Year was included in the models as a continuous variable (coded as 2013 = 0, 2014 = 0·167, 2015 = 0·334, 2016 = 0·501, 2017 = 0·668, 2018 = 0·835 and 2019 = 1). Interaction terms between year and beverage subgroups were tested in the main model and, where significant interactions were present, analyses were also presented according to beverage subgroups.
Analysis of sugar reformulation was performed using linear random effects mixed models, where a random product effect was included in the models to account for within product change, and year, as a continuous variable (coded as above indicated), was considered in the fixed models. Reformulation analyses were limited to 365 unique SSB that were available for sale in two or more years and with information on sugar content available in two or more years (46·3 % of the unique SSB available for sale from 2013 to 2019) (online supplementary material, Supplemental Figure S2). As a complementary assessment, we examined the number and proportion of the unique sugar-sweetened drinks where a change in sugar content had occurred in the period analysed. Change was defined as a sugar content variation of at least + 0·1 g/100 ml when assessing the difference in values between the most recent year and the first year. Within products that had any reduction or increase of sugar within the period, we presented means (sd) of sugar increase and decrease.
Average percentage change in sugar content across 2013–2019 was calculated by dividing the adjusted mean change in sugar from 2013 to 2019 by the mean sugar content in 2013 and multiplying by 100 %. All analyses were performed using SPSS software (version 25, IBM SPSS Statistics), and all tests were two-sided at 5 % significance level.
Results
Relative availability of ready-to-drink non-alcoholic beverages across 2013–2019
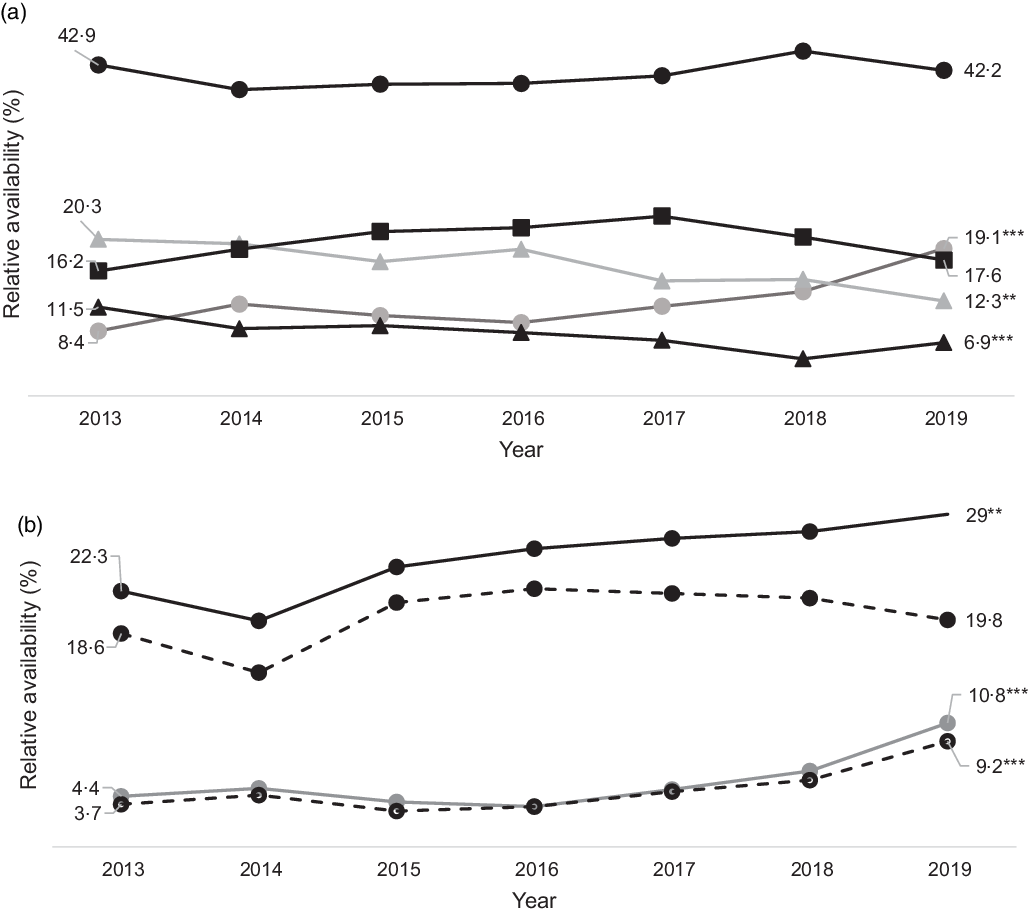
The number of single-serve ready-to-drink beverages available for sale each year was 2013 (n 296), 2014 (n 310), 2015 (n 356), 2016 (n 400), 2017 (n 335), 2018 (n 378) and 2019 (n 391). Among the beverages available for sale in 2019, 19·1 % were sugar-free/low-sugar beverages and 79·1 % were SSB or beverages with naturally occurring sugars. Sugar-sweetened soft drinks and plain waters represented 29 and 3·8 % of all ready-to-drink beverages available for sale in 2019, respectively (online supplementary material, Supplemental Table S1). The relative availability of sugar-sweetened electrolyte, energy, soft drinks and waters and of dairy milks, plant-based milks, drinking yogurts and breakfast beverages (with added sugars) did not change across 2013–2019. There was a statistically significant increase in the relative availability of sugar-free/low-sugar electrolyte, energy, soft drinks and waters (from 8·4 % in 2013 to 19·1 % in 2019) (Fig. 1a). In contrast, across 2013–2019, there was a decrease in the availability of fruit/vegetable juices/drinks (n 94 (31·8 %) to n 75 (19·4 %); P < 0·001) (data not shown in figure). Fruit/vegetable juices/drinks with added sugars decreased from 11·5 % in 2013 to 6·9 % in 2019 and items without added sugars decreased from 20·3 % in 2013 to 12·3 % in 2019) (Fig. 1a). Within soft drinks subgroups, a statistically significant increase was observed in the relative availability of sugar-free/low-sugar products (ranging from 4·4 % in 2013 to 10·8 % in 2019) and of sugar-sweetened options (ranging from 22·3 % in 2013 to 29 % in 2019). The increase in the availability of sugar-sweetened soft drinks was explained predominantly by the increase in the availability of craft sugar-sweetened soft drinks (ice teas, kombuchas, switchels, tonic wellness and similar) as there were no statistically significant changes in the availability of sugar-sweetened classic soft drinks (Fig. 1b).
Relative availability (%) of single-serve ready-to-drink non-alcoholic beverages (2013–2019): (a) Within beverage subgroups. ![]() , Sugar-free/low-sugar: electrolyte, energy and soft drinks and waters;
, Sugar-free/low-sugar: electrolyte, energy and soft drinks and waters; ![]() , Sugar-sweetened: electrolyte, energy and soft drinks and waters;
, Sugar-sweetened: electrolyte, energy and soft drinks and waters; ![]() , No added sugars: fruit/vegetable juices/drinks;
, No added sugars: fruit/vegetable juices/drinks; ![]() , Added sugars: fruit/vegetable juices/drinks;
, Added sugars: fruit/vegetable juices/drinks; ![]() , Added sugars: diary and plant-based milks, drinking yogurts and breakfast beverages. (b) Within soft drinks subgroups.
, Added sugars: diary and plant-based milks, drinking yogurts and breakfast beverages. (b) Within soft drinks subgroups. ![]() , Sugar-free/low-sugar soft drinks;
, Sugar-free/low-sugar soft drinks; ![]() , Sugar-sweetened soft drinks;
, Sugar-sweetened soft drinks; ![]() , Sugar-sweetened craft soft drinks;
, Sugar-sweetened craft soft drinks; ![]() , Sugar-sweetened classic soft drinks. X 2 for linear trend: **P < 0·005; ***P < 0·001
, Sugar-sweetened classic soft drinks. X 2 for linear trend: **P < 0·005; ***P < 0·001
Sugar content of ready-to-drink non-alcoholic beverages across 2013–2019
Among all beverages available for sale from 2013 to 2019 (excluding sugar-free/low-sugar beverages), despite a one-way ANOVA test indicating that there were statistically significant differences in mean sugar content between the subgroups (P < 0·001), post-hoc tests showed that there were no differences between the mean sugar content of sugar-sweetened electrolyte, energy, soft drinks and waters; dairy and plant-based milks, drinking yogurts and breakfast beverages – with added sugars; fruit/vegetable juices/drinks – no added sugars and fruit/vegetable juices/drinks – with added sugars (P-values > 0·05 for all comparisons). The mean sugar contents in these subgroups varied from 8·5 to 9·2 g/100 ml. However, the mean amount of sugar for each of these four beverage subgroups was significantly higher than the mean amount of sugar of plain/flavoured dairy and plant-based milks, drinking yogurts and breakfast beverages – no added sugars (5·1 g/100 ml; P < 0·001 for all post-hoc comparisons). Within the sugar-sweetened electrolyte, energy, soft drinks and waters subgroup, waters had the lowest mean sugar content while energy drinks had the highest (3·2 g v. 11·5 g/100 ml; one-way ANOVA test and all subsequent post-hoc tests with P < 0·001). Within the sugar-sweetened soft drinks subgroup, craft soft drinks had a lower mean sugar content than classic soft drinks (4·6 g v. 9·5 g/100 ml; Student t test with P < 0·001) (Table 2).
Mean, sd and ranges of sugar content (g/100 ml) of non-alcoholic single-serve ready-to-drink beverage groups and subgroups, according to year and in total
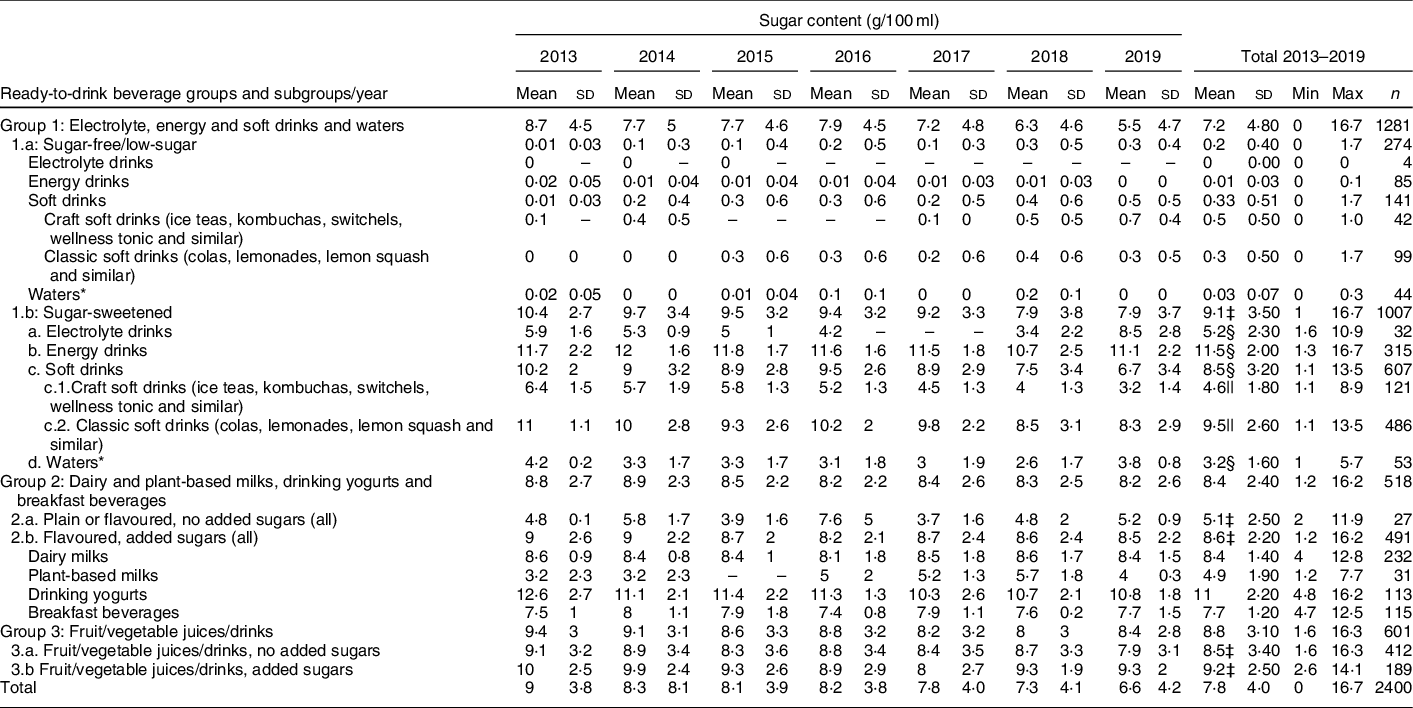
Min: minimum; Max: maximum.
* Includes still/sparkling plain waters and still/sparkling flavoured waters with no added sugars/low-sugar content.
† Includes still/sparkling flavoured waters with added sugars.
‡ One-way ANOVA and Tukey HSD post-hoc tests P < 0·05: applied for the comparison of means among the following beverage subgroups 1b; 2a; 2b; 3a; 3b.
§ One-way ANOVA and Tukey HSD post-hoc tests P < 0·05: applied for the comparison of means among the beverage within subgroups 1b.
|| t test for independent samples P < 0.05: applied for the comparison of means within sugar-sweetened soft drinks subgroups.
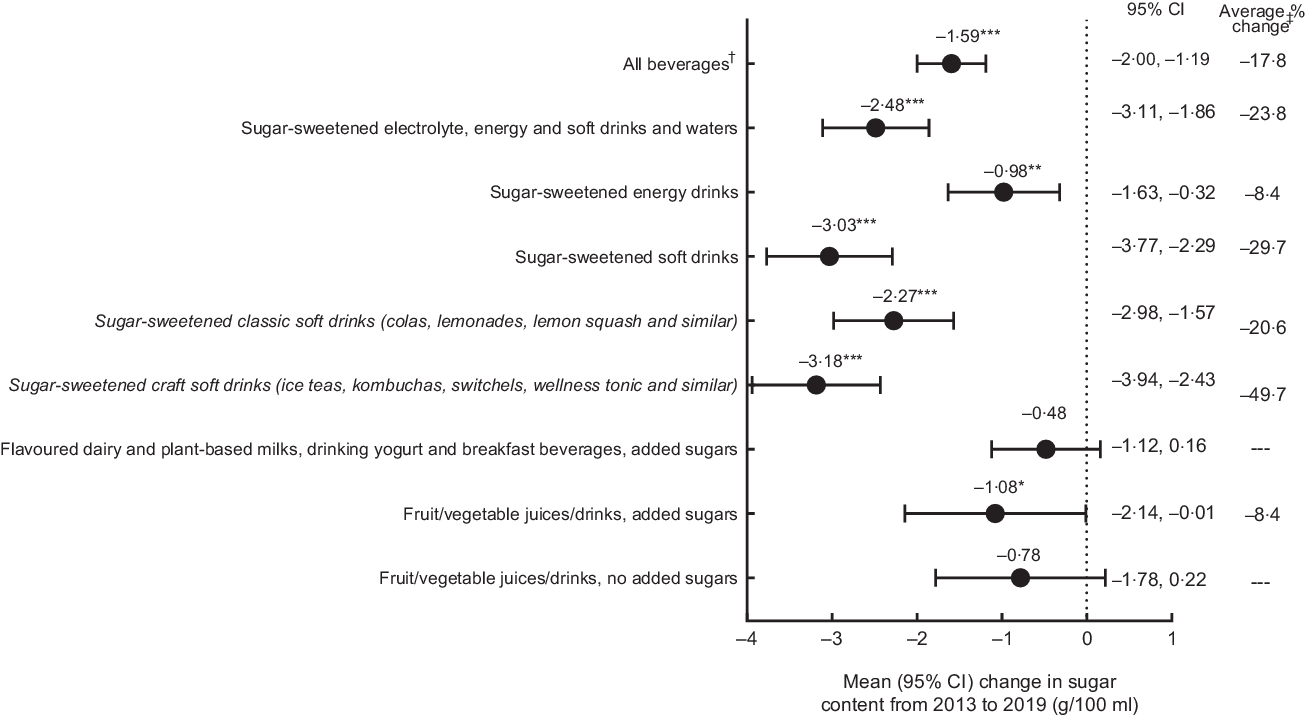
Across 2013–2019 and among all beverages available for sale (excluding sugar-free/low-sugar beverages), there was a significant mean sugar reduction (in g/100 ml) of 1·59 g/100 ml (95 % CI 2·00, 1·19). However, there were no statistically significant changes in mean sugar content among the subgroup of flavoured dairy and plant-based milks, drinking yogurts and breakfast beverages (with added sugars) or fruit/vegetable juices/drinks (without added sugars). Statistically significant mean sugar reduction across 2013–2019 was observed for the following subgroups: fruit/vegetable juices/drinks – with added sugars (1·08; 95 % CI 2·14, 0·01 g/100 ml) and sugar-sweetened electrolyte drinks, energy drinks, soft drinks and waters (2·48; 95 % CI 3·11, 1·86 g/100 ml). Within this last subgroup, a significant mean sugar reduction across 2013–2019 was observed for sugar-sweetened energy drinks (0·98; 95 % CI 1·63, 0·32 g/100 ml) and sugar-sweetened soft drinks (3·03; 95 % CI 3·77, 2·29 g/100 ml). Within the sugar-sweetened soft drinks subgroup, the mean sugar reduction across 2013–2019 for craft soft drinks was 3·18 g/100 ml (95 % CI 3·94, 2·43) and for classic soft drinks it was 2·27 g/100 ml (95 % CI 2·98, 1·57) (Fig. 2).
Seven-year changes in sugar content (g/100 ml) of groups and subgroups of single-serve beverages available for sale in New Zealand supermarkets (2013–2019). †It excludes sugar-free/low-sugar electrolyte drinks, energy drinks, soft drinks and waters. *P < 0·05; **P < 0·005; ***P < 0·001. ‡Calculated as: (adjusted mean change across 2013–2019)/mean sugar content in 2013 × 100%
Reformulation of sugar-sweetened beverages across 2013–2019
Analysis of product reformulation in the same SSB across 2013–2019 indicated that there was a statistically significant, but modest, average sugar reduction within these beverages of 0·37 g/100 ml (95 % CI 0·57, 0·16 g/100 ml), corresponding to an average percentage sugar reduction of 3·7 % (data not shown in table). Among the unique 365 SSB, there was a change in sugar content in eighty-five beverages (23·3 %) in the period analysed by at least +0·1 g/100 ml, with a reduction in fifty-four beverages (mean (sd) reduction: −1·43 (1·34)) and an increase in thirty-one beverages (mean (sd) increase: 0·92 (0·93)).
Sugar content of sugar-sweetened beverages in 2019 relative to the United Kingdom Soft Drinks Industry Levy benchmarks
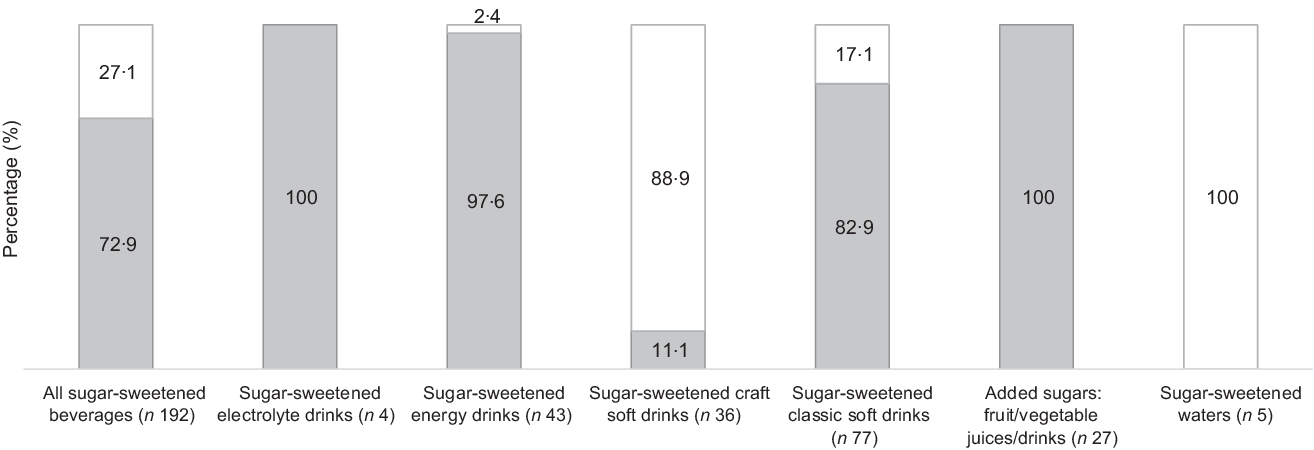
In 2019, there were 192 single-serve SSB available for sale in NZ supermarkets which would be liable for the UK-SDIL. Among them, 140 (72·9 %) would be taxed (Fig. 3), with thirty-five (18·2 %) taxed at the lower level and 105 (54·7 %) at the higher level (data not shown in table). All sugar-sweetened electrolyte drinks (n 4) and fruit/vegetable juices/drinks – added sugars (n 27), 97·6 % (n 42) of the sugar-sweetened energy drinks and 82·9 % (n 64) of the sugar-sweetened classic soft drinks would be taxed at the low or high tax categories. Four (11·1 %) of the sugar-sweetened craft soft drinks would be taxed, while none of the sugar-sweetened waters would be taxed (Fig. 3).
Percentage (%) of the single-serve sugar-sweetened beverages available for sale and liable for the UK Soft Drinks Industry Levy (![]() ) that would be taxed at low or high categories and (
) that would be taxed at low or high categories and (![]() ) percentage that would not be taxed in 2019, overall and according to beverage subgroups
) percentage that would not be taxed in 2019, overall and according to beverage subgroups
Serve size of ready-to-drink non-alcoholic beverages across 2013–2019
Across 2013–2019, the mean (sd) serve size of the single-serve beverages available for sale was 355·9 ml (119·2), with minimum serve size of 70 ml and maximum of 600 ml (data not shown in table). In 2019, less than two in ten single-serve beverages available for sale had a serve size ≤ 250 ml (n 74; 18·9 %). Across 2013–2019, there was a significant decrease in the proportion of beverages with serve size ≤ 250 ml among the following: all beverages (from 21·6 % in 2013 to 18·9 % in 2019); dairy milks, plant-based milks, drinking yogurts and breakfast beverages subgroup – all (from 50 % in 2013 to 25 % in 2019); dairy milks, plant-based milks, drinking yogurts and breakfast beverages subgroup – with added sugars (from 47·9 % in 2013 to 24·6 % in 2019) and for flavoured dairy milks with added sugars (from 34·6 % in 2013 to 7·3 % in 2019). There was a significant increase in the proportion of sugar-free/low-sugar soft drinks with a serve size ≤ 250 ml across 2013–2019. However, it is important to highlight that the number of beverages within this subgroup with a serve size ≤ 250 ml was none in 2013, 2014, 2016 and 2018, one in 2015 and 2017, and nine in 2019 (Table 3).
Number and proportion of non-alcoholic single-serve ready-to-drink beverage groups and subgroups with serve size ≤250 ml, according to year and in total
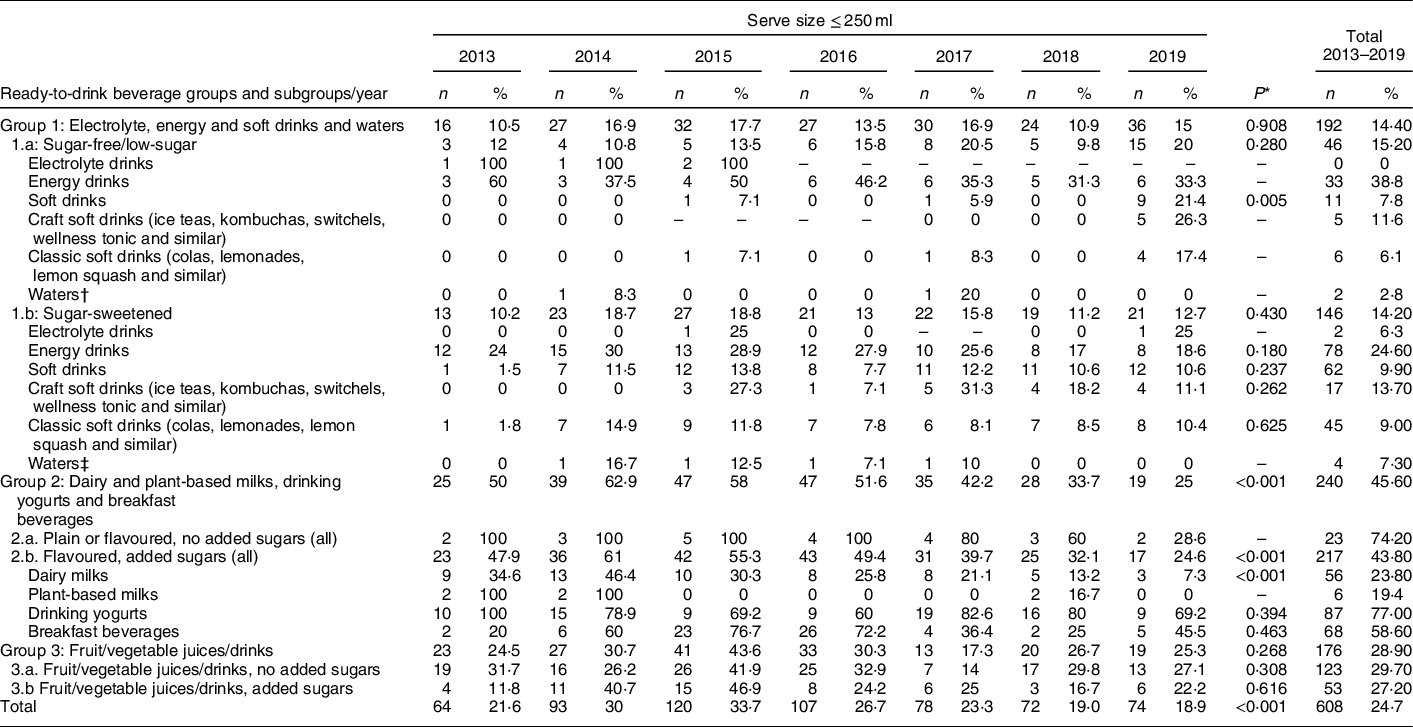
* χ 2 test for linear trend (linear-by-linear associations using Mantel Haenszel tests). Tests were not performed for beverage groups and subgroups with < 100 products across 2013–2019.
† Includes still/sparkling plain waters and still/sparkling flavoured waters with no added sugars/low-sugar content.
‡ Includes still/sparkling flavoured waters with added sugars.
Discussion
Statement of principal findings
From 2013 to 2019, there was a significant increase in the availability of sugar-free/low-sugar drinks (from 8·4 % of all drinks in 2013 to 19·1 % in 2019) and a reduction in the mean sugar content of some beverage subgroups (ranging –1·08 g/100 ml for sugar-sweetened energy drinks to –3·18 g/100 ml for sugar-sweetened craft soft drinks). For analyses limited to 365 products (46·3 % of total unique SSB) where data were available for two or more years, we observed modest reformulation of sugar with a reduction of 0·37 g/100 ml (3·7 % average sugar reduction across 2013–2019). Nevertheless, it is a population health concern that in 2019 almost 80 % of single-serve beverages sold at NZ supermarkets were sugar-sweetened or contained naturally occurring sugars and among beverages liable for the SDIL, 72·9 % had sugar content higher than the UK lower sugar benchmark. The serve size of single-serve beverages is another area for improvement, as we identified a significant reduction in the proportion of products with serve size ≤ 250 ml. In 2019, 81·1 % of non-alcoholic single-serve beverages available for sale had serve size > 250 ml.
Findings in relation to other studies
Across 2013–2019, there was a significant increase in the relative availability of sugar-free/low-sugar electrolyte drinks, energy drinks, soft drinks and waters and of sugar-sweetened craft soft drinks (which are usually soft drinks with lower sugar content than sugar-sweetened classic soft drinks). A previous study using Nutritrack data in 2012 reported the proportion of SSB and beverages containing naturally occurring sugars represented 83 % of the non-alcoholic beverages available for sale in NZ supermarkets, including beverages of all volumes(Reference Ni Mhurchu and Eyles14). This proportion was just slightly higher than the proportion we reported for single-serve size beverages 7 years later, in 2019 (79·1 %). Despite the significant reduction in the relative availability of fruit/vegetable juices/drinks (with and without sugar) across 2013–2019 identified in the current study, these products still constituted a large proportion of non-alcoholic beverages on supermarket shelves in 2019 (19·4 % of all ready-to-drink single-serve beverages available for sale). Estimates of beverage consumption for adults in 2010, including 187 countries, indicated that fruit juice consumption in NZ was the highest globally (0·83 serving−190 ml/serve size per day)(Reference Singh, Micha and Khatibzadeh33). These findings are concerning as in the present study the mean sugar content of fruit/vegetable juices/drinks – with or without added sugars (8·8 g/100 ml) was as high as the mean sugar content of sugar-sweetened electrolyte, energy and soft drinks and waters (9·5 g/100 ml). Despite the perception that 100 % fruit juice is a healthy drink option, studies report positive associations between consumption of fruit juice and weight gain, type 2 diabetes mellitus and all-cause mortality(Reference Malik and Hu2,Reference Popkin and Hawkes5) .
In 2019, 72·9 % of single-serve SSB from NZ supermarkets eligible for the UK-SDIL had a sugar content higher than the lower SDIL benchmark. This figure was higher than the 51·7 % reported for the same beverages in UK supermarkets in 2016 before the announcement of their sugar levy(Reference Scarborough, Adhikari and Harrington11), although the UK figure included beverages of all volumes. Thus, the significant mean sugar reduction observed among the single-serve beverage groups and subgroups available for sale across 2013–2019 in NZ must be interpreted with caution when translating it to a meaningful impact on population’s diets and health. For example, the mean sugar reduction of 3·03 g/100 ml across 2013–2019 seen for sugar-sweetened soft drinks was influenced by the upwards trend of sugar-sweetened soft drinks with lower sugar content (craft) in the market, with no significant change in the relative availability of classic sugar-sweetened soft drinks over the same period. A report from Euromonitor Passport about the soft drinks market in NZ for 2014–2019(13) reported the increase in the number of products with lower sugar content in the market as being determined by the consumer’s preference for these products overtime, with industry responding to it to maintain a high volume of soft drinks sales. In our study, we verified that some level of sugar reformulation contributed to the drop in mean sugar content from SSB over time, though it was of a modest magnitude (as the overall mean sugar content reduction among these beverages was only 0·37 g/100 ml).
In our study, we found that the proportion of beverages to be consumed in one sitting with serve size limited to 250 ml was low at every year (ranging from 26·7 % in 2016 to 18·9 % in 2019) and that it reduced significantly across 2013–2019. This finding is of concern given the evidence that the availability of foods and drinks with larger portions could increase energetic intake and lead to weight gain(10,Reference Hollands, Shemilt and Marteau34) and that people consume more foods and drinks when offered larger sized portions and packages than when offered smaller sized options(Reference Hollands, Shemilt and Marteau34). A simulation study using the most recent NZ National Nutrition Survey intake data from 2008 to2009 estimated that a cap on single-serve SSB of 250 ml would reduce SSB intake, improve quality-adjusted-life-years by 82 100 and save health systems costs NZ$1·65 billion(Reference Cleghorn, Blakely and Mhurchu27).
Strengths and limitations of the study
The strengths of the current study include the use of annually updated Nutritrack data, which represent approximately 75 % of unique packaged foods and beverages purchased in NZ(24), and the assessment of single-serve ready-to-drink non-alcoholic beverages available for sale in NZ supermarkets across 2013–2019. Consequently, the current study provides comprehensive information on non-alcoholic beverages that are part of the ready-to-drink beverages supply but often not included in other studies around the globe (such as dairy and plant-based milks, drinking yogurts, breakfast beverages and fruit/vegetable juices/drinks – with and without added sugars). The current study also presented information on trends in availability of craft soft drinks with lower sugar content (kombuchas, ice teas, switchels and wellness tonic), for a better understanding on how the availability of these products and changes in sugar content impacted on the mean sugar trends within the soft drinks subgroup.
One important limitation of the current study is that results were not sales-based or complemented with sales data. This could provide useful information on how availability of the different beverages was related to volume sales in the period, providing an estimate of sugar volume consumption coming from the different beverage groups and subgroups overtime. Another limitation of the data is that information on the packaged food and beverage supply is collected from February to May each year, instead of through the year. Another aspect to consider when interpreting findings is that, to guarantee statistical power, trends in the availability, sugar content and serve size within beverage subgroups were only assessed if information was available for at least 100 products across 2013–2019. Therefore, trends for waters, electrolyte drinks, dairy milks, plant-based milks, drinking yogurts and breakfast beverages could not be assessed. The interpretation of the estimates of sugar reformulation must take into consideration the fact that the analysis included only the single-serve SSB available in the market for at least 2 years, which corresponded to less than half of the single-serve SSB available for sale from 2013 to 2019.
Implications of the findings and future investigations
Findings from this repeated cross-sectional study have implications for food policies and policy makers. Despite the increase in availability of sugar-free/low-sugar drinks and the reduction in the mean sugar content of specific beverage subgroups across 2013–2019, in 2019 almost 80 % of the single-serve beverages available were sugar-sweetened or had sugars naturally occurring, less than one-fifth had serve size ≤ 250 ml and 72·9 % of the SSB liable to the UK-SDIL had sugar content above its lower benchmark. These results indicate that the industry self-regulatory approach current in place in NZ is not working and that government-led regulatory measures are needed to reduce the availability, sugar content and serve size of sugary drinks. The WHO(9) recommends that governments take action to improve availability and access to healthy foods and beverages. An important component of comprehensive programmes is taxation of sugary drinks, as it impacts in the reduction of purchase of taxed drinks by consumers and in sugar reformulation by the industry(31,Reference Pedraza, Popkin and Batis36–Reference Wilson, Morenga and Mackay38) . Real-world evaluation studies provide evidence that taxation of SSB results in a reduction of purchases so could be an effective policy initiative to prevent non-communicable diseases(Reference Scarborough, Adhikari and Harrington11,Reference Teng, Jones and Mizdrak35–Reference Bandy, Scarborough and Harrington37) in NZ. A systematic review and meta-analysis assessing the impact of a SSB tax in eleven formal jurisdictions from cities or national governments indicated that a 10 % sugar tax was associated with an average decline in targeted beverage purchases and dietary intake of 10 %, with a non-significant 1·9 % increase in total untaxed beverage consumption(Reference Teng, Jones and Mizdrak35). Beverage sales in the UK after the implementation of the SDIL in April 2018 estimate that the sales volume of taxed SSB fell by 50 %, while the sales volume of sugar-free/low-sugar soft drinks rose by 40 %. After adjustment for sales, the weighted mean sugar content of all beverages included in the UK-SDIL decreased significantly from 4·4 to 2·9 g/100 ml (overall reduction of 43 %). The levy also resulted in significant changes to the product portfolios of manufacturers, including reformulation of existing products to reduce sugar content and the introduction of new lower sugar products(Reference Bandy, Scarborough and Harrington37). Following the 2014 sugary drinks tax implementation in Mexico, the purchase of taxed beverages decreased by 45 % in the 2 years post-taxation (mainly at supermarkets) and sales of non-taxed drinks increased by 11 % when compared the last year pre-tax with the first year post-tax (for almost all store-types)(Reference Pedraza, Popkin and Batis36).
Findings from the present investigation reinforce the position of Health Coalition Aotearoa, a coordinating organisation for non-government organisations, healthcare and academic sectors to collectively achieve the vision of health and equity in NZ(Reference Wilson, Morenga and Mackay38,39) . The Coalition recommends a sugar levy on SSB similar to the UK-SDIL(Reference Scarborough, Adhikari and Harrington11,Reference Bandy, Scarborough and Harrington37) to be implemented in NZ. The introduction of a substantial tax on these beverages was also one of the top actions prioritised by public health experts of NZ in 2017 and in 2020(Reference Vandevijvere, Mackay and D’Souza40,Reference Mackay, Sing and Gerritsen41) .
Conclusions
This repeated cross-sectional study showed that in NZ across 2013–2019 there was a significant increase in the availability of single-serve sugar-free/low-sugar beverages and soft drinks with lower sugar content (craft) and a reduction in the mean sugar content of some beverage subgroups. Nevertheless, in 2019, 79·1 % of single-serve non-alcoholic beverages available for sale in the supermarkets were sugar-sweetened or had sugars naturally occurring and 81·1 % had serve size > 250 ml. Among the single-serve beverages liable for the UK-SDIL, 72·9 % had a sugar content above the lower benchmark. Thus, these findings clearly demonstrate that the current industry-led self-regulatory approach for reducing sugar intake from soft drinks industry in NZ has minimal effect and that government-led regulatory measures are now needed to reduce, in a meaningful way, the availability, sugar content and serve size of sugary drinks. It is also important that the state of the non-alcoholic beverages supply continues to be monitored.
Acknowledgements
Acknowledgments: The authors would like to thank Alana Cavadino, Biostatistician from the Department of Epidemiology and Biostatistics (University of Auckland) for the valuable statistical advice provided to T.G.C.; Michelle Jenkins and John Faatui for data management and the fieldworkers for 2019 Nutritrack data. The authors also thank the team of the Global Food Research Program, led by Dr. Shu Wen, for providing an updated preliminary list of added sugars. Financial support: This research was funded by the National Health and Medical Research Council (NHMRC) funded Centre of Research Excellence in Reducing Salt Intake using Food Policy Interventions (APP1117300). The opinions, analysis and conclusions in this paper are those of the authors and should not be attributed to the NHMRC. Conflict of interest: None. Authorship: Study design: T.G.C., H.E., C.N.M., L.Y. and S.M.; data cleaning and preparation: T.G.C.; statistical analysis: T.G.C.; data interpretation: T.G.C., H.E., C.N.M., L.Y. and S.M.; writing – original drafting preparation: T.G.C., S.M.; funding acquisition, C.N.M. All authors have read and agreed to the published version of the manuscript. Ethics of human subject participation: Ethical approval to conduct the study was not necessary as Nutritrack datasets were anonymised secondary data and did not involve human participants.
Supplementary material
For supplementary material accompanying this paper visit https://doi.org/10.1017/S1368980020005030