





I
In terms of its institutional structures, Russia in the nineteenth century was an environment of striking contrasts. On the one hand, the political system of the Russian Empire was an authoritarian monarchy, buttressed by a corrupt bureaucracy overseeing a largely illiterate and politically inactive population. Executive constraints in the modern sense were non-existent, as effectively unlimited power was encapsulated in the personality of the Tsar. As Figure 1, using the ‘Max Range’ political indicator (Rånge and Sandberg Reference Rånge and Sandberg2017) shows, Russia was classified either as an ‘absolute monarchy’ or ‘parliamentary absolute monarchy’ for much of its Tsarist history, with very little civil society or even industrial constraints on the Tsar's room for maneuver. This translated into little protection of private commercial interests and policies which benefited business as long as they benefited the Tsar (Owen Reference Owen1985).Footnote 1 And while Tsarist Russia began a move in the nineteenth century towards formal legislation and a concept of ‘legality’ as a structure for society (Borisova Reference Borisova2012), the Tsar himself was unconstrained. As prominent Russian scholar Zhivov (Reference Zhivov2002, p. 256) noted, the pretense of legality in Tsarist Russia was a ‘cultural fiction’ demonstrating the weakness of the formal judiciary.
The Max Range Regime Variable for Russia, 1789–1914
Source: Max Range dataset, based on Rånge and Sandberg (Reference Rånge and Sandberg2017). The Max Range Regime Variable is coded from 0 to 100, with lower numbers corresponding with more autocracy and higher numbers with greater access to the political system. Given the low access to the political system throughout Tsarist Russia, the y-axis is truncated at 20 so as to show the minor variations over time.

Despite these broader institutional failings in the political realm, Russia had built fairly robust financial institutions during the nineteenth century, with Ukhov (Reference Ukhov2003, p. 1) noting that ‘Russia was a leader in using public capital markets and especially foreign markets and foreign intermediaries to finance her ambitions and development.’ From 1805 to 1807, the Tsar permitted the creation of limited liability corporations and set three forms of corporate governance (full/limited partnerships and corporations), while the first stocks were traded on the St. Petersburg Stock Exchange in the 1830s; this was followed by a corporate law in 1836 which was meant ‘to encourage corporate capitalism in the style of Western Europe’ (Goetzmann and Huang Reference Goetzmann and Huang2018, p. 580). While Owen (Reference Owen2002) and others have noted that the development of the authorizing framework for Russian capital markets proceeded in a very lumpy fashion (i.e. after the 1836 laws, the next major innovation was not until 1893), the operations of capital markets were noticeably free of political interventions, minimizing the distortions seen in Russia (and elsewhere) today. Put another way, while Russian asset markets were perhaps not on par with London or Amsterdam (with centuries’ more experience in both legislation and operation), the institution of financial intermediation was far more advanced than a glance at the overall institutional matrix of Russia (and particularly the political system) would suggest.
These divergent paths of institutional development intersected from the mid nineteenth century onwards via the phenomenon of political violence. The forms of these successive waves of violence changed over time – first, attempts to reform the archaic serfdom system in the early to mid 1800s sparked peasant uprisings, while, post-serfdom, ideologically inspired attacks on the Tsarist order and on Tsarist officials (alongside industrial strife) predominated. Covert networks of anarchists and socialists pioneered a recognizably modern form of terrorism that embraced political assassinations and bombings. By 1907, the ‘neo-populist and avowedly terrorist’ Socialist Revolutionary Party numbered 45,000 members and 300,000 sympathizers (Naimark Reference Naimark1990, p. 173). Estimates of the number killed in political violence early in the twentieth century run into the tens of thousands (Geifman Reference Geifman1995).
The prevalence of violence and especially its widespread nature were likely to affect financial markets, but there is little research on how such violence – apart from major events such as the Revolution of 1905 (Opitz Reference Opitz2018) – was perceived by the Russian financial sector. In recent years, Tsarist stock markets have been examined from several angles in the asset pricing literature, including momentum investing in the St. Petersburg Stock Exchange (Goetzmann and Huang Reference Goetzmann and Huang2018), the phenomenon of herding (Gavriilidis and Kallinterakis Reference Gavriilidis and Kallinterakis2021) and even the overall efficiency of Russian capital markets (Hartwell Reference Hartwell2021). However, there has been no systematic evaluation of the effects of various types of political violence, as even Annaert et al. (Reference Annaert, Buelens and Cuyvers2019) take the omnipresence of political violence as a detrimental factor in Russian equity performance but do not explicitly test for how specific bouts of instability affected returns.
This absence of a comprehensive examination of political violence cannot be due to theoretical limitations: indeed, a small but growing body of research in finance and economics has delved into the effects of terrorism on financial and other markets globally. Drawing not only on traditional financial theories but also on insights from international business, insurance, risk, psychology, sociology and political science, this literature concentrates on the unanticipated nature of political violence and terrorism and how these shocks will impact financial valuation and volatility (Johnston and Nedelescu Reference Johnston and Nedelescu2006). A common thread in these works is the claim that political violence is more financially disruptive in countries with weaker political institutions (Mnasri and Nechi Reference Mnasri and Nechi2016). Political events or terrorism and rumors in low institutional quality environments can create large price swings and higher volatility (Morck et al. Reference Morck, Yeung and Yu2000), while environments of opacity can also impede information transmission, as information about firms is hidden from investors (Jin and Myers Reference Jin and Myers2006). Although each individual event of terrorism may be perceived as unusual but not long-lasting by markets (Chesney et al. Reference Chesney, Reshetar and Karaman2011), understanding the ramifications of repeated incidents in a weak institutional environment becomes more problematic; after all, the goal of political violence is often linked to regime change, and repeated bouts of terrorism may create institutional uncertainty about the likelihood of survival of current political arrangements. Moreover, given that terrorism is meant to evoke panic among the civilian population, shifting its modalities, its targets and its geographic reach, it is difficult to argue that firms become desensitized to political violence, and there is evidence that even after decades of political violence, markets still react to the violence in a manner suggesting that each event imparts new information (Eldor and Melnick Reference Eldor and Melnick2004). Put another way, not only does each event generate local uncertainty but it can also create perceptions that authorities have little control over the situation and may themselves be threatened. Thus, with the possibility of institutional change either as an immediate, disruptive phenomenon (such as revolution) or as a longer-term process, eroding the state from below, investors may have a rational basis for reacting negatively to terrorism even if regime change is decades away.
If theory is not the limitation, then empirics must be, and it is here where this article leaps into the fray. To explore the effects of political violence on Russian capital markets, I have amassed a new, comprehensive and unique monthly database on finance and political unrest by their type and location in Tsarist Russia from 1788 to 1914, first presented in an abbreviated form in Hartwell (Reference Hartwell2020) but upgraded substantially since that first article and encompassing more and different types of political violence in Russia throughout its imperial history.Footnote 2 This database is used to model asset price movements using an Asymmetric Component GARCH-in-Mean (ACGARCH-M) model, teasing out the short- and longer-term effects of political violence. The baseline results show that political violence as an event taken singularly depressed Russian financial markets but with variation depending upon the mode of political volatility. There is also evidence that financial volatility suffered a permanent increase due to political violence, but one stratified by the type of political volatility or violence which occurred. In fact, it is in volatility where the weak political institutional environment most likely manifested itself, as rational reassessments of market value occurred more frequently as a function of shifting political winds and abrupt and erratic responses from the Russian government. This was especially true during episodes of collective unrest in the Caucasus, where opposition to Russian imperialism manifested itself in repeated episodes of violence.
The article contributes to our understanding of financial history and especially in the way in which financial markets react to political volatility in two specific ways. First, building on work done by Verdickt (Reference Verdickt2020) and Sussman and Yafeh (Reference Sussman and Yafeh2000) in a very different (non-Russian) context, I show conclusively that political instability had a negative effect on financial markets in nineteenth-century Russia. At the same time, the article demonstrates that the impact on prices and short- and long-run volatility varied according to the type of instability, its location, and whether or not it had occurred before, during different periods and under different Tsars. Secondly, this article provides additional data regarding the composition and functioning of the St. Petersburg Stock Exchange (SPSE), including a raw time-series metric for liquidity, which differs from the Goetzmann and Huang (Reference Goetzmann and Huang2018) series by not weighting for prices. Utilizing this metric as a control variable in a robustness test, we find that illiquidity in the SPSE dampened volatility in general but otherwise had little effect on the headline results, and in fact, controlling for liquidity strengthened the results regarding political instability.
The rest of the article proceeds as follows: Section II offers an overview of the finance and political instability literature, while Section III surveys the landscape in Tsarist Russia and the state of both its political and financial institutions. Section IV introduces the database and the model, while Section V describes the methodology and reports the results. Section VI offers some concluding thoughts and ways in which this work can be extended.
II
The literature on the effects of political violence on financial markets is a small but growing area, with varied impacts observed depending upon the country and circumstances in which the attack occurs. Indeed, the institutional environment in which firms are operating in particular has a large role to play in the effects of terrorism (Essaddam and Karagianis Reference Essaddam and Karagianis2014), although the direct influence an institutional system would have on mediating these effects is not clear. Intuitively, it appears that ‘weak’ institutional environments, i.e. where political institutions are capricious, property rights not protected and/or information dissemination is not efficient, political violence would have a greater effect on firm value and markets would be highly sensitive to instability (Eldor and Melnick Reference Eldor and Melnick2004). There is evidence that the perceptions of such violence may be colored by the overall health of the economy, as healthy economies are better at absorbing shocks of terrorism or violence (Johnston and Nedelescu Reference Johnston and Nedelescu2006; Mnasri and Nechi Reference Mnasri and Nechi2016). Taking this reality to its logical conclusion, Sandler and Enders (Reference Sandler, Enders, Keefer and Loayza2008) note that countries with stronger governance institutions are more likely to have the monetary and fiscal tools to mediate the effects of political violence and terrorism and restore confidence in markets, a trait missing in weaker institutional environments. Chen and Siems (Reference Chen and Siems2004) also show that stronger institutional environments foster better financial sectors, meaning that liquidity is available to promote market stability. On the other hand, in countries where the rule of law is already tenuous, the government response to various acts of political violence may be over-vigorous, based on restrictions and military response rather than confidence-building (Gupta et al. Reference Gupta, Clements, Bhattacharya and Chakravarti2004), and thus increase transaction costs to firms (Brück and Wickstroem Reference Brück and Wickström2004).
As a final point regarding ‘weak’ institutional environments, markets may associate terrorism or collective unrest with larger-scale systemic instability. That is, an assassination could be perceived as a one-off and anomalous event in a strong institutional system, but in a weak institutional environment, repeated bouts of terrorism or uprisings may create regime or institutional uncertainty (even as each individual event may be perceived as unusual but not long-lasting; see Chesney et al. Reference Chesney, Reshetar and Karaman2011). Markets are then uncertain if the next event will be the one which heralds the fall of government, regime change, or even takeover by those aligned with the terrorists. Political violence in a weak institutional environment may thus not just be a one-off event but a harbinger of change in the institutional system itself.
In this sense, political violence – and especially repeated political violence – is a form of information which can be very valuable about the future valuations of firms. Given this reality, I hypothesize that:
H1: Financial markets should react to political violence and incorporate this news into asset prices.
Similar to earnings reports and macroeconomic news, which are communicated directly to markets and cause changes in price based on their firm-specific, sectoral or market-wide effects, political violence should have an immediate informational effect within financial markets. This is not a new or novel point (see Abadie and Gardeazabal Reference Abadie and Gardeazabal2003), as the mere fact that markets react to terrorism means that there must be some informational component (a point shown empirically by Eldor and Melnick Reference Eldor and Melnick2004). Indeed, in the words of Johnston and Nedelescu (Reference Johnston and Nedelescu2006, p. 9) when discussing the terrorist attacks of September 11th, financial markets are well built for ‘digesting the information on the economic and financial impact of the terrorist attacks after an initial shock and efficiently incorporating the information into asset prices so that it could be integrated into decisions about the future’. Coleman (Reference Coleman2012) proves this point in an examination of high-profile terrorist attacks, concluding that modern capital markets are semi-strong efficient in absorbing the information from terrorism (that is, market prices reflect all past fundamental information about stocks as well as all public information currently available, including the possible effect of terrorism). In the face of an unexpected bout of political violence, capital markets should still be able to analyze the possible ramifications and adjust to the information which has been provided. This ability to analyze information would be independent from other institutions within the country, such as an authoritarian governance structure, as it relies almost exclusively on the structure and micro-structures of financial markets themselves.Footnote 3
However, the precise extent of the reaction to political violence and the information revealed via a terrorist attack, uprising, or even foreign conflict should be different. To this end, a follow-on hypothesis is:
H2: Stock market responses to political violence should be differentiated by its modality and its geographic location.
While there is an impressive body of literature on terrorism or political violence and its possible economic effects, the literature lacks an underlying theory on how certain manifestations of political instability should impact the economy (and, in particular, financial markets). While economic institutions are thought of as crucial for the functioning of markets, political instability should offer clues about the future policies enacted by political institutions, which then in turn can affect the economic landscape. And given that various types of political violence can have different political targets or goals, there is likely to be a heterogeneous response by capital markets to different modes of instability. For example, assassinations of specific ministers may result in a change of policy for the better or it may precipitate crackdowns which are patently bad for business; in a similar vein, unrest in a far-off locale may have little ramifications for a firm's cash flows but may generate new fiscal commitments for the sovereign, forcing changes in revenue collection and other policies which could create headaches for businesses in the longer-term. Where the violence is located, how broad an impact it has and what response it provokes are all salient for determining just how much firms should react, and thus the impact on firm returns should be nuanced by mode of violence.
Moreover, terrorism and other forms of political instability should offer financial markets important information about the long-run prospects for the environment in which firms are operating, specifically regarding possible changes in institutions themselves. Political instability can reveal how susceptible political institutions are to political violence: are the rules of the game about change? Seen in this light, the current state of this outer ring of institutions can color market judgments about the effects of terrorism/instability, providing different information depending upon the existing institutional matrix; in this sense, markets may see not only heterogeneous responses to political violence in the form of lower returns, but also higher volatility as the longer-term institutional ramifications take time to appear.
This leads to our third and final hypothesis:
H3: Repeated instability of all types should both depress markets and increase volatility.
Similarly, occurrences of political violence or unrest should also have an impact if they are repeated over time. Python et al. (Reference Python, Illian, Jones-Todd and Blangiardo2019) show that terrorism is contagious, in that terrorism begets terrorism, especially in an environment of low institutional quality, where repeated bouts of terrorism may create regime or institutional uncertainty (even as each individual event may be perceived as unusual but not long-lasting; see Chesney et al. Reference Chesney, Reshetar and Karaman2011). Of course, the continuous stream of terrorism in an environment which has proven resilient may mean that markets themselves are more resilient to bad news and terrorism than markets which are used to stability (Branzei and Abdelnour Reference Branzei and Abdelnour2010); for example, Aksoy and Demiralay (Reference Aksoy and Demiralay2019) show that, during bouts of terrorism in Turkey, Turkish investors received the information efficiently and with a shrug, while foreign investors (perhaps not as attuned to the information being provided) were hardest hit. However, in a study of Israel, a strong institutional environment but one subjected to persistent terrorism, Eldor and Melnick (Reference Eldor and Melnick2004, p. 367) noted ‘markets did not become desensitized to terror’. We could thus anticipate that even higher levels of volatility would accompany a vigorous campaign of destabilization.
III
Political weakness
Historians often depict nineteenth-century Russia as a country with over-centralized and ineffective political institutions, albeit capable of economic success (Davidheiser Reference Davidheiser1992). The Tsar's absolute power is seen as comparable to that in pre-revolution France (Neumann Reference Neumann2008), while the bureaucracy is often portrayed as isolated, unresponsive and poorly supervised, with little interest in the empire's periphery (Yaney Reference Yaney1973; Pearson Reference Pearson1989; LeDonne Reference LeDonne2014; Wcislo Reference Wcislo2014). In this setting, political violence became a regular form of interaction between Russian individuals and the state. Frustrations with the antiquated system of serfdom led to peasant rebellions across Russia (Vucinich and Curtiss Reference Vucinich and Curtiss1968; Moon Reference Moon1992); ironically, attempts to reform and ultimately abolish serfdom also sparked revolt (Finkel et al. Reference Finkel, Gehlbach and Olsen2015). The state's response – as in the case of nationalist uprisings in Poland in 1830 and 1863 and throughout the Caucasus – was to send in the army. The 1860s saw a first major wave of political violence, combining peasant unrest associated with emancipation, student demonstrations and riots against the perceived inadequacy of the ‘Great Reforms’, and the Polish uprising (Naimark Reference Naimark1990, pp. 175–9). Despite the success of the military in every instance of rebellion, the fact that these events kept occurring signaled that the political institutional system was, at a basic level, failing the populace.
After the end of serfdom and the beginning of an important wave of industrialization in the 1870s, violence shifted from the Russian countryside into the cities, with a focus on the assassination of political officials (Siljak Reference Siljak2009). Indeed, Russia is credited as the birthplace of terrorism in its modern form, identified with lone-wolf attacks or shadowy revolutionary groups (Ulam Reference Ulam1977; Geifman Reference Geifman1995; Crenshaw Reference Crenshaw2010). The first phase of populist terrorism climaxed in 1876–81, the heyday of the People's Will (Narodnaya Volya), which assassinated Tsar Alexander II in 1881, in the first recorded use of a suicide bomber (Lewis Reference Lewis2013). An even bloodier wave broke out in the early twentieth century, with casualty figures which were unprecedented. According to Geifman (Reference Geifman1995), between 1900 and 1916, over 17,000 people were murdered in Russia as a consequence of political violence. In 1907 alone, according to Strakhovsky (Reference Strakhovsky1959, p. 357), ‘no fewer than 1,231 officials and 1,768 private persons were killed, and 1,284 officials and 1,734 private persons were wounded’.
Such violence did not replace but rather coincided with large-scale demonstrations. Labor unrest grew as Russia industrialized, with the number of factory workers increasing by approximately 79 percent between 1887 and 1897 (Rimlinger Reference Rimlinger1960a; Friedgut Reference Friedgut1987). Government responses to such unrest – again, typically military in nature – most likely exacerbated the problem.Footnote 4 Thus, political violence in the form of industrial unrest, aided and abetted by the weak political system, often went hand-in-hand with revolutionary violence at the individual level.
… and strong markets
Russia's centralized, arbitrary and repressive political system contrasted oddly with the country's relatively effective financial system. Crisp (Reference Crisp and Cameron1967, p. 183) noted that, from 1856 onward, Russia saw ‘the creation of a fairly advanced and flexible credit system, and a moderately wide money market’. While the depth of Russia's bond markets has been remarked upon elsewhere (Ukhov Reference Ukhov2003), perhaps more interesting than the obligations of the sovereign were the abilities of Russian corporations. Even before Napoleon's invasion, the authorities had established rules for limited liability corporations (from 1805 to 1807), along with full and limited partnerships. The first stocks traded on the St. Petersburg Stock Exchange in the 1830s, followed by a corporate law in 1836 which intended ‘to encourage corporate capitalism in the style of Western Europe’ (Goetzmann and Huang Reference Goetzmann and Huang2018, pp. 580–1) and placed great power in stockholder hands. The Russian state remained involved in the banking sector (Gatrell Reference Gatrell1986) and even private banks were affiliated with quasi-state-owned industrial cartels (Buck Reference Buck2003). Yet, capital markets were mostly left alone and governed by the laws of 1836 (Goetzmann and Huang Reference Goetzmann and Huang2018). It is not entirely clear why successive Tsars adopted such a laissez-faire attitude towards the new financier class. Late in the century, it most likely reflected the recognized need for rapid industrialization, which required mobilizing internal and external sources of finance to fund new enterprises (Mavor Reference Mavor1925) as well as government projects such as the Trans-Siberian railroad (Barkai Reference Barkai1973). Owen (Reference Owen1985) also documents the rise of industrial societies, which had some minor successes in pushing Tsarist economic policy to be more pro-business, especially in relation to foreign investment.
Regardless of the reasoning, the benefits were apparent. The ‘concession system’ introduced by the Law of 1836 (whereby the Tsar signed off on corporate charters) was cumbersome and expensive (Gregg Reference Gregg2020), especially when compared to a general incorporation, but it had its benefits: in particular, it conveyed the court's implicit backing for commerce and encouraged investors to enter the stock market (Owen Reference Owen2002), drawing in stronger firms and providing investors with more (and better) choices (Gregg Reference Gregg2020). While stock market capitalization in Russia remained somewhat low – in 1913, the ratio of stock market value to GDP was 0.18, slightly higher than Argentina (0.17), Chile (0.17), Italy (0.17) and Norway (0.16), and far below that of the Netherlands (0.56) – equity issues were more important in Russia for fixed capital formation than they were in the United States, France or the United Kingdom (Rajan and Zingales Reference Rajan and Zingales2003). Additional reforming legislation in 1893 helped to push the development of capital markets, as the repeal of the ban on futures from the Law of 1836 increased liquidity, spurred the creation of new investment banks to handle initial public offerings (Salomatina Reference Salomatina2014) and (despite unleashing a wave of speculation which brought less-informed investors into the market) did not destabilize the market (Goetzmann and Huang Reference Goetzmann and Huang2018).Footnote 5
By the beginning of World War I, according to Ministry of Finance Yearbooks and data from the Yale International Center for Finance, approximately 613 separate stocks had traded at some point on the SPSE since the middle of the nineteenth century, nearly half of all joint-stock companies established from 1893 to 1901 (Borodkin and Perelman (Reference Borodkin, Perelman, Quennouëlle-Corre and Cassis2011) show that 1,460 joint stock firms were established over this time period). While some state-affiliated concerns were traded on the SPSE (mainly banks, railways and transport firms), the overwhelming number of firms which had placements on the SPSE were trade and industrial businesses (comprising 315 firms or 51 percent of the total – see Table 1). While agricultural firms were not represented, and agriculture still made up a sizeable proportion of Russian GDP in the nineteenth century, the SPSE remained broadly representative of Russian industry and services; this is crucial when one considers that industry and services were precisely the sectors which were growing exponentially in the late nineteenth and early twentieth centuries under Russia's delayed modernization.Footnote 6
Investors in Russian capital markets, millions of rubles as of 1 January

Source: Author's calculations based on data from Ukhov (Reference Ukhov2003) and Bovykin (Reference Bovykin1984).
The broad representation from large swathes of the Russian economy meant that the Russian stock market reaching larger absolute numbers in terms of its size compared with wealthier but smaller exchanges: based on data from Gernandt et al. (Reference Gernandt, Palm and Waldenström2012), Russian stock market capitalization in 1900 was in absolute terms over double the size of the Stockholm Stock Exchange, a much richer country, at approximately US$486 million to approximately US$226 million (see also the calculations done by Taylor Reference Taylor2018).Footnote 7 Of course, this must be tempered by the fact that the populations of the two countries were very different, with Russia having 124.5 million people to Sweden's 5.117 million (this disparity was also reflected in Rajan and Zingales [Reference Rajan and Zingales2003], where Sweden is noted as having a capitalization to GDP ratio of 0.47 to Russia's 0.18).
All of these advantages meant that, ‘despite … limitations, Russian corporations possessed considerable flexibility regarding their selection of organizational structures and financial strategies and exercised these choices in ways that echo modern theories of corporate governance and finance’ (Gregg and Nafziger Reference Gregg and Nafziger2019, p. 448). As Annaert et al. (Reference Annaert, Buelens and Cuyvers2019) note, this flexibility – combined with the stability of Russian bond payments – raised foreign investors’ expectations about the profitability of the St. Petersburg Stock Exchange (which, unfortunately, were not always realized, given the slow rate of growth of the real economy after the financial crisis of the late nineteenth century). However, despite the influx of foreign investment, especially post-1893, Russians themselves were predominantly the beneficiaries of the development of the financial sector: as Table 2, based on data from Ukhov (Reference Ukhov2003) and Bovykin (Reference Bovykin1984), shows, in equity markets, Russian presence was continuously strong, with Russians holding 72 percent of all debt and equity issues of Russian companies in 1913 and 75 percent of all stock offerings in the same year. Across the board, Russian investors outnumbered their foreign counterparts after the reforms of 1893, with the largest participation of foreigners in 1908 equaling just over 30 percent of all equities.Footnote 8
Stocks listed on the SPSE, 1865–1914, by sector

Source: Author's calculations based on data from Goetzmann and Huang (Reference Goetzmann and Huang2018).
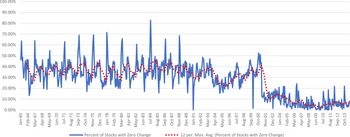
Moreover, the St. Petersburg Stock Exchange also saw increases in its liquidity throughout its existence, increasing much more intensely after the crisis of 1899 ended in 1902 (see Figure 2). Indeed, Goetzmann and Huang (Reference Goetzmann and Huang2018) use a price-weighted metric of months where firms had zero change in their prices, showing a result of approximately 12 percent for the entire sample but a mere 8 percent after the 1893 reforms. Figure 2 shows a similar analysis based on the Ministry of Finance annual yearbooks but without weighting the index for prices, to capture the movement of the whole market and not just its biggest players (effectively, to show the overall market's stagnation or vibrancy across all firms instead of the largest firms – which, in reality, tended to be banks). Using this metric, illiquidity is much higher in the pre-1893 era, with an average of approximately 35–40 percent of all stocks not showing a change and with definite seasonality occurring annually. This tracks somewhat with the London Stock Exchange, where an inverted liquidity measure (unweighted) given by Campbell et al. (Reference Campbell, Turner and Ye2018) shows the percentage of firms with zero change in London in 1865 around the 40 percent mark. In Russia, after February 1901, the movement on the exchange becomes far more vibrant, with stocks not seeing a price change on average closer to (or perhaps a bit under) the Goetzmann and Huang (Reference Goetzmann and Huang2018) average of 8 percent (similar to the evidence presented in Gernandt et al. [Reference Gernandt, Palm and Waldenström2012] for Sweden over the same timeframe). Over the entire sample, the illiquidity metric of prices with zero change is approximately 28 percent.Footnote 9
Liquidity in the St. Petersburg Stock Exchange, 1865–1914
Note: Figure 2 shows both the percentage of stocks which had no change in their month-on-month closing price and the 12-month moving average of the percentage of stocks with no change (to lessen seasonality).

Finally, in terms of information, as well, Russian markets had access to up-to-date financial news via the major international wire services, while a nascent but growing financial press in the country accompanied the expansion of the stock market (in stark contrast to the prevalence of censorship from the Tsar's officials for other publications). As Borodkin and Perelman (Reference Borodkin, Perelman, Quennouëlle-Corre and Cassis2011, p. 103) stated, financial information was even ‘included in the official statistical compilation published by the Ministry of Finance, the Ezhegodnik (Yearbook), starting in 1865’. In fact, recognizing the value of financial information, Tsarist authorities attempted to manipulate the French press from 1904 to 1906 to assure investors that Russian bonds were still worth buying (Long Reference Long1972). Accompanying the dissemination of financial information was the concurrent development of what would today be known as ‘investigative reporters’, a dedicated cadre of newspaper employees who ‘enhanced the concept of supplying news as a public service’ (McReynolds Reference McReynolds1990, p. 284). In many regards, Russia was even ahead of the UK, a world leader in disseminating financial information, as Russian financial dailies (or at least three times a week) began in the 1860s while London's dailies began in the 1880s (Taylor Reference Taylor, Schifferes and Roberts2014).Footnote 10 While by no means a perfect conduit for all information, Tsarist financial markets did in fact have excellent access to news via broadsheet dailies and official publications, and a somewhat competitive market to help filter rumors from facts.
IV
The data
The contrast between Russia's relatively deep financial markets – which financed the same rapid industrialization that brought about the waves of political unrest already noted – and the reactionary responses that the violence prompted gave late imperial Russia its distinctive character. For our purposes, the combination of liquid, relatively advanced, well-documented financial markets with high levels of terrorist and other political violence offers the opportunity to examine the interaction of these two phenomena in a new context.
Given the relative sophistication of Russian markets, market index information from the St. Petersburg Stock Exchange (SPSE) is available on a monthly basis back to 1865; the SPSE data come from the excellent work of the St. Petersburg Stock Exchange Project at Yale (see Goetzmann and Huang Reference Goetzmann and Huang2018).Footnote 11 As is standard in the financial literature, broad market index returns are taken as a proxy for financial responses, with monthly returns calculated as the log change in prices (p):
 $$R_t = {\rm log}\left({\displaystyle{{P_t} \over {P_{t-1}}}} \right)$$
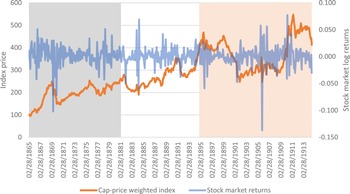
Figure 3 gives a sense of the scale of monthly returns of the SPSE from February 1865 to July 1914 versus the behavior of the index. The SPSE's returns appear to be clustered in the -5 to 5 percent range over the entire half-century examined here with the exception of major losses occurring during May 1869 (when the stock market dropped approximately 10 percent) and the largest drop of all (13.7 percent) in November 1905, at the height of the unrest surrounding the revolution of 1905. Over the entire period surveyed here, the average return from the SPSE compared favorably with the New York Stock Exchange (NYSE), with an average of 0.10 percent for SPSE versus 0.04 percent for NYSE, and even the worst losses on the SPSE were less than seen in the NYSE in the nineteenth and twentieth centuries (Schwert Reference Schwert1990).
Monthly log returns in the St. Petersburg Stock Exchange versus index data
Source: Author's calculations from Goetzmann and Huang (Reference Goetzmann and Huang2018) data.

The true innovation in the study comes, however, not from these particular financial data, but from the data on political volatility in Russia in the nineteenth century. The taxonomy of volatility is shown in Appendix Table A1, along with how the events were chosen, and forms the basis for exploring the effects of terrorism on the financial variables of interest throughout this article. Using several Russian- and English-language sources (see also the Appendix), I have hand-coded instability in the country according to their modality, target and where they occurred geographically to create a brand-new monthly database. In particular, the demarcation by place is done to capture both possible spatial effects of terrorism and the peculiarities of the Imperial Russian financial press; as noted in Rantanen (Reference Rantanen1997, p. 613), ‘news bulletins provided by Russian agencies did not carry headlines and appeared in random order, separated only by an indication of the transmission place (not country) and date… as a result, the place and date became the most important distinctive feature of each news telegram’. Thus, the place where instability occurred could be important for how firms should react, but it is also important for how the news was assimilated. An example of one month from the database is also shown in the Appendix.Footnote 12
In addition to utilizing dummies for terrorist events in Russia and, noting that political instability tends to cluster in waves, I also construct cumulative measures of terrorism, coded from 0 to 12, of the number of months in which a terrorist attack occurred within the previous 12 months. For example, if – as during the height of the socialist revolutionary campaign against the Tsar – there were assassinations in the 10 months preceding, say, October 1904, the month of October 1904 would have a value of 10 in the database. In this manner, I can test econometrically if it was not just an isolated incident of terrorism but rather a pattern of instability which led to different financial market responses (as shown in Kutan and Yaya Reference Kutan and Yaya2016).
The models
To examine all of the hypotheses noted above, our preferred approach for understanding the effects of political violence is based on a standard GARCH volatility model using quasi-maximum likelihood estimation methods. However, given the exigencies of the Russian financial markets, the probability of differential effects over shorter periods and effects which induce permanent changes, and the reality that volatility in one period is likely to have influenced returns in subsequent periods, an Asymmetric Component GARCH-in-Mean (ACGARCH-M) model is used to capture not only the effect of terrorism on the three financial metrics but also on the long-term (permanent) and short-term (transient and decaying) volatility of these instruments.Footnote 13 The model is structured as:
 $$Y_t = \mu + \gamma Y_{t-1} + \pi x_t + \rho M_t^{\prime} + \delta \sigma _t^2 + \varepsilon _t$$
Where Yt is the total market return, Yt-1 is returns lagged one period to alleviate autocorrelation concerns, and the X variable is the chosen proxy for political unrest within this particular model.Footnote 14 Given the aggregated monthly nature of the data, and the fact that the market effects of an attack may dissipate quickly, the political violence is examined contemporaneously with the aggregate monthly financial market indicator rather than lagging it (which could be done if daily data were available). On the other hand, in equation 2, M is a vector of macroeconomic and global financial controls representing the performance of alternative asset classes and attempting to capture the overall health of the Russian economy. Given the limitations of data on Russia's economy in the eighteenth and nineteenth centuries (and also the difficulties in having GARCH models converge with an unwieldy set of explanators), I use a necessarily parsimonious set of plausible covariates:
• Gold returns: a proxy for global economic conditions, measured as the log change in world gold prices month-on-month, based on underlying data from the Global Financial Database;
• Ruble/Dutch Guilder exchange rate returns: a proxy for Russian economic conditions, measured as the log change in the exchange rate month-on-month, also from the Global Financial Database;
• Drought intensity: an additional proxy for economic conditions in the largely agrarian and agrarian-dependent economy (see below); and
• Tsar transition: a dummy for the month in which a Tsar died and a new one ascended the throne, as a proxy for overall political volatility (coded by the author).
These variables are for the most part straightforward, apart from perhaps the drought intensity measure. The European Russia Drought Atlas (ERDA) provides a dataset of annual observations on drought intensity in European Russia from 1400 to 2016. As the website notes, the ERDA ‘is a one-half degree gridded reconstruction of summer Palmer Drought Severity Indices estimated from a network of annual tree-ring chronologies in European Russia and surrounding countries’. The data used here are from all the weather stations coded GP2666 to GP3513, selected as these were the prime growing regions of the Russian Empire, today comprising portions of Belarus, nearly all of Ukraine and all of Russia's black earth region. In practice, this meant collecting stations running from longitude of 25 degrees east (near modern-day Obravo in Belarus) to 48 degrees east (the river basin outside Astrakhan) and capturing a latitude band from 47.25 north (near Rostov) to 52.25 north (also in modern-day Belarus). An average was put together across all 847 of these stations to create a drought-intensity indicator for the year: the original Palmer scale was transformed into a 0 to 3 scale, with raw Palmer data from 0 to -1.99 coded as ‘normal’ (a zero), -2 to -2.99 coded as ‘moderate’ (1), -3 to -3.99 coded as severe (2) and -4 and below coded as ‘extreme’ (3). Thus, higher numbers indicate higher drought intensity across Russia.
Additionally, the volatility term is included in the level equation (making it an ARCH-in-Mean specification) here as σ 2, but this is a placeholder in the baseline as the exact composition of the volatility term will be determined by comparison of models by distribution, optimization and step method; thus, the model could retain the GARCH-modeled volatility as shown in equation 2 or could use another transformation such as ln(σ 2) or  $\sqrt {\sigma ^2} $ if these models prove superior according to commonly used information criteria (i.e. Akaike or Schwarz).
The long-term volatility relationship is modeled as:
 $$q_t = \omega + \alpha ( {q_{t-1}-\omega } ) + \gamma ( {\varepsilon_{t-1}^2 -\sigma_{t-1}^2 } ) + \theta _1Z_{1t}$$
Where q t is the time-varying long-run (permanent) volatility of the underlying financial instrument, also known as the conditional variance, which measures the extent of the underlying volatility that can be attributable to the shock (in this case, political violence). Equation 3 reflects the shock from political violence and effects stemming from the controls of vector M shown in equation 2, but which also converges to the time-invariant volatility level ω at a speed of γ (that is, the closer the estimated value of γ is to unity, the slower the modeled long-term volatility reverts to the mean). In this manner, we can capture the persistence of volatility in response to shocks to the system. Equation 3 includes vector Z, the variable of interest, a set of exogenous variables which influence volatility: in the model, this is represented by political volatility, both informal (political violence) and formal (change of ruler).
Finally, the short-term conditional volatility is modeled as:
 $$\sigma _t^2 -q_t = \beta _0( {\varepsilon_{t-1}^2 -q_{t-1}} ) + \beta _1( {\varepsilon_{t-1}^2 -q_{t-1}} ) d_{t-1} + \beta _2( {\sigma_{t-1}^2 -q_{t-1}} ) + \theta _2Z_{2t}{\rm \;\;}$$
Representing the transitory component of shocks, where the effect of political violence decays at the rate of β 0 + β 2. In equation 3, d is included to capture asymmetric effects, a dummy variable indicating whether a negative shock is present. If β 1 > 0, there is a leverage effect present in the model, whereby negative news (in this case, terrorism) impacts the short-term conditional variance more than positive news (emanating from, for example, positive macroeconomic conditions). As with the long-term volatility, the Z vector in equation 4 also captures the effects of political instability, most prominently the impact of terrorism. Given the exigencies of the dataset, the data are modeled using the Student's T distribution (although, in some rare instances, the generalized error distribution (GED) returned a better model as measured by information criteria).
V
Testing Hypothesis 1 requires merely matching data on political volatility with financial markets in the aggregate; that is, if political volatility of different forms happened anywhere in the Russian Empire, it should have had an effect on capital markets. This test, using the AC-GARCH-M specification shown above, is performed in Table 4 for each type of political volatility: with the exception of successful assassinations, all other types of political violence – including attempted assassinations, collective unrest and external conflict – have a profoundly negative effect on capital market returns (reducing returns by as much as 5 percent in the case of war). Importantly, attempted assassinations and collective unrest also raise the volatility of stocks in the long run, increasing the predicted log of variance in the models by 0.3 percent in the case of attempted assassinations (and by 0.2 percent in the case of collective unrest). Clearly, political violence did have an effect on Tsarist financial markets, confirming Hypothesis 1.
Summary statistics for variables in the analysis

AC-GARCH-M regressions, stock returns versus political violence anywhere in the Russian Empire

Note: Absolute value of t-statistics under coefficients. ***, ** and * denote significance at the 1, 5 and 10% levels respectively.
Of more interest, as noted above, are the longer-term heterogeneous effects of political instability on equity markets (Hypotheses 2 and 3). The results from ACGARCH-M models for each individual event of political instability are shown in Table 5, broken down by the specific type of political volatility. Across models, assassinations, unrest and war have a uniformly negative effect on Russian equity markets; interestingly, the effects on equities from attempted and successful assassinations in Russia rather than in the imperial territories are much more muted, with each attempted assassination in Russia corresponding to a 0.8 percent drop in returns in the St. Petersburg Stock Exchange (significant at the 1 percent level) and each successful assassination showing a 0.6 percent drop in returns (but only significant at the 10 percent level). This effect was far outweighed by other negative consequences of political instability, including unrest in Russia (which saw a drop of 3 percent in returns) and successful assassinations in the imperial territories (a decrease of 6 percent). It is thus perhaps plausible to conjecture that investors were more worried about collective unrest and especially terrorism occurring in far-flung regions of the empire rather than assassinations of specific members of the cabinet in St. Petersburg. Indeed, in most instances of assassination of members of the Russian government, policy reform slowed, and reactionary members took charge, those most unlikely to rock the boat: as an example, the assassination of reformist Pytor Stolypin in 1911 led to the ascension of Vladimir Kokovtsov, who was steadfastly against any expansion of democracy or even transparency in the state's finances (Turnbull Reference Turnbull1989). When broken down by location and modality, volatility effects are much more muted, as only war and attempted assassination in the imperium raised permanent levels of volatility marginally significantly, although assassination attempts in the periphery of the empire also resulted in much higher levels of volatility in the periods surrounding the event itself.
ACGARCH-M regressions, stock returns versus different types of political violence (by location)

Note: Absolute value of t-statistics under coefficients. ***, ** and * denote significance at the 1, 5 and 10% levels respectively.
Finally, in order to test Hypothesis 3 on the effect of the 12-month cumulative political violence indicators, we utilize the same ACGARCH model as shown in equations 2 through 4; the results are shown in Table 6. A caveat is in order: while the cumulative metric may capture entirely the market response to multiple instances of instability, it may also inadvertently capture government responses to prior acts of terror, i.e. if the Tsarist government created an environment which was unfavorable for business. While this analysis cannot thus pinpoint the exact magnitude of the effect of cumulative instability, in some sense it does not matter, because financial markets should also react to the possible cumulative effects of terrorism and response and not just to the act itself.
ACGARCH-M regressions, stock returns, cumulative political volatility

Note: Absolute value of t-statistics under coefficients. ***, ** and * denote significance at the 1, 5 and 10% levels respectively.
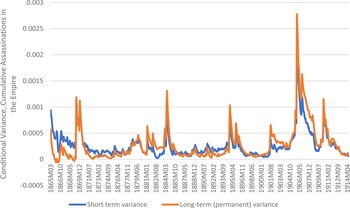
As with the individual attacks, the effects of terrorism on the stock markets translated into lower returns and higher volatility in the long run for specific types of political instability, but the effects in the imperial territories dominated those in Russia proper. Cumulative attempted assassinations and unrest in the imperium had the most pronounced effect in depressing returns, with a decrease in returns of 0.8 percent for each additional attempted assassination or 0.5 percent for each additional incident of unrest. Successful assassinations in Russia proper also had a negative effect on returns but this effect was even more pronounced for collective unrest in Russia, with a decline of 0.3 percent for each event of political violence in the preceding 12 months. Volatility only appeared to be important for collective unrest in the imperium, significantly increasing the log of variance in the long term (i.e. as a permanent shock over the 49 years surveyed here). As a visual representation, the conditional volatility generated by the ACGARCH model for unrest in the imperial territories is shown in Figure 4, and the effects of political violence are clearly discernible. In particular, long-term volatility sees peaks after the assassination of the Tsar and the waves of terrorism in the 1890s, and a massive spike in the run-up to and during the revolution of 1905. For cumulative political violence, it thus appears that the size of the instability – and especially if collective violence occurs – is more important for market responses. This is in line with our theory, outlined above, that recurring collective unrest can signal a threat to the regime more than the removal of one specific leader.
Implied volatility of stock returns, short-term conditional variance and permanent component, unrest in the imperial territories model
Source: Generated from ACGARCH model including cumulative assassinations. Shown is the overall volatility of the St. Petersburg stock market based on the model including cumulative assassinations, decomposed into short-term ( $\sigma _t^2 -q_t\;$from equation 4) and long-term (permanent) components (q t from equation 3).

Robustness tests
While these results appear to point to a consistent dampening effect of political volatility on stock market returns in the Russian Empire, it is important to consider a variety of other effects which could be driving these results. To this end, we perform a battery of robustness tests to see if the baseline results from Table 4 continue to hold.
In the first instance, looking specifically at the unrest variables, a conscious decision was made to exclude the Russian incursions into the Caucasus in the nineteenth century, as this effectively represented a war of conquest rather than internal political violence. However, the slow acquisition of the Caucasus did generate internal dissent and, while much of the formal conquest was completed by 1864 (i.e. a year before the dataset begins), there were still sporadic rebellions and uprisings connected with the conquest (e.g. the Svaneti rebellion in 1875). Thus, to test if the Caucasus had any effect on stock markets, we use an alternate dummy for unrest including uprisings in Georgia, Azerbaijan, Armenia or the northern Caucasian districts (Dagestan and Chechnya), both for the month in which unrest occurred and also a cumulative metric. These results are shown in Table 7; the effect is even stronger than shown in Table 3, as each incident of unrest throughout the imperial territories and including the Caucasus lowers stock returns by approximately 4 percent. In the cumulative regressions, each individual act of rebellion leads to a 0.02 percent drop in returns, meaning that a year of rebellion would result in returns on average 0.24 percent lower than in the absence of unrest.
Robustness test: the Caucasus wars

Note: Absolute value of t-statistics under coefficients. ***, ** and * denote significance at the 1, 5 and 10% levels respectively. The unrest variable in this regression is expanded to take into account formal military activities occurring in the Caucasus (Chechnya, Dagestan, Georgia) from 1865 onward.
This extension of the unrest dummy could plausibly be expected, however, as the Russian government invested much time, energy and money in pacifying the troublesome Caucasus nations. On the other hand, what if other economic policies under the Tsar were driving stock returns rather than wars of conquest? In particular, Russia was on the classical gold standard from 1897 to 1914 (Drummond Reference Drummond1976), and this coincided with a period of both rapid industrialization and growth in the stock market, driving foreign investors into the equity exchanges (Gregory Reference Gregory1979) and ‘reinforc[ing] Russia's image as a reliable investment destination’ (Borodkin and Perelman Reference Borodkin, Perelman, Quennouëlle-Corre and Cassis2011, p. 98); therefore, it is plausible that the gold standard was a driving factor in stock market returns and not political violence. Table 8 shows a series of the empire regressions including a dummy for each month that Russia was under the gold standard, and, apart from the successful assassinations model, the gold standard dummy is insignificant as an explanator of returns. More importantly, the results hold for all types of political volatility, from a drop of approximately 1 percent in returns for attempted assassinations and successful assassinations anywhere in the Russian Empire to a drop of 6 percent in the face of external conflict.
Robustness test: Russia under the gold standard

Note: Absolute value of t-statistics under coefficients. ***, ** and * denote significance at the 1, 5 and 10% levels respectively. Model 3 did not have a significant GARCH-in-mean term and thus the model used was an AC-GARCH rather than AC-GARCH-M.
If it was not the precise economic policies from the Winter Palace that were driving stock market movements, perhaps it was the style of governance of the particular Tsar, which could have changed investor attitudes and/or strategies. To account for the three Tsars who ruled during the timeframe of this dataset, I also include a dummy for Alexander II and Alexander III (leaving out Nicholas II, who ruled for all of the gold standard time and three years beforehand). Again, using the whole empire regressions, Table 9 shows that there was little difference in terms of stock returns for different Tsars, with the Tsar dummies (replacing the transition dummy) insignificant. Controlling in the regressions for the different Tsars has no effect on the political volatility variables apart from making their economic and statistical significance stronger, as in the case of unrest, which is now associated with a drop in returns of 4 percent. There also is a slightly significant uptick in long-term volatility in three out of the four models due to political volatility.Footnote 15
Robustness test: market behavior under different Tsars

Note: Absolute value of t-statistics under coefficients. ***, ** and * denote significance at the 1, 5 and 10% levels respectively.
Finally, as noted above, liquidity in the St. Petersburg stock market appeared to be on a rollercoaster of a ride, especially from its early days, before settling in the early twentieth century as more investment was drawn into the market. Low liquidity can feed volatility (Będowska-Sójka and Kliber Reference Będowska-Sójka and Kliber2019), and thus it is plausible that episodes of low liquidity in Tsarist Russia could have been driving both the returns and volatility results. As data on turnover and daily highs and lows are not available for much of the period in question, we revert to the indicator shown in Figure 2, namely the percentage of stocks within a month which displayed no price change from the previous month; thus, a higher value for this indicator is associated with more illiquidity. The GARCH regressions controlling for illiquidity are shown in Table 10, again for political volatility anywhere in the empire, and, while the models are less desirable than the baselines (as measured by their AIC), they show incredibly strong effects for political volatility, far greater than in the baseline regressions. In particular, the significance for both attempted and successful assassinations have t-stats over 10; at the same time, external conflict appears to have no effect on returns but its effects now manifest in volatility, with significant dampening of short-term volatility but a large increase in the long-term/permanent conditional variance. Liquidity itself behaves somewhat counterintuitively, with low liquidity associated with higher returns in models 1 and 4, but only at the 5 and 10 percent levels respectively; it is possible that this is a statistical artifact made by the illiquidity measure, i.e. the percentage of firms whose prices do not change, so that when firms attain a certain level of valuation they pause and consolidate – showing up as liquidity. The presence of a ‘threshold effect’ is not tested here but could be an area for future research.
Robustness test: the effects of liquidity

Note: Absolute value of t-statistics under coefficients. ***, ** and * denote significance at the 1, 5 and 10% levels respectively. Liquidity is defined, as noted in the text, as the percentage of firms in the stock market with no change in their prices from month to month; lower percentages indicate more liquidity.
The original regressions from Table 4 separating out the political volatility by location are also rerun in Table 11 with liquidity as a control, and there are similar effects: if anything, the effect of unrest occurring in Russian imperial territories is magnified when controlling for liquidity, with unrest (for example) resulting in a statistically significant decrease of 8 percent in returns. The only real change in these regressions is that the effect of attempted assassinations in Russia becomes insignificant but, when liquidity is accounted for, its effect shifts to volatility, with each attempted assassination associated with higher levels of long-term volatility. In any event, in this robustness test – as in the others – the negative effect of political volatility on stocks in Tsarist Russia is confirmed.
Robustness test: the effects of liquidity by type of political volatility

Note: absolute value of t-statistics under coefficients. ***, ** and * denote significance at the 1, 5 and 10% levels respectively. Liquidity is defined, as noted in the text, as the percentage of firms in the stock market with no change in their prices from month to month; lower percentages indicate more liquidity.
VI
This article has taken an extensive look at the financial effects of terrorism and other forms of political instability in nineteenth-century Russia. Building on a unique database of terrorist activity and political unrest, the results of the econometric analysis showed that financial markets in Tsarist Russia reacted in a similar way to that shown in the vast literature on terrorism and political violence in modern markets, absorbing the information in an adaptive manner but showing negative effects related to the outbreak of violence; as an example, Markoulis and Katsikides (Reference Markoulis and Katsikides2020) do an extensive tour of modern-day terrorism and its effects on capital markets, showing that responses generally range from no response to as much as an 8 percent drop in stocks (associated with the Madrid train bombings in 2004). Likewise, the effects of political violence show up in the month in which such violence occurred, a result in line with modern examinations of terrorism, which find that effects dissipate (depending on the circumstances) anywhere from one day (Aslam and Kang Reference Aslam and Kang2015) to a week (Brounen and Derwall Reference Brounen and Derwall2010) to as many as 19 days after an event (in the case of the September 11th attacks, as shown in Nikkinen and Vähämaa Reference Nikkinen and Vähämaa2010).Footnote 16 Also in line with our hypotheses, given the institutional matrix that was Tsarist Russia, unrest and persistent terrorism seemed to have created more doubts about the regime's viability and increased longer-term volatility in addition to lowering returns. This too was separated out based on the modality of instability, showing how Russian financial markets were nuanced about the heterogeneity of terror. This result was robust to a battery of sensitivity tests and alternate specifications, suggesting that political violence in the Russian Empire was bad for business … or at least perceived so by investors.
The extensions to this work are many and go far beyond the issue of political violence to encompass all manner of topics in the political economy of finance. In the first instance, the approach outlined here may be utilized for other countries with perhaps more robust market data (including on market microstructure), allowing for more direct testing of market efficiency in the face of political violence (including better and more recent metrics for quantifying liquidity). At the same time, expanding our knowledge of Russia's equity markets – say, via digitizing daily data obtained from archives in St. Petersburg and Moscow, a process which has begun in conjunction with the larger project associated with this article – could also help to illuminate the particular case of Tsarist Russia. The terrorism/instability database amassed for this project could also be used in various ways, perhaps as an extension to work such as that done by Annaert et al. (Reference Annaert, Buelens and Cuyvers2019), to examine how political violence affected Russia stocks abroad and foreign investor perceptions in their own countries. Regardless of the precise direction, the issue of political instability and financial markets, especially in an age of populism, geopolitical uncertainty and a revanchist Russian imperial project, is an evergreen one, and more lessons should be examined from financial history to inform the present.
Appendix: Data sources and method
Terrorism and political instability
A number of sources were consulted for creating the database on political volatility in Russia during the Tsarist era. Where necessary, they are noted in the text, but a complete list of scholarly literature and compilations from which the dating was taken appears below:
Ascher, A. (2002). P. A. Stolypin: The Search for Stability in Late Imperial Russia. Palo Alto, CA: Stanford University Press.
Crenshaw, M. (2010). Terrorism in Context. State College, PA: Pennsylvania State University Press.
Donnorummo, R. P. (1987). The Peasants of Central Russia: Reactions to Emancipation and the Market, 1850–1900. New York: Garland.
Finkel, E., Gehlbach, S. and Olsen, T. D. (2015). Does reform prevent rebellion? Evidence from Russia's emancipation of the serfs. Comparative Political Studies, 48(8), pp. 984–1019.
Friedgut, T. H. (1987). Labor violence and regime brutality in tsarist Russia: the Iuzovka Cholera Riots of 1892. Slavic Review, 46(2), pp. 245–65.
Haberer, E. (2004). Jews and Revolution in Nineteenth Century Russia. Cambridge: Cambridge University Press.
Klibanov, A. (1984). Problems of the ideology of peasant movements (1850s–1860s). Russian History, 11(2/3), pp. 168–208.
Kolchin, P. (2009). Unfree Labor. Cambridge, MA: Harvard University Press.
Laqueur, W. (2001). A History of Terrorism. New York: Transaction Publishers.
Lauchlan, I. (2001). The accidental terrorist: Okhrana connections to the extreme-right and the attempt to assassinate Sergei Witte in 1907. Revolutionary Russia, 14(2), pp. 1–32.
Longley, D. (2014). Longman Companion to Imperial Russia, 1689–1917. New York: Routledge.
Mavor, J. (1914/1925). An Economic History of Russia, vol. II. London: J. M. Dent & Sons.
Moon, D. (1992). Russian Peasants and Tsarist Legislation on the Eve of Reform: Interaction between Peasants and Officialdom, 1825–1855. Berlin: Springer.
Owen, R. (1977). Demonstrations in Russia 1876–1976. Index on Censorship, 6(1), pp. 41–6.
Perris, G. H. (1905). Russia in Revolution. New York: Chapman & Hall.
Ruud, C. A. and Stepanov, S. (1999). Fontanka 16: The Tsars' Secret Police. Toronto: McGill-Queen's University Press.
Siljak, A. (2009). Angel of Vengeance: The Girl Who Shot the Governor of St. Petersburg and Sparked the Age of Assassination. London: St. Martin's Press.
Ulam, A. B. (1977). Prophets and Conspirators in Pre-Revolutionary Russia. New York: Transaction Publishers.
Valk, S. N. (1961a). Krest'ianskoe dvizhenie v Rossii v 1796–1825 gg.: sbornik dokumentov. Moscow: Akademia Nauk USSR.
Valk, S. N. (1961b) Krest'ianskoe dvizhenie v Rossii v 1826–1849 gg.: sbornik dokumentov. Moscow: Akademia Nauk USSR.
Vucinich, W. S. and Curtiss, J. S. (1968). The Peasant in Nineteenth-Century Russia. Palo Alto, CA: Stanford University Press.
The rubric used to classify an event was rather simple, as shown in Table A1 below.
Classifications of political volatility and how events were chosen

In addition to the published works and research utilized for identifying events and their occurrence, a number of international newspapers were consulted to double-check dates and ensure that consistency was kept with new-style dating as opposed to the old-style dating used during the nineteenth century. These newspaper accounts were also used to verify that these events were reported widely, with no discernible lag, so that the event actually became a source of information for financial markets. For example, the assassination of the Governor-General of Finland, Nikolai Bobikov, in June 1904 was reported on the same day as its occurrence by the Press Democrat, a small Northern Californian (Santa Rosa) paper with a modern-day circulation of 54,000 and which, as a local paper, had no real business publishing such an event half a world away. Publication of these events around the globe confirms that news of this political volatility was widespread.
The full list of attempted assassinations, assassinations, unrest and external conflict is available as an online appendix so that other researchers may make use of it, as this database represents a contribution to the literature on political volatility in Russia throughout the nineteenth century.
Stock data
For the monthly data, a hearty thanks is due to the St. Petersburg Stock Exchange Project at Yale University, whose researchers have created a monthly stock index for the SPSE.
Drought data
As mentioned in the main text, the European Russia Drought Atlas (ERDA), available at www.ncdc.noaa.gov/paleo-search/study/28630, provides a rich dataset of annual observations on drought intensity in European Russia from 1400 to 2016. The drought intensity variable is generated as noted in the main text. In reality, Russia suffered two threats of drought during the period in question, in the period from 1890 to 1893 and then again from 1905 to mid 1906 (see Figure A1).
Drought intensity in Russia, 1865–1914

Macroeconomics data
The price of gold and the ruble/guilder exchange rate (see Figure A2) came from the Global Financial Database; these were then transformed into return series similar to the stock exchange returns noted in the text. Additional variables used in the robustness tests, such as the gold standard dummy, take the value of 1 in months where Russia was on the gold standard and 0 otherwise (in reality, covering mid 1897 through 1914). The Tsar transition data (not, strictly speaking, macroeconomic data) was coded by hand based on the month in which a new Tsar took power, and for this timeframe included two transitions, from Alexander II to Alexander III after Alexander II's assassination in 1881 and from Alexander III to Nicholas II in November 1894 (after the death of Alexander III from kidney disease). Similarly, the Tsar dummies utilized in the robustness tests took the value of 1 for each month that that specific Tsar was in power and zero otherwise.
Ruble/guilder returns, 1865–1914

Additional robustness test
As noted in the text, and as suggested by an anonymous referee, an additional robustness test was carried out utilizing interaction terms with the Tsar dummies and political violence. Interaction terms are very rare in GARCH modeling, usually due to the problems with convergence, and this was also a factor here. However, where convergence was achieved, the inclusion of the interaction terms showed little effect and in two out of the three models, worsened the overall fit of the model (as demonstrated by AIC and log likelihood criterion). The fourth model from the text, external conflict, needed to be dropped as the interaction terms introduced a near singular matrix, i.e. almost perfect collinearity. As can be seen, the baseline effects are little changed.
Robustness test: interactions between Tsar dummies and political volatility

Example from the database: January to March 1905 and February 1908

This excerpt from the political violence database shows the text accompanying the dummies listed in the database used for the analysis in the main text. For each month shown here with a corresponding event, the dummy would be coded as a 1 while empty cells would be coded as a 0. Thus, the dummies here measure ‘event inceptions’, i.e. if any event occurred in the month, rather than intensity (i.e. how many events occurred).






 Open access

