


Introduction
While many people strive to eat healthier diets, breaking bad eating habits and resisting unhealthy temptations often prove challenging. For example, people may struggle to adhere to their health goals when confronted with widely available tempting unhealthy foods, especially during stressful days or when time is limited (e.g., Hill et al., Reference Hill, Conner, Clancy, Moss, Wilding, Bristow and O'Connor2022). These situations can undermine individual health goals and present obstacles to effectively implementing self-regulation strategies (Wenzel et al., Reference Wenzel, Bürgler, Rowland and Hennecke2021). The consequences of unhealthy diets (e.g., overweight, high blood pressure, diabetes, social stigmatization) affect both the individual and society (Wallace and Baumeister, Reference Wallace and Baumeister2002). The high and rapidly rising number of obese people is associated with severe consequences at the population level, including increasing health expenditures, lower life expectancy and reduced work productivity. In fact, obesity has tripled since 1975, with 13% of adults in the world being obese in 2016 (WHO, 2022). Historically, researchers and policymakers typically individualized the problem of obesity (Polivy and Herman, Reference Polivy and Herman2002), but this narrative is changing with a growing emphasis on the interaction between the individual and their environment (e.g., Marteau et al., Reference Marteau, Hollands and Fletcher2012, Reference Marteau, White, Rutter, Petticrew, Mytton, McGowan and Aldridge2019; Bauer and Reisch, Reference Bauer and Reisch2019; Hollands et al., Reference Hollands, Carter, Anwer, King, Jebb, Ogilvie, Shemilt, Higgins and Marteau2019; Bauer et al., Reference Bauer, Nielsen, Hofmann and Reisch2022). Public policy interventions also increasingly target food environments to facilitate healthier choices (Marteau et al., Reference Marteau, Hollands and Fletcher2012; Reisch et al., Reference Reisch, Sunstein and Gwozdz2017; Thaler and Sunstein, Reference Thaler and Sunstein2021). For instance, food environmental interventions have effectively promoted healthy dietary choices by setting healthy food as the default in canteens (e.g., Friis et al., Reference Friis, Skov, Olsen, Appleton, Saulais, Dinnella, Hartwell, Depezay, Monteleone, Giboreau and Perez-Cueto2017), taxing sugary drinks (e.g., Colchero et al., Reference Colchero, Rivera-Dommarco, Popkin and Ng2017) and introducing food labelling to more easily identify healthy and unhealthy foods (e.g., Cecchini and Warin, Reference Cecchini and Warin2016).
People who struggle to resist unhealthy food temptations would generally benefit from the implementation of public food policies that reduce the likelihood of dietary goal failure. However, in democratic countries, the implementation of food policies typically depends on sufficient public acceptance (Reynolds et al., Reference Reynolds, Stautz, Pilling, van der Linden and Marteau2020), and policymakers are often hesitant to implement unpopular policies. Widespread policy acceptance reduces the risks of strong reactance effects like ignorance or protests (Brehm and Brehm, Reference Brehm and Brehm2013) and facilitates greater policy compliance (e.g., Ajzen and Fishbein, Reference Ajzen and Fishbein1970).
Prior research has identified different drivers of and barriers to public policy acceptance in the health domain, including socio-demographic factors (e.g., gender, income; Goren et al., Reference Goren, Harris, Schwartz and Brownell2010; Lems et al., Reference Lems, Hilverda, Broerse and Dedding2019; Cerezo-Prieto and Frutos-Esteban, Reference Cerezo-Prieto and Frutos-Esteban2020), psychological factors (e.g., trust in the government, problem awareness; Sunstein et al., Reference Sunstein, Reisch and Rauber2018) and policy-specific determinants (e.g., policy transparency, intrusiveness, effectiveness, fairness and the perceived costs and benefits of the policy; Capacci et al., Reference Capacci, Mazzocchi, Shankar, Brambila Macias, Verbeke, Pérez-Cueto, Kozioł-Kozakowska, Piórecka, Niedzwiedzka, D'Addesa, Saba, Turrini, Aschemann-Witzel, Bech-Larsen, Strand, Smillie, Wills and Traill2012; Buykx et al., Reference Buykx, Gilligan, Ward, Kippen and Chapman2015; Donaldson et al., Reference Donaldson, Cohen, Rutkow, Villanti, Kanarek and Barry2015) (for a review, Grelle and Hofmann, Reference Grelle and Hofmann2024). Despite this, the literature on policy acceptance currently lacks a more comprehensive assessment of the role of dietary goal success and failure in food policy acceptance. This is surprising, considering that people experiencing repeated dietary goal failure may particularly benefit from policies promoting healthy food choices. A better understanding of food policy acceptance and its determinants among those who struggle to eat healthier is important for numerous reasons, most prominently that these people are most likely to experience individual welfare gains. This study investigated the alignment between dietary goal failure and policy acceptance. Our results, therefore, have direct implications for public policy development and implementation.
Dietary goal failure and food policy acceptance
The evidence of public policy acceptance among those who face difficulties living a healthier and more sustainable life is mixed. Reviewing the literature on health policy acceptance, Diepeveen et al. (Reference Diepeveen, Ling, Suhrcke, Roland and Marteau2013) found that smokers and regular alcohol consumers were less accepting of policies aimed at decreasing smoking and alcohol use. However, research on dieting is lacking, which calls for more studies to understand better whether and when people with unhealthy eating habits accept policies targeting their behaviours. Oliver and Lee (Reference Oliver and Lee2005) found that overweight and obese participants supported regulating junk food advertising and eliminating fast-food concessions in schools. Similarly, participants who wished to change their diet were more supportive of food policies (see also Kukowski et al. (Reference Kukowski, Bernecker, Nielsen, Hofmann and Brandstätter2023) for related evidence regarding meat-eating). However, Hagmann et al. (Reference Hagmann, Siegrist and Hartmann2018) found that risk groups, including overweight participants and those who consume greater amounts of sugary drinks, were more likely to oppose various policies. Illustrating the mixed nature of the evidence, a recent cluster analysis by Jürkenbeck et al. (Reference Jürkenbeck, Zühlsdorf and Spiller2020) found no difference in policy acceptance between healthy and unhealthy eaters.
The above studies assessed people's perceived need for support in healthy dietary choices. However, people who are obese or have unhealthy dietary habits may not necessarily actively pursue healthy eating goals. People without a healthy dietary goal may, therefore, not find all proposed food policies personally relevant. Indeed, goal setting is a prerequisite step in the self-regulatory process (Baumeister and Bargh, Reference Baumeister, Bargh, Sherman, Gawronski and Trope2014). Having a dietary goal can thus affect people's support for food policies. Nevertheless, most studies on policy acceptance did not measure participants’ intentions or goals to eat more healthily, and limited evidence exists on the policy attitudes of people who want to change a particular behaviour.
One concept relevant to understanding the success or failure of adopting and maintaining a healthy diet is self-control. Self-control refers to the capacity to resist desire (Hofmann et al., Reference Hofmann, Baumeister, Förster and Vohs2012). Differences in self-control and its impact on people's eating behaviour have mainly been studied by measuring self-control as a general trait rather than focusing on domain-specific aspects of self-control relevant to food choice. Self-control abilities and motivation can vary significantly across domains (e.g., Wenzel et al., Reference Wenzel, Rowland, Bürgler, Friese, Hofmann and Hennecke2022), highlighting the need to measure self-control in concrete everyday contexts (e.g., Hofmann et al., Reference Hofmann, Baumeister, Förster and Vohs2012). Doing so will also help better examine the link between self-control success or failure and the acceptance of related public policies. For example, Kukowski et al. (Reference Kukowski, Bernecker, Nielsen, Hofmann and Brandstätter2023) measured self-control failure specifically for meat consumption. They found that those less satisfied with their success in reducing their meat consumption were more supportive of institutional and governmental regulations incentivising vegetarian food choices.
Role of policy effectiveness beliefs
To unpack the relationship between dietary goal failure and food policy acceptance, it is important to investigate the perceived effectiveness of a food policy in promoting healthier diets. Research has consistently shown that perceived policy effectiveness strongly influences policy acceptance across decision-making contexts (e.g., Petrescu et al., Reference Petrescu, Hollands, Couturier, Ng and Marteau2016; Reynolds et al., Reference Reynolds, Stautz, Pilling, van der Linden and Marteau2020; Mantzari et al., Reference Mantzari, Reynolds, Jebb, Hollands, Pilling and Marteau2022; Gold et al., Reference Gold, Lin, Ashcroft and Osman2023). For example, a recent systematic review by Reynolds et al. (Reference Reynolds, Stautz, Pilling, van der Linden and Marteau2020) found that simply communicating evidence of the effectiveness of policies in changing behaviour can increase acceptance by around four percentage points. The perceived effectiveness of policies may, therefore, moderate the relationship between dietary goal failure and food policy acceptance. A positive relationship would indicate that policy support increases the more people perceive the policy as helpful for healthier eating. Conversely, a negative relationship would indicate that higher perceived policy effectiveness would lower acceptance since people do not want to be constrained in their eating behaviours (Hagmann et al., Reference Hagmann, Siegrist and Hartmann2018). Since the most effective food policies (e.g., taxes, bans) are often restrictive (e.g., Diepeveen et al., Reference Diepeveen, Ling, Suhrcke, Roland and Marteau2013; Hagman et al., Reference Hagman, Andersson, Västfjäll and Tinghög2015, Reference Hagmann, Ho and Loewenstein2019; Petrescu et al., Reference Petrescu, Hollands, Couturier, Ng and Marteau2016; Cadario and Chandon, Reference Cadario and Chandon2019; Reynolds et al., Reference Reynolds, Archer, Pilling, Kenny, Hollands and Marteau2019; Djupegot and Hansen, Reference Djupegot and Hansen2020), more effective food policies may consequently be perceived as more autonomy-threatening. In this study, we examined whether and how perceived policy effectiveness influences the relationship between dietary goal failure and food policy acceptance.
Role of blame attribution tendencies
When people fail to achieve goals, they usually search for the causes of their failure (Weiner, Reference Weiner, Sorrentino and Higgins1986). This search can result in internal or external blame attribution, attributing failure to either personal factors, such as a lack of self-control, or external factors, such as the abundance of unhealthy food in their environment. Among people who frequently experience dietary goal failures, it seems plausible that those who blame the environment over personal factors are more supportive of policies that change the food environment (e.g., a vegetarian default in public canteens or a ban on sugary soft drinks in schools). Evidence indicates that differences in blame attribution tendencies among people experiencing dietary goal failures impact their acceptance of food policies (Beeken and Wardle, Reference Beeken and Wardle2013; Mazzocchi et al., Reference Mazzocchi, Cagnone, Bech-Larsen, Niedźwiedzka, Saba, Shankar, Verbeke and Traill2015; Petrescu et al., Reference Petrescu, Hollands, Couturier, Ng and Marteau2016). For example, Mazzocchi et al. (Reference Mazzocchi, Cagnone, Bech-Larsen, Niedźwiedzka, Saba, Shankar, Verbeke and Traill2015) found that participants who blamed high obesity rates on external factors, such as the excessive availability of unhealthy foods, more strongly supported related policies. Similarly, Beeken and Wardle (Reference Beeken and Wardle2013) found that food environment attributions were associated with higher support for all policies in a cross-sectional study on attributions for overweight and policy support in Great Britain. To identify when people who repeatedly fail their dietary goals accept or reject food policies, it is relevant to examine how the attribution of blame, whether external or internal, moderates this relationship.
The present research
This study investigated whether and when people who have an explicit goal to eat healthy but often experience self-control failures accept public policies promoting healthier food choices. Examining this specific group is crucial, as those struggling with dietary goals will likely benefit from external support, such as health-promoting public policies. We also investigated potential moderators of the relationship between dietary goal failure and food policy support. Specifically, we examined how differences in blame attribution (internal vs external) and perceived policy effectiveness shape policy acceptance. To test these relationships, we relied on a recent extensive experience-sampling study conducted in Germany (Bauer et al., Reference Bauer, Nielsen, Hofmann and Reisch2022).Footnote 1 The study examined food choices for 6–11 days and only included participants with an explicit goal of eating more healthily. The experience-sampling method (ESM) offers an intensive longitudinal and ecologically valid approach to capturing participants’ feelings, thoughts and behaviours in their natural environments and over time (Conner et al., Reference Conner, Tennen, Fleeson and Barrett2009; Hofmann and Patel, Reference Hofmann and Patel2015). To investigate the relationship between dietary goal failure and food policy acceptance, we linked observations of food choices to policy attitudes measured in a post-survey completed after the experience-sampling protocol. Although we relied on already-collected data, we pre-registered all hypotheses, study materials and planned analyses via the Open Science Framework (OSF) before analysing our research questions: https://osf.io/ma73x/?view_only=269b7d19a1104b89b1363a828a0e218e.
We pre-registered the following hypotheses:
H1: There is an association between the extent to which people fail in their dietary goals and the extent to which they accept public policies promoting a healthier diet.
This hypothesis was deliberately left non-directional due to the mixed evidence outlined above. Indeed, both a positive association (i.e., people experiencing frequent dietary goal failure being more accepting of health-promoting policies) and a negative association (i.e., people experiencing frequent dietary goal failure being less accepting of health-promoting policies) are theoretically conceivable. For example, a positive association suggests that those who fail to achieve their dietary goals more strongly accept health-promoting policies to help overcome food environment challenges. Conversely, a negative association may reflect a desire for self-autonomous decision-making, which could lead to a lower acceptance of food policies.
We investigated differences in perceived policy effectiveness and blame attribution as potential moderators of the relationship between dietary goal failure and food policy acceptance. Again, we pre-registered non-directional hypotheses due to their dependence on the direction of the main relationship specified in H1.
For people who perceive health-promoting policies as goal support, the relationship between dietary goal failure and food policy acceptance will be positive, and higher perceived effectiveness should strengthen this relationship. However, some people with more goal failure might be less likely to support these food policies if they are concerned that they would be more negatively affected. For them, higher perceived effectiveness might reinforce a negative association because policies perceived as more effective (and often more intrusive) may also be viewed as more autonomy-threatening.
H2a: The relationship between dietary goal failure and public policy acceptance differs depending on the extent to which people perceive the target policy to be effective in promoting a healthier diet.
External (vs internal) blame attribution tendencies may strengthen a positive link between dietary goal failure and food policy acceptance. Prior studies have shown that external blame attribution is associated with higher policy acceptance. However, the role of external blame attribution for a negative main relationship is less clear.
H2b: The relationship between dietary goal failure and public policy acceptance differs for people attributing the blame for the failure rather externally compared to people attributing the blame rather internally.
Preview of main findings
We will briefly summarize our main findings to position our exploratory analyses outlined in the next section. A key finding is that more frequent dietary goal failure was negatively associated with the average joint food policy acceptance (H1). While perceived policy effectiveness did not moderate this association, we found that beliefs about policy effectiveness were strongly associated with higher policy acceptance (H2a). Furthermore, people who experienced more dietary goal failure perceived food policies as less effective than those more successful in eating a healthy diet. Interestingly, people mostly blamed themselves, not others (i.e., the government, supermarkets or restaurants) for their failures in their dietary goals. However, differences in blame attribution tendencies (external vs internal) did not moderate the association between dietary goal failure and food policy acceptance (H2b).
Exploratory analyses
Policy type
The mixed evidence on whether and how engaging in unhealthy behaviour relates to supporting targeted public policies (Reynolds et al., Reference Reynolds, Archer, Pilling, Kenny, Hollands and Marteau2019; Sharp et al., Reference Sharp, Bellis, Hughes, Ford and Di Lemma2020; Gold et al., Reference Gold, Lin, Ashcroft and Osman2023) might be because policy acceptance varies with policy type. For example, more restrictive policy interventions (e.g., taxation, regulations) usually have lower acceptance compared to ‘softer’ interventions (e.g., educational campaigns, labelling; Diepeveen et al., Reference Diepeveen, Ling, Suhrcke, Roland and Marteau2013; Hagman et al., Reference Hagman, Andersson, Västfjäll and Tinghög2015; Petrescu et al., Reference Petrescu, Hollands, Couturier, Ng and Marteau2016; Hagmann et al., Reference Hagmann, Ho and Loewenstein2019; Reynolds et al., Reference Reynolds, Archer, Pilling, Kenny, Hollands and Marteau2019; Djupegot and Hansen, Reference Djupegot and Hansen2020). We, therefore, conducted a pre-registered exploratory analysis testing whether the policy type affected the association between dietary goal failure and policy support.
Food choice environment
The environment in which people make food choices can strongly influence the likelihood and extent of dietary goal failure (e.g., Reisch et al., Reference Reisch, Sunstein and Gwozdz2017; Bauer et al., Reference Bauer, Nielsen, Hofmann and Reisch2022). This raises the question of whether the location of goal failure affects food policy acceptance. Eating out-of-home imposes different constraints and limits people's control over their food choices compared with eating at home, which may influence their perceived support for public policies promoting healthier choices. Out-of-home constraints may include the type of restaurants and supermarkets close by (discount vs healthy food stores), availability of nutrition information for the offered products or portion sizes in restaurants or canteens. Furthermore, people concerned about governmental overreach might be more reluctant to support a policy that targets food choices made in their own homes compared with those made in public. We consequently conducted a pre-registered exploratory analysis testing whether people’s food environment, including where participants selected their meals (at home vs out-of-home, e.g., supermarkets, bars, restaurants and public canteens), influenced the association between dietary goal failure and food policy acceptance.
Trait self-control
Because dietary goal failure might be understood as self-control failure (Wallace and Baumeister, Reference Wallace and Baumeister2002; Hofmann et al., Reference Hofmann, Friese and Strack2009), we pre-registered to explore whether participants’ self-control ability (trait self-control) influenced the association between dietary goal failure and food policy acceptance.
Method
Procedure
This study used experience-sampling data collected from 17 November to 19 December 2018 in Germany. We note that the data have been used for another study which, however, has minimal overlap with the analyses presented here (see Bauer et al., Reference Bauer, Nielsen, Hofmann and Reisch2022). Due to the study focus, only people dissatisfied with the healthiness of the diet and having the goal to improve their diet were invited to participate. Participants who met this requirement were invited to complete an intake survey that included measures of socio-demographics (e.g., age, gender and education) and psychographics (e.g., trait self-control). Next, via the mobile app Qmob, participants were asked to report all their significant food choices and evaluate the extent to which these aligned with their dietary goals. Participants received two daily reminders to complete the experience-sampling surveys and were asked to provide at least seven total entries over 6–11 days to receive payment. Finally, in a post-survey, participants completed various measures, including policy acceptance, perceived policy effectiveness and blame attribution. After completing all three survey parts, participants were compensated with 8 Euros. Participants who submitted more than 15 food consumption entries received a bonus payment of 2 Euros (see Appendix A for further details).
Participants
A total of 409 participants completed the full study and provided information on 6,447 real-life food choices (see Appendix Table A1 for details). The average age was 36.7 years (SD = 8.71, min = 18, max = 55), with 58% of participants identifying as female. The majority of participants were of German nationality (98%). About 25% of participants had a university degree, and 36% had completed vocational education. More than half of the participants worked full-time, 19% worked part-time, 13% were students and 5% were retired (see Appendix Table A2 for details; analyses regarding non-response and attrition are presented in Appendix Tables A3 and A4).
Measures
Diary measures
Dietary goal failure
Our main independent variable, dietary goal failure, was assessed during the experience-sampling phase. Participants were asked to evaluate the extent to which the meal they selected aligned with their goal(s) to eat a healthier diet. Participants indicated their responses on a 7-point Likert scale ranging from ‘not at all’ (1) to ‘completely’ (7). We reversed the item and calculated the average score to measure dietary failure, where higher values reflect less alignment with participants’ dietary goals.
Food environment
Participants were asked to indicate how their meal was prepared. They could select one of the following three options: ‘It was homemade’ (i.e., involved preparation by myself/friends/family); ‘It was specifically purchased for this meal’ (i.e., restaurant, takeaway, cafeteria) or ‘Other’.
Pre- or post-survey measures
Policy acceptance
Participants were presented with statements representing 10 different public policies (including nudges, educational campaigns, incentives and laws; see Appendix Table A5) aimed at promoting a healthier diet (Hawkes et al., Reference Hawkes, Smith, Jewell, Wardle, Hammond, Friel, Thow and Kain2015; Mazzocchi, Reference Mazzocchi2017; Reisch et al., Reference Reisch, Sunstein and Gwozdz2017; Hagmann et al., Reference Hagmann, Siegrist and Hartmann2018). They were asked to indicate how much they approved or disapproved of the policies that aimed to foster healthier food choices (see Appendix Table A5). Policy acceptance was indicated on a 7-point Likert scale from ‘strongly disapprove’ (1) to ‘strongly approve’ (7). We calculated the average score on the items to measure joint policy acceptance (Cronbach's raw alpha = 0.82).
Policy categorization
To identify potential heterogeneity in the proposed relationships across public policies, we conducted a factor analysis with all 10 policy acceptance items. The results indicated that food policy acceptance had more commonality related to the policy aim (e.g., to encourage healthy choices vs discourage unhealthy choices) rather than the type of policy instrument (e.g., nudges, incentives, educational campaigns and laws). The analysis revealed three distinct factors (see Appendix Table A6): (1) policies that facilitate healthier food choices, (2) policies that increase the psychological or financial costs of unhealthy choices (i.e., increasing prices of unhealthy food or restricting promotion and access to unhealthy food) and (3) policies that offer decision-making support. We label these three factors ‘pull policies’ (1), ‘push policies’ (2) and ‘decision-support policies’ (3), respectively. The distinction between pull and push policies is commonly used in the public policy literature (see Steg et al. (Reference Steg, Dreijerink and Abrahamse2006)).
Blame attribution
Participants were asked to indicate who was to blame for the unhealthy dietary choices they had made during the last seven days (if any). The answer options were ‘Myself’, ‘Family, Friends and Colleagues’, ‘Grocery stores’, ‘Government/Politics’, ‘Restaurants/Cafeterias’ and ‘Food manufacturers’. The following answer options indicated levels of blame attribution: ‘Not to blame’ (1), ‘Somewhat to blame’ (2) and ‘Primarily to blame’ (3), adapted from Lusk and Ellison (Reference Lusk and Ellison2013). Exploratory factor analysis of blame attribution items revealed internal blame attribution as a unique factor. For our study purposes, we categorized all responses on ‘Myself’ as internal blame attribution and all responses on ‘Grocery stores’, ‘Government/Politics’, ‘Restaurants/Cafeterias’ and ‘Food manufacturers’ as external blame attribution. To test our hypotheses, we do not consider blame attribution concerning ‘Family, Friends and Colleagues’ as it cannot clearly be categorized as either internal or external attribution. For each participant, we calculated the difference score of the value of internal blame attribution and the maximum value of the external blame attribution so that the outcome score ranges from ‘strongly external attribution’ (−2) to ‘strongly internal attribution’ (2).Footnote 2
Perceived personal policy effectiveness
For each of the 10 public policies (see Appendix Table A5), participants were asked to indicate the extent to which they would find the target policy helpful/effective in supporting their dietary choices. ‘Think about all the food choices you made during the last week. Regardless of whether you support the above policies: How helpful/effective do you think it would have been in supporting your dietary choices if the federal government actually would …’. A 7-point Likert scale indicated the levels of the variable from ‘not helpful at all’ (1) to ‘extremely helpful’ (7; adapted from Hawkes et al. (Reference Hawkes, Smith, Jewell, Wardle, Hammond, Friel, Thow and Kain2015), Reisch et al. (Reference Reisch, Sunstein and Gwozdz2017), Mazzocchi (Reference Mazzocchi2017) and Hagmann et al. (Reference Hagmann, Siegrist and Hartmann2018)). We calculated the average score on the items as a measure of perceived personal policy effectiveness (Cronbach's raw alpha = 0.87).
Trait self-control
Participants were shown 13 statements measuring self-control tendencies, adapted from the German version of the Brief Self-Control Scale (Tangney et al., Reference Tangney, Baumeister and Boone2004; Bertrams and Dickhäuser, Reference Bertrams and Dickhäuser2009). They were asked to indicate the extent to which each statement is typical of their behaviour. They provided their answers on a 7-point Likert scale from ‘strongly disagree’ (1) to ‘strongly agree’ (7; Cronbach's raw alpha = 0.76).
Analytical strategy
To test our hypotheses, we conducted linear regression analyses using the statistical software R (version 1.3.1093). Due to the nested data structure where policy acceptance was measured on the higher structural level of the individual participant (level 2), we aggregated all repeated measures on level 1 from the experience-sampling part and calculated an individual average. We focused on the significance test of the overall relationship between the average report of dietary goal failure and joint public policy acceptance of all policies presented (H1). In a second step, we conducted moderated linear regressions to test the proposed interactions with perceived policy effectiveness (H2a) and blame attribution (H2b). To explore potential heterogeneity across policies, we first conducted an exploratory factor analysis to categorize the policies into different groups, whereafter we performed the pre-registered analyses for each of the three policy groups separately. We similarly performed these analyses to investigate differences depending on whether the food selection was made out-of-home or at home. Finally, we conducted moderated linear regressions to test whether differences in people's trait self-control moderated the hypothesized relationship between dietary goal failure and policy acceptance. We mean-centred all relevant continuous predictors to facilitate interpretation.
Results
Descriptive findings
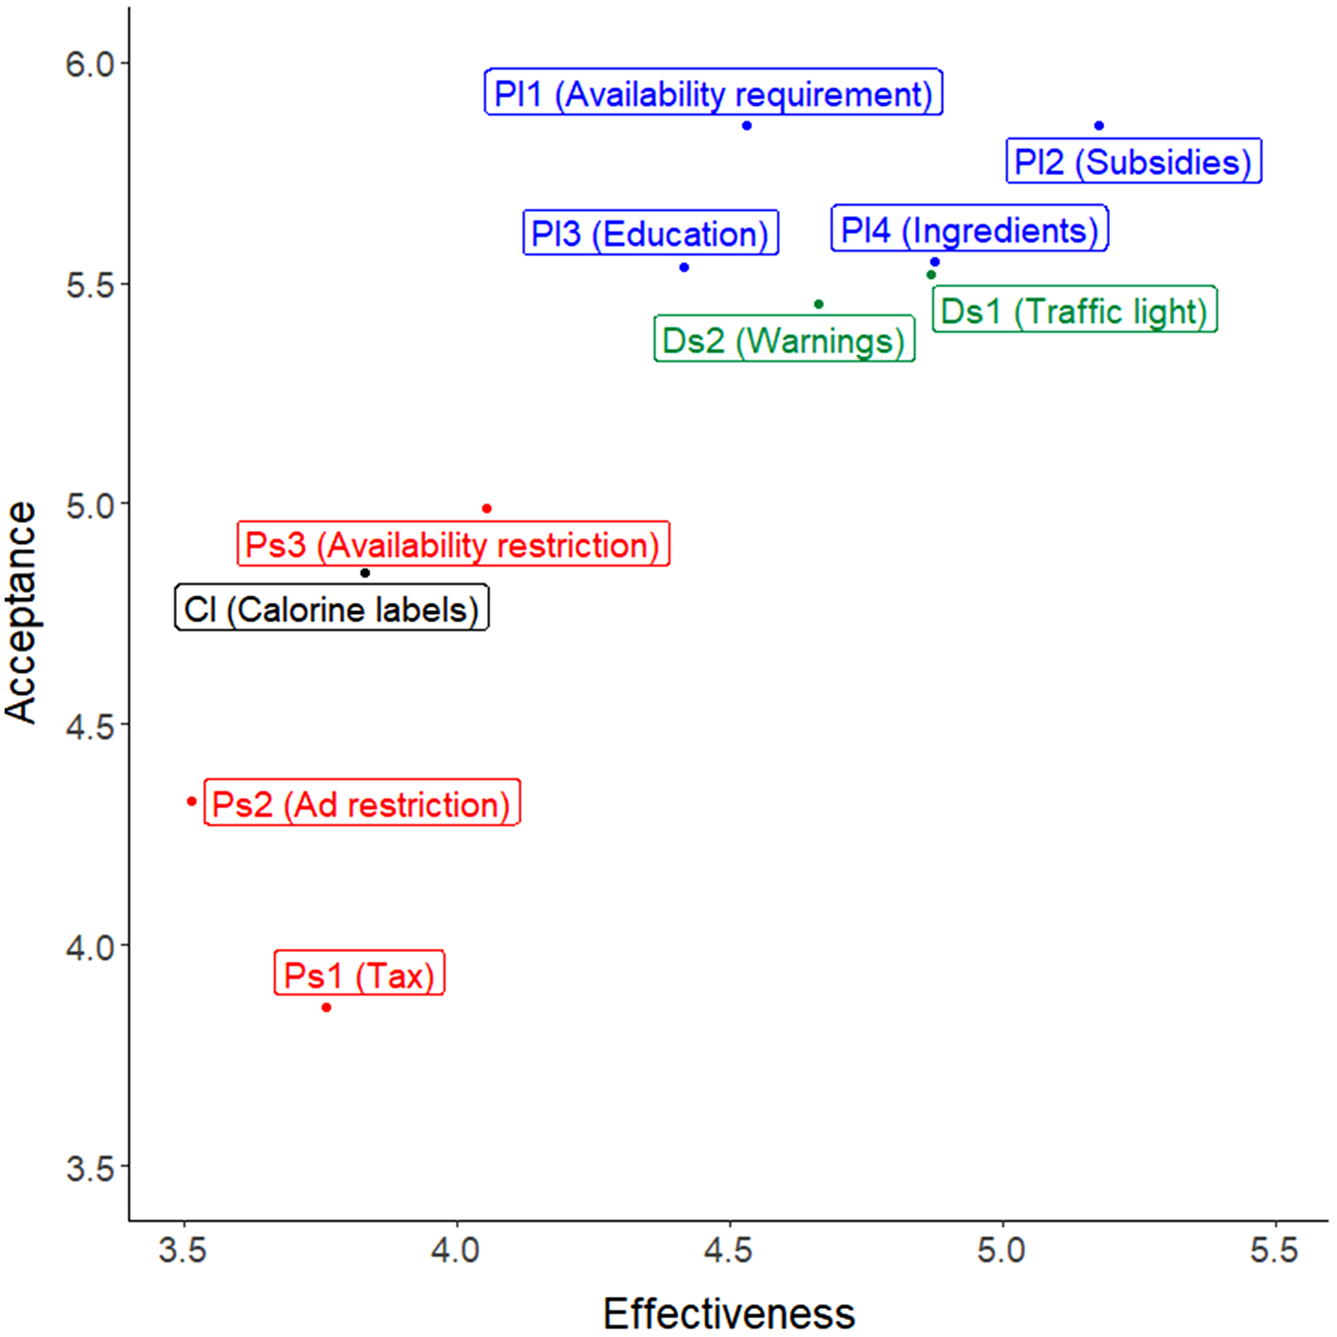
Participants reported a high average policy acceptance (M = 5.18, SD = 1.01) and perceived effectiveness of the food policies (M = 4.37, SD = 1.31; see Appendix Table A1). Participants experienced more frequent dietary goal failure when food selections were made out-of-home (M = 4.77, SD = 1.54) compared with at-home (M = 3.51, SD = 1.07; t(636.56) = 13.096, p < 0.001). Regarding policy acceptance, we found that subsidies on healthy food, increasing healthy food availability and health education were the most accepted, and sugar taxes the least accepted. Regarding perceived policy effectiveness, subsidizing healthy food was perceived as the most effective way to promote healthier eating, whereas restricting the advertising of unhealthy food was perceived as the least effective (see Figure 1).
Plot with perceived effectiveness and acceptance of the presented policies. Note. Abbreviations: Pl, pull policies; Ps, push policies; Ds, decision-support policies; Cl, calorie labels. Ps1 (Tax): increases prices on unhealthy food through, e.g., sugar tax or tax on calorie-dense products. Pl2 (Subsidies): lowers the price of healthy food through, e.g., vouchers or coupons. Ps2 (Ad restrictions): restricts the promotion of unhealthy food, e.g., by banning advertisements for sweets or fast food. Pl3 (Education): increases knowledge of healthy foods through public education campaigns. Cl (Calorie labels): requires calorie labels at chain restaurants (such as McDonald's and Burger King). Ds1 (Traffic light): requires a ‘traffic light’ system for food by which healthy foods would be marked with a small green label, unhealthy foods with a small red label and foods that are neither especially healthy nor especially unhealthy with a small yellow label. Ds2 (Warnings): requires warning labels on products that have unusually high levels of salt, fat and sugar; for example, ‘This product contains high levels of salt, which may be harmful to your health’. Pl1 (Availability requirement): requires worksite cafeterias and restaurants to ensure the availability of healthy food options. Ps3 (Availability restriction): restricts access to unhealthy food options in schools and public places. Pl4 (Ingredients): restricts the use of unhealthy ingredients in processed foods by setting maximum values.

Figure 1 Long description
The scatter plot illustrates the relationship between acceptance and effectiveness of different food policies. The horizontal axis represents Effectiveness, ranging from 3.5 to 5.5 and the vertical axis represents Acceptance, ranging from 3.5 to 6.0. Policies are categorized by color: blue for pull policies, green for decision-support policies, red for push policies and black for calorie labels. Key observations include a cluster of policies with high acceptance and effectiveness, such as Pl1 (Availability requirement), Pl2 (Subsidies), Pl3 (Education) and Pl4 (Ingredients), all positioned around effectiveness 4.5 to 5.5 and acceptance 5.3 to 5.9. Ds1 (Traffic light) and Ds2 (Warnings) also show high acceptance and effectiveness. In contrast, Ps1 (Tax) shows lower acceptance at around 3.8, despite moderate effectiveness. Ps2 (Ad restriction) and Ps3 (Availability restriction) have lower acceptance and effectiveness, positioned around 4.0 to 4.5 for both metrics. Cl (Calorie labels) is moderately accepted and effective, positioned around 4.5 for both metrics. Overall, the plot reveals that policies perceived as more effective tend to have higher acceptance, with notable exceptions like the tax policy. The clustering of points indicates a general trend where policies with higher effectiveness are more accepted.
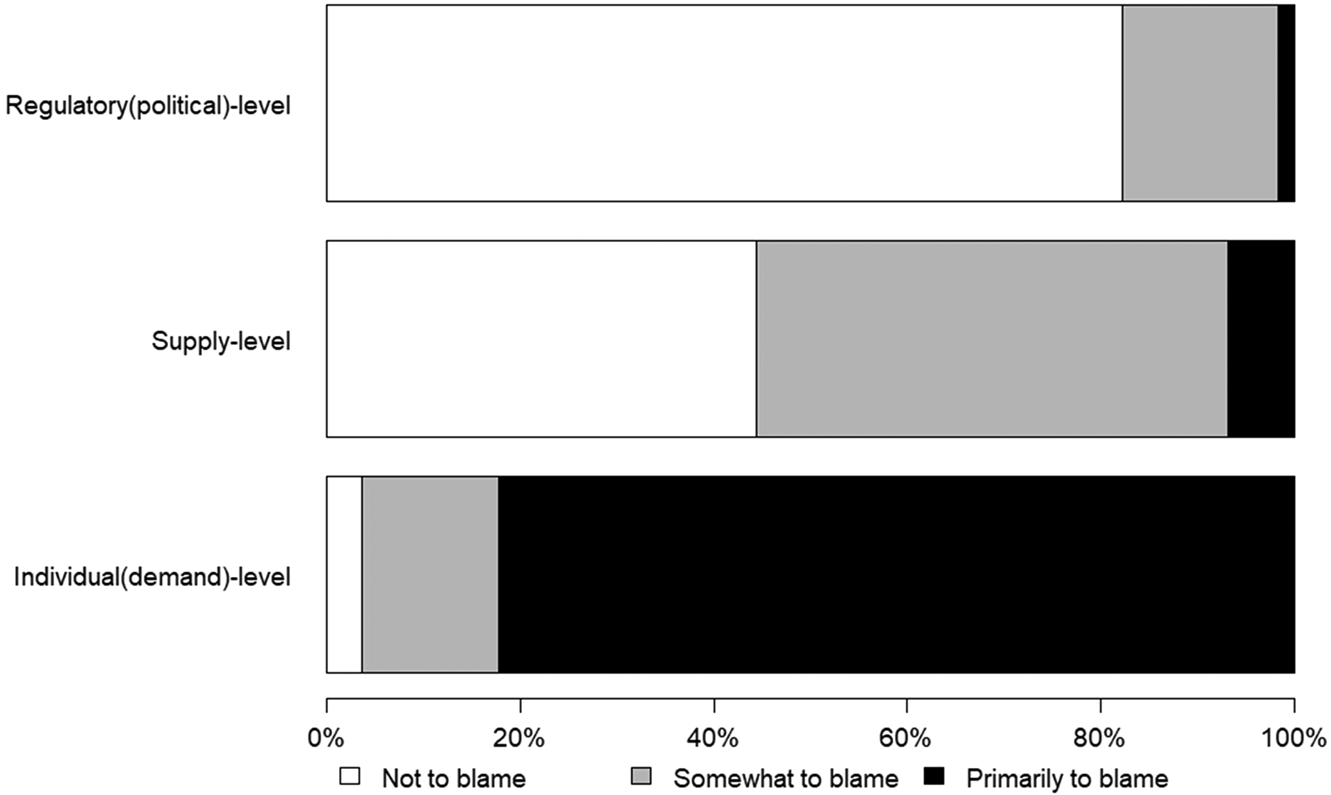
As detailed in Figure 2, most participants primarily blamed themselves (81.66%) for failing their dietary goals (3-point blame score: M = 1.33, SD = 0.38) compared with supply (i.e., food manufacturers, restaurants, supermarkets) and regulatory actors (i.e., government policies).
Distribution of blame attribution. Note. The regulatory (political)-level includes estimates of blame attribution towards ‘the government’. The supply-level includes blame attributions towards ‘food manufacturers’, ‘restaurants’ and ‘supermarkets’. The individual(demand)-level includes blame attributions towards ‘oneself’ and ‘family, friends and colleagues’. For each level, the percentage of the participants who indicated at least one factor as ‘not to blame’, ‘somewhat to blame’ and ‘primarily to blame’ is shown.

Figure 2 Long description
N/A
Dietary goal failure and food policy acceptance (H1)
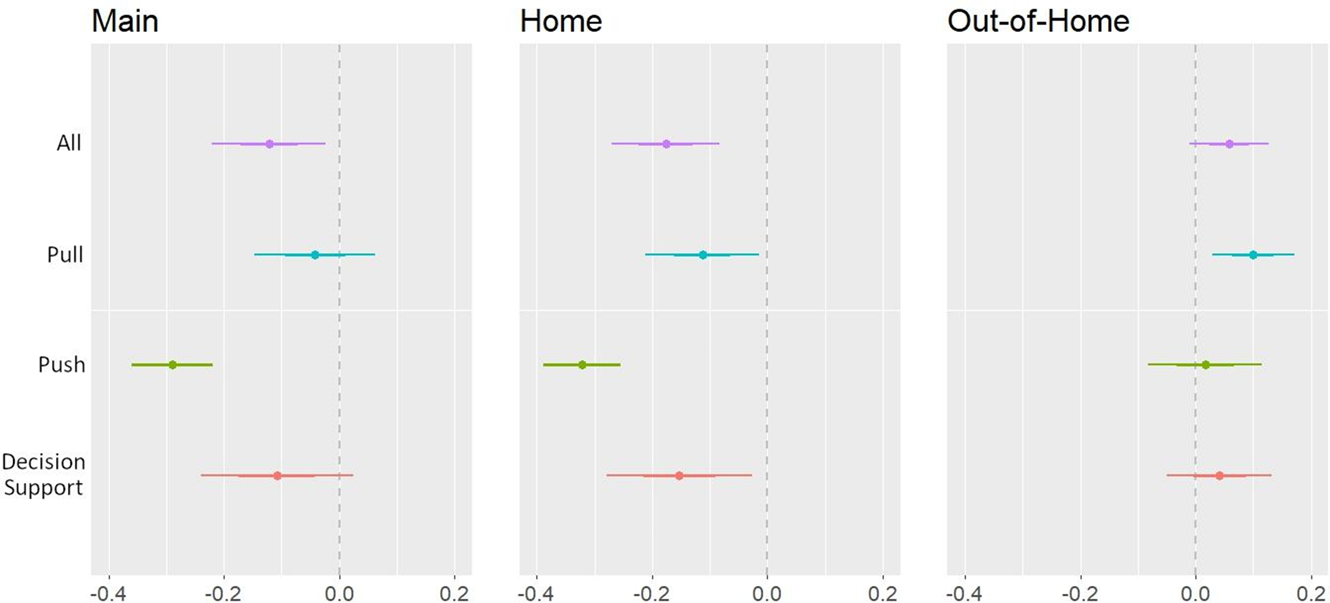
As hypothesized (H1),Footnote 3 we observed a statistically significant negative association between dietary goal failure and the acceptance of public policies aimed at promoting a healthier diet (β = −0.12, p = 0.014; see Figure 3, Appendix Table A7). This means that the more participants struggled to achieve their dietary goals, the less they accepted public food policies.
Policy acceptance and dietary goal failure. Note. The figure displays the effect sizes (with 95% CIs) from regressing policy acceptance on dietary failure by policy type and pooled for all policy types. The left panel displays the main results, and the middle and right panels show results separated by area of choice. Estimation results are presented in Appendix Table A7. Abbreviations: All, across all policy types; push, push policies; pull, pull policies; decision support, decision-support policies.

Figure 3 Long description
Main A forest plot with four rows labeled All, Pull, Push and Decision Support. The horizontal axis shows tick labels minus 0.4, minus 0.2, 0.0 and 0.2. A vertical dashed reference line is at 0.0. Each row has a point with a horizontal confidence interval. All is centered near minus 0.12 with the interval spanning roughly from about minus 0.20 to about minus 0.04. Pull is centered near minus 0.05 with the interval spanning roughly from about minus 0.15 to about 0.05. Push is centered near minus 0.30 with the interval spanning roughly from about minus 0.37 to about minus 0.23. Decision Support is centered near minus 0.10 with the interval spanning roughly from about minus 0.22 to about 0.02. Home A forest plot with four rows labeled All, Pull, Push and Decision Support. The horizontal axis shows tick labels minus 0.4, minus 0.2, 0.0 and 0.2. A vertical dashed reference line is at 0.0. Each row has a point with a horizontal confidence interval. All is centered near minus 0.18 with the interval spanning roughly from about minus 0.27 to about minus 0.09. Pull is centered near minus 0.12 with the interval spanning roughly from about minus 0.22 to about minus 0.02. Push is centered near minus 0.30 with the interval spanning roughly from about minus 0.37 to about minus 0.23. Decision Support is centered near minus 0.15 with the interval spanning roughly from about minus 0.28 to about minus 0.02. Out-of-Home A forest plot with four rows labeled All, Pull, Push and Decision Support. The horizontal axis shows tick labels minus 0.4, minus 0.2, 0.0 and 0.2. A vertical dashed reference line is at 0.0. Each row has a point with a horizontal confidence interval. All is centered near 0.06 with the interval spanning roughly from about 0.00 to about 0.12. Pull is centered near 0.12 with the interval spanning roughly from about 0.06 to about 0.18. Push is centered near 0.05 with the interval spanning roughly from about minus 0.05 to about 0.15. Decision Support is centered near 0.04 with the interval spanning roughly from about minus 0.04 to about 0.12.
Next, we separately evaluated the food policy types (push-, pull- and decision-support policies) and selection locations (home vs out-of-home). We found that the negative relationship between dietary goal failure and public policy acceptance was primarily driven by push policies restricting unhealthy options (β = −0.29, p < 0.001; see Figure 3, Appendix Table A7). When examining only food choices at home, we observed a negative relationship between dietary goal failure and policy acceptance for all three policy types. For food choices made out-of-home, the negative relationship between dietary goal failure and policy acceptance turned positive but was not statistically significant (β = 0.06, p = 0.092). A positive and significant relationship was observed for pull policies, revealing that people who experience more dietary goal failure found pull policies more acceptable when only considering food choices made out-of-home (β = 0.10, p = 0.005).
Role of perceived policy effectiveness (H2a)
Contrary to our prediction (H2a), we found no evidence that policy effectiveness moderates the negative relationship between dietary goal failure and policy acceptance (β = −0.03, p = 0.245; see Appendix Table A8). However, perceived policy effectiveness positively predicted policy acceptance (β = 0.42, p < 0.001). Interestingly, we observed a significant negative relationship between dietary goal failure and perceived policy effectiveness (β = −0.26, p < 0.001). This suggests that participants who experienced more dietary goal failure considered the food policies less effective, contributing to the negative relationship between goal failure and policy acceptance. Indeed, when controlling for policy effectiveness in the regression model, the relationship between goal failure and policy acceptance became less negative and was no longer statistically significant.
We investigated H2a across the food policy groups and selection locations (at-home vs out-of-home). We observed one negative interaction effect between dietary goal failure and the perceived effectiveness of decision-support policies on policy acceptance (β = −0.05, p = 0.009). This suggests that the impact of dietary goal failure on policy acceptance is mitigated when people perceive decision-support policies as more effective.
Controlling for the perceived effectiveness of policies, we found that the relationship between dietary goal failure in out-of-home choices and policy acceptance (H1) was positive and statistically significant. This relationship was consistent when examining joint policy acceptance, pull policy acceptance and decision-support policy acceptance.
Overall, we only found limited support for H2a in one subset, where the positive relationship between dietary goal failure and acceptance of decision-support policies diminishes when individuals believe these policies to be effective. However, we consistently observed that differences in perceived policy effectiveness explain an important part of the main relationship between goal failure and policy acceptance (H1).
Role of blame attribution (H2b)
In contrast to our expectation (H2b), blame attribution tendencies did not moderate the negative relationship between dietary goal failure and policy acceptance (β = −0.001, p = 0.901; see Appendix Table A9). The specific policy type or selection location did not influence the role of blame attribution in policy acceptance.
Exploratory analyses
Self-control
We found an interaction effect between dietary goal failure and trait self-control for the acceptance of pull policies (β = 0.28, p = 0.031; see Appendix Table A10), suggesting that with increased self-control, more dietary goal failure was associated with higher acceptance of pull policies. However, this exploratory moderation effect should be interpreted cautiously, as it only emerged for pull policies and not for the other two policy types (push policies: β = −0.10, p = 0.548; decision support: β = 0.04, p = 0.819).
Discussion
It is important to study policy acceptance among those who face difficulties implementing and maintaining a healthy diet to develop public policies that better align people's dietary goals and food choices. However, in the food domain, most studies of policy acceptance have not examined whether people's success or failure in eating healthily affects their acceptance of public food policies. Here, we use experience sampling to study whether and when dietary goal failure relates to the acceptance of public policies promoting a healthier diet.
Our results suggest that more frequent goal failure is related to lower acceptance of health-promoting food policies. At face value, this suggests, somewhat ironically, that people who may benefit the most from food policies, i.e., those struggling to reach their dietary goals, report lower acceptance of public food policies. Interestingly, additional analyses revealed that this negative relationship was mainly limited to push policies that discourage unhealthy food options, such as introducing sugar taxes and restricting unhealthy ingredients. This aligns with previous studies showing that push policies are generally less popular and perceived as more coercive than pull policies (Diepeveen et al., Reference Diepeveen, Ling, Suhrcke, Roland and Marteau2013; Petrescu et al., Reference Petrescu, Hollands, Couturier, Ng and Marteau2016; Reisch and Sunstein, Reference Reisch and Sunstein2016; Hagmann et al., Reference Hagmann, Ho and Loewenstein2019). In the present context, one reason for people's lower acceptance of push policies despite experiencing dietary goal failures may be that they want to preserve the freedom to indulge in unhealthy behaviour without policy restrictions. This aligns with Hagmann et al. (Reference Hagmann, Siegrist and Hartmann2018), who found that overweight participants and those consuming sugar-sweetened beverages, on average, more strongly oppose policies that target these health issues. An interpretation supported by an exploratory analysis linking reports about peoples’ thoughts during decision-making to policy support. Participants who more frequently chose food to explicitly reward themselves with food reported lower policy acceptance (see Appendix B). Future studies could explore the impact of people's desire for autonomous decision-making and the perceived intrusiveness of food policies on the relationship between repeated dietary goal failure and food policy acceptance.
If healthy food policies were implemented, people who experience dietary goal failures may also anticipate incurring additional costs (e.g., sugar taxes) and inconveniences. In an unhealthy food environment (e.g., where fast-food outlets are the only accessible option, unhealthy food is the cheaper option or no nutritional information is available), people can relatively easily justify breaking their dietary goals. Conversely, attributing goal-inconsistent choices to external factors becomes more difficult in a healthy food environment. For instance, it may be more difficult to justify eating meat for an aspiring vegetarian if vegetarian options are accessible, appealing and affordable. Unfortunately, our study design could not isolate these different pathways, and we encourage future research to explore potential mechanisms underlying the link between dietary goal failure and policy support.
Contextual differences were observed between out-of-home and at-home food selections. The negative relationship between dietary goal failure and policy support emerged only for at-home food choices. For pull policies, the direction of the relationship even reversed when considering food choices made out-of-home only. Hence, participants who experienced dietary goal failures in out-of-home food environments (e.g., supermarkets, bars, restaurants, public canteens) were more likely to support food policies promoting healthier choices (vs push policies; those that impede unhealthy choices). One reason may be that people generally experience more dietary goal failure when choosing food out-of-home, where they have less control over the food environment. Another reason may be that they encounter stronger temptations (e.g., irresistible desserts on the menu, larger portion sizes or manipulative waiters), or they experience less favourable physiological or psychological conditions that undermine their capacity to resist them (e.g., being more stressed or hungry) (Bauer et al., Reference Bauer, Nielsen, Hofmann and Reisch2022). At home, in contrast, people can better control the presence of triggers that tempt unhealthy food choices (e.g., by putting sweets out-of-sight and scheduling enough time for meals). People have higher agency and, therefore, have access to a larger range of self-regulation strategies when making food choices at home.
Our aggregated data on people's policy acceptance seems to reflect their daily food experiences, including where they ate. As participants made significantly more food choices at home than out-of-home, the observed negative link between dietary goal failure and policy support might emerge because food experiences at home were mentally more readily available. In an at-home scenario, participants were plausibly less likely to be in need of support, or the proposed policies were perceived as less relevant. Indeed, the negative relationship only emerged when we analysed food choices at home but not outside, where participants were most likely to choose unhealthy options. We could further link situational goal salience with policy support. The more participants reported thinking about their dietary goals while making food choices, the stronger the overall support was for all food policies (see Appendix B). Therefore, more fine-grained analyses of policy attitudes are important.
Our study also revealed that people with high levels of trait self-control were more supportive of pull policies if they experienced more dietary goal failure. It is conceivable that people who are usually successful at tasks requiring self-control are more likely to accurately appraise the limits of their self-control and, therefore, support external regulation. However, since we cannot make causal claims about the relationship, this finding should be replicated independently. Nevertheless, it may point to a theoretically interesting interplay between trait self-control, which has been linked with an increased tendency to proactively select goal-supportive environments (Duckworth et al., Reference Duckworth, Gendler and Gross2016), and support for policies that facilitate goal-consistent behaviour.
Blaming internal (e.g., lack of self-control) or external factors (e.g., lack of helpful food policies) for unhealthy food selections did not affect the relationship between goal failure and policy acceptance. Importantly, the null finding could also be due to the observed lack of variation in blame attribution, where most participants primarily blamed themselves for their dietary goal failures. However, our findings revealed a noteworthy tendency for participants to hold themselves accountable for their unhealthy dietary habits rather than attributing blame to external factors such as government policies or supermarket offerings. This suggests a high individualization of problems with adhering to dietary goals, which mirrors industry narratives that frequently encourage individuals to consume unhealthy products while simultaneously selling self-control programmes that claim to provide the ‘right mindset’ (Astrup et al., Reference Astrup, Bovy, Nackenhorst and Popova2006; Magnusson, Reference Magnusson2010; Binks, Reference Binks2016). Such messages may contribute to the prevalent perception that individuals are solely responsible for their dietary choices.
Perceived policy effectiveness in supporting individual dietary goals was positively related to acceptance in support of previous research (e.g., Petrescu et al., Reference Petrescu, Hollands, Couturier, Ng and Marteau2016; Reynolds et al., Reference Reynolds, Stautz, Pilling, van der Linden and Marteau2020; Mantzari et al., Reference Mantzari, Reynolds, Jebb, Hollands, Pilling and Marteau2022; Gold et al., Reference Gold, Lin, Ashcroft and Osman2023). However, we observed that dietary goal failure and perceived effectiveness were negatively correlated. While our data could not identify the causal structure of this relationship, controlling for perceived effectiveness in the main models remarkably reduced the negative relationship between dietary goal failure and policy acceptance. For out-of-home choices, the overall relationships turned positive and statistically significant. The negative relationship only remained for push policies when dietary failure was experienced at home. While we can only speculate about explanations, these results raise intriguing questions for emerging theories that aim to explain policy support (e.g., Grelle and Hofmann, Reference Grelle and Hofmann2024). The negative relationship between perceived effectiveness and dietary goal failure suggests relevant hidden heterogeneity regarding the impact of external factors on individual dietary decisions. These differences may reflect objective diversity in self-control challenges, with some individuals’ dietary failure being more susceptible to public policy than others. They may also indicate varying degrees of understanding about how external influences shape individual food choices. Underestimating the importance of the physical or regulatory environment in promoting healthy food choices may translate into higher goal failure (see Duckworth et al. (Reference Duckworth, Milkman and Laibson2018)) and undermine support for policies to address these causes of failure. Assuming that the presented policies are effective in promoting public health, people who better understand the impact of the food environment on their eating behaviour (through policy effectiveness) are more successful in navigating their own dietary goals (accepting supporting food policies). People who are more accepting of food interventions might do so because they are more aware that advertisements for sweets, nearby fast-food stores or untransparent food labelling negatively influence their diet. Hence, reducing such influences by adapting their choice architecture would, in turn, support them in reaching their dietary goals. Theory development regarding policy support could benefit from linking individual beliefs about the external determinants of failure and matching them with perceptions about how different policy instruments can successfully improve them.
Perceived intrusiveness is another theoretical construct associated with policy support (see Grelle and Hofmann (Reference Grelle and Hofmann2024)). Our refined measures of where and when a failure occurs show that dietary failure exhibits different relationships to policy support depending on whether it is experienced at home or out-of-home. Failures at home negatively relate to policy support. However, since shopping experiences typically precede home consumption, they could be pivotal in determining later goal failure. Consequently, our findings suggest that a more nuanced understanding of how people make causal attributions for their dietary failure along a sequential decision process and where a policy might influence their behaviour would enable us to more precisely identify whether and when people perceive public food policy as helpful or governmental overreach. Rather than conceptualizing intrusiveness as a feature of a specific policy instrument, it might be worthwhile exploring intrusiveness as a situational variable where its perception differs along several decision stages (i.e., shopping, preparing and eating) preceding goal failure.
Limitations
The present study has limitations. As only those individuals who were not completely satisfied with their diet and had the goal of eating healthier participated in our study, our results do not represent and thus cannot draw conclusions about food policy acceptance for the part of the population that is completely satisfied with their diet and/or that perfectly navigates their dietary goals. Future research should investigate the entire range of dietary satisfaction and intention to compare results on policy acceptance with those who are, e.g., not motivated to change their diets. Furthermore, participating in this study and, hence, reporting on each dietary choice certainly increased individual reflection on their choices and determinants. As such attention is likely to affect memorization, the observed relationship between situational experiences and policy attitudes might be exacerbated compared with situations where choices have not been monitored. This should, however, only affect the strength but not the direction of the observed dynamics. In addition to this concern, it is worth reiterating that our data is analysed on the individual level, where policy support was measured. Hence, we are unable to fully exploit the longitudinal structure of the ESM data and refrain from making any causal attributions in the observed relationships. While we see no reason to believe that changing policy attitudes can explain dietary goal failure in everyday life, we cannot rule out potential confounding by omitted variables. This limitation also applies to the choice to eat at home or out-of-home.
Next, the items used in this study to measure blame attribution were not ideal for our goal of measuring internal vs external attribution tendencies in food policy acceptance. We had only one item, ‘myself’, measuring internal attribution of blame, vs four items to measure external attribution of blame. Apparently, about 80% of our participants attributed the failure of their dietary goals to themselves, which limits the variance in blame attribution, making it difficult to find interactions with our proposed main link. A more refined measure for our purpose should be used in the future to obtain more reliable measures of differences in blame attribution.
Our key finding that dietary goal failure is related to lower food policy acceptance, primarily driven by push policies, has important implications for policymaking. As described above, push policies included comparatively more restrictive measures such as taxes and regulations. However, we did not directly measure the perceived intrusiveness of the policy or its associated costs in this study, which could help explain our main relationship and provide further insights for policymaking. To draw more concrete conclusions for policymakers, future work should follow up on these results and clarify how perceived policy intrusiveness and costs are related to our main findings.
Regarding our main relationship between dietary goal failure and food policy acceptance, we found contradictory results when inspecting food selections made at home and out-of-home. As our sample includes significantly more food selections made at home than outside, this imbalance affected our main results and obscured the positive relationship we found for dietary goal failure and pull policy acceptance out-of-home.
Conclusion and policy implications
Food environments affect the likelihood of individual goal success and are themselves shaped by policy. However, a policy is more likely to be politically feasible when supported by the public. The present study links individual goal failure to policy support by examining whether those who are dissatisfied with the success of their individually managed diet are more in favour of a public policy that supports healthy eating. Previous authors have suggested this link between individual self-control success and policy support as a promising area for self-control research (Kukowski et al., Reference Kukowski, Bernecker, Nielsen, Hofmann and Brandstätter2023; Hofmann, Reference Hofmann2024). However, this pathway is contingent on people's ability to link policy targets with the determinants of their own goal failure. The results of our study suggest that, on average, people experiencing more dietary goal failures have less favourable attitudes towards governmental support through food policies. They also doubt that these food policies would effectively support their dietary goal.
This main negative association, however, masks important heterogeneities: Given the detailed food choice data, we can offer a more nuanced analysis showing that policy support depends on the type of policy (pull policy vs push policy) and the location of food choices (at home vs out-of-home). Regulations targeting out-of-home food consumption not only address food choices that are less aligned with individuals’ goals but also receive more support from those who experience these failures. Consequently, ‘pull’ policies targeted at out-of-home dietary failure seem like a promising area to support people and are less likely to face public opposition. Conversely, people's failures experienced at home are less linked to support for regulatory intervention targeting food choice. Overall, it is particularly the push policies that exhibit a negative link between failure and policy attitudes, showing that despite people experiencing dissatisfaction with their diet, policies that restrict unhealthy choices or make them more expensive are not seen as support towards their own goal.
Our findings can also enhance (policy) communication strategies. By understanding the distinct contexts in which dietary goal failures occur – whether at home or out-of-home – policymakers can tailor their messaging to resonate more effectively with the public. For instance, emphasizing how out-of-home food regulations align with individuals’ personal health goals and reduce common dietary pitfalls may increase support for these policies – ideally avoiding a narrative where policies target people's food choices in their own homes. Given the negative link between perceived effectiveness and failure, there is potential to better communicate how the food environment interacts with people's food choices and how food policies effectively promote healthier eating habits. An approach distinct from advocating for the mere effectiveness of a policy but emphasizes the already existing mechanisms used by the private sector that a policy aims to influence in a way that supports individual dietary goals.
Overall, these findings indicate that simply asking about policy attitudes does not tell the whole story. People's attitudes towards food policies differ by type but are also influenced by their own experiences of failure in different food environments. A sufficiently detailed analysis is essential to understanding whether and when policy supports or impedes people's own goals.
Supplementary material
The supplementary material for this article can be found at https://doi.org/10.1017/bpp.2024.31
Acknowledgements
We thank Lucia A. Reisch for the funding of the data collection provided by the EU FP7 project ‘Nudge-it’ (No. 607310). C.A.K. received funding from the Swiss National Science Foundation (grant number: P500PS_210828). K.S.N. received funding from the Carlsberg Foundation (grant number: CF22-10).
Competing interest
The authors declare none.


 Open access