


Introduction
Public sector workers are the face of bureaucracies. Citizens have stereotypical beliefs about them. There is a wealth of competing stereotypes about public sector workers, both positive and negative. Public sector workers are often assumed to be lazy 9-to-5 workers (London Chamber of Commerce and Industry and Hays, 2011). Scholars have started to investigate what stereotypes exist of public sector workers empirically. Contrary to traditional beliefs, this literature shows that citizens do not only hold negative stereotypes, such as lazy, corrupt and inefficient, yet also positively stereotype public sector workers. Public sector workers are seen as warm, competent, caring, helpful and dedicated (De Boer, Reference de Boer2020; Willems, Reference Willems2020; Neo et al., Reference Neo, Bertram, Szydlowski, Bouwman, de Boer, Grimmelikhuijsen, Charbonneau, Moon and Tummers2023). Most studies focus on negative stereotypes, like the idea that public servants are lazy or not creative (Chen and Bozeman, Reference Chen and Bozeman2014). We, however, do the opposite. We focus on a positive stereotype: public sector workers are seen as caring and helpful.
There is some variation in the degree of positivity of stereotypes based on characteristics of the public sector workers, such as occupation, or characteristics of the citizens themselves such as subjective level of income (de Boer, Reference de Boer2020; Bertram et al., Reference Bertram, Bouwman and Tummers2022). While this literature is valuable for mapping what stereotypes exist, it does not help us understand the possible effects of these positive stereotypes. We assess the effect of positive stereotypes of public sector workers on workers’ behavior.
Within the stereotype activation literature, empirical evidence shows that activating positive stereotypes, also known as stereotype boost, can improve performance (Levy, Reference Levy1996; Shih et al., Reference Shih, Pittinsky and Ambady1999; Shih et al., Reference Shih, Pittinsky, Ho, Inzlicht and Schmader2012; Clark et al., Reference Clark, Thiem and Kang2017). In other words, people perform better in situations in which positive stereotypes of their group are activated (Shih et al., Reference Shih, Pittinsky, Ho, Inzlicht and Schmader2012). For instance, reminding men that they are stereotypically better at sports than women led them to perform better (Chalabaev et al., Reference Chalabaev, Stone, Sarrazin and Croizet2008). This study sets out to investigate the positive effects of stereotypes by focusing on positive stereotypes of public sector workers: What is the effect of positive stereotypes of public sector workers on their public service delivery? A pre-registered audit experiment is used in The Netherlands and Belgium to answer this research question.
Performance matters to citizens and is one of the main criteria on which citizens evaluate the government (Bouckaert and van de Walle, Reference Bouckaert, Van de Walle and Salminen2003). All citizens encounter government administrators, and evaluations of service quality are based on facts and not pre-conceived ideas (Bouckaert and van de Walle, Reference Bouckaert, Van de Walle and Salminen2003). People's experience of the administrative process is very important in the shaping of their attitude towards the government (Reisig and Parks, Reference Reisig and Parks2003; Tyler, Reference Tyler2006; Wang et al., Reference Wang, Jun and Wang2021). There are several criteria by which we can measure government quality and performance. One such approach, as outlined by Boyne et al. (Reference Boyne, Farrell, Law, Powell and Walker2003) includes three main criteria: efficiency, responsiveness and equity. In this paper, we focus on responsiveness.
We make three theoretical contributions. First, we contribute to the literature on public sector stereotypes. Most of the literature focuses on public sector workers and describes what stereotypes exist (de Boer, Reference de Boer2020; Willems, Reference Willems2020; Bertram et al., Reference Bertram, Bouwman and Tummers2022; with a notable exception of Szydlowski et al., Reference Szydlowski, de Boer and Tummers2022; Neo et al., Reference Neo, Bertram, Szydlowski, Bouwman, de Boer, Grimmelikhuijsen, Charbonneau, Moon and Tummers2023). We move this debate forward by studying the consequences of public sector stereotypes. Second, we expand the limited literature on positive stereotyping, and specifically of job stereotyping by testing how it affects public sector workers (Shih et al., Reference Shih, Pittinsky, Ho, Inzlicht and Schmader2012). Finally, the stereotype literature is focused almost exclusively on negative effects. We answer a call toward a positive public administration (Douglas et al., Reference Douglas, t'Hart, Ansell, Anderson, Flinders, Head and Moynihan2019) by focusing on the positive effects of positive stereotyping theory.
We make two practical contributions, for managers and for policy-makers. Firstly, from a practical standpoint, we know little how concrete managerial actions can influence desired employee outcomes (Vogel and Willems, Reference Vogel and Willems2020). A practical implication of our study is that applying pro-social stereotypes to workers would be used by managers to influence public service delivery. Hence it is a potential micro-intervention (Vogel and Willems, Reference Vogel and Willems2020). Thus, if activating a positive stereotype associated with work can affect public service delivery quality in a positive manner, it would be a concrete, low-cost managerial action to implement which can foster positive interaction between citizens and the state.
Secondly, we contribute to the development of behavioral public policy by showing the potential use of positive public sector worker stereotypes on the quality of public service delivery. By doing so, we expand the range of potential behavioral interventions to enhance performance. Consequently, this can lead to an improvement in citizen satisfaction with the government and interactions between citizens and the state.
Methodologically, we are answering a call for more field experiments within public administration (Hansen and Tummers, Reference Hansen and Tummers2020) and adhere to the practice of field experiments to test behavioral public policies (Sanders et al., Reference Sanders, Snijders and Hallsworth2018; Fels, Reference Fels2022). We conducted an audit experiment. Covert field experiments that record subjects’ behavior without their knowledge allow researchers to make strong causal claims that cannot be made with observational data and provide much less social desirability bias (Gaddis and Crabtree, Reference Gaddis and Crabtree2021). Field experiments have high value for practitioners and policy-makers as they allow for causal inference in real-world settings (Hansen and Tummers, Reference Hansen and Tummers2020).
Field experiments that test the application of behavioral interventions to policy design have become popular in informing policy decisions and behavioral public policy studies (Sanders et al., Reference Sanders, Snijders and Hallsworth2018; Fels, Reference Fels2022). Yet, most studies on behavioral interventions and field experiments center around nudges and boosting (Fels, Reference Fels2022; examples of studies include Arroyos-Calvera et al., Reference Arroyos-Calvera, Drouvelis, Lohse and McDonald2021; Gravert and Kurz, Reference Gravert and Kurz2021; Keppeler et al., Reference Keppeler, Sievert and Jilke2022; Van Roekel et al., Reference Van Roekel, Reinhard and Grimmelikhuijsen2022). We test a different type of low-cost intervention. Furthermore, in various field studies in public policy, high-quality scientific standards are not met, such as transparency by respecting pre-analysis plans (Fels, Reference Fels2022). We have conducted a pre-registered study and adhere to the open and rigorous research approach (Perry, Reference Perry2016; Vogel and Willems, Reference Vogel and Willems2020).
Theoretical framework
Public sector worker stereotypes
Stereotypes are beliefs about the characteristics, attributes and behaviors of members of specific groups (Stallybrass, Reference Stallybrass, Bullock and Stallybrass1977). For instance, the idea that public sector workers as a group are lazy is a stereotype. There is a long tradition of studying stereotypes, often regarding race (Vomfell and Stewart, Reference Vomfell and Stewart2021), gender (Régner et al., Reference Régner, Thinus-Blanc, Netter, Schmader and Huguet2019), nationality (Rad and Ginges, Reference Rad and Ginges2018) and age (Levy et al., Reference Levy, Pilver, Chung and Slade2014). When it comes to stereotypes in the workplace, studies have been focusing mostly on ethnic and minority characteristics, age and gender-specific characteristics (Ashton and Esses, Reference Ashton and Esses1999; Leach et al., Reference Leach, Carraro, Garcia and Kang2017; Willems, Reference Willems2020). Yet, studies rarely explicitly examine how job stereotypes affect workers.
There are some public sector worker stereotypes – positive and negative (Wilson, Reference Wilson1989; Goodsell, Reference Goodsell2004; Chen and Bozeman, Reference Chen and Bozeman2014; Neo et al., Reference Neo, Bertram, Szydlowski, Bouwman, de Boer, Grimmelikhuijsen, Charbonneau, Moon and Tummers2023). On the positive side, these studies demonstrate that public sector workers are stereotyped with pro-social traits including warm, caring and helpful (de Boer, Reference de Boer2020; Willems, Reference Willems2020; Bertram et al., Reference Bertram, Bouwman and Tummers2022; Neo et al., Reference Neo, Bertram, Szydlowski, Bouwman, de Boer, Grimmelikhuijsen, Charbonneau, Moon and Tummers2023). Related to this, there has been a long tradition in our field that studies job stereotypes implicitly. To illustrate, within the field of organizational behavior, scholars agree that public sector workers have distinct pro-social traits (see Vogel and Willems, Reference Vogel and Willems2020). Public sector work is based on the opportunity to make a positive difference in other people's lives (Bolino and Grant, Reference Bolino and Grant2016; Vogel and Willems, Reference Vogel and Willems2020). Thus, it is believed that individuals who enter the public sector do so due to a motivation for pro-social impact such as helping others (Lewis and Frank, Reference Lewis and Frank2002; Gregg et al., Reference Gregg, Grout, Ratcliffe, Smith and Windmeijer2011; Cowley and Smith, Reference Cowley and Smith2014). Pro-social behavior is characterized by actions intended to benefit others than oneself (Resh et al., Reference Resh, Marvel and Wen2018). Pro-social traits include being helpful, empathic and positive attitudes such as friendliness (Zhao et al., Reference Zhao, Ferguson and Smillie2016).
In addition, the public service motivation (PSM) literature provides substantial evidence for public sector workers having high pro-social traits. PSM refers to the intrinsic motivation and individual pro-social pre-dispositions associated with working in the public sector such as compassion, dedication to serve society and communities, self-sacrifice (Perry and Wise, Reference Perry and Wise1990; Grant, Reference Grant2008). A large body of empirical research demonstrates that public sector workers – compared to the private sector – are seen to possess higher levels of pro-social traits (Houston, Reference Houston2000; Lewis and Frank, Reference Lewis and Frank2002; John and Johnson, Reference John, Johnson, Park, Curtice, Thomson, Phillips, Johnson and Clery2008; Cowley and Smith, Reference Cowley and Smith2014).
Stereotyping and performance
Stereotype activation
Studying the effects – and activation of stereotypes – has a long tradition in the field of psychology (Shih et al., Reference Shih, Pittinsky, Ho, Inzlicht and Schmader2012). Stereotype activation theory posits that making relevant stereotypes cognitively accessible in a particular situation (activating the stereotype) influences the attitudes and behaviors of the stereotyped individual(s) (Marx et al., Reference Marx, Brown and Steele1999; Wheeler and Petty, Reference Wheeler and Petty2001; Gupta et al., Reference Gupta, Turban and Bhawe2008). Stereotype activation increases the cognitive accessibility of characteristics ascribed to members of the stereotyped group (Wheeler and Petty, Reference Wheeler and Petty2001), which influences people's attitudes toward and behaviors on the stereotyped task (Gupta et al., Reference Gupta, Turban and Bhawe2008). Notably, stereotype activation is believed to influence attitudes and behaviors even when people may not regard the stereotype as true for themselves or their group (Gupta et al., Reference Gupta, Turban and Bhawe2008). Thus, we expect that utilizing a pro-social stereotype about public sector workers serves as a trigger for pro-social behavior, by activating the cognitive accessibility of the characteristic of the worker, which in turn increases the confidence and motivation to follow the given characteristic.
Positive stereotyping effects
Positive stereotype activation and performance studies show mixed results. On the one hand, positive stereotypes are shown to decrease performance. Positive stereotypes are argued to lead to unrealistically high expectations (Ho et al., Reference Ho, Driscoll and Loosbrock1998) and worsen performance on tests (Cheryan and Bodenhausen, Reference Cheryan and Bodenhausen2016). Yet, scholars have suggested that negative effects of positive stereotyping stem from imposing higher expectations that create stress (Cheryan and Bodenhausen, Reference Cheryan and Bodenhausen2016). The extent to which the stereotype heightens stress levels could influence whether the effects of positive stereotyping are positive or negative (Shih et al., Reference Shih, Pittinsky, Ho, Inzlicht and Schmader2012).
On the other hand, positive stereotyping is also shown to increase performance. It is associated with self-fulfilling prophecies and confirmation bias (Madon et al., Reference Madon, Guyll, Aboufadel, Montiel, Smith, Palumbo and Jussim2001). In other words, activating a positive stereotype can lead individuals to act accordingly to the stereotype. Clark et al. (Reference Clark, Thiem and Kang2017) found that activating positive stereotypes can act as a bolster to a person's belief regarding their abilities and task performance. They found that Asian-Americans performed better in a math test after their ethnic identity was activated with positive traits associated with their group. Levy (Reference Levy1996) has shown that activation of negative terms associated with the elderly (e.g. senile, dementia) produced deficits in the memory abilities of elderly participants. Meanwhile, the activation of positive terms associated with the elderly (e.g. wise, experienced) produced an enhancement of the elderly participants’ memory abilities. Shih et al. (Reference Shih, Pittinsky and Ambady1999) found that Asian American women performed better on a mathematics test when their Asian identity was cued, but worse when their gender identity was cued.
The mixed empirical evidence on activating positive stereotypes raises the question, do positive stereotype effects hold when it comes to job stereotyping for public sector workers? One key difference to consider is that studies about gender, age and race stereotypes are addressing characteristics that an individual does not necessarily choose. An individual will have much more ease in deciding which group to join in terms of professional identity, compared to which group one belongs to on the aforementioned characteristics.
Positive stereotyping effects and public service delivery
Substantial evidence from organizational and social psychology literature demonstrates that the opportunity to make a meaningful difference in the lives of others has a large motivational potential (Grant, Reference Grant2008) and it increases performance (Hackman and Oldham, Reference Hackman, Hackman and Oldham1980; Vogel and Willems, Reference Vogel and Willems2020). A meta-analysis shows that the opportunity to help others through one's job positively affects performance (Humphrey et al., Reference Humphrey, Nahrgang and Morgeson2007). Thus, employees’ opportunity to affect and help the lives of others (i.e. task significance) enhances employees’ perception of job meaningfulness and leads to better performance (Hackman and Oldham, Reference Hackman, Hackman and Oldham1980; Vogel and Willems, Reference Vogel and Willems2020).
Grant's theory (Reference Grant2008) posits that connecting people to their ‘pro-social’ motivation and impact enhances employee performance. A core purpose of public service work is to make a positive difference in the health, safety and well-being of individuals, groups and communities (Perry, Reference Perry1996; Reference Perry1997; Grant, Reference Grant2008). The individuals, groups and communities that benefit from these jobs depend on pro-socially motivated employees to perform them effectively (Grant, Reference Grant2008). Indeed, public sector workers are demonstrated to have pro-social traits and motivation (Lewis and Frank, Reference Lewis and Frank2002; Gregg et al., Reference Gregg, Grout, Ratcliffe, Smith and Windmeijer2011; Cowley and Smith, Reference Cowley and Smith2014). As presented earlier, empirical evidence shows they are also stereotyped accordingly.
The rationale for our hypotheses is as follows: Since public sector workers often have pro-social traits (Lewis and Frank, Reference Lewis and Frank2002; Gregg et al., Reference Gregg, Grout, Ratcliffe, Smith and Windmeijer2011; Cowley and Smith, Reference Cowley and Smith2014), and that making the pro-social aspect of work salient (i.e. reconnecting them to pro-social aspects of their work) is associated with better performance (Humphrey et al., Reference Humphrey, Nahrgang and Morgeson2007), we expect that activating pro-social stereotypes will remind the workers of their pro-social impact and lead to better performance quality during public service delivery compared to a control group. Thus, based on Grant's theory (Reference Grant2008), we hypothesize that:
H1: Activating pro-social public sector workers stereotypes will lead to better quality of public service delivery in terms of response rate.
H2: Activating pro-social public sector stereotypes will lead to better quality of public service delivery in terms of information provision.
Public service delivery
We hypothesize that activating positive stereotypes of public sector workers will lead to better quality during public service delivery. Now, we must explain what we mean by public service delivery.
In recent decades, governmental reforms have undergone profound changes in terms of public service delivery, often under the banner of New Public Management (NPM) (Andrews and Van de Walle, Reference Andrews and Van de Walle2013; Haddad et al., Reference Haddad, Mssassi and Makkaoui2020). The quality of public service delivery has become a prominent criterion within public administration and become a standard means to evaluating public service delivery (Andrews and Van de Walle, Reference Andrews and Van de Walle2013). Additionally, public service delivery quality is a criterion by which citizens judge the government (Bouckaert and Van de Walle, Reference Bouckaert, Van de Walle and Salminen2003).
Public service quality has been defined as meeting the expectations of citizens (Wisniewski, Reference Wisniewski1996; Haddad et al., Reference Haddad, Mssassi and Makkaoui2020). Service quality can also be defined as the difference between citizen's expectations of service and the perceptions of the service after it is received (Paul et al., Reference Paul, Mittal and Srivastav2016). For instance, did a civil servant reply to me in one week, as I expected s/he would have? Service quality is recognized as a major factor responsible for citizen satisfaction with public administration (Paul et al., Reference Paul, Mittal and Srivastav2016). Furthermore, public service quality is strongly linked to the personnel delivering that service (Haddad et al., Reference Haddad, Mssassi and Makkaoui2020).
Similarly, public service performance is defined as the extent to which the organization's performance meets or exceeds citizens’ expectations (Wang et al., Reference Wang, Jun and Wang2021). Although quality and performance are distinct concepts, their interdependence is evident, as the perception of service quality is, in part, reliant on performance. Service quality evaluation encompasses five main categories: tangible elements, reliability, responsiveness, assurance and empathy (Parasuraman et al., Reference Parasuraman, Zeithaml and Berry1985). Similarly, government performance is assessed based on efficiency, responsiveness, equity and effectiveness (Andrews and van de Walle, Reference Andrews and Van de Walle2013). Citizen satisfaction has become increasingly crucial for evaluating government performance, aligning with the same definition as for service quality – the extent to which the organization's performance meets or surpasses citizens’ expectations (Wang et al., Reference Wang, Jun and Wang2021). Responsiveness emerges as a common criterion in the evaluation of both service quality (Parasuraman et al., Reference Parasuraman, Zeithaml and Berry1985) and government performance (Andrews and van de Walle, Reference Andrews and Van de Walle2013), underscoring the shared focus on client satisfaction.
The satisfaction of users or consumers hinges on the actual performance of the service, aligning with or exceeding anticipated standards (Parasuraman et al., Reference Parasuraman, Zeithaml and Berry1985; Mbassi et al., Reference Mbassi, Mbarga and Ndeme2019). Parasuraman et al. (Reference Parasuraman, Zeithaml and Berry1988) further elaborate that perceived service quality results from a comparative process, where clients evaluate the services offered by an organization in relation to their perception of the organization's performance (Mbassi et al., Reference Mbassi, Mbarga and Ndeme2019). Therefore, public service quality can be comprehended as a dimension or derivative of performance, reflecting the intricate relationship between the two concepts in the context of governmental reforms and citizen-centric governance paradigms.
A key theme in bureaucratic encounters in service delivery pertains to public sector workers’ responsiveness (Thunman et al., Reference Thunman, Ekström and Bruhn2020). Taxpaying citizens expect value for money, which is why responsiveness and efficiency are important aspects of public service delivery quality (Bourgon, Reference Bourgon2007). Public service delivery quality is indeed characterized by efficiency, responsiveness and equity (Andrews and Van de Walle, Reference Andrews and Van de Walle2013). Parasuraman et al. (Reference Parasuraman, Zeithaml and Berry1988) conceptualized a five-dimensional model for service quality: reliability, responsiveness, empathy, assurance and tangibility. Today, their quality measuring instrument is a standard for service quality (Paul et al., Reference Paul, Mittal and Srivastav2016). Responsiveness in public service delivery is the desire of the organization to efficiently deliver service, to help customers and to offer a prompt service (Parasuraman et al., Reference Parasuraman, Zeithaml and Berry1988). Similarly, outcome – did you get what you needed – is one of the main drivers of service satisfaction among citizens (Daniels, Reference Daniels2016). Receiving an answer to an inquiry, for instance about a public-school program or healthcare is an example of responsiveness, and in turn, public service delivery quality. We therefore define public service delivery quality in terms of responsiveness: (a) whether we received a response, and (b) whether information was provided for all questions asked (Jilke et al., Reference Jilke, van Dooren and Rys2018; Van Dooren and Jilke, Reference Van Dooren and Jilke2022).
Responsiveness in citizen encounters encompasses the timely and supportive assistance provided in specific situations (Hofstetter and Stokoe, Reference Hofstetter and Stokoe2015; Thunman et al, Reference Thunman, Ekström and Bruhn2020). Defined literally as being ‘quick to respond or react appropriately or sympathetically; answering’ (Liao, Reference Liao2018; Webster services dictionary), responsiveness is further elaborated as the organization's commitment to efficiently delivering services, aiding citizens and ensuring prompt assistance (Parasuraman et al., Reference Parasuraman, Zeithaml and Berry1988). Framed within the social contract of governance, where governments are elected to serve the people, the importance of responsiveness is underscored by its role in citizens’ evaluations of the government and public administration (Vigoda, Reference Vigoda2000).
In performance control, responsiveness is pivotal, representing the speed and accuracy with which service providers address requests for action and information (Thomas and Palfrey, Reference Thomas and Palfrey1996; Vigoda, Reference Vigoda2000). The quality of interactions with public sector workers, as demonstrated in studies by Wang et al. (Reference Wang, Jun and Wang2021) and Brown (Reference Brown2007), influences how citizens assess a service, with poor-quality interactions leading to lower service ratings. Beyond individual encounters, responsiveness during public service delivery is ingrained in the core values that citizens use to evaluate public organizations (Meier and Bohte, Reference Meier and Bohte2006; Brown, Reference Brown2007; Wang et al., Reference Wang, Jun and Wang2021), and its manifestation in the services directly shapes citizens’ satisfaction with the organization (Rölle, Reference Rölle2017). In this sense, responsiveness is an important performance metric by which citizens evaluate the government.
Furthermore, responsiveness is an important performance metric beyond performance per se. Indeed, it relates to procedural justice and administrative burden, which in both cases impact citizen–state relations. Procedural justice is defined as citizens being treated with trust, fairness, respect and neutrality (Murphy and Tyler, Reference Murphy and Tyler2008). In essence, it refers to the fairness of the process by which authorities make decisions and treat citizens (Tyler, Reference Tyler2003). It can be related to the fairness of decision-making and the quality of the treatment of citizens (Blader and Tyler, Reference Blader and Tyler2003). Evidence shows that citizens’ evaluation of public sector workers and the services they receive is not only determined by the ultimate outcome (i.e. being able to place your father in a given nursing home), but also by how they are treated during contact with the public sector workers (i.e. did I even receive an answer? Did the public sector worker address all of my questions or concerns?) (Blader and Tyler, Reference Blader and Tyler2003; Wells, Reference Wells2007; Wang et al., Reference Wang, Jun and Wang2021).
Moreover, if people are treated fairly, with respect and neutrality, they are more likely to comply with decisions and directives (Hinds and Murphy, Reference Hinds and Murphy2007; Murphy and Tyler, Reference Murphy and Tyler2008; Wang et al., Reference Wang, Jun and Wang2021). Responsiveness – such as answering inquiries and providing information – is part of fair, respectful and neutral interactions with citizens. Ultimately, cross-national comparisons of citizen trust in government show that a fair and equitable process is more important than the assessments of government performance itself (Van Ryzin, Reference Van Ryzin2011; Moynihan et al., Reference Moynihan, Herd and Harvey2015). In sum, citizens care as much or more about the process of their interactions with the state as they do about the outcome (Moynihan et al., Reference Moynihan, Herd and Harvey2015).
Additionally, responsiveness is relevant to the administrative burden. Put simply, a lack of responsiveness or a bad quality of responsiveness can increase the administrative burden for citizens, especially regarding learning costs. Administrative burden refers to one's experience of policy implementation as onerous (Burden et al., Reference Burden, Canon, Mayer and Moynihan2012). In other words, it refers to the costs individuals experience in their interactions with the state (Moynihan et al., Reference Moynihan, Herd and Harvey2015). Learning costs appear when individuals engage in search processes to collect information about public services and assess how they are relevant to themselves, as, for instance inquiring about the steps to enroll one's parent in a public nursing home (Moynihan et al., Reference Moynihan, Herd and Harvey2015). Inconsistent information, lack of response and incomplete information to one's inquiries can, therefore, increase learning costs associated with navigating state policies and programs – the process of public service delivery. In turn, this increases the administrative burden for citizens, negatively impacting citizen–state relations.
Therefore, proper responsiveness to citizens during public service delivery has policy implications. We can improve citizen–state relations by investigating behavioral public policy strategies that positively enhance responsiveness during public service delivery. The learning costs associated with administrative burden can be altered. Public sector workers play a vital role. Their work discretion allows a considerable margin for increasing or decreasing administrative burden (Brodkin and Lipsky, Reference Brodkin and Lipsky1983; Lipsky, Reference Lipsky1984; Keiser and Soss, Reference Keiser and Soss1998; Soss et al., Reference Soss, Fording and Schram2011). Their work, therefore, affects the difficulties clients may have in accessing services to which they are entitled. Therefore, behavioral public policies that encourage public sector workers to decrease administrative burden, such as in learning costs by replying to requests and providing complete information, are valuable.
NPM ushered in a customer-oriented restructuring, redefining citizens as customers and seeking to enhance public service quality through a client-oriented approach (Haddad et al., Reference Haddad, Mssassi and Makkaoui2020; Thunman et al., Reference Thunman, Ekström and Bruhn2020). NPM aimed to improve public services by emphasizing efficiency, consistency and responsiveness to citizens’ needs, borrowing inspiration from the private sector's customer-service orientation (Hood, Reference Hood1991; Andrews and van de Walle, Reference Andrews and Van de Walle2013).
However, there are fundamental differences between serving and responding in the public sector and private firms. First, public organizations, governed by concerns for social welfare, equity and fair distribution of public goods, face a more intricate role than private businesses (Vigoda, Reference Vigoda2000; Daniels, Reference Daniels2016). Unlike private organizations driven by constant competition and financial incentives, public entities may not gain financially from providing better service to citizens, often grappling with budget constraints determined in advance (Milakovich, Reference Milakovich2003). Consequently, the public sector is more concerned with equity, fairness and efficient resource utilization, underlining the multifaceted nature of their relationship with citizens (Milakovich, Reference Milakovich2003).
Why is public service delivery important?
Speaking to citizen-state interactions more broadly, poor public service delivery performance, and as such bad quality of it can decrease the trust that citizens have toward the government. Public service delivery is a representation of the government and its bureaucracy, as it deals directly with a core function of governments: providing services (Bouckaert, Reference Bouckaert2002; Besley and Ghatak, Reference Besley and Ghatak2007; Hadian, Reference Hadian2017). As seen, responsiveness is directly related to the quality and performance of these services. Good quality of public service delivery is crucial for a well-functioning public administration, affecting citizen trust and relations with the public sector (Bouckaert, Reference Bouckaert2002; Van de Walle and Bouckaert, Reference Van de Walle and Bouckaert2003; Hadian, Reference Hadian2017; Jilke et al., Reference Jilke, van Dooren and Rys2018). Public distrust toward the government is often associated with the functioning of public services (Van de Walle and Bouckaert, Reference Van de Walle and Bouckaert2003). Bad performance and quality of public service delivery can fuel negative stereotypes of governments in general and low trust (Van de Walle and Bouckaert, Reference Van de Walle and Bouckaert2003). Similarly, good quality services foster trust and positive stereotypes of government (Van de Walle and Bouckaert, Reference Van de Walle and Bouckaert2003). High public service delivery quality can lead to higher satisfaction in citizens (Hung et al., Reference Hung, Huang and Chen2003; Mbassi et al., Reference Mbassi, Mbarga and Ndeme2019). Thus, a major consequence of public service delivery of poor quality is the impact it has on citizens’ trust toward the government which ultimately affects citizen-state relations (Bouckaert and Van de Walle, Reference Bouckaert, Van de Walle and Salminen2003).
The impact of public service delivery quality can be explained by micro-performance theory. It refers to how the functioning of public administrators influences citizen perceptions of the government (Van de Walle and Bouckaert, Reference Van de Walle and Bouckaert2003). Citizens’ evaluations of the government are influenced by the quality of the service delivery from a given administrator. Put simply, the good quality of public service delivery by administrators during service delivery leads to satisfied customers (citizens) which, in turn, positively influences their attitude and trust toward the government. This is done not only by the macro functioning of the government but also through the micro – such as individual experiences. Improving the quality of public service delivery is a key goal for governments as public services are a key determinant of quality of life (Besley and Ghatak, Reference Besley and Ghatak2007).
Performance matters to citizens and is one of the main criteria on which citizens evaluate the government (Bouckaert and van de Walle, Reference Bouckaert, Van de Walle and Salminen2003). All citizens encounter government administrators, and evaluations of service quality are based on facts and not pre-conceived ideas (Bouckaert and van de Walle, Reference Bouckaert, Van de Walle and Salminen2003). People's experience of the administrative process is very important in the shaping of their attitude toward the government (Reisig and Parks, Reference Reisig and Parks2003; Tyler, Reference Tyler2006; Wang et al., Reference Wang, Jun and Wang2021). There are several criteria by which we can measure government quality and performance. One such approach, as outlined by Boyne (Reference Boyne1996) includes three main criteria: efficiency, responsiveness and equity. In this paper, we focus on responsiveness.
The use of positive public sector worker stereotypes to improve public service delivery quality is relevant from a policy perspective, too. Such low-cost behavioral interventions, as bringing emphasis on positive stereotypes, may help enhance citizens’ experience of the administrative process and may improve citizen-state interactions.
Methods
To test our hypotheses, we developed a scalable audit experiment. First, we tested our manipulation checks – via a survey – to assess whether our e-mails successfully activated the positive public sector pro-social stereotype of a ‘helpful worker’ (Willems, Reference Willems2020; Bertram et al., Reference Bertram, Bouwman and Tummers2022). Then, we tested the effect of the positive stereotype on public service delivery. Our design can be replicated across sectors, stereotypes and countries. Ethical concerns when it comes to audit experiments are often raised. We therefore obtained ethical approval for the study and its procedures through the ethical committee of the faculty of Law, Economics and Governance of Utrecht University. For more detailed discussions about the ethics of audit studies, please refer to Crabtree (Reference Crabtree and Gaddis2018), Lahey and Beasley (Reference Lahey, Beasley and Gaddis2018) and Gaddis and Crabtree (Reference Gaddis and Crabtree2021).
Our design follows state-of-the-art practices of other audit experiments (Crabtree, Reference Crabtree and Gaddis2018; Lahey and Beasley, Reference Lahey, Beasley and Gaddis2018; Gaddis and Crabtree, Reference Gaddis and Crabtree2021). The experimental design of the audit study methodology relies on sending identical information requests that differ by one attribute (in this case, stereotype activation) of the sender. The behavior (in this case, public service delivery) of the audited agents will be assessed by comparing response rates and the information provision across randomly assigned e-mails (Jilke et al., Reference Jilke, van Dooren and Rys2018; Van Dooren and Jilke, Reference Van Dooren and Jilke2022). The e-mail itself was kept short to decrease the burden for employees. Each organization received one e-mail only to keep the administrative burden low (Jilke et al., Reference Jilke, van Dooren and Rys2018).
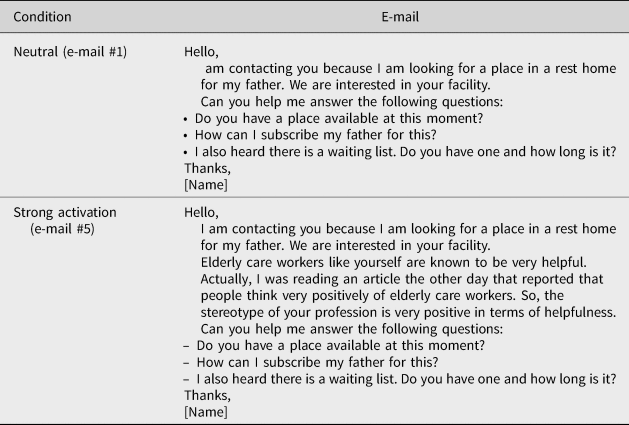
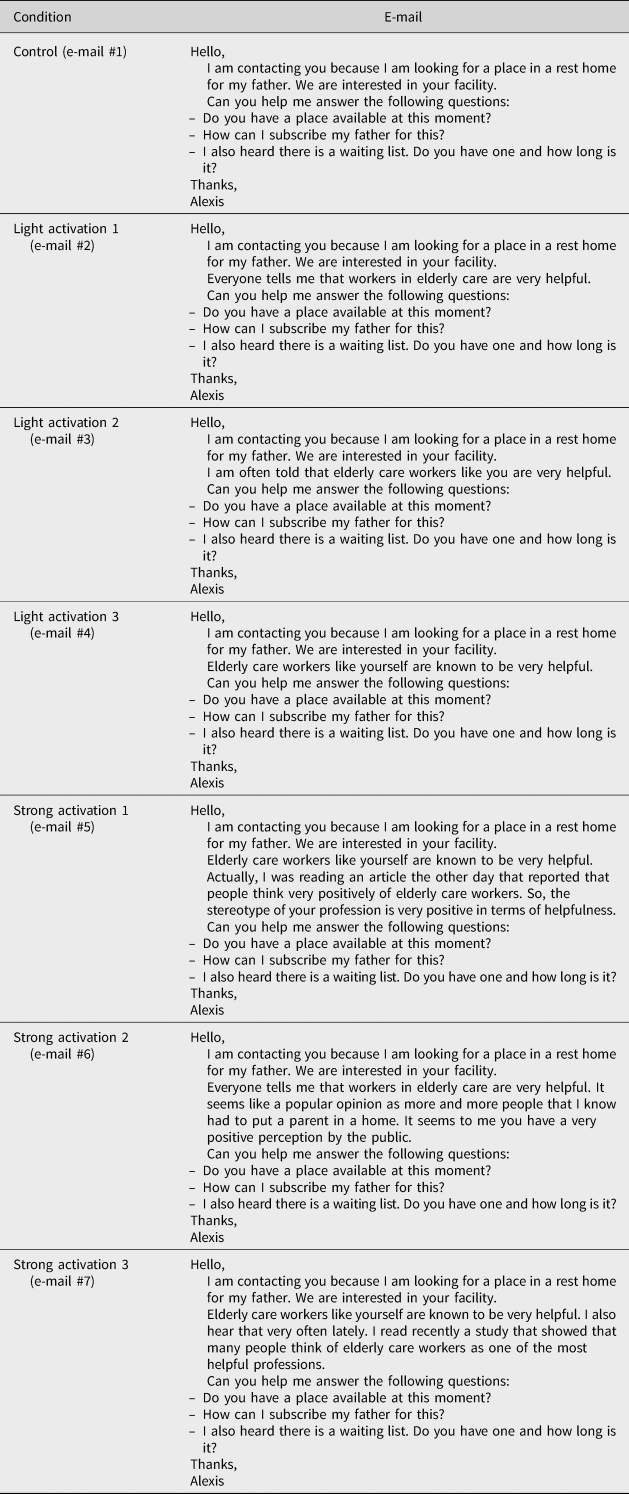
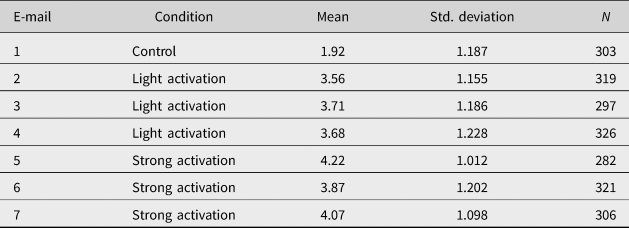
To test our manipulation, we tested seven e-mails (Appendix A). We based our text on e-mails used in other audit studies (Jilke et al., Reference Jilke, van Dooren and Rys2018; Van Dooren and Jilke, Reference Van Dooren and Jilke2022). For details about the design and procedure, measures, sample and results, please refer to Appendix B. The manipulation check for stereotype activation was successful. Based on the results, we selected two e-mails: the control e-mail (e-mail 1, M = 1.92) and the highest-scoring e-mail (e-mail 5, M = 4.22) (see Table 1).
Selected E-mails

Design and procedure
The purpose of this study was to test the effect of activating a pro-social stereotype on public service delivery. Our study was pre-registered at https://osf.io/wm8j3/?view_only=71135b7ecdbe44f5a61fe49edca06cd9 and supplementary materials, syntax and data are available at https://osf.io/txejk/?view_only=6751981ff1ef4489920396f12d23faf8. We chose nursing homes as the context for our audit study. In the Netherlands, every citizen in need of long-term care (i.e. nursing home) can rely on public funding, as the government finances and safeguards the functioning of the long-term care market (Bos et al., Reference Bos, Margareth Kruse and Theodoor Jeurissen2020). Similarly, in Belgium, the nursing home sector is a regulated public service market by the central government (Jilke et al., Reference Jilke, van Dooren and Rys2018; Van Dooren and Jilke, Reference Van Dooren and Jilke2022). Based on residents’ care needs, the government allocates daily amounts to pay for facilities, where the compulsory national health insurance scheme bears the medical and nursing expenses (Van Dooren and Jilke, Reference Van Dooren and Jilke2022). Thus, in both cases, nonprofit and public nursing homes are funded by the government, count as a public market and have been entrusted by the government to carry-out public services (Van Dooren and Jilke, Reference Van Dooren and Jilke2022).
We found through public records online access to e-mails of nursing homes in the Netherlands and Belgium. We compiled all e-mails and randomized them into one of the two conditions: no stereotype activation (control, e-mail 1) and strong stereotype activation (e-mail 5, three sentences). Each nursing home received one e-mail inquiring about their services and was given two weeks to reply (Jilke et al., Reference Jilke, van Dooren and Rys2018).
Measures
Pro-social stereotype activation
We activated the pro-social stereotype of a ‘helpful worker’ (Table 1, e-mail 5). Our e-mails were randomized between male and female senders to minimize any gender effects of the senderFootnote 1 (Grohs et al., Reference Grohs, Adam and Knill2016). We picked the most common female and male names culturally common to both the Netherlands (https://forebears.io/netherlands/forenames) and Belgium (https://forebears.io/belgium/forenames) to minimize any SES connotations for discrimination (Jilke et al., Reference Jilke, van Dooren and Rys2018). This resulted in Monique (the most popular name in the Netherlands, fourth in Belgium) for females, and Jan (the most popular male name in the Netherlands, sixth in Belgium). We also picked the most common surname in both countries (de Jong for the Netherlands and Peeters for Belgium). We coded the control condition as 0 and the stereotype activation condition as 1.
Public service delivery
We chose two outcome variables that represent core aspects of responsiveness in public service delivery: response rate and information provision (Jilke et al., Reference Jilke, van Dooren and Rys2018). Both outcomes were binary (coded as 0 or 1).
Response rate
We evaluated whether the response rate differs between groups (0 – no response, 1 – response). Automatic replies were excluded (such as thank you for your message, we will get back to you in X working days), and we only included actual replies from employees.
Information provision
We asked in the e-mail three questions about the organization's services. Adequate public service delivery will be defined as having answered all three questions (coded as 1). If not all questions were answered, the public service delivery performance will be coded as 0.
Exploratory measures
We have pre-registered exploratory variables to deepen the understanding of our results. We investigated friendliness as a dependent variable, and gender of the sender as predictors on all three dependent variables. We have also explored the effect of country as an exploratory independent variable on our dependent variables. Country exploratory effects are in Appendix C. We have included these exploratory variables for different facets of public service delivery. Friendliness relates to administrative burdens as psychological costs of the procedure. Gender and country of the sender as characteristics of the workerFootnote 2.
Friendliness
We investigated friendliness as a third dependent variable. We operationalized friendliness as saying ‘thank you’ in the response back. Examples would include ‘thank you for your e-mail/contacting us’ and ‘thank you for your interest in our facility’. We did not include using ‘thank you’ in the signature of the e-mail. We coded e-mails as 0 if there was no in-text ‘thank you’, and 1 if there was. Automatic replies were excluded (such as ‘thank you for your e-mail we will get back to you in X working days’).
Expressing gratitude, such as saying ‘thank you,’ is a form of friendliness or being friendly (Percival and Pulford, Reference Percival and Pulford2020). Research suggests that verbal expressions of politeness and gratitude influence interpersonal perceptions, reducing formality and increasing friendliness ratings (Percival and Pulford, Reference Percival and Pulford2020). That is, when individuals express ‘thank you’ in social interactions following a compliment, they are perceived as friendlier (Algoe et al., Reference Algoe, Dwyer, Younge and Oveis2020; Percival and Pulford, Reference Percival and Pulford2020). The act of thanking someone is linked to the theory of reciprocal altruism, which posits that gratitude helps regulate our response to altruistic acts, fostering positive social interactions (Algoe et al., Reference Algoe, Dwyer, Younge and Oveis2020; Carter et al., Reference Carter, Chen, Razik and Shakelford2020).
Furthermore, friendliness during bureaucratic encounters is also relevant to public administration. Studies show that citizens’ satisfaction with the government is not limited to service outcomes, but is also influenced by the process through which citizens receive services (Reisig and Parks, Reference Reisig and Parks2003; Tyler, Reference Tyler2006; Brown, Reference Brown2007; Wells, Reference Wells2007; Wang et al., Reference Wang, Jun and Wang2021). Friendly and polite interactions from public employees can add to a better experience of the bureaucratic encounter, which can result in higher levels of satisfaction with service provision (Wang et al., Reference Wang, Jun and Wang2021).
Gender
We have coded for the gender of the sender, male (0) and female (1) to investigate gender effects.
Sample
We used the G*Power program for our power calculation, based on a Cohen's d of 0.2 (f 2 = 0.02 in G*Power). The calculation estimated 636 participants required for a power of 0.9 and an alpha of 0.05. We chose a small effect size as the literature does not provide enough evidence for a medium or large effect size.
We e-mailed 849 homes and received 573 replies, with a reply rate of 67.5%. A sample of 573 allows for a power of 0.85 instead of 0.9. We aimed to contact all nursing homes in the Netherlands and Flemish Belgium. However, certain nursing homes are part of larger chains, and while offering many locations, provide only one general e-mail for inquiries about placement. Thus, we excluded all nursing homes that provided the same contact e-mail address while keeping the one general address. By doing so, we limit spillover between our conditions. Larger chains are more common in the Netherlands, leaving us with a sample with a majority nursing homes located in Flemish Belgium. We also removed all homes that had a private for-profit component in both countries, leaving us with a sample of public and nonprofit nursing homes.
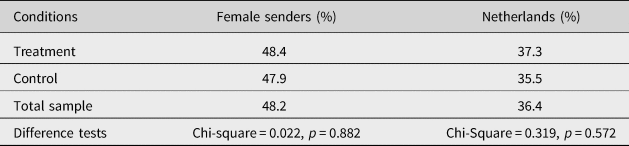
Table 2 shows our sample demographics in terms of gender and country and the randomization check. We assessed the sample conditions for homogeneity with a chi-square test on the gender of the sender and country of the experiment. The differences are all insignificant showing that randomization was successful – our treatment and control groups do not significantly differ on both demographic variables.
Demographic comparison across groups and randomization test for gender and country

We had two exclusion criteria. Firstly, e-mails not successfully delivered due to invalid addresses have been excluded (Jilke et al., Reference Jilke, van Dooren and Rys2018). Second, responses were considered invalid if they are received two weeks after the e-mail had been sent out (Jilke et al., Reference Jilke, van Dooren and Rys2018). We have excluded 10 replies in total for answering after two weeks (6 in Belgium and 4 in the Netherlands). We had 15 invalid e-mail addresses in total.
Statistical analysis
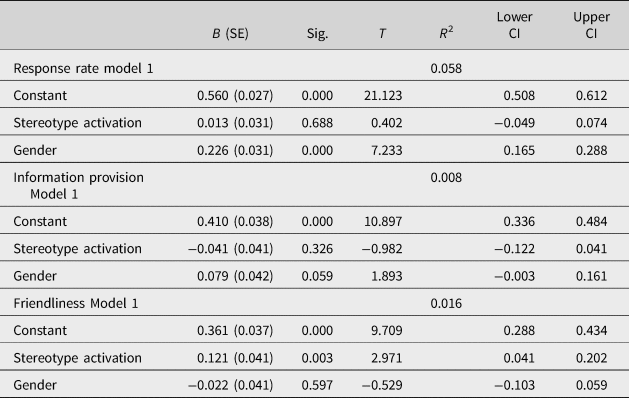
We have conducted an ordinary least square (OLS) regression on each main outcome variable: (a) response rate, and (b) information provision. We opted for an OLS over a logistic regression based on experimentalist recommendations (Angrist and Pischke, Reference Angrist and Pischke2008). We have conducted the same regression on our exploratory dependent variable of friendliness. Therefore, we have two pre-registered main outcome variables and one exploratory outcome variable. We have also performed OLS regressions with our exploratory independent variable of gender. All of our (exploratory) analyses were pre-registered. We applied the Bonferroni correction to all analyses to account for multiple testing. Summary statistics for the results are in table 3.
Results
Hypothesis 1
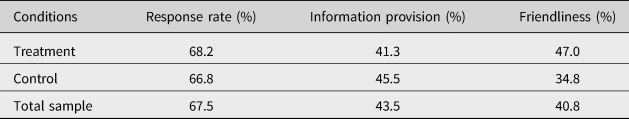
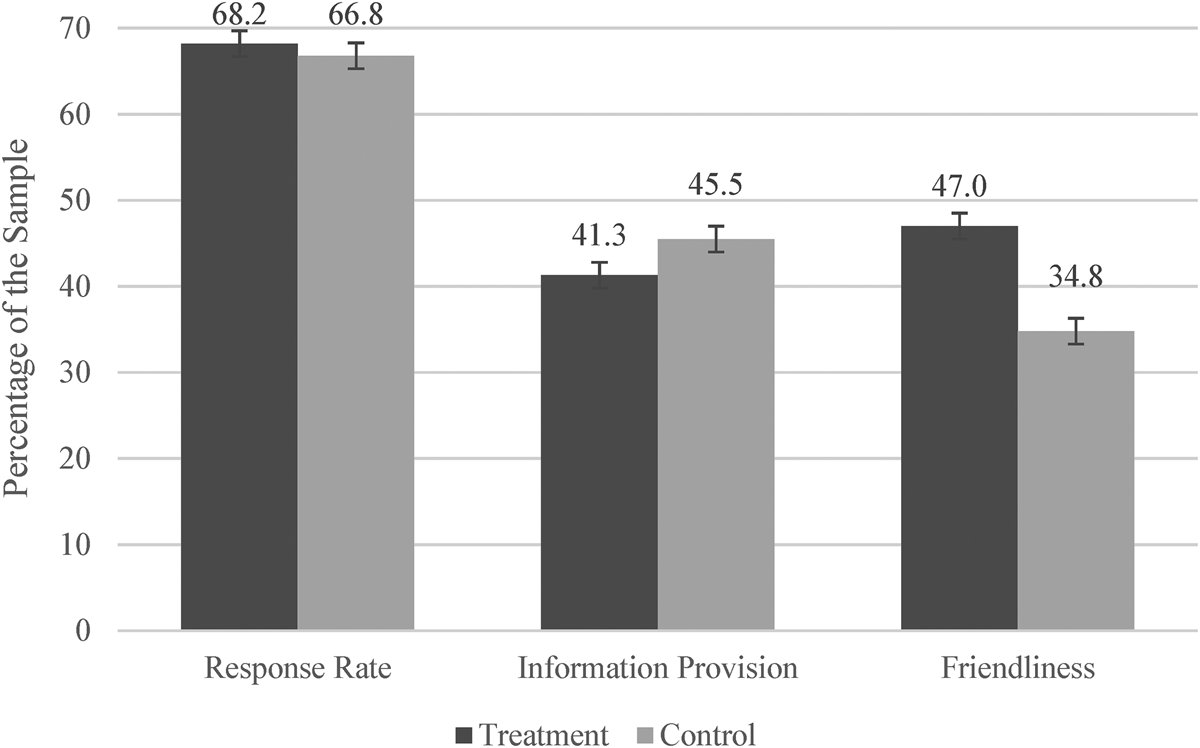
Hypothesis 1 stated that a pro-social stereotype activation would lead to a better quality of public service delivery in terms of response rate. Activating a pro-social stereotype did not affect reply rate (B = 0.014, SE = 0.032, R 2 = 0.000, p = 0.670). In the stereotype activation condition, the reply rate was 68.2%. In the control condition, the reply rate was 66.8%. Hypothesis 1 is rejected.
Hypothesis 2
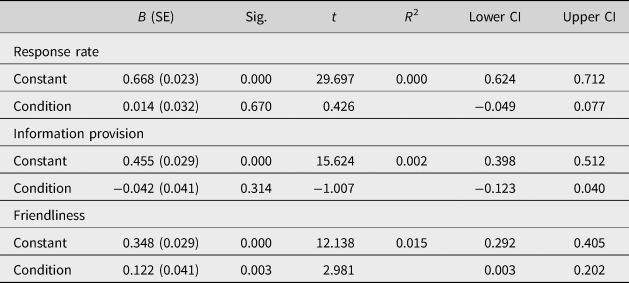
Hypothesis 2 stated that a pro-social stereotype activation would lead to a better quality of public service delivery in terms of information provision. Activating a pro-social stereotype did not affect information provision (B = −0.042, SE = 0.041, R 2 = 0.002, p = 0.314). In the stereotype activation condition, 41.3% of responses provided answers to all three questions, similarly as in the control condition with 45.5% of full answers. Hypothesis 2 is rejected (see Table 4 and Figure 1).
Summary statistics for results

Ordinary least square regression of stereotype activation

Stereotype activation effects on response rate, information provision and friendliness. Note: The Y-axis, ranging from 0 to 70, shows the sample percentage. Each condition shows 95% error bars.

Exploratory analyses – stereotype activation on friendliness
We investigated whether a pro-social stereotype activation affected the friendliness of the reply. We find that activating a pro-social stereotype leads to more friendliness in the replies from the workers toward the clients (B = 0.122, SE = 0.041, R 2 = 0.015, p = 0.003). In the stereotype activation condition, 47.0% of answers were friendly compared to 34.8% in the control condition.
Exploratory analyses – gender effects
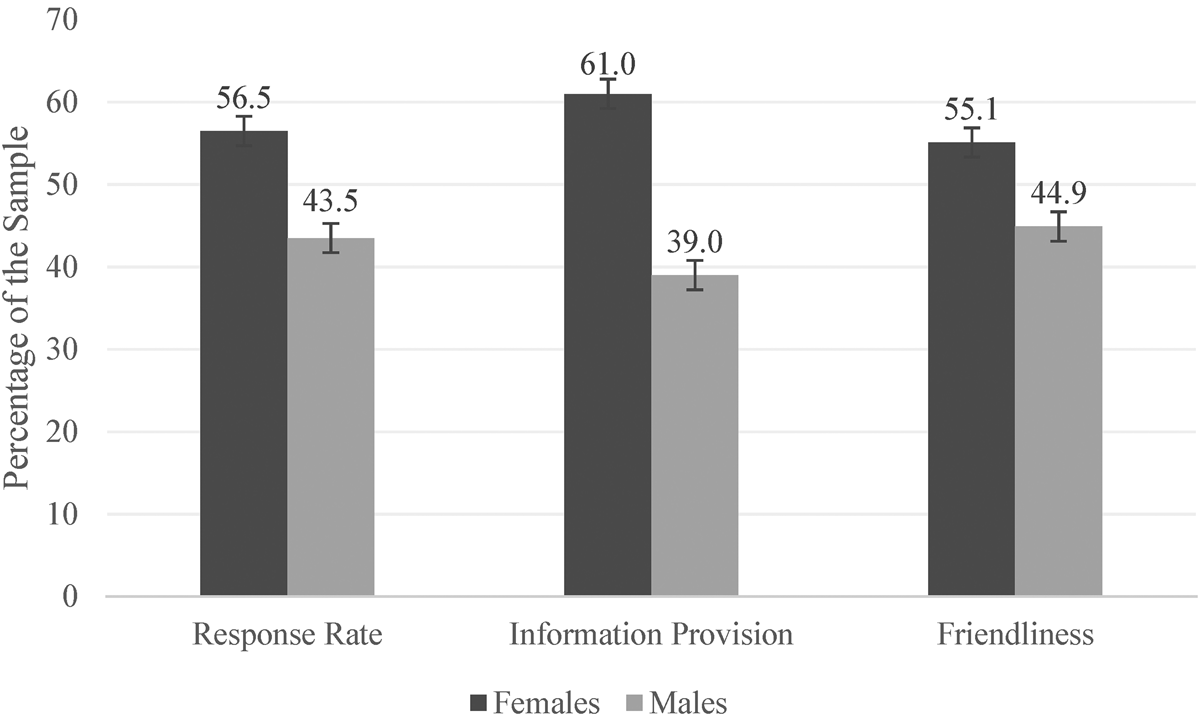
For all three dependent variables, we included the gender of the sender and stereotype activation as predictors in an OLS (see Table 5)Footnote 3. Results are represented in Figure 2.
Gender effects on response rate, information provision and friendliness.

Exploratory OLS regression results – effects of gender

Response Rate
We explored whether the gender of the sender affected the reply rate. We find that gender affects the reply rate (B = 0.226, SE = 0.031, R 2 = 0.058, p < 0.001). Senders who are women receive more replies than men, roughly 10% more consistently in both conditions. In the total sample, 56.5% of replies (324 e-mails) were for female senders, while 43.5% (248 e-mails) were for male senders on a total of 573 replies.
Information provision
We investigated whether the gender of the sender affected the information provision. We find that gender does not affect information provision, although significant at the 0.10-level (B = 0.079, SE = 0.042, R 2 = 0.008, p = 0.059). That is, women received 22% more of complete replies than men. In total, 249 e-mails provided complete information provision, in which 97 were for males (39%) and 152 were for females (61%).
Friendliness
We examined whether the gender of the sender affected friendliness of the reply. We find that gender has no effect on friendliness (B = −0.022, SE = 0.041, R 2 = 0.016, p = 0.597).
Discussion and conclusion
We investigated whether activating a pro-social stereotype improves the quality of public service delivery. We have conducted a field experiment on two aspects of responsiveness of public service delivery: response rate and information provision. Our results drive us to distinguish public service delivery quality into two parts: bureaucratic outcome and bureaucratic process. We find that a pro-social stereotype activation does not affect bureaucratic outcome of response rate and information provision. However, in our exploratory analyses, we find that a pro-social stereotype activation does affect the bureaucratic process. Activating a pro-social stereotype led public sector workers to be friendlier toward citizens in the form of gratitude (saying thank you) in their replies, by around 12%. The fact that our results drive us to distinguish between outcome and process is in line with previous research. Citizens’ evaluation of public services is not limited to the outcomes but is also influenced by the process (Reisig and Parks, Reference Reisig and Parks2003; Tyler, Reference Tyler2006; Brown, Reference Brown2007; Wells, Reference Wells2007; Wang et al., Reference Wang, Jun and Wang2021). Friendly and polite interactions from public employees can enhance the experience of bureaucratic encounters (Wang et al., Reference Wang, Jun and Wang2021). Additionally, in our exploratory analyses, we find that the personal characteristic of gender does affect bureaucratic outcomes: women receive roughly 10% more replies than men.
Why did stereotype activation affect the process and not the outcome? A first explanation may be found in the task concordance between the stereotype activation and the effect of the activation on our outcome variable. Our stereotype activation was not about employee performance per se, but about the process with the client (being helpful). Looking at stereotype activation literature, the evaluated outcome task is often straightforwardly connected to the stereotype being induced. To illustrate, stereotyping to be good/bad at math would be tested by math tests (Shih et al., Reference Shih, Pittinsky and Ambady1999; Clark, Thiem and Kang, Reference Clark, Thiem and Kang2017), stereotyping being good/bad in a sport would be tested with sport performance (Chalabaev et al., Reference Chalabaev, Stone, Sarrazin and Croizet2008), stereotyping memory would be tested with memory tests (Levy, Reference Levy1996). It is possible that the stereotype of being helpful in our study was not as directly related to our outcome (reply rate and information provision), but more related with the process with the client. Future research is needed to dissect the relation between task concordance and the stereotype being activated.
A second explanation may be found in identity mechanisms. Stereotype activation literature emphasizes that for a stereotype to have an effect, the stereotyped person must identify with the stereotype-domain (Smith and Johnson, Reference Smith and Johnson2006). For instance, if one stereotypes women as bad drivers, then for the stereotype to have an effect, one must identify as a woman. It is possible that our stereotype did not activate the professional identity of nursing home workers that would affect our professional outcome measure (i.e. reply rate and information provision) but solely activated a pro-social identity and in turn affected the process outcome measure of being helpful. Pro-social behavior is characterized by actions intended to benefit others than oneself (Resh et al., Reference Resh, Marvel and Wen2018). Friendliness falls under the umbrella of pro-social behaviors (Malti and Dys, Reference Malti and Dys2018). Future research is needed to identify underlying mechanisms when activating stereotypes such as identity based on professional group belonging. A fruitful start could be to measure the distinctive roles of PSM (Perry, Reference Perry1996) and pro-social motivation (Francois and Vlassopoulos, Reference Francois and Vlassopoulos2008) when developing and testing stereotype activation interventions.
Our findings make important contributions to our field. First, most of the current literature investigating public sector worker stereotypes focuses on describing what stereotypes exist (de Boer, Reference de Boer2020; Willems, Reference Willems2020; Bertram et al., Reference Bertram, Bouwman and Tummers2022). We show that public sector stereotypes can have effects on citizen-state interactions. Our results demonstrate that positive stereotypes do not alter the outcome of public services (i.e. information provision and response rate remain the same) but do affect the process of public services (i.e. public sector workers are friendly when stereotyped). This is in line with the recent work of Szydlowski et al. (Reference Szydlowski, de Boer and Tummers2022) who demonstrated that showing vulnerability by public sector workers makes citizens behave more compassionately. More research is needed that investigates the consequences of different types of stereotypes for the process of citizen-state interactions.
Second, most of the work on stereotypes focuses on personal characteristics such as gender, age and race (Levy et al., Reference Levy, Pilver, Chung and Slade2014; Régner et al., Reference Régner, Thinus-Blanc, Netter, Schmader and Huguet2019; Vomfell and Stewart, Reference Vomfell and Stewart2021). Our field is no exception and is almost exclusively focused on studying stereotypes of citizens’ and workers’ personal characteristics (e.g. Keiser, Reference Keiser2010; Jilke et al., Reference Jilke, van Dooren and Rys2018; Raaphorst et al., Reference Raaphorst, Groeneveld and Van de Walle2018; Harrits, Reference Harrits2019). We show that stereotypes of professional identity also matter. Thus, our results demonstrate that job stereotype effects exist in the public work setting. It is worthwhile to continue to study the effects of stereotypes related to social groups people chose to enter with more ease, while being aware of the stereotypes of these groups. Observational and experimental methods may be a useful combination.
Finally, we showed that positive public sector stereotypes do not affect bureaucratic outcomes in terms of response rate and information provision which may be reassuring. However, we showed that the citizens’ gender does affect the outcome of bureaucratic procedures. We showed that women received more replies than men, around 10%. It could be interpreted that men are discriminated in terms of outcome when receiving elderly care services based on their name. However, this interpretation seems too simple when we delve into the discrimination literature in our field. In general, this literature is almost exclusively studies name-based discrimination when it comes to racial or ethnic minorities (e.g. Jilke et al., Reference Jilke, van Dooren and Rys2018; Guul et al., Reference Guul, Villadsen and Wulff2019). A notable exception is Grohs et al. (Reference Grohs, Adam and Knill2016) who also studied gender effects on service provision. Contrary to our results, men received more replies than women in their study across two domains: childcare and mobile home requests. Yet, they did not find a clear pattern of gender-based discrimination. They did, however, find indication that the policy context of the service being provided sometimes favors men and sometimes favors women. More specifically, men received more complete information and higher service when requesting for childcare, whereas women received more complete information and higher service orientation when requesting for mobile homes. Our study was conducted only in the context of nursing home requests.
These two studies together show the relevance of the call for a heterogeneity revolution in behavioral sciences and theory (Bryan et al., Reference Bryan, Tipton and Yeager2021). Both field experiments investigating responsiveness in public service provision find different results in terms of outcome and process based on clients’ personal characteristics of gender. Both field experiments test different domains of public service access: nursing home requests, childcare requests and mobile home requests. Depending on the domain, women or men received more answers and more complete answers. Therefore, the personal characteristic of gender does affect bureaucratic outcomes in public service provision, we just cannot explain yet how exactly and why. Theoretically, it is worthwhile to dissect if policy context explains why sometimes men and sometimes women receive better quality services when interacting with the state. It may also be fruitful to test if the gender of the public sector workers themselves offers insights into these mixed results on name-based discrimination. The representative bureaucracy literature may be helpful here because there is evidence that shared values (e.g. based on gender or race) improve outcomes for citizens, which could explain differences in service delivery (Guul, Reference Guul2018; Wright and Headley, Reference Wright and Headley2020).
Our findings have implications for practice. First of all, the bureaucratic process is associated with several costs for the client, including psychological costs (Moynihan et al., Reference Moynihan, Herd and Harvey2015). Psychological costs refer to frustrations and stresses that arise from interacting with the state (Moynihan et al., Reference Moynihan, Herd and Harvey2015). When individuals depend upon the state for vital resources – such as the provision of health services – uncertainty about the receipt of those benefits, as well as frustrations in the process of seeking those may increase stress. There is evidence that individuals that care for an old relative have higher stress (Pinquart and Sörensen, Reference Pinquart and Sörensen2003), yet little is known about how interactions with public sector workers to obtain benefits of caregiving (such as healthcare for nursing homes) affect that stress (Moynihan et al., Reference Moynihan, Herd and Harvey2015). Psychological costs have been addressed in terms of friendliness from the worker in research (Olsen et al., Reference Olsen, Kyhse-Andersen and Moynihan2022). Our findings show that we are able to activate a pro-social stereotype in workers that may reduce psychological costs for the clients, in terms of friendliness. Public sector workers in the stereotype activation condition were friendlier to the clients, which can make them feel more welcomed (Olsen et al., Reference Olsen, Kyhse-Andersen and Moynihan2022).
Secondly, our findings contribute to practice in terms of the importance of the micro-interactions between the state and citizens (Van de Walle and Bouckaert, Reference Van de Walle and Bouckaert2003). The functioning of public administrators influences citizen perceptions of the government (Van de Walle and Bouckaert, Reference Van de Walle and Bouckaert2003). Thus, citizens’ stereotypes, attitudes and trust in the government are influenced by the interactions and quality of the service delivery from a given administrator. Positive interactions between public sector workers and citizens are therefore a key goal. Our findings suggest a low-cost way to do so: activating a pro-social stereotype of public sector workers. Future research should test this effect more closely to grasp a better understanding of how we can potentially implement this. One way is to investigate which mechanisms are at play. Practically, there is quite a research gap in how concrete managerial actions can influence desired employee outcomes (Vogel and Willems, Reference Vogel and Willems2020). Thus, applying pro-social stereotypes to workers would be used by managers to influence the public service delivery process – as a sort of micro-intervention (Vogel and Willems, Reference Vogel and Willems2020).
Future research should explore the evaluation and perceived value of friendlier replies from public sector workers, particularly those incorporating expressions of gratitude, during the delivery of public services. It would be valuable to investigate whether responses containing phrases such as ‘thank you for your interest in our home’ or ‘thank you for your message’ are regarded as friendlier, more competent or preferable for interaction with a public sector worker, compared to replies that do not include such elements. Future research should assess the direct impact of such gratitude-infused replies on citizens’ perceptions of the quality of public service delivery and the bureaucratic process. Understanding the dynamics of how these responses are evaluated can provide insights into enhancing overall citizen-state interactions.
Thirdly, our findings have practical implications for policy-makers. Future research could compare whether the same bureaucratic outcome and process effects are found across policy domains like finance, healthcare and education. This may be especially relevant in areas where private counterparts are often deemed to provide a better quality service, such as in healthcare (Pongsupap and Van Lerberghe, Reference Pongsupap and Van Lerberghe2006; Daneshkohan et al., Reference Daneshkohan, Zarei and Ahmadi-Kashkoli2020).
As such, policy-makers and scholars should consider developing and testing communication strategies emphasizing positive stereotypes specific to workers in different policy domains. We also encourage future research to replicate our results (Sanders et al., Reference Sanders, Snijders and Hallsworth2018). Additionally, our gender effects have further implications for policy-making. Our results show that your gender matters when you reach out to the government for services.
Finally, our findings must be considered in the light of some limitations. Our limitations pertain to generalizability and context, measures and design. In terms of generalizability, we are limited in generalizing to the public sector as a whole, as our sample was composed of public and of nonprofit organizations. That is, our population may not have fully identified as public sector workers. We are also limited to our context of testing. We cannot claim that our effect would generalize in other areas of the public sector (i.e. teaching, police and tax officials). Future studies should investigate stereotype activation effects on public sector-specific stereotypes and organizations.
Additionally, we are limited in our measures. We cannot know whether our stereotype activation worked because it activated the stereotype of a helpful worker, or the personal value of helping. Future research should examine which stereotype-relevant domain was at play. We are also limited in our measure of friendliness, and cannot claim how the effect would transfer to face-to-face interactions or tones of interactions. Finally, we are also limited in our measures for public service delivery, and thus cannot completely rule out the potential effects of stereotype activation on bureaucratic outcomes. Future research should examine other aspects of the outcome, such as efficiency, response time and time invested in a client with stereotypes more in line with the outcome.
Lastly, we are also limited in terms of our design. To gain a comprehensive understanding of the causal effects of activating public sector worker stereotypes, further investigation into information equivalence of conditions is necessary. Currently, we face limitations in drawing definitive conclusions about the effects of our e-mails, as we lack insight into the underlying cognitive processes associated with reading them. In order to address this limitation, future studies should focus on assessing participants’ perceptions of the various stereotype-activating materials, for instance, in terms of warmth, friendliness and openness. This evaluation of information equivalence, its constructs and its effects would provide valuable insights on the process of stereotype activation. Moreover, it is important to acknowledge that our study was conducted as a field experiment, which inherently lacks the high level of control typically found in laboratory settings. Consequently, we are limited in making exclusive claims that our results are solely attributed to stereotype activation. Alternative interpretations, such as the possibility that the observed effects stem from general politeness rather than stereotyping, should be considered. Future studies should investigate this nuance in depth.
Furthermore, our experimental design has limitations. The absence of a placebo group with is noteworthy. Instead, our study includes only a control group and a positive stereotype group, omitting a third group exposed solely to a positive message without a stereotype. This decision stems from constraints related to the limited statistical power of our sample size, compounded by the unavailability of additional nursing homes for inclusion, as we have already incorporated all such facilities in the Netherlands and Flemish Belgium.
Consequently, our design limitation hinders us from definitively discerning whether the observed increase in friendliness in responses within the stereotyped condition results from activating a positive stereotype or reciprocating a positive message. However, evidence supports the notion that friendliness, kindness and pro-social behavior can elicit reciprocal responses in interactions (Lubell and Scholz, Reference Lubell and Scholz2001; Pelaprat and Brown, Reference Pelaprat and Brown2012), studies in social dilemmas and behavioral game theory present mixed and inconsistent findings regarding the reciprocity of behavior (Komorita et al., Reference Komorita, Parks and Hulbert1992; Sheldon, Reference Sheldon1999; Parks and Rumble, Reference Parks and Rumble2001). Future research could delve into whether similar effects emerge in a positive message condition compared to a positive stereotype activation condition.
Moreover, another design limitation pertains to our manipulation check. In a survey experiment, we performed the manipulation check on a separate sample of public sector workers. Results may have been different if we had tested our manipulation check in the field. Due to a lack of more possible participants in our study, we could not test our conditions in the field. Future research should take this limitation into account.
One last design limitation pertains to our limited measures. That is, our primary measures of responsiveness in public service delivery are binary measures. Although binary measures do have their advantages, such as simplicity and ease of interpretation, they provide better control over study variables, they reduce potential biases and increase the accuracy of results, and they are cost-effective in studying biases and behaviors (Deeks, Reference Deeks2002; Bischof et al., Reference Bischof, Cohen, Cohen, Foos, Kuhn, Nanou, Visalvanich and Vivyan2022). In our design, we built on the work of other audit studies that also use binary measures (Jilke et al., Reference Jilke, van Dooren and Rys2018; Van Dooren and Jilke, Reference Van Dooren and Jilke2022). However, they also come with their disadvantages, such as a lack of nuance by oversimplifying phenomena, they reduce available information and may be limited to understand more complex situations such as social interactions (Dolnicar, Reference Dolnicar2003; Bischof et al., Reference Bischof, Cohen, Cohen, Foos, Kuhn, Nanou, Visalvanich and Vivyan2022). In other words, they limit the range of information that is available. Future research should go beyond binary measures and also incorporate other measures such as response time, e-mail tone, degree of precision of the answers to the questions and amount and type of information in the e-mail.
Conclusion
We demonstrate that activating the positive stereotype of a helpful worker affects the bureaucratic process by increasing the friendliness of the employee. Our results suggest that a positive attitude of citizens toward the public sector worker (i.e. activating a positive stereotype) will generate a positive attitude from the public sector workers toward the client (i.e. being friendly). Positive stereotypes, however, do not affect bureaucratic outcomes regarding responsiveness in public service delivery. Our findings demonstrate that not only positive stereotypes but also citizens’ gender affects the result of the bureaucratic process. Women receive more answers to requests for nursing home placement than men.
Data availability
Data and supplementary materials are available at https://osf.io/txejk/?view_only = 6751981ff1ef4489920396f12d23faf8
Funding statement
Funding by the Nederlandse Organisatie voor Wetenschappelijk Onderzoek (NWO) for the project ‘Lazy Bureaucrats? Studying Stereotypes of civil servants and its effects across countries' (VIDI.185.017). Grant number ‘NWO VIDI VIDI.185.017’.
Competing interest
The authors declare no potential conflict of interest.
Ethics approval statement
Ethical approval of the faculty ethical review committee from the faculty of Law, Economics, and Governance of Utrecht University was obtained.
Appendix A
All tested e-mails

Appendix B
Manipulation check
Design and procedure
In order to test our manipulation, we developed seven e-mails: one neutral (control), three with a light stereotype activation (one stereotype activation sentence) and three with a strong stereotype activation (three stereotype activation sentences). These are shown in Appendix A. All e-mails ask the same questions and vary solely whether none, one, or three stereotype sentences of a helpful worker were integrated. The control condition is suitable because – as opposed to developing positive and negative e-mails – it provides a true baseline. In this way, we can assess the stereotype activation (Lonati et al., Reference Lonati, Quiroga, Zehnder and Antonakis2018). We based our e-mails on e-mails used in other audit studies (Jilke et al., Reference Jilke, van Dooren and Rys2018; Van Dooren and Jilke, Reference Van Dooren and Jilke2022). Our e-mails had the sole purpose of activating stereotypes. It was not possible to establish if this mimicked an everyday e-mail the workers receive. We are, however, unable to verify this since it would require access to the e-mail accounts of elderly care home workers. To not fatigue, bore, or reveal our manipulation to our respondents, the respondents were randomized to rate three e-mails. In sum, we tested whether our pro-social stereotype of a helpful worker was indeed activated, and if there was a difference in strength of activation between the conditions. Our study was pre-registered at https://aspredicted.org/BLO_RPI and supplementary materials, syntax and data are available at https://osf.io/txejk/?view_only=6751981ff1ef4489920396f12d23faf8.
Measures
This data collection was integrated as a part of a larger survey experiment. Additionally to our main measures, we also have demographics: age, gender and years of experience in the public sector.
Pro-social stereotype activation
We assessed whether the pro-social stereotype of a helpful worker was activated, and the extent to which the activation varied across conditions. We asked participants: ‘To what extent is the worker being stereotyped as “very helpful”?’. Participants rated this question on a 5-point Likert scale (from 1 – not at all to 5 – very much). We chose a popular, unisex name (Alexis) to avoid possible gender and discrimination effects (Bilan et al., Reference Bilan, Mishchuk, Samoliuk and Mishchuk2020).
Sample
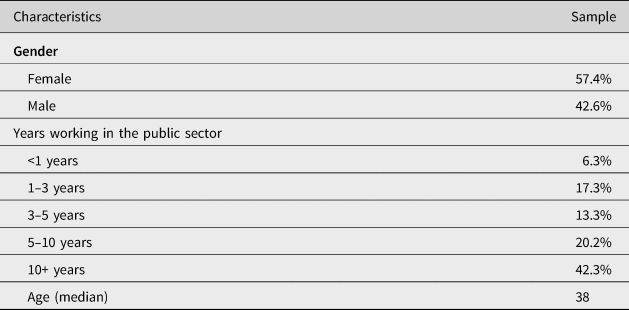
Participants were recruited in the United Kingdom through an online survey panel (Prolific). We did a power calculation for seven groups and a MANOVA (for two independent variables). We pre-registered two independent variables. As only one variable is of interest for this paper, we report only one. The second variable attempted to foreshadow our experimental results to aid in the study design. We asked participants their willingness to respond to the client in the e-mail and to answer all questions. The analyses on our second variable are available in the Supplementary Materials on OSF https://osf.io/txejk/?view_only=6751981ff1ef4489920396f12d23faf8. Our sample consisted of 57% females with a median age of 38 years. Table B1 provides the details.
Manipulation check sample demographics (n = 718)

We used the G*Power program with a small effect size (f = 0.02). This led us to an estimation of 658 participants with a power of 0.95 and an alpha of 0.05. All participants are workers in the public sector. Participants who did not pass two out of three attention checks were excluded from the analysis. No participants were excluded for failing attention checks. In the end, our sample consists of 718 participants.
Results
To analyze the results, we performed a MANOVA on the mean scores of each item.
Stereotype activation
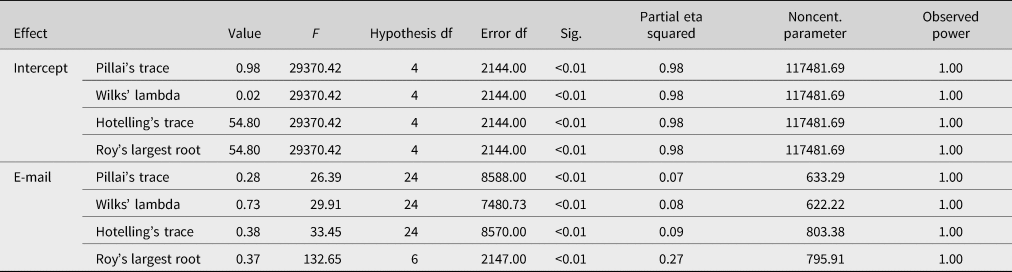
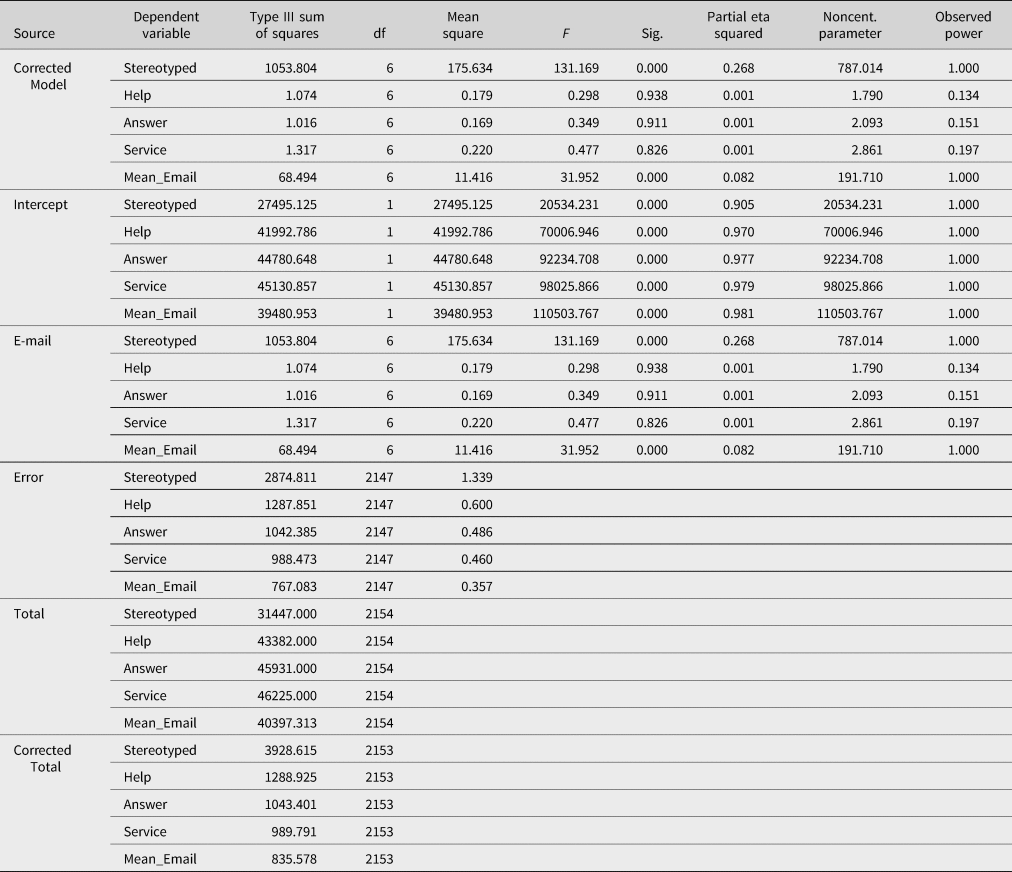
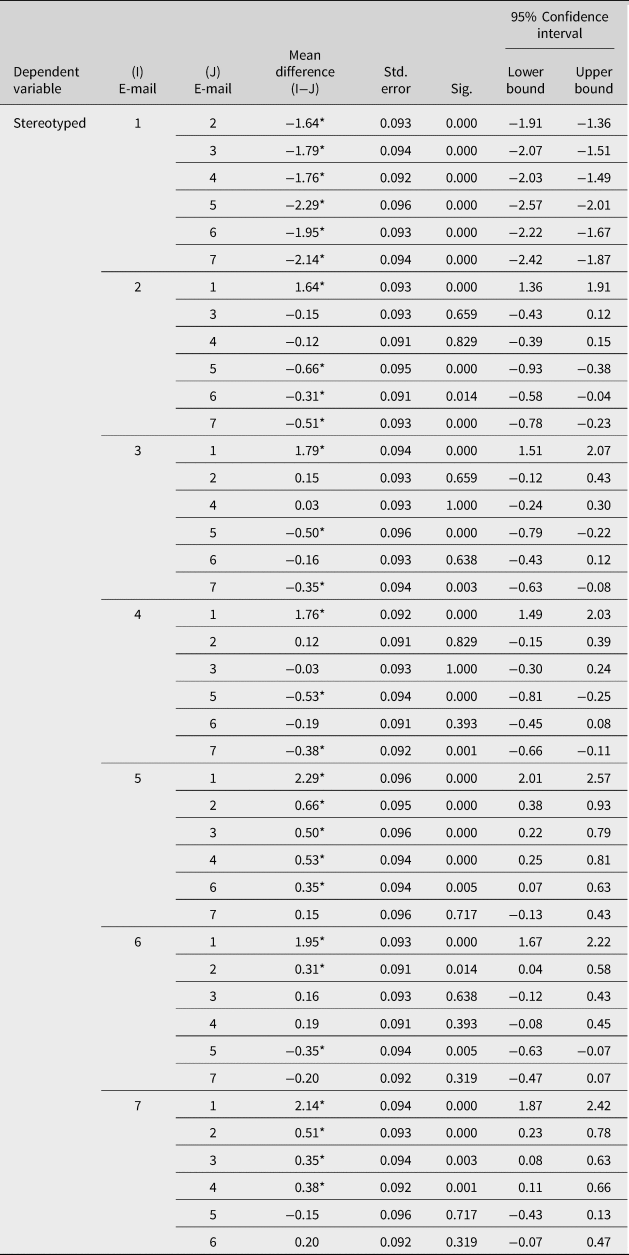
The manipulation check for stereotype activation and strength of stereotype activation was successful. That is, there was a significant statistical difference between the neutral condition, the light activation conditions and the strong activation conditions: (F (24, 7480.73) = 29.91, p < 0.001; Wilk's Lambda = 0.726, partial Eta2 = 0.08). Please refer to Table B2 for the e-mails’ descriptives and Tables B3 and B4 for the MANOVA results. The post-hoc Tukey HSD showed statistical difference in stereotype activation between the control e-mail and the light activation condition [Mean difference = −1.79, 95% CI = (−2.07, −1.51)], the light activation condition and the strong activation condition [Mean difference = −0.50, 95% CI = (−0.79, −0.22)], and between the control condition and the strong activation condition [Mean difference = −2.29, 95% CI = (−2.57, −2.01)]. Table B5 shows the post-hoc tests results of the e-mails’ comparison.
E-mail descriptives on stereotype activation

MANOVA results – multivariate tests

MANOVA – tests of between-subjects effects

Post-hoc tests (Tukey HSD) for E-mail means comparison

For the main study, we selected e-mails number one – control – (M = 1.92, SD = 1.19) and five – strong activation – (M = 4.22, SD = 1.01). Based on the results, we deemed that the differences between the strength of activation of the light and strong conditions were too small, even though significant. Thus, we have decided to only select two e-mails instead of three for the main study: the control e-mail (e-mail 1, M = 1.92) and the highest-scoring e-mail (e-mail 5, M = 4.22). This also helped to increase the power of the main study.
Appendix C
Exploratory analyses – country effects
For all three dependent variables, we included country and stereotype activation as predictors in an OLS. Results are presented in Table C1.
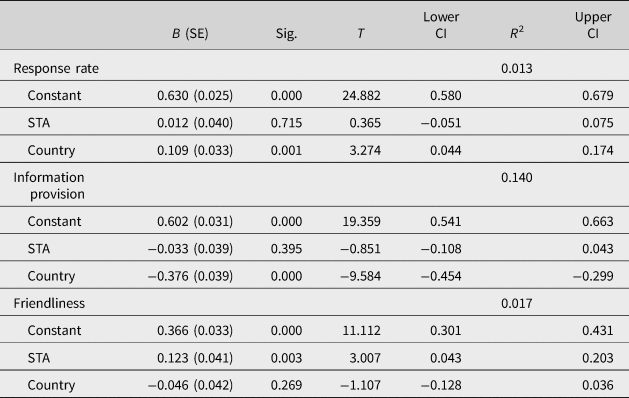
Response rate
We explored whether there was a difference in response rates between countries. We find that the country affects the reply rate (B = 0.102, SE = 0.047, R 2 = 0.013, p = 0.03). We find that there is a higher reply rate in the Netherlands (74.4%) than in Flemish Belgium (63.5%).
Information provision
We investigated whether the country of the sender affected the information provision. We find that the country affects information provision (B = −0.398, SE = 0.056, R 2 = 0.141, p < 0.001). Our results show that fewer replies in the Netherlands provided an answer to all three questions (20.1%) compared to Belgium (58.6%).
Friendliness
We examined whether the country of the sender had an effect on the friendliness of the reply back. We did not find any effects to suggest differences in effects based on country (B = −0.020, SE = 0.059, R 2 = 0.018, p = 0.739).
Exploratory OLS regression results – country effects

Appendix D
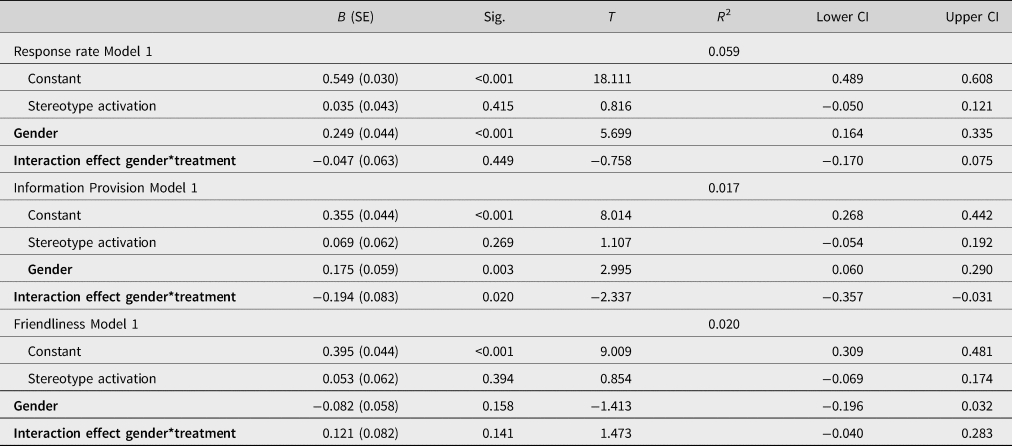
Exploratory analyses suggested by the reviewer – Interaction effect of gender and treatment (stereotype activation) on gender analysis models
Exploratory OLS regression results – effects of gender including interaction effect of gender and stereotype activation


 Open access