The way bilinguals use their two languages comes in different forms. Conversations may predominantly involve the use of the dominant language (L1), the use of the non-dominant language (L2), or even the concurrent use of the two languages. That is, conversations can have different language contexts, raising the issue of whether language control depends on the linguistic context in which a conversation occurs (Timmer, Grundy & Bialystok, Reference Timmer, Grundy, Bialystok, Libben, Goral and Libben2017a). The current study aims to explore this issue by looking at how the control system adapts to experimental contexts that vary in the extent to which the dominant and non-dominant languages are used. Considering how language context may affect language control processes is fundamental to understanding how bilinguals use them in a flexible way in order to communicate without apparent difficulties.
A great deal of evidence about how bilingual language control works comes from studies in which participants are asked to switch between languages. The vast majority of these studies have placed participants in language contexts in which the two languages are required to be used with relatively similar frequency, resembling conversational contexts in which the two languages are at play. In our study, we build on this evidence and explore whether the patterns of language switching are affected by the relative frequency with which each language is called into action. That is, we artificially create a language context in which one of the languages (dominant L1 or the non-dominant L2) is used more frequently than the other one. In the language switching task, two phenomena have played an important role for informing models of bilingual language control: the switch cost and the global slowing of the dominant language. We will now discuss these two effects in turn.
Language switching patterns: the switch cost
The switch cost refers to slower response latencies for switch trials, where a picture is named in the opposite language from that used in the previous trial, compared to trials in which the same language is used – nonswitch trials (e.g., Calabria, Hernández, Branzi & Costa, Reference Calabria, Hernández, Branzi and Costa2011; Costa, Santesteban & Ivanova, Reference Costa, Santesteban and Ivanova2006; Jackson, Swainson, Cunnington & Jackson, Reference Jackson, Swainson, Cunnington and Jackson2001; Meuter & Allport, Reference Meuter and Allport1999; Philipp, Gade & Koch, Reference Philipp, Gade and Koch2007; Schwieter & Sunderman, Reference Schwieter and Sunderman2008; Timmer, Calabria, Branzi, Baus & Costa, Reference Timmer, Calabria, Branzi, Baus and Costa2018; Verhoef, Roelofs & Chwilla, Reference Verhoef, Roelofs and Chwilla2009). Interestingly, the magnitude of the switch cost for each language (L1 vs. L2) seems to depend on the speaker's proficiency level. For high-proficient balanced bilinguals this magnitude tends to be similar for both languages – the so-called symmetrical switch cost (e.g., Costa et al., Reference Costa, Santesteban and Ivanova2006); for less-proficient unbalanced bilinguals the switch cost is larger for the L1 than for the L2 – the so-called asymmetrical switch cost (e.g., Jackson et al., Reference Jackson, Swainson, Cunnington and Jackson2001; Philipp et al., Reference Philipp, Gade and Koch2007; Schwieter & Sunderman, Reference Schwieter and Sunderman2008; Verhoef et al., Reference Verhoef, Roelofs and Chwilla2009).
These results have been used to argue that in cases in which the two languages are present in the experimental context, L1 representations need to be inhibited to a larger extent than L2 representations, resulting in this asymmetrical switch cost according to the inhibitory control (IC) model (Green, Reference Green1998). Here, we argue that language context may alter the functioning of inhibitory control resulting in a reversal of the switching cost pattern. In particular, in language contexts in which the non-dominant language is predominantly used, we expect the L2 representations to be inhibited to a larger extent instead of the L1 representations. This would result in larger switch cost for L2 than for L1. Thus, language context may affect the availability or language activation of lexical representations, which, in turn, may affect the functions of bilingual language control. It has been questioned whether asymmetric switch costs necessarily reflect inhibitory control processes and other proposals have been put forward (for a review see Bobb & Wodniecka, Reference Bobb and Wodniecka2013). For example, it has been suggested that unbalanced bilinguals require a relatively larger amount of activation for their L2 than L1. This greater activation of the L1 carries over into the next trial – being a stronger competitor for the L1 than L2 on switch trials (Philipp et al., Reference Philipp, Gade and Koch2007). In the L2 context, where the non-dominant language is mainly used, this pattern would reverse. Thus, the reversal of the switch cost pattern for the non-dominant language context can be explained within all theoretical versions of bilingual language control models.
Indeed, evidence that language context may affect switch costs comes from a study by Olson (Reference Olson2016) in which unbalanced bilinguals were tested in different language contexts. When the context involved naming in L1 and L2 with the same frequency, symmetrical switch costs were observed, while asymmetrical costs were obtained when most of the trials involved L1 naming (95% vs. 5%). The presence of symmetrical switch costs in the first context may come as a surprise given that, in previous studies in which similar contexts have been used, asymmetrical switch costs were observed. However, the switch-to-repeat ratio changed together with the language context modulation. When 95% was named in one language, 95% of the trials were also nonswitch trials, while when languages were equally represented the switch-to-repeat ratio was 50%/50%. Indeed, the task-switching literature showed that the switching pattern changes as a function of the switch ratio with symmetric costs for more equal switch-to-repeat ratio (e.g., Bonnin, Gaonac'h & Bouquet, 2011). Therefore, the current study will only manipulate the relative presence of each language while keeping repeat-to-switch ratio equal in order to answer how language context modulates lexical access in L1 and L2.
In our study we also record participants’ brain activity by means of event-related potentials. Here, we expect language context to modulate the N2 (Christoffels, Firk & Schiller, Reference Christoffels, Firk and Schiller2007; Jackson et al., Reference Jackson, Swainson, Cunnington and Jackson2001; Verhoef et al., Reference Verhoef, Roelofs and Chwilla2009) and the Late Positive Component (LPC) associated with language switch costs (Jackson et al., Reference Jackson, Swainson, Cunnington and Jackson2001; Liu, Liang, Dunlap, Fan & Chen, Reference Liu, Liang, Dunlap, Fan and Chen2016; Liu, Rossi, Zhou & Chen, Reference Liu, Rossi, Zhou and Chen2014; Martin, Strijkers, Santesteban, Escera, Hartsuiker & Costa, Reference Martin, Strijkers, Santesteban, Escera, Hartsuiker and Costa2013; Timmer, Grundy & Bialystok, Reference Timmer, Grundy and Bialystok2017b). The N2 in language switching has been related to response selection (e.g., Jackson, Jackson & Roberts, Reference Jackson, Jackson and Roberts1999; Konishi, Nakajima, Uchida, Kameyama, Nakahara, Sekihara & Miyashita, Reference Konishi, Nakajima, Uchida, Kameyama, Nakahara, Sekihara and Miyashita1998) and conflict monitoring (e.g., Nieuwenhuis, Yeung, van den Wildenberg & Ridderinkhof, Reference Nieuwenhuis, Yeung, van den Wildenberg and Ridderinkhof2003; van Veen & Carter, Reference van Veen and Carter2002), and more general cognitive control processes (for a review see Folstein & Van Petten, Reference Folstein and Van Petten2008). Regarding the switch cost, Christoffels and colleagues (Reference Christoffels, Firk and Schiller2007) found enlarged negativities for nonswitch over switch trials, while Jackson and colleagues found the opposite pattern, and yet others did not find modulation of the N2 in relation to the switch cost (Liu et al., Reference Liu, Liang, Dunlap, Fan and Chen2016, Reference Liu, Rossi, Zhou and Chen2014; Martin et al., Reference Martin, Strijkers, Santesteban, Escera, Hartsuiker and Costa2013; Timmer et al., Reference Timmer, Grundy and Bialystok2017b). Nor did the (a)symmetry of switch costs in the N2 reveal a consistent pattern between these studies. Therefore, it is currently unknown how N2 modulations are influenced by language switching.
In contrast to the N2, the LPC component has shown consistent results, with more positivity for switch trials than nonswitch trials during the lexical selection phase of language production (Jackson et al., Reference Jackson, Swainson, Cunnington and Jackson2001; Liu et al., Reference Liu, Rossi, Zhou and Chen2014; Martin et al., Reference Martin, Strijkers, Santesteban, Escera, Hartsuiker and Costa2013; Timmer et al., Reference Timmer, Grundy and Bialystok2017b). This suggests that on a switch trial it is more complex to make the stimulus-response linkage (i.e., name the picture) because the previously suppressed language needs to be accessed again. In line with other language tasks, the more complex lexical access is, the greater the LPC amplitude (Khateb, Abutalebi, Michel, Pegna, Lee-Jahnke & Annoni, Reference Khateb, Abutalebi, Michel, Pegna, Lee-Jahnke and Annoni2007; Liotti, Woldorff, Perez & Mayberg, Reference Liotti, Woldorff, Perez and Mayberg2000; Moreno, Federmeier & Kutas, Reference Moreno, Federmeier and Kutas2002). These results from the language switching literature are also in line with domain-general task switching studies that show a greater P3 for switch trials as those have a greater working memory load than nonswitch trials; (e.g., Barcelo, Escera, Corral & Periáñez, Reference Barceló, Escera, Corral and Periáñez2006; Barceló, Periáñez & Nyhus, Reference Barceló, Periáñez and Nyhus2007; Barceló, Periáñez & Knight, Reference Barceló, Periáñez and Knight2002; Jost, Mayr & Rosler, Reference Jost, Mayr and Rosler2008; Periáñez & Barceló, Reference Periáñez and Barceló2009; Watson, Azizian & Squires, Reference Watson, Azizian and Squires2006). Unfortunately, we don't know how this component behaves when there are symmetrical and asymmetrical switch costs, and hence it is difficult to make predictions about how language context may affect LPC modulations for switch cost (a)symmetry. But if the LPC/P3 indexes working memory load and L2 representations are expected to receive more inhibition during a predominantly L2 language context, we could expect a greater positivity for L2 switch trials than the other trials. This would result in a larger switch cost difference towards the L2 than towards the L1 during a predominantly L2 context.
Language switching patterns: the global slowing down
The global slowing of the L1, sometimes also referred to as the reversed language effect (Christoffels, Ganushchak & La Heij, Reference Christoffels, Ganushchak, La Heij and Schwieter2016a), indicates slower naming latencies in the L1 than in the L2 during language switching (Christoffels et al., Reference Christoffels, Firk and Schiller2007; Costa & Santesteban, Reference Costa and Santesteban2004; Costa et al., Reference Costa, Santesteban and Ivanova2006; Gollan & Ferreira, Reference Gollan and Ferreira2009; Tarlowski, Wodniecka & Marzecová, Reference Tarlowski, Wodniecka and Marzecová2013; Verhoef et al., Reference Verhoef, Roelofs and Chwilla2009). That is, while naming latencies are usually faster in the L1 than in the L2 in a monolingual context (only one language is at play; for a review see Hanulová, Davidson & Indefrey, Reference Hanulová, Davidson and Indefrey2011 and Runnqvist, Strijkers, Sadat & Costa, Reference Runnqvist, Strijkers, Sadat and Costa2011), the pattern reverses in a dual language context (when two languages are at play). This effect is supposed to come about from exerting a global control over all L1 representations, in such a way that their retrieval is slowed down as compared to L2 (Bobb & Wodniecka, Reference Bobb and Wodniecka2013; Christoffels et al., Reference Christoffels, Firk and Schiller2007; Costa & Santesteban, Reference Costa and Santesteban2004; De Groot & Christoffels, Reference De Groot and Christoffels2006; Gollan & Ferreira, Reference Gollan and Ferreira2009; Kroll, Bobb, Misra & Guo, Reference Kroll, Bobb, Misra and Guo2008; Misra, Guo, Bobb & Kroll, Reference Misra, Guo, Bobb and Kroll2012). Previous studies identified global slowing in the LPC with greater positivity for L2 than L1 picture naming (Liu et al., Reference Liu, Liang, Dunlap, Fan and Chen2016, Reference Liu, Rossi, Zhou and Chen2014; Timmer et al., Reference Timmer, Grundy and Bialystok2017b). This pattern was found for participants who were good at inhibitory control, but not for participants with worse inhibitory control. Though after extensive training they show the language difference in the LPC just as high inhibitory control participants. Liu and colleagues (Reference Liu, Liang, Dunlap, Fan and Chen2016) suggest that this LPC pattern leads to symmetric switch costs and efficient performance in both languages. Therefore, we expect the LPC to be modulated by global slowing in the L1 context with greater positivity for the L2 over the L1.
Interestingly, the effect of language context on global inhibition has been observed in some cases in which only one language was at play. For instance, Christoffels and colleagues (Reference Christoffels, Ganushchak, La Heij and Schwieter2016a) have reported that bilinguals, after language switching, continued to be slower in the L1 when put into a monolingual context (when only a single language was used). Thus, they showed global slowing for L1 during language switching. This pattern continued into the post-test phase where only a single language was used, monolingual context. Thus, sustained inhibition of the L1 can continue after a speaker has left a bilingual language conversation. In the present study, we take a step further by not just comparing a monolingual to a bilingual language context, but by examining the effect of being in a predominantly L1 or L2 environment. In a predominantly L1 context, we expect global slowing of the L1 as normally found in the literature. In contrast, during the L2 context, we expect a reversal of the inhibition patterns with stronger global inhibition of the L2 than the L1 representations, which will be reflected in global slowing of the L2.
Multiple accounts of bilingual language control have proposed at least two loci of this control. The main distinction is between a global level of language control, during which the relative activation levels of the languages as a whole are adjusted, and a local level, during which levels of activation are adjusted on a trial by trial basis in a reactive manner (respectively, also called proactive and reactive by Braver, Reference Braver2012; global and local by Christoffels et al., Reference Christoffels, Firk and Schiller2007; de Groot & Christoffels, Reference De Groot and Christoffels2006; active inhibition and local reactive inhibition by Colzato, Bajo, van den Wildenberg, Paolieri, Nieuwenhuis, La Heij and Hommel, Reference Colzato, Bajo, van den Wildenberg, Paolieri, Nieuwenhuis, La Heij and Hommel2008; between languages and between lemmas by Green, Reference Green1998). The switch cost discussed above can be seen as a local level of control, but in contrast the global slowing of L1 requires a more constant control of a whole language seen as global control.
In summary, we investigated whether mainly being in your dominant L1 or non-dominant language L2 (i.e., language context) alters bilingual language control within these two loci. On the local level, during a predominantly L1 context, we expect switching patterns as previously reported in the literature. However, when the conversation is predominantly in the L2, this language could start to behave as the native language of a bilingual. If so, the asymmetric switch cost should become larger towards the L2 instead of the L1. On the global level, we expected global slowing of the L1 in the dominant language context and the L2 to be slowed globally in the non-dominant language context.
Method
Participants
Forty-five Dutch–English bilinguals from Leiden University were paid for their participation (13 males; average age: 21.3 years; SD = 3.04). Twenty-five participants were randomly assigned to the Dutch language (L1) context group and the rest to the English (L2) language context group. Everyone had normal or corrected-to-normal vision, and no history of neurological impairments or language disorders.
All participants went to a Dutch High School where they had English as a compulsory L2 for six years (from the age of 12 to 18). All of the participants were currently attending University where they were using textbooks and journal articles written primarily in English and some lectures were taught in English as well. L2 proficiency was assessed by a self-rating proficiency questionnaire before the experiment, and Meara's proficiency test (2005) after the experiment. Participants reported they were currently using their English on a daily basis for approximately 18.3% for speaking, 41.4% for reading, and 48.7% for listening. See Table 1 for more details. Further, the Meara's test was conducted for an objective measure of language proficiency. A random subset of 60 words, from a vocabulary of 5000 words available in the test, were presented to the participants one by one. These words were intermixed with nonword letter strings, which were very similar to real words, to increase the difficulty of the task. Participants had to indicate whether the letter string was an English word or not. See Table 1 for an overview of the language proficiency results. No significant differences were present between the groups.
Mean answers (and standard deviations) to self-rating proficiency questionnaire (range: 0–10 or 100%) and the proficiency test (range: 0–5000) of Meara (2005) for English (L2).

a A 10-point scale, with 1 point being the lowest proficiency and 10 the highest.
b Percentage out of 100.
c A score between 0 and 5000 with a better proficiency the higher the score.
Two participants from the L1 context group were excluded because of excessively slow responses or high error rates (more than 75%). Three participants from the L2 context group were excluded from the analysis (2 because of technical failure, 1 because of excessively slow responses). The final sample was then 21 participants in the L1 context group (8 males; average age: 21.4 years; SD = 3.54) and 19 participants in the L2 context group (5 males; average age: 21.2 years; SD = 2.50).
Materials
Forty-six target pictures with non-cognate names were selected (see Appendix A). Mean word frequency and length were similar in the two languages (respectively, t(45) = −1.47, SE = 123.84, ns and (t(45) = −0.23, SE = 0.28, ns). Another forty-six filler pictures were used to create the language context but were not used for analysis (see Appendix B).
Design and procedure
Participants were tested individually in a quiet room with dimmed lights and seated approximately 1 meter from the computer screen. They were shown all pictures from the experiment beforehand on paper together with their Dutch and English names. Both groups of participants were asked to name the pictures in either Dutch or English, depending on the color of the frame accompanying the pictures (red or blue).
The 46 experimental stimuli were presented in random order and repeated four times for each participant. These experimental stimuli were presented in blocks of 4 consecutive trials (two named in Dutch and the other two in English), which were segregated by a random amount of 5 to 11 filler trials. For each participant all filler trials were either in Dutch or in English, creating two different language contexts: Dutch (L1) context (83% or more of the filler pictures had to be named in Dutch) and the opposite for the English (L2) context.
A block of 4 experimental trials always consisted of two pictures named in Dutch and two pictures named in English. If the filler trials were to be named in English, the first two stimuli in the experimental block had to be named in Dutch and the two consecutive trials in English. If the language context was Dutch, the first two stimuli in the switch block had to be named in English followed by two pictures to be named in Dutch. This design created four experimental conditions: L1nonswitch, L1switch, L2nonswitch, and L2switch. Each condition consisted of 46 trials.
Participants were randomly assigned to the Dutch or English language context and the relation between frame color and language was counterbalanced over participants. Participants started with a short practice block including all 4 conditions and could take short breaks between the blocks.
Each trial was initiated by a fixation cross with a duration jittered between 500 and 900 ms followed by the presentation of the target picture. The picture remained on the screen until a response was given or after 3000 ms had passed. The onset of the speech response was measured with a voice-key. All trials ended with the presentation of a blank screen for 2000 ms before the fixation cross was presented again, signaling the start of a new trial.
Apparatus and data acquisition
The electroencephalogram (EEG) signals were continuously recorded using 32 Ag/AgCl electrodes distributed according to the extended International 10–20 system with Biosemi and sampled at 512 Hz. Two electrodes of the flat type (above and below the left eye) recorded the eye-blinks. Another two electrodes (external canthi of each eye) recorded horizontal eye-movements. The EEG signal was re-referenced to the mastoids (left and right; baseline).
Electrophysiological analysis
Epochs from -200 to 600 ms were created, including a -200 to 0 baseline correction. The EEG signal was filtered with a high-pass filter of 0.01 Hz/12 dB, a low-pass filter of 40 Hz/24 dB, and a notch filter of 50Hz. Ocular artifacts were corrected using Independent Component Analysis (ICA). Non-ocular artifacts were removed based on the following criteria: trials with amplitudes below –150 µV, above +150 µV, voltage step of 50 µV within 200 ms, or activity below 0.5 µV. The ERP grand averages were time-locked to the onset of the target word and calculated separately for each condition per group.
To avoid any a priori bias with respect to choosing time windows and localization for ERP analyses, which allows for vast number of comparisons, a multivariate statistical tool called partial least squares (PLS) was used (Lobaugh, West & McIntosh, Reference Lobaugh, West and McIntosh2001; McIntosh, Bookstein, Haxby & Grady, Reference McIntosh, Bookstein, Haxby and Grady1996). Based on all experimental conditions, singular value decomposition reveals one or more latent variables (LVs) representing specific contrasts that account for a percentage of the cross-block covariance. Each LV singular value explains how much of the covariance was explained by a particular LV. The estimate of obtaining a singular value by chance (similar to a p-value) was computed by one thousand permutations. The reliability of electrode saliences at each time point was assessed by 200 bootstrap re-samplings, which applies random sampling with replacement. The relation between the experimental design contrasts (represented by the LV) and the spatiotemporal pattern of ERP amplitude changes is represented by the electrode saliences. Electrode saliences above 1.7 (p < .05) were considered reliable, because the ratio of the salience to the standard error is approximately equal to a z-score. Thus, PLS analyses allowed us to narrow the time windows and locations of experimental effects in order to perform conventional ERP statistics. Previous studies have applied PLS to EEG data (Duzel, Habib, Schott, Schoenfeld, Lobaugh, McIntosh, Scholz & Heinze, Reference Duzel, Habib, Schott, Schoenfeld, Lobaugh, McIntosh, Scholz and Heinze2003; Grundy & Shedden, Reference Grundy and Shedden2014; Hay, Kane, West & Alain, Reference Hay, Kane, West and Alain2002; Itier, Taylor & Lobaugh, Reference Itier, Taylor and Lobaugh2004; Lobaugh et al., Reference Lobaugh, West and McIntosh2001), and specifically applied to speech production ERP data (Christoffels, Timmer, Ganushchak & La Heij, Reference Christoffels, Timmer, Ganushchak and La Heij2016b; Timmer & Chen, Reference Timmer and Chen2017; Timmer et al., Reference Timmer, Grundy and Bialystok2017b). The mean amplitudes of ERPs were submitted to repeated-measures ANOVAs. The Greenhouse–Geisser correction was applied to all repeated measures to correct for possible violations of sphericity. Follow-up analyses were corrected using Bonferroni and adjusted p-values are reported.
Results
Behavioral data
Naming latencies shorter than 400 ms and longer than 1,800 ms together with outliers (2.5 SD from the average per participant) were discarded from the analysis (4.5% of the data). In addition, voice-key errors (1.8% of the data) and incorrect responses (3.2% of the data) were also discarded, leaving a total of 90.5% of the trials in the analysis. In addition, the Dutch words ‘boom’ (tree), ‘trap’ (stairs), and ‘worst' (sausage) were also removed from the analyses as they were homographs with English words.
The within-subject factors Trial type (nonswitch vs. switch), Language (L1 vs. L2) and the between-subject factor Context (L1 context vs. L2 context) were analyzed with a repeated measures ANOVA. An analysis of the error data (incorrect responses) did not reveal any significant results. See Table 2 for an overview of the response latencies. 95% confidence intervals (CI) for the means are also included in the table. The CI's for hypothesis testing, based on the difference of the mean, are included in the text underneath.
Mean response latencies in ms (and standard error) for language switching per language for the L1 and the L2 context group.

The main effect of Trial type was significant with faster latencies for nonswitch (1005 ms; SE = 14.54) than switch trials (1070 ms; SE = 14.79; F1(1,38) = 96.39, MSe = 1724.61, p < .001, ηp2 = .717; F2(1,84) = 122.88, MSe = 2838.63, p < .001, ηp2 = .594). The main effect of Language was also significant with slower naming latencies in Dutch (1053 ms; SE = 17.19) than in English (1021 ms; SE = 14.01; F1(1,38) = 6.31, MSe = 6662.68, p < .05, ηp2 = .142; F2(1,84) = 18.48, MSe = 4276.16, p < .001, ηp2 = .180). No differences between the two Contexts were observed (both Fs(< 1). These results are qualified by two- and three-way interactions: Trial type by Language (F1(1,38) = 16.19, MSe = 926.67, p < .001, ηp2 = .299; F2(1,84) = 18.82, MSe = 1949.03, p < .001, ηp2 = .183), Trial type by Context (F1(1,38) = 3.73, MSe = 1724.61, p = .061, ηp2 = .089; F2(1,84) = 6.06, MSe = 2838.63, p < .05, ηp2 = .067), Language by Context (F1(1,38) = 20.59, MSe = 6662.68, p < .001, ηp2 = .351; F2(1,84) = 60.99, MSe = 4276.16, p < .001, ηp2 = .421), and Trial type by Language by Context (F1(1,38) = 5.26, MSe = 926.67, p < .05, ηp2 = .122; F2(1,84) = 3.02, MSe = 1949.03, p = .086, ηp2 = .035). To explore the significant interactions, separate ANOVAs were run for the L1 and L2 language context groups.
The L1 context group revealed a switch cost with faster responses for nonswitch (1011 ms; SE = 20.82) than switch trials (1063 ms; SE = 21.67; F1(1,20) = 30.61, MSe = 1845.20, p < .001, ηp2 = .605; F2(1,42) = 70.92, MSe = 1488.46, p < .001, ηp2 = .628), and global slowing with slower responses for L1 as compared to L2 (L1: 1082 ms; SE = 25.56; L2: 991 ms; SE = 19.06; F1(1,20) = 26.39, MSe = 6601.82, p < .001, ηp2 = .569; F2(1,42) = 72.57, MSe = 4319.52, p < .001, ηp2 = .633). On average pictures in L1 were named 91 ms slower than in the L2, 95% CI (54, 128). In other words, with 95% confidence the true population mean of the difference between L1 and L2 lays between 54 ms and 128 ms. A confidence interval for the mean difference that does not include zero suggests a significant difference. No interaction between these two variables was observed. Thus, there was a symmetrical switch cost (F1(1,20) = 1.33, MSe = 1100.36, ns, ηp2 = .062; F2(1,42) = 3.69, MSe = 1782.76, ns, ηp2 = .081). The mean difference in switch costs between L1 and L2 is estimated at 17 ms, 95% CI (-14, 47). Thus, there is no clear difference in the size of the switch costs between the two languages.
The L2 context group also revealed a switch cost with faster responses for nonswitch (999 ms; SE = 20.11) than switch trials (1076 ms; SE = 19.83; F1(1,18) = 71.26, MSe = 1590.62, p < .001, ηp2 = .798; F2(1,42) = 62.18, MSe = 4188.79, p < .001, ηp2 = .597). In contrast to the L1 context group, L2 (1051 ms; SE = 20.60) was named slower than L1 (1025 ms; SE = 22.55) in the L2 context though this difference was only significant in the item (F2) analysis (F1(1,18) = 1.94, MSe = 6730.31, ns, ηp2 = .097; F2(1,42) = 6.23, MSe = 4232.79, p < .05, ηp2 = .129). A -26 ms mean difference, 95% CI (-66, 13), with a minor slowing effect for L2 than L1 naming. The interaction between Trial Type and Language (F1(1,18) = 24.01, MSe = 733.01, p < .001, ηp2 = .572; F2(1,42) = 17.00, MSe = 2115.29, p < .001, ηp2 = .288) revealed that switch costs were larger in L2 than in L1, although both costs were significant (L1: F1(1,18) = 17.35, MSe = 1198.59, p < .005, ηp2 = .491; F2(1,42) = 15.72, MSe = 1889.52, p < .001, ηp2 = .272; L2: (F(1,18) = 97.86, MSe = 1125.73, p < .001, ηp2 = .845; F2(1,42) = 86.12, MSe = 2844.76, p < .001, ηp2 = .672). Hence, asymmetrical switch costs were obtained (L2 (108 ms; SE = 10.89; L1 (47 ms; SE = 11.23; t1(18) = 4.90, SE = 12.43, p < .001; t2(42) = 4.12, SE = 14.03, p < .001)). The L2 switch cost was estimated to be 61 ms greater than the L1 switch cost. The size of the mean difference was with 95% confidence between 35 ms and 87 ms. Another way of looking at the higher order interaction is by running separate analyses for each Language. Picture naming in L1 (Dutch) was slower in the L1 (1082 ms) than the L2 context (1024 ms; F1(1,38) = 2.83, MSe = 23595.31, p = .101, ηp2 = .069; F2(1,84) = 9.51, MSe = 10781.15, p < .005, ηp2 = .102), independent of Trial type (Fs <1). The mean sample population difference is 58 ms with the true population mean falling between -12 ms and 127 ms (95% CI). L2 (English) picture naming was affected by both Context and Trial type. The main effect of Context (F1(1,38) = 4.50, MSe = 15667.39, p < .05, ηp2 = .106; F2(1,84) = 12.18, MSe = 13271.72, p < .005, ηp2 = .127) interacted with Trial type (F1(1,38) = 8.07, MSe = 1393.41, p < .01, ηp2 = .175; F2(1,84) = 10.22, MSe = 2113.23, p < .005, ηp2 = .108). Pictures were named slower in the L2 than L1 context, but especially for switch trials (t1(38) = −2.79, SE = 29.85, p < .01; t2(84) = −4.73, SE = 17.69, p < .001) and less for nonswitch trials (t1(38) = −1.25, SE = 28.62, p = .220; t2(84) = −1.94, SE = 20.07, p = .056). For the switch trials the L2 is named 83 ms faster than L1 with a 95% CI of (−144, −23), whereas for the nonswitch trials L2 is named 36 ms faster with a 95% CI of (−94, 22).
ERP data
In addition to the trials that included incorrect responses, trials with electrophysiological artifacts were also removed from the ERP analysis. On average 5 out of 46 trials (9.85% of the data) were removed per condition. The number of removed trials was equally distributed over conditions, leaving 90.15% of the trials in the analysis.
The factors Trial type, Language, and Context were first examined with whole-brain PLS analysis from stimulus presentation onset up to 600 ms. Only one LV was significant and accounted for 69.59% of the variance, p < .001. This latent variable is a design contrast that shows a greater language slowing effect for the L1 context than the L2 context group. It also reveals that in the L1 context the switch cost is similar for the two languages, while in the L2 context this cost is different (see Figure 1).
Design scores for the LV, representing 68.86% of the variance (p < .001).
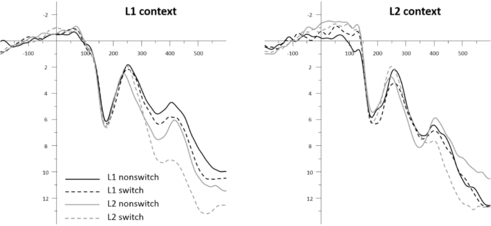
The electrode saliences, reflecting confidence intervals for salience across time points and electrodes, were most reliable in the mid-right frontal-central region (electrodes FC2, Cz, C4, and CP2) and in the 400–550 ms time window which corresponds to the Latent Positive Component (LPC; see Figure 2). Note that our PLS analysis does not reveal an effect of the N2 component, which has revealed inconsistent results in previous studies. Therefore, we will not analyze the N2 with classic ANOVAs. The P3/LPC time-window was analyzed by classic statistical ERP analyses with Trial type (nonswitch vs. switch), Language (L1 vs. L2), Context (L1 context vs. L2 context) as independent variables. Figure 2 represents the ERP waveforms of the switch cost and slowing effect per language context group.
A PLS electrode saliency map showing the reliability of LV for the switch cost per language for each context group. The x-axis represents time in milliseconds (0–500) and the y-axis represents electrode salience (i.e. reliability of the LV).

LPC/P3 (400-550 ms time window)
The repeated-measures ANOVA revealed a main effect of Trial type (F(1,38) = 21.51, MSe = 21.66, p < .001, ηp2 = .361), and Language (F(1,38) = 14.95, MSe = 20.66, p < .001, ηp2 = .282), but not of Context group (F < 1). The former effects were modified by the following interactions: Trial type by Language (F(1,38) = 8.43, MSe = 19.84, p < .01, ηp2 = .182), and Language by Context (F(1,38) = 8.89, MSe = 20.66, p < .001, ηp2 = .190). The interaction between Trial type and Context and the interaction between Trial type, Language, and Context did not reach significance (Fs < 1).
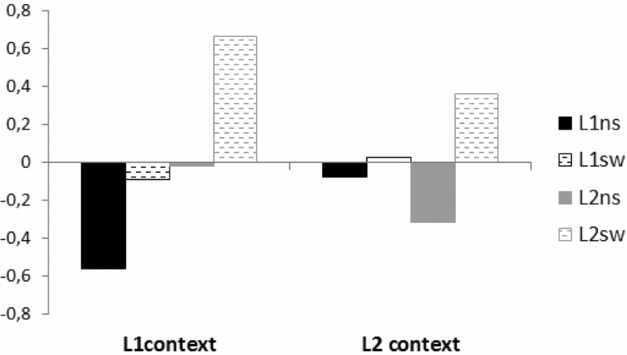
To investigate the significant interaction between Language and Context group, separate follow-up analyses were run. The L1 context group revealed a main effect of Language with greater positive amplitudes for English (µV = 10.05; SE = 1.39) than Dutch (µV = 7.59; SE = 1.29; F(1,20) = 32.08, MSe = 15.89, p < .001, ηp2 = .616), reflecting L1 slowing in the behavioral data. The amplitudes difference was on average -2.64 µV, 95% CI (-3.37, -1.56). Thus, with 95% confidence the difference between languages is between -3.37 µV and -1.56 µV. In contrast, the L2 context group did not reveal a difference between English (µV = 9.51; SE = 1.59) and Dutch (µV = 9.19; SE = 1.47; F < 1), which is also in line with the behavioral data (see Figure 3). The amplitude difference was on average −0.32 µV, 95% CI (-1.55, 0.91).
Averaged stimulus-locked ERP waveforms (pooled over electrodes FC2, Cz, C4, and CP2) per language context group for the switching cost with nonswitch (solid line) and switch (dashed line) trials per language (L1: black line vs. L2: grey line).

To further investigate the modulation of the switch cost by Language we also ran separate analyses by Language. The switch cost to the L2 revealed greater positive amplitudes for the switch (µV = 11.16; SE = 1.12) than the nonswitch trials (µV = 8.43; SE = 1.01; F(1,39) = 29.57, MSe = 20.09, p < .001, ηp2 = .431). In contrast, the switch cost towards the L1 revealed no differences between the switch (µV = 8.70; SE = 1.03) and the nonswitch trials (µV = 7.99; SE = 0.98; F(1,39) = 1.93, MSe = 20.88, ns, ηp2 = .047). The mean difference of switch costs was negligible for L1, M = 0.71 µV, 95% CI (−0.32, 1.74), while it was present for L2, M = 2.73 µV, 95% CI (1.71, 3.74). Therefore, the L2 switch cost was estimated to be 2.02 µV greater than the L1 switch cost, 95% CI (0.59, 3.44).
Discussion
We explored how the bilingual language control system adapts to different language contexts. In particular, we assessed how such control changes – depending on the relative frequency with which the dominant (L1) and the non-dominant (L2) languages are involved in the switching task. That is, we artificially create a language context in which one of the languages (the dominant or the non-dominant language) is used more frequently than the other one. Specifically we looked at two indices of language control functioning, namely the switch costs and the global slowing of the dominant language.
When the switching task involved using predominantly the dominant language (L1 context), we observed the patterns obtained before: symmetric switch cost and global slowing of the L1 (Christoffels et al., Reference Christoffels, Firk and Schiller2007). Importantly, however, these patterns changed when the language context was modified: that is, when the task involved using predominantly a non-dominant language (L2 context). In that case, asymmetric switching costs were observed with larger costs for L2; and no global slowing down of the L1 was present anymore. These results reveal that language context modulates the pattern of switch costs and global slowing. To the extent that such patterns reveal the functioning of the bilingual language control system, they reveal that language context affects its functioning. Let us discuss these results and their implications in more detail.
During the L1 context we found a symmetric switch cost for our L1 dominant bilinguals. This may come as a surprise since quite often switch costs are larger for L1 for unbalanced bilinguals (Jackson et al., Reference Jackson, Swainson, Cunnington and Jackson2001; Philipp et al., Reference Philipp, Gade and Koch2007; Schwieter & Sunderman, Reference Schwieter and Sunderman2008). However, with this specific population of Dutch–English bilinguals, probably due to the frequent use of the non-dominant language, symmetrical switch costs are usually observed (Christoffels et al., Reference Christoffels, Firk and Schiller2007). So, if anything, we replicate previous observations in this context. More interestingly, however, is the result for the L2 context. Here, we do find the asymmetrical cost, with a larger cost for the non-dominant language. How can language control models accommodate this observation? The most likely explanation is that the activation levels of the two languages are altered depending on the language context. In this way, when people are set in a non-dominant context, the corresponding representations will be more available (in relative terms) than the ones from the dominant language. This reversed pattern has also been found when unbalanced bilinguals were given more preparation time so that both of their languages could be activated (Ma, Li & Guo, Reference Ma, Li and Guo2016). Thus, in the L2 context, L2 representation will need to be inhibited more than those of the L1 according to the Inhibitory Control (IC) account (Green, Reference Green1998) discussed in the introduction. Greater inhibition of the L2 leads to the asymmetrical switch cost with a greater cost for the L2. Other models explain the same switch cost pattern by greater activation of the L1 than L2 (Philipp et al., Reference Philipp, Gade and Koch2007). While both these models explain the switch cost pattern, the pattern itself raises a paradox: Why is it that we do not find an asymmetrical switch cost in the L1 dominant context, such that switch costs are larger in the L1?
To answer this question we take a broader perspective. Language production is a complex interaction of different processing stages and language control can take place at each of these stages. Multiple accounts of bilingual language control suggest that the switch cost reflects a local level of control, while global slowing of L1 reflects a global level of control. We will discuss our results within these different loci of control.
Regarding global control, during the dominant L1 context the typical pattern of slower L1 naming than L2 naming (global slowing) was found (Christoffels et al., Reference Christoffels, Firk and Schiller2007; Costa & Santesteban, Reference Costa and Santesteban2004; Costa et al., Reference Costa, Santesteban and Ivanova2006; Gollan & Ferreira, Reference Gollan and Ferreira2009; Verhoef et al., Reference Verhoef, Roelofs and Chwilla2009). The activation level of the dominant language compared to the non-dominant language is lowered by means of adjusting the selection criteria to make access to the dominant language more difficult (Costa & Santesteban, Reference Costa and Santesteban2004) or by inhibiting the dominant language (Gollan & Ferreira, Reference Gollan and Ferreira2009). It is suggested that this pattern facilitates language production in both languages and overall efficient performance. Figure 4 shows the naming speed of each language throughout the course of our experiment. At the beginning of our experiment, after the first filler block, participants slowed down L1 naming compared to L2 naming by 50 ms. The longer participants were in the L1 context, the larger the difference became between both languages, namely 132 ms difference at the last block. Interestingly, during naming in the non-dominant L2 context, there was no global slowing with similar naming latencies for the two languages. Therefore, it seems that when the language context is mainly in the non-dominant language, there is no global control applied to the first language. This suggests that within the L2 context the dominant status of L1 (better proficiency) seems to have been negated by the greater presence of the L2. Both languages can be seen as equal and the L1 does not have to be suppressed in order to facilitate efficient performance in both languages. At the beginning of the L2 language context the difference between L1 and L2 is only 18ms, the latter being slower. However, this increases to 40ms slower by the end of the experiment. Thus, just using your non-dominant L2 a lot can equalize the relationship between L1 and L2 – or, perhaps, even reverses the control pattern with a lot of exposure to the L2, as L2 is named slower than L1 by the end of the experiment.
Difference score of L2 (English) minus L1 (Dutch) in RTs throughout the 46 blocks in the experiment per context group: black dots for L1 context and gray dots for L2 context.

A different way of looking at these data is by looking at each Language separately rather than at Context. When we look at each language separately, Dutch was named slower in the L1 (Dutch) dominant language context than in the L2 (English) language context. In turn, English was named slower in the L2 context than in the L1 context. However, for English this effect was greater for switch trials than nonswitch trials. In other words, we see slower naming for the language that matched the language context. We suggest that a language is named slower when it is used more, because with more usage its global activation is increased, just as higher proficiency increases activation. To achieve efficient naming in both languages the activation level of the higher activated language has to be lowered (Costa & Santesteban, Reference Costa and Santesteban2004; Gollan & Ferreira, Reference Gollan and Ferreira2009). Thus, Dutch is named slower in the L1 than the L2 context because of its higher activation level in the L1 context. For the same reason, English is named slower in the L2 context. However this was true only for switch and not nonswitch trials. The question arises why the L2 is sensitive to trial type. While we do not know for sure, we believe this effect is in line with our previous explanation. Within the L2 context, bilinguals did not apply global control but actually depended on local control, which was reflected in greater switch costs in the L2 caused by slowing down naming on L2 switch trials compared to L1 switch trials. Thus, this local control might underlie the differential slowing of nonswitch and switch trials for English. The absence of differential effects for nonswitch and switch trials in Dutch would then be due to symmetrical switch costs in both languages. To conclude, naming latencies for both languages and switch patterns change depending on the language context a bilingual is in.
While our bilinguals apply a global level of control during the dominant language context, they don't do so during the non-dominant context. Interestingly, going back to the switch cost results, we see that during the latter context, our bilinguals show an asymmetric switch pattern where they reactively inhibit the L2 more strongly than the L1 when the trial requires it. Thus, in the non-dominant context no global strategy is applied, but more reactive control is applied at a local level when the situation requires it. In contrast, in the dominant language context a global level of control is applied and therefore symmetric switch costs may be incurred at the local level as less use is made from the control at the local level. Thus, our bilinguals flexibly adapt the use of the language control mechanisms according to the language context at hand. This fits with the adaptive control hypothesis, which suggests that the different type of language control processes are adjusted depending on the demands placed on them (Green & Abutalebi, Reference Green and Abutalebi2013).
Interestingly, the results from ERPs seem to at least partially support this flexibility of the different control mechanisms. While the N2 was not modulated by the switching paradigm, the LPC was. The absence of a switch cost effect in the current study adds to the concern raised by other studies about the inconsistency of N2 modulations in response to switch costs (Martin et al., Reference Martin, Strijkers, Santesteban, Escera, Hartsuiker and Costa2013). It could be the case that the N2 is more influenced by predictability than by switching itself. In paradigms where the switch cost was predictable, the N2 component was modulated: for example, when the nonswitch and switch trials were alternated in a known pattern (Jackson et al., Reference Jackson, Swainson, Cunnington and Jackson2001); or when the language in which the picture was to be named was known before the target stimulus was presented (Verhoef et al., Reference Verhoef, Roelofs and Chwilla2009). In studies where the switches were not predictable, as in the present study, no N2 modulations were found (Martin et al., Reference Martin, Strijkers, Santesteban, Escera, Hartsuiker and Costa2013; Timmer et al., Reference Timmer, Grundy and Bialystok2017b).
In contrast, the LPC was modulated by language switching. In the dominant language context the LPC showed greater positivity for the non-dominant than the dominant language, mirroring the behavioral global slowing of L1. This result is in line with language switching studies showing greater positivity for L2 than L1 naming suggesting the role of inhibitory control to achieve efficient naming in both languages (Liu et al., Reference Liu, Liang, Dunlap, Fan and Chen2016, Reference Liu, Rossi, Zhou and Chen2014; Timmer et al., Reference Timmer, Grundy and Bialystok2017b). In contrast, this language modulation in the LPC was not present during the non-dominant L2 context suggesting an absence of adjusting activation levels for a whole language on a global level (or increase inhibition for L2 making the two languages equally ‘slower’?).
The LPC also reflected the switch cost with greater positivity for switch compared to nonswitch trials; however, this pattern was only present for the L2 and not the L1. This is in line with the study by Martin and colleagues (Reference Martin, Strijkers, Santesteban, Escera, Hartsuiker and Costa2013) that also found the switch cost modulation in the LPC only for the weaker language. This was true for both early and late bilinguals that respectively showed a symmetric and asymmetric behavioral switch costs. The LPC is suggested to be sensitive to both the strength of the language at play and the ease of lexical selection of the item on nonswitch and switch trials. During language switching the previously inhibited language needs to be reactivated again (Green, Reference Green1998). The LPC reflects this inhibitory process during lexical selection where the intended lexical item is selected and the lexical representation in the uninhibited language is inhibited (Jackson et al., Reference Jackson, Swainson, Cunnington and Jackson2001; Liu et al., Reference Liu, Liang, Dunlap, Fan and Chen2016, Reference Liu, Rossi, Zhou and Chen2014; Martin et al., Reference Martin, Strijkers, Santesteban, Escera, Hartsuiker and Costa2013; Timmer et al., Reference Timmer, Grundy and Bialystok2017b). The more cognitively demanding it is to select the intended response, the greater the LPC amplitude (Jackson et al., Reference Jackson, Swainson, Cunnington and Jackson2001; Liotti et al., Reference Liotti, Woldorff, Perez and Mayberg2000; Moreno et al., Reference Moreno, Federmeier and Kutas2002). Regarding the relative strength between the two languages, we saw greater LPC amplitudes for L2 than L1 in the dominant language context and no language differences in the LPC for the non-dominant language context. It has been suggested that the presence of language differences in the LPC shows good global inhibition of the stronger language, which leads to behavioral symmetric switch costs. In contrast, when no language difference was present in the LPC asymmetric switch costs were found in the behavioral data. This is in line with the present results where global control in the L1 context leads to symmetric switch costs, whereas the absence of global control in the L2 context shows asymmetric switch costs. Thus, the differences between language contexts are reflected by global language control in the LPC.
To conclude, during a predominantly L1 context Dutch–English bilinguals make more use of a global type of language control instead of local control; this is reflected by global slowing of the L1 and the absence of asymmetry in the switch costs. In contrast, during a predominantly L2 context the global control is not applied and bilinguals depend more on the local level of language control; this is reflected by the absence of global slowing and the presence of asymmetric switch costs. These behavioral findings are reflected by modulations of the LPC component with respect to the relative relationship between the two languages, which has been related to inhibition during lexical selection. Thus, the locus of control mechanisms is adjusted to create a new balance of equal lexical access for both languages. This allows for optimal performance for bilinguals during conversations with differing language contexts.
But what does this tell us about the workings of the bilingual language control system? For one thing, this reveals that the system is flexible and adapts to the contextual situation in which a conversation is carried out. And indeed, all bilingual interactions are not equal, with respect to which language is more prominent. It is not uncommon that interlocutors find themselves in contexts in which their second language is more prevalent, especially in places such as the Netherlands. Consider, for example, a native speaker of Dutch who is at a party with friends in the Netherlands. He or she will mainly speak Dutch as it is his or her native language. When a foreigner that does not know Dutch comes to the party, English will be adopted to communicate with this person. As most Dutch natives speak English well, soon the common language at the party will be English. Thus, at this party, the language context switches from mainly the dominant language to mainly the non-dominant language. This study is a first step towards suggesting that, within this situation, the control mechanisms applied to balance both languages will flexibly adjust. Ideally, future studies would look at real interactive contexts, recording conversations in daily life, to assess how the bilingual control system adapts.
If we want to understand the functioning of the bilingual language control system we need to consider this flexibility and advance in our knowledge of how contextual factors alter its workings. This study is a first step towards this goal, but many other factors – like the amount of language switching, or cultural cues; like faces that show ethnicity or landmarks that refer to specific countries – could potentially change the workings of the language control system flexibly (Timmer et al., Reference Timmer, Grundy, Bialystok, Libben, Goral and Libben2017a). This would help models of language control take into account that the locus of control can potentially change depending on the conversational language context a bilingual is in.
Experimental stimuli

Filler stimuli