


Introduction
The prevalence of obesity has increased continuously over the past decade for both adults and children in Canada.(Reference Rao, Kropac, Do, Roberts and Jayaraman1,Reference Bancej, Jayabalasingham, Wall, Rao, Do and de Groh2) This is concerning since obesity leads to numerous health comorbidities in children, including hypertension, type 2 diabetes, or obstructive sleep apnoea, which were previously thought to be present mostly in adults.(Reference Kansra, Lakkunarajah and Jay3) Furthermore, obesity in childhood is predictive of obesity in adulthood,(Reference Simmonds, Llewellyn, Owen and Woolacott4) worse cardiometabolic outcomes,(Reference Weihrauch-Blüher, Schwarz and Klusmann5) and a higher risk of premature mortality.(Reference Reilly and Kelly6)
Given that food consumption is directly related to energy input, promoting healthy dietary habits are at the centre of childhood obesity prevention efforts.(Reference Styne, Arslanian, Connor, Farooqi, Murad and Silverstein7) Specifically, the consumption of sugar-sweetened beverages (SSB) is consistently associated with weight gain in childhood. Indeed, a recent meta-analysis of prospective cohort studies and randomized controlled trials confirmed the association between increased SSB intake and BMI gain, and that SSB reduction interventions lead to a reduction in BMI.(Reference Nguyen, Jarvis, Tinajero, Yu, Chiavaroli and Mejia8) This aligns with other results showing that children and adolescents consuming more added sugar are at higher risk of overweight.(Reference Magriplis, Michas, Petridi, Chrousos, Roma and Benetou9) Additionally, a meta-analysis examining the effects of behavioural factors on childhood obesity observed that higher consumption of fruits and vegetables, sweets, and snacks trended towards a lower risk of obesity.(Reference Poorolajal, Sahraei, Mohamdadi, Doosti-Irani and Moradi10) The lack of prospective studies was an important limitation in the evidence.
In recent years, the conceptualization of obesity shifted to a perspective highlighting the role of brain functions in the interaction between genetic predisposition and the environment in the regulation of energy balance.(Reference Saeed, Bonnefond and Froguel11) This approach is supported by the observation that genetic variants associated with obesity are mainly expressed in brain regions related to food behavioural rewards and addiction,(Reference Ndiaye, Huyvaert, Ortalli, Canouil, Lecoeur and Verbanck12) and can be mapped to proteins located in the brain, some of which involve eating behaviour regulation.(Reference Gagnon, Girard, Gobeil, Bourgault, Couture and Mitchell13) Twin studies estimate that additive genetic factors account for up to 80% of individual differences in BMI.(Reference Silventoinen, Jelenkovic, Sund, Hur, Yokoyama and Honda14) Additionally, previous evidence shows systematically more weight change variance between than within pairs of monozygotic twins in response to overfeeding and negative energy balance, suggesting that genetic factors modulate the weight change in response to dietary habits.(Reference Bouchard15)
The consumption of various types of foods (e.g. SSB, or fried foods) has been shown to modify the effect of individual genetic variants on obesity risk.(Reference Heianza and Qi16) Polygenic scores (PGSs) are often used to measure genetic susceptibility to a trait by aggregating the effect of individual genetic variants into a single index. A lower consumption of fruits and vegetables and a higher consumption of SSB are among the dietary factors with the most evidence supporting the presence of a moderation effect with PGS in relation to higher body weight.(Reference Han, Masip, Meng and Nielsen17) Nevertheless, there is still conflicting results regarding those foods. Some studies reported evidence that PGS moderated the association of the consumption of SSB(Reference Brunkwall, Chen, Hindy, Rukh, Ericson and Barroso18–Reference Ding, Ellervik, Huang, Jensen, Curhan and Pasquale20) and fruits and vegetables(Reference Ding, Ellervik, Huang, Jensen, Curhan and Pasquale20–Reference Wang, Heianza, Sun, Zheng, Huang and Ma22) with BMI, while others did not.(Reference Wang, Heianza, Sun, Huang, Ma and Rimm21,Reference Tyrrell, Wood, Ames, Yaghootkar, Beaumont and Jones23,Reference Hüls, Wright, Bogl, Kaprio, Lissner and Molnár24) There is a lack of studies examining the possible role of PGSs in moderating the relation between food consumption and BMI in children specifically. One study(Reference Viljakainen, Sorlí, Dahlström, Agrawal, Portolés and Corella25) observed higher associations of pizza and milk consumption with BMI z-score in children with higher PGS values, and another(Reference Hüls, Wright, Bogl, Kaprio, Lissner and Molnár24) found a statistically significant interaction between the consumption of fibres (but not fruits and vegetables) and a PGS in relation to BMI. Similarly, inconsistent evidence has been observed when examining the interaction of macronutrient and energy intake with PGSs. Obesity PGSs were found to moderate the association between consumption of lipids, proteins, carbohydrates, and total kilocalories and adiposity-related measures in studies of adults.(Reference Goni, Cuervo, Milagro and Martínez26,Reference Casas-Agustench, Arnett, Smith, Lai, Parnell and Borecki27) In contrast, other studies did not observe such results.(Reference Tyrrell, Wood, Ames, Yaghootkar, Beaumont and Jones23,Reference Lee, Lim, Jung, Kang, Park and Won28)
Overall, studies on the interaction between PGSs and dietary intakes in relation to adiposity-related measured, have thus far focused almost exclusively on adult populations, used cross-sectional designs, and only involved PGSs aggregating the effect of a small subset of variants. Therefore, the main objective of the present study was to estimate the association between dietary intakes and BMI (mean and change with age) displayed in school-aged children and examine the extent to which PGSs for BMI moderate those associations. Linear mixed models applied to repeated anthropometric measures obtained from a longitudinal study of children from Quebec (Canada) were used to test the hypothesis that food consumption (juice and fruit drinks, sweets and snack foods, meats, and fruits and vegetables), macronutrient intakes (proteins, lipids, carbohydrates) and energy intake are associated with BMI throughout childhood and that PGSs derived from adult and child summary statistics moderates those associations.
Methods
Study design and participants
Investigators recruited a total of 2120 children born from October 1997 to July 1998 to the Quebec Longitudinal Study of Child Development (QLSCD) which is designed to be representative of the regional birth distribution. From 5 months to 25 years, data collection occurred every year or every other year by questionnaires or interviews administered to the person most knowledgeable about the child (usually the mother), questionnaires administered to teachers, questionnaires administered to the child, or via direct measurements by trained assistants. Data collection included family characteristics (e.g. socioeconomic and demographic characteristics), dietary habits (e.g. food frequency consumption, and eating behaviours), anthropometric data (self-reported or directly measured), and genetic information. A cohort profile published previously provides comprehensive details related to the QLSCD.(Reference Orri, Boivin, Chen, Ahun, Geoffroy and Ouellet-Morin29)
The study sample for the food consumption analyses consisted of 1793 participants with food consumption data, at least one BMI measure, and complete covariate data. The study sample for the analyses of macronutrient and energy intake included 1513 participants with macronutrient and energy intake data, at least one BMI measure, and complete covariate data. The subsamples for analyses including genetic data consisted of 706 (food consumption) and 646 (macronutrient and energy intake) participants with genetic data that passed quality control. A flow chart depicting study samples is provided in Supplementary Figure 1.
This study was conducted according to the guidelines laid down in the Declaration of Helsinki. The data collections from the QLSCD were approved by the Ethics committees of the Institut de la Statistique du Québec and the CHU Sainte-Justine Research Centre. The secondary analysis of the data from the QLSCD was approved by the University of Ottawa Research Ethics Board (ethics file number: H-01-23-8018). Informed consent was obtained from parents before each wave of the data collection until age 10. At this point, informed consent was obtained directly from the participants themselves.
Anthropometric measurements
Anthropometric data were collected every one or two years throughout the QLSCD, either reported by a parent, reported by participants themselves, or directly measured by trained assistants. In this study, we focused on directly measured anthropometric data, which were obtained at ages 4, 6, 7, 8, 10, 12, and 13 years. Trained assistants measured height and weight following a standardized protocol. Height was assessed using a measuring tape or a ruler, and weight was measured using a scale without shoes and only light clothing. A minimum of two height and weight measures were taken, with a third only necessary when the difference between the first two measures was higher than 0.5 cm or 0.5 kg. The final height and weight values were calculated as the mean between the two closest measurements. The final individual BMI values were calculated as weight (kg)/height (m)2.
Food consumption and macronutrient and energy intake
The parent most knowledgeable about the participant was administered (interviewer-administered or self-administered) a short FFQ for the average consumption per week of 14 food items multiple times during follow-up. We used data from four questionnaires completed at ages 1, 2, 3 and 4 years to obtain an average of the food consumption in early childhood. These questionnaires asked the number of times per day/week the child ate specific foods. The answers varied from: Never, 1–2, 3–4, 5–6 times per week, and 1, 2+ times per day. Intake values were transformed to the number of times a food was consumed per day as a continuous scale by assuming the middle point for responses categorized as a range (e.g. 3–4 times per week transformed to 0.5 times per day) and assuming the minimum point for open-ended responses (e.g. 2+ times per day transformed to 2 times per day). After grouping certain food items, we included in our analyses the (1) consumption of sweets and snack food (including pastry, sweets, cookies, and potato chips), (2) juice and fruit drinks (excluding carbonated beverages), (3) meats (including poultry, meat, and fish), and (4) fruits and vegetables (including potatoes). The items were summed to obtain the consumption per day for each food groups. Food consumption for each of the four groups was then averaged over each of the time points available per participant to obtain one consumption measure per participant, per food group.
Macronutrient (carbohydrates, proteins and lipids) and energy intake data was gathered using 24-h multi-pass dietary recall interviews(Reference Desrosiers30) conducted at home by trained dietitians when participants were 4 years old. The mother was asked what type and quantities of food the child had eaten in the past 24 hours. A description of the process involved in deriving macronutrient and energy estimates from the dietary recall interview is available in an previous publication.(Reference Dubois, Farmer, Girard, Burnier and Porcherie31) Macronutrient and energy intake values represent the consumption reported as number of units per day where a unit represents 100g for proteins, lipids, and carbohydrates, and 1000 for kilocalories.
Genotyping and polygenic score construction
DNA information was extracted from blood samples for a subsample of 992 participants when they were 10 years old. Genotyping was conducted using the Infinium PsychArray-24 v1.3. Genotyping quality control was conducted in two stages, before and after imputation of genotype data. Pre-imputation, variants with call rates <98%, a minor allele frequency <1% were excluded. Then, individuals with genotyping rates <95%, sex mismatches, genetic duplicates, cryptic relatives, genetic outliers (distance from the mean of >4 standard deviation in the first eight multidimensional scaling ancestry components) were excluded before removing non-autosomal variants and variants with call rates <98%, minor allele frequency <5% or Hardy Weinberg Equilibrium test p-values <1 × 10⁻³ in remaining individuals. Genotype imputation was performed using SHAPEIT v2 (r837)(Reference Delaneau, Zagury and Marchini32) and IMPUTE2 v2.3.2.(Reference Howie, Donnelly and Marchini33) Post-imputation, a final round of quality control was applied with exclusion criteria of minor allele frequency <1%, Hardy Weinberg Equilibrium test p-values <1 × 10⁻⁶, and INFO metric <0.8.
Two distinct PGS of BMI were computed using the PRS-CS (polygenic risk score using continuous shrinkage priors) method(Reference Ge, Chen, Ni, Feng and Smoller34) with the global shrinkage parameter set at auto. One was derived with summary statistics from a genome-wide association study of BMI in children(Reference Vogelezang, Bradfield, Ahluwalia, Curtin, Lakka and Grarup35) and is referred as the ‘child-derived PGS’. The other was constructed using publicly available summary statistics from a genome-wide association study of BMI in adults(Reference Yengo, Sidorenko, Kemper, Zheng, Wood and Weedon36) and is referenced as the ‘adult-derived PGS’. Even though the study population is exclusively comprised of children, the adult-derived PGS was also considered because available evidence suggests that adult-derived PGSs are able to explain a higher proportion of BMI variation than child-derived PGSs.(Reference Helgeland, Vaudel, Sole-Navais, Flatley, Juodakis and Bacelis37) Both scores were standardized and adjusted for population stratification with 613,732 genetic variants for the adult-derived PGS, and 689,789 genetic variants for the child-derived PGS.
Sociodemographic variables
Data on sex, birth weight, maternal education, household income, and parent’s place of birth were gathered when the children were 5-months old using a questionnaire administered by a study interviewer. Maternal education was categorized as having received post-secondary education or not. Household income was categorized as living in a household with sufficient income or not, based on the threshold defined by Statistics Canada in 1997.
Statistical analysis
Baseline sociodemographic characteristics of the study participants are summarized as proportions for categorical variables and means (with standard deviation) for continuous variables. Baseline sociodemographic characteristics were also compared between QLSCD participants included in the study with genetic data and the QLSCD participants excluded from the study (for both food consumption and macronutrient intake analyses). Study participants’ characteristics were compared to those of QLSCD non-participants using a Chi-square test for categorical variables, and one-way ANOVA for continuous variables.
The association between the child and adult-based PGS and BMI (intercept) and changes in BMI with age (slope) was derived using linear mixed models to account for the repeated BMI measurements. Both models (Equation A) included BMI as the outcome variable, with age, an order two polynomial for age, the PGS, the interaction term between the PGS and age, and five baseline covariates (sex, birth weight, maternal education, household income, and whether the mother was born in Canada) as predictor variables.
The predictive role of food, macronutrient and energy intake in BMI was assessed using linear mixed models (Equation B). In addition to the intake variables and their interaction with the first polynomial of age, models also included an order two polynomial for age and the five covariates. The estimated coefficient for the interaction term between the intake variables and age corresponds to its association with BMI slope. The estimated coefficient for the intake variables represents the association with BMI level. We also assessed the association between the intake variables and BMI at specific time points by setting the intercept at 4, 8 and 13 years of age. We examined whether the associations between dietary intakes and BMI differed as a function of sex by adding an interaction term to components already included in the model: (1) dietary intakes and (2) the interaction between dietary intakes and age. Stratified estimates are presented when necessary.
We assessed whether the association between dietary intakes and BMI differed based on a participant’s genetic susceptibility to higher BMI. From the models displayed in Equation B, we added the adult or the child-derived PGSs and an interaction term between the PGS and the food consumption variables as shown in Equation C. We examined if the interaction between dietary intakes and the PGSs changed based on age or sex by adding three-way interactions to dietary intake and PGS.
We further performed two supplementary analyses. First, we added total energy intake as a covariate to the regression models for the macronutrient intake variables to estimate associations independently of the energy component. Second, inverse probability weighting was used to reduce the impact of informative loss to follow up on the results. Individual propensity scores to participation in the current study were estimated on the bases of baseline characteristics (sex, maternal education, birth weight, sufficient income and whether the mother was born in Canada). Weights were estimated for each time point to allow differing weights across time points to account for attrition. To obtain a weighted study sample analog to the initial QLSCD sample, we used the average treatment effect to estimate the propensity scores using the R package ‘twang’.(Reference Cefalu, Ridgeway, McCaffrey, Morral, Griffin and Burgette38) Statistical significance was determined using the student’s t-test with a significance threshold of 0.05. Statistical analyses were performed using R(39) version 4.4.1.


With
 $${\varepsilon _{ij}}\sim{N}\left( {0,\;{\sigma ^2}} \right),{S_{0i}}\sim{N}( {0,\;\sigma _{{S_0}}^2} ), {\rm and}\; {S_{1i}}\sim{N}( {0,\;\sigma _{{S_1}}^2} )$$
where i = 1,…,n individuals and j = 1, …, 7 measurements; T: Age (years); PGS: Child or adult-derived PGS; Intake: Dietary variable; C: Covariates: Sex, birthweight, maternal education, sufficient income, mother born in Canada.
Results
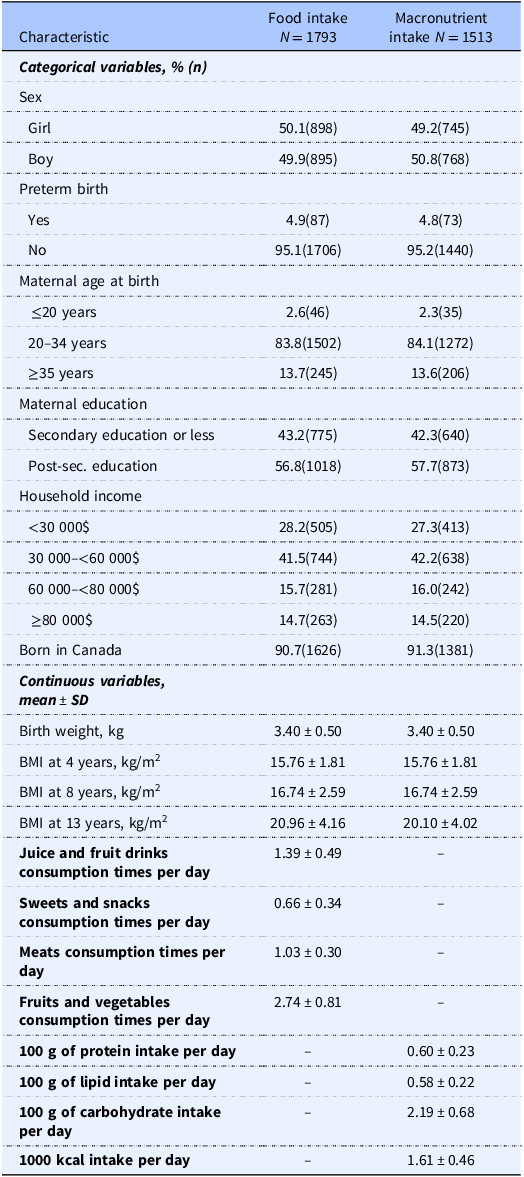
A description of the sociodemographic characteristics of participants included in the main analyses is presented in Table 1. In both the food consumption and macronutrient and energy intake samples, the sex distribution was similar (50.1% and 49.2% girls), more than half of the participants had mothers with post-secondary education (69.3% and 69.3%) and were part of a household with an income below $60,000 (69.7% and 69.5%). Additionally, most of the participants’ mothers were aged 20–34 years at delivery (83.8% and 84.1%) and were born in Canada (90.7% and 91.3%). Compared to non-participants, participants included in the genetically informed analysis were mostly composed of girls, of mothers with higher education, and from higher income households (Supplementary Tables 1 and 2).
Characteristics of study participants with food intake and macronutrient and energy intake data available

N, sample size. SD, standard deviation. Kcals, kilocalories.
The effect of the PGSs on BMI throughout childhood are presented in Figure 1. Both the child-derived (Figure 1A) and the adult-derived (Figure 1B) PGSs were associated with BMI slope, meaning that genetic susceptibility predicted a BMI increase with age. An increase in one SD in the child-derived PGS was associated with a mean yearly BMI increase of 0.06 kg/m2 (95% CI: 0.03; 0.09, p < 0.001), whereas a one SD increase in the adult-derived PGS yielded a mean yearly BMI increase of 0.11 kg/m2 (95% CI: 0.08; 0.14, p < 0.001). These associations did not differ between girls and boys (not shown).
Predicted trajectories of BMI throughout childhood by (A) the child-derived PGS, and (B) the adult-derived PGS. Predicted value of BMI by age based on the value of PGS of −1 SD, mean, +1 SD, based on Equation A.

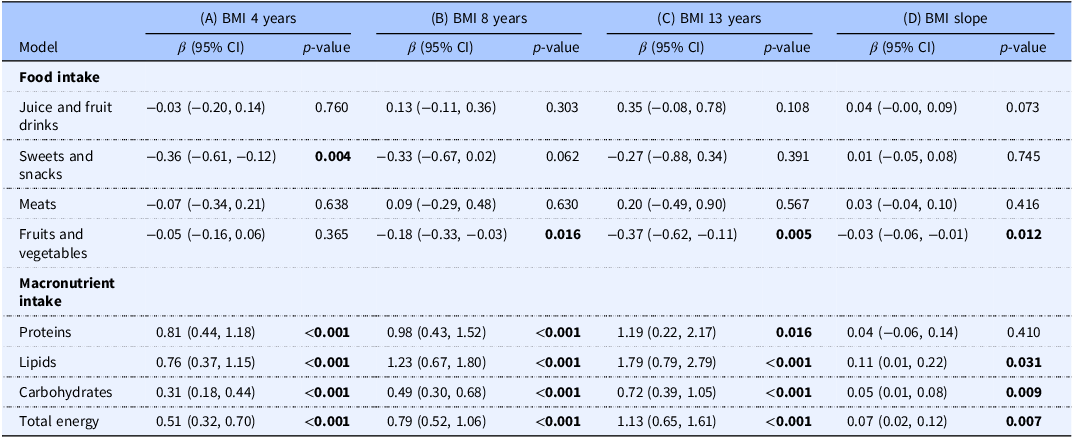
Age-specific associations between dietary intakes in early life and BMI, and whether those associations changed with age (BMI slope) are presented in Table 2. Only fruit and vegetable consumption from ages 1–4 years was significantly negatively associated with BMI slope. A one time increase per day in fruits and vegetables consumption was associated with a yearly decrease in BMI of −0.03 kg/m2 (95% CI: −0.06; −0.01, p = 0.012). The association between fruit and vegetable consumption and BMI was stronger (i.e. more negative) with increasing child age and statistically significant from −0.18 kg/m2 (95% CI: −0.33; −0.03, p = 0.016) at 8 years, to −0.37 kg/m2 (95% CI: −0.62; −0.11, p = 0.005) at 13 years. The consumption of meats, and sweets and snack food were not associated with BMI slope, although a higher consumption of sweets and snack food was significantly related to lower BMI at 4 years (β: −0.36, 95% CI: −0.61; −0.12, p = 0.004) (Table 2). With the exception of juice and fruit drinks (p = 0.036), no food consumption association with BMI slope varied by sex. A one time per day increase in juice and fruit drinks consumption was associated with an increased BMI change with age of 0.08 kg/m2 (95% CI: 0.02; 0.14, p = 0.008) per year and with an increase in age-specific BMI of 0.68 kg/m2 (95% CI: 0.10; 1.27, p = 0.022) at 13 years for girls (Supplementary Table 3).
Age-specific association between food, macronutrient and energy intake, and BMI at 4, 8, and 13 years, and association with change in BMI with age

Estimated association between food, macronutrient and energy intakes and (A) BMI at 4 years, (B) BMI at 8 years, (C) BMI at 13 years, and (D) BMI slope (intake x age interaction) with 95% CI using linear mixed models. Corresponding measurement units for juice and fruit drinks, sweets and snacks, meats, and fruits and vegetables are consumption times per day. Corresponding measurement units for proteins, lipids, and carbohydrates are 100g per day. Corresponding measurement unit for total energy is 1000 calories per day. All coefficients estimated are based on the model described in Equation B, which includes the following covariates: sex, birthweight, maternal education, sufficient income, and whether the mother was born in Canada. Significance threshold (bold) set at 0.05.
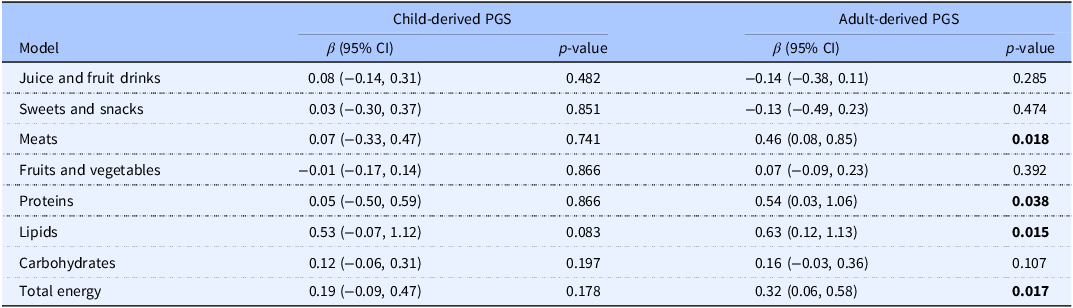
Coefficient for the interaction of food, macronutrient and energy intake with PGSs

PGS, polygenic score. Estimated interaction of food, macronutrient and energy intakes with the child-derived and adult-derived PGS in relation to BMI level with 95% CI using linear mixed models. Corresponding measurement units for juice and fruit drinks, sweets and snacks, meats, and fruits and vegetables are consumption times per day. Corresponding measurement units for proteins, lipids, and carbohydrates are 100g per day. Corresponding measurement unit for total energy is 1000 calories per day. All coefficients estimated based on the model described in Equation C, which includes the following covariates: sex, birthweight, maternal education, sufficient income, and whether the mother was born in Canada. Significance threshold (bold) set at 0.05.
Consumption of higher amounts of proteins, lipids, carbohydrates, and kilocalories at age 4 years was significantly associated with higher BMI from 4 years to 13 years (Table 2). Additionally, higher intakes of lipids, carbohydrates, and kilocalories were significantly associated with increased BMI change with age (Table 2). The association with the slope of BMI was 0.11 kg/m2 (95% CI: 0.01; 0.22, p = 0.031), 0.05 kg/m2 (95% CI: 0.01; 0.08, p = 0.009), and 0.07 kg/m2 (95% CI: 0.02; 0.12, p = 0.007) per daily intake increases of 100g of lipids, 100g of carbohydrates, and 1000 kilocalories, respectively. The associations between macronutrient and energy intake and BMI did not differ by sex (all p > 0.05, not shown). Additional analyses revealed that the association of consumption of lipids and carbohydrates with BMI still increased with age after taking into account total energy consumption (Supplementary Table 4). However, the age-specific associations of all three macronutrients (proteins, lipids, and carbohydrates) with BMI were attenuated and were no longer statistically significant when accounting for total energy consumption, except for carbohydrates at 13 years (Supplementary Table 4).
Age-specific association of food, macronutrient and energy intake with BMI by PGS value

PGS, polygenic score. Estimated association of food, macronutrient and energy intakes with BMI according to age and the adult-derived PGS with 95% CI using linear mixed models. Corresponding measurement unit for meats is consumption times per day. Corresponding measurement units for proteins and lipids are 100g per day. Corresponding measurement unit for total energy is 1000 calories per day. All coefficients estimated based on the model described in Equation C, which includes the following covariates: sex, birthweight, maternal education, sufficient income, and whether the mother was born in Canada. Significance threshold (bold) set at 0.05.
None of the interactions between food, macronutrient, or energy intake and the child-derived PGS in relation to BMI were statistically significant. There were significant interactions between the adult-derived PGS and the consumption of meats, proteins, lipids, and kilocalories in relation to BMI (Table 3). A one SD increase of the PGS moderated those associations so that such consumption yielded 0.46 kg/m2 (95% CI: 0.08; 0.85, p = 0.018), 0.54 kg/m2 (95% CI: 0.03; 1.06, p = 0.038), 0.63 kg/m2 (95% CI: 0.12; 1.13, p = 0.015), and 0.32 kg/m2 (95% CI: 0.06; 0.58, p = 0.017), respectively, across childhood. The interactions did not differ by sex (p > 0.05, not shown) except for juice and fruit drinks and the adult-derived PGS (p = 0.031), with a significant (negative) interaction with the PGS in girls only (Supplementary Table 5). A one SD increase of the PGS diminished the association between juice and fruit drinks consumption and BMI by 0.35 kg/m2 (95% CI: −0.69; −0.01, p = 0.044) in girls. Therefore, girls at lower genetic risk were more susceptible to the effect of juice and fruit drink consumption on BMI.
Table 4 displays the association between increased daily consumption of meat (one more serving per day), protein (additional 100g per day), lipid (additional 100g per day), and kilocalorie (1000 additional kilocalories per day) and BMI, by age (4, 8, and 13 years), reported separately by selected values of the adult-derived PGS (mean score −1 SD, mean score, mean score +1 SD). Higher protein, lipid, and kilocalorie intakes were associated with increased BMI at the mean PGS value and for the mean + 1 SD value at all ages. The positive interactions between the adult-derived PGS and the consumption of proteins and lipids in relation to increases in BMI level were still retained once total energy intake was included in the models (Supplementary Table 6). However, age-specific associations between protein and lipid intakes and BMI by PGS values were attenuated and not statistically significant after adjusting for total energy intake, except for protein intake in those of high genetic risk at 8 years (Supplementary Table 6).
Finally, applying inverse probability weighting to attenuate the impact of informative loss to follow up did not change the overall results, with only minimal effects on the estimated coefficients (Supplementary Tables 7–9).
Discussion
The present study estimated the association between specific food consumption, macronutrient and energy intakes assessed in early childhood and BMI measured later in childhood and determined if genetic susceptibility to higher BMI moderated these associations. The consumption of sweets, and fruits and vegetables were associated with lower BMI at 4 years and at 8 to 13 years, respectively. In contrast, proteins, lipids, carbohydrates, and total energy intake was associated with higher BMI from 4 years to 13 years. Most notably, our findings revealed(Reference Rao, Kropac, Do, Roberts and Jayaraman1) an increase with age of the associations of fruits and vegetables, lipids, carbohydrates, proteins, and energy intake with BMI,(Reference Bancej, Jayabalasingham, Wall, Rao, Do and de Groh2) that a low genetic susceptibility protects from an increase in BMI associated with higher intakes of proteins, lipids, and total energy, and(Reference Kansra, Lakkunarajah and Jay3) that taking into account total energy intake dissipates most of the macronutrients contribution to mean BMI, but not the related slope of BMI and interaction with genetic susceptibility.
The present study suggests that in childhood, the association between juice and fruit drink consumption and BMI increases with age in girls. Two recent meta-analyses of 40(Reference Nguyen, Jarvis, Tinajero, Yu, Chiavaroli and Mejia8) and 20(Reference Poorolajal, Sahraei, Mohamdadi, Doosti-Irani and Moradi10) studies, including a large proportion of prospective cohorts supported the association of a higher consumption of SSB with increased BMI and risk of obesity in childhood. In the present study, the association with BMI was statistically significant only in older girls, which was not explained by differences in sample sizes between girls and boys. The two meta-analyses did not investigate differences in associations by sex. However, similar results were observed in a previous study(Reference Libuda, Alexy, Sichert-Hellert, Stehle, Karaolis-Danckert and Buyken40) reporting that an increased consumption of soft drinks and fruit juices (driven by fruit juices) was associated with an increase in BMI exclusively in girls. Increased consumption of SSB throughout childhood was also associated with higher BMI and risk of overweight in early adulthood exclusively in women in another study.(Reference Nissinen, Mikkilä, Männistö, Lahti-Koski, Räsänen and Viikari41) Our findings should be interpreted with caution as the consumption of juice and fruit drinks in our study, which was measured up to age 4 years, did not include carbonated beverages.
Our observation that a higher consumption of snacks was associated with a lower BMI at early age aligns with previous evidence. Other observational studies have shown similar results of higher consumption of sweets and snacks associated with higher risk of overweight.(Reference Poorolajal, Sahraei, Mohamdadi, Doosti-Irani and Moradi10,Reference Jakobsen, Brader and Bruun42) This observation seems counter-intuitive due to the added sugar contained in sweets and snack foods. It has been hypothesized that sweets and snacks consumption between meals could lead to a lower food consumption at subsequent meals as compensation.(Reference Poorolajal, Sahraei, Mohamdadi, Doosti-Irani and Moradi10) However, given that energy compensation between snacks and meals may only happen partially,(Reference Kant and Graubard43) that current evidence for the relation between snacks consumption and lower body weight is parse and heterogeneous,(Reference Jakobsen, Brader and Bruun42) and that high added sugar consumption is associated with worse cardiometabolic outcomes in children,(Reference Rupérez, Mesana and Moreno44) our result should be interpreted with caution.
Furthermore, the association between higher fruits and vegetables consumption and lower BMI grew stronger with age. The consumption of fruits and vegetables is encouraged in children to decrease the risk of obesity.(Reference Styne, Arslanian, Connor, Farooqi, Murad and Silverstein7) However, systematic reviews found only weak or unclear evidence for an association between a higher consumption of fruits and vegetables and lower BMI or risk of obesity in children.(Reference Poorolajal, Sahraei, Mohamdadi, Doosti-Irani and Moradi10,Reference Ledoux, Hingle and Baranowski45) Thus, our study adds robust evidence in favour of higher fruits and vegetables consumption recommendations in childhood.
Our study showed a clear association of higher intakes of proteins, lipids, carbohydrates, and total energy at age 4 years with higher BMI throughout childhood. It is generally accepted that energy intakes play an important part in the aetiology of the accumulation of body fat. Beyond the contribution to increased energy intake, there are hypotheses related to the individual contribution of macronutrients on BMI variation. For example, energy balance may be influenced by carbohydrates through hormonal pathways,(Reference Ludwig, Aronne, Astrup, de Cabo, Cantley and Friedman46) or protein intake through satiety mechanisms.(Reference Martinez, Navas-Carretero, Saris and Astrup47) However, there is still uncertainty about the extent to which macronutrients contribute to the build-up of body fat in the body.(Reference Martinez, Navas-Carretero, Saris and Astrup47) Although there is evidence that carbohydrate and lipid intake affect weight change in adults,(Reference Willems, Sura-de Jong, van Beek, Nederhof and van Dijk48,Reference Sartorius, Sartorius, Madiba and Stefan49) the current literature concerning the effect of the composition of macronutrients in diets on body weight in childhood is limited.(Reference Jakobsen, Brader and Bruun50) Our study suggests that the association between the consumption of macronutrients (lipids, carbohydrates, and proteins) and BMI is seemingly present only when not accounting for energy intake. This aligns with a previous meta-analysis that reported that the proportion of carbohydrates in a diet is not significantly associated with the risk of obesity,(Reference Sartorius, Sartorius, Madiba and Stefan49) suggesting that most of the attributed risk of increased consumption of carbohydrates is related to the increase in energy intake. Energy intake may attenuate the associations between macronutrients and BMI, but the associations with the slope of BMI remained unchanged. As the explanation behind the conservation of the associations with BMI slope, but not the associations with age-specific BMI, remains elusive, future research will be needed to investigate this question in more detail. Finally, the absence of significant association of protein intake at age 4 years with BMI slope in conjunction with strong associations from 4 to 13 years also aligns with the literature. Higher consumption of protein in the first years of life (0–24 months) was associated with higher BMI later in childhood in two recent meta-analyses of prospective studies.(Reference Stokes, Campbell, Yu, Szymlek-Gay, Abbott and He51,Reference Arnesen, Thorisdottir, Lamberg-Allardt, Bärebring, Nwaru and Dierkes52)
Not everyone that are exposed to the same modern obesogenic environment characterized by easily accessible unhealthy eating options and a sedentary lifestyle develops obesity. This likely stems from the complex interplay between environmental and genetic factors.(Reference Pérusse, Jacob, Drapeau, Llewellyn, Arsenault and Bureau53) Identifying interactions between genetic susceptibility and dietary factors could be important in revealing individuals who are more likely to benefit from specific dietary interventions or prevention methods. We found that the adult-derived PGS modified the association between consumption of proteins, lipids, and total energy and BMI. Other than the previously reported results showing that genetic variants associated with macronutrient consumption are also related to metabolism and obesity,(Reference Tanaka, Ngwa, van Rooij, Zillikens, Wojczynski and Frazier-Wood54) the interaction between genetic factors and macronutrient intake the interactions observed in our study could be explained by epigenetic modifications in response to diet variations.(Reference Milagro, Mansego, De Miguel and Martínez55) Previous studies on the interaction between PGS for obesity and macronutrients are mixed: some studies observed significant interactions with proteins,(Reference Goni, Cuervo, Milagro and Martínez26) lipids,(Reference Wang, Heianza, Sun, Huang, Ma and Rimm21,Reference Goni, Cuervo, Milagro and Martínez26,Reference Casas-Agustench, Arnett, Smith, Lai, Parnell and Borecki27) and energy intake,(Reference Goni, Cuervo, Milagro and Martínez26) and others did not.(Reference Tyrrell, Wood, Ames, Yaghootkar, Beaumont and Jones23,Reference Lee, Lim, Jung, Kang, Park and Won28) Our results offer valuable insights considering that only one of the aforementioned studies was prospective(Reference Wang, Heianza, Sun, Huang, Ma and Rimm21) and all examined dietary intake and BMI data in adulthood. Our study aligns with the only other study(Reference Goni, Cuervo, Milagro and Martínez26) that found interactions with total protein and lipid intake after adjustment for total energy intake. Our observation that genetic susceptibility also modified the association between the consumption of meat and BMI could stem from the interaction with protein intake.
Consumption of SSB is the type of food that has been the most observed to interact with a PGS related to BMI.(Reference Brunkwall, Chen, Hindy, Rukh, Ericson and Barroso18,Reference Qi, Chu, Kang, Jensen, Curhan and Pasquale19,Reference Olsen, Ängquist, Larsen, Linneberg, Skaaby and Husemoen56) PGSs for BMI have also been shown to modify the association of fruit and vegetable consumption(Reference Wang, Heianza, Sun, Zheng, Huang and Ma22) or a more broadly healthy eating diet with adiposity measures.(Reference Ding, Ellervik, Huang, Jensen, Curhan and Pasquale20,Reference Wang, Heianza, Sun, Huang, Ma and Rimm21,Reference Heianza, Zhou, Sun, Hu and Qi57) The consumption of juice and fruit drinks, sweets and snack foods, and fruits and vegetables was not found to interact with genetic susceptibility in our study. This could be explained by differences across studies in how the consumption of food was measured; for example, our beverage variable incorporated juice and fruit drinks but not carbonated sweetened beverages, as noted. Also, previous results were obtained in studies of adults, whereas our sample was composed of children. For instance, in another rare study of children, there was no interaction between consumption of fruits and vegetables and a PGS in relation to BMI in children aged 2 to 16 years. Overall, we found that only the PGS derived from adult data, but not from children, modified the relationship between dietary intakes and BMI. This is consistent with the observation that an adult-derived PGS may be able to capture higher BMI variation compared to child-derived PGS as early as 3 years of age.(Reference Helgeland, Vaudel, Sole-Navais, Flatley, Juodakis and Bacelis37)
Generally, interaction studies provide clarity to what sub-group of a population or in what circumstances an exposure influences a trait.(Reference Pérusse, Jacob, Drapeau, Llewellyn, Arsenault and Bureau53) Our results suggest that protein, lipid and energy intake affect body weight, especially in genetically susceptible children. Considering obesity interventions could be better tailored to individuals for better results,(Reference Smith, Fu and Kobayashi58) genetic susceptibility may indicate which individuals to target. Still, the use of PGS in a clinical setting to identify individuals at higher risk of obesity is not common. PGS predicting BMI cannot identify individuals at higher risk of obesity with appropriate accuracy.(Reference Loos and Yeo59) However, the presence of an interaction between dietary intakes and a PGS in relation to BMI implies that it may be possible to reduce the effect of genetic factors on body weight by acting on the dietary habits of children. Thus, understanding which foods and macronutrients could have even more impact on genetically susceptible children remains an important undertaking.
The use of a longitudinal design is an important strength of the study that allowed us to portray the influence of dietary intake on body weight throughout childhood in more detail, as a cross-sectional design would have missed crucial patterns of associations. We also used PGSs that were derived using a method incorporating hundreds of thousands of genetic variants, capturing a more diverse array of biological mechanisms related to obesity compared to methods limited to a few dozen variants. The observation of interactions between dietary intake variables and the adult-derived PGS, but not the child-derived PGS highlights the importance of the choice of score used to represent genetic susceptibility. Additionally, completing the analyses adjusting for total energy intake revealed important distinctions that are often omitted when simply using one of the two possibilities. Although self-report measures of food consumption were used with FFQs, we leveraged multiple time points to obtain a more robust estimate. In addition, we used 24-h dietary recall interviews to estimate macronutrient and energy intake, which produce good estimations of population dietary intakes and are a cornerstone of national nutrition surveys in Canada.(Reference Brassard, Laramée, Robitaille, Lemieux and Lamarche60)
We also note some limitations. First, despite adjusting regression models with potential confounders and opting for a weighted approach to mitigate attrition bias, unmeasured factors that could not be included as covariates (e.g. level of physical activity) or in the weighting approach could still bias the resulting associations. Second, although BMI is commonly used to represent fat accumulation in the body, it remains an imperfect measure that hardly differentiates between lean and fat mass and is blind to the location of fat mass, which can have a different impact on health outcomes. Additionally, our results specifically pertain to BMI and the change in BMI with time. These may not translate to standardized adiposity measures commonly used in children (e.g. BMI z-score), but use of such measures would have introduced additional uncertainties into the analyses because of the established limitations of reference growth curves.(Reference Adise, Rhee, Laurent, Holzhausen, Hayati Rezvan and Alderete61) Third, although we tested if sex modified the associations we studied, some of those tests were three-way interactions (e.g. PGS, energy intake, sex) which usually require large sample sizes to obtain sufficient power. Therefore, larger studies may be needed to explore these questions more specifically. Fourth, the present study was more exploratory driven. Due to the high number of statistical tests performed, additional studies will be needed to confirm the results observed. Fifth, although FFQs and 24-h recall are commonly used nutritional assessment methods, they have some limitations, including the risk of misclassification due parental recall. For instance, under-reporting of dietary intakes in 24-h recall is more common among parents of children of higher BMI.(Reference Börnhorst, Huybrechts, Ahrens, Eiben, Michels and Pala62) Finally, considering we used a PGS based on summary statistics from populations of European ancestry, our results may not be generalizable to populations of non-European ancestry.
Conclusion
Overall, using a longitudinal design and incorporating genetic factors in our study provide a robust approach to investigating the association between dietary intakes and BMI change in childhood. We observed that lower consumption of fruits, and vegetables as well as a higher consumption of macronutrients (proteins, lipids, carbohydrates), and total energy was associated with higher BMI at different points throughout childhood. We also note that the association between some dietary intakes and BMI increased with age (fruits and vegetables, lipids, carbohydrates, and total energy), or increased with genetic susceptibility (proteins, lipids, and total energy). Those results highlight that the effectiveness of obesity prevention efforts that target dietary intake may depend on individual genetic susceptibility to higher BMI.
Supplementary material
The supplementary material for this article can be found at https://doi.org/10.1017/jns.2026.10086
Data availability statement
The data used to support the findings of this study was provided by the Québec Longitudinal Study of Child Development, conducted by Santé Québec, a division of the Institut de la Statistique du Québec and may be released upon application to the Institut de la Statistique du Québec, through the Research Zone at https://statistique.quebec.ca/en/institut/services-for-researchers.
Acknowledgements
We acknowledge the contribution of Till Andlauer, Stéphane Paquin, Geneviève Morneau-Vaillancourt, Isabelle Ouellet-Morin and Michel Boivin, who were involved in the quality control of the genetic data of the QLSCD participants that are used in the research. We are grateful to the QLSCD participants and their families who took part in the various data collection rounds over the years.
Author contributions
DG, LD and MB contributed to the conception and design of the study. LD and MB were involved in the data collection from QLSCD participants. DG performed the statistical analyses with guidance from CG. DG was responsible for the first draft of the manuscript. All authors participated in discussions concerning the development of the study and were involved in the revisions to the manuscript and approved the submitted version.
Funding statement
This work was directly supported by a CIHR operating grant (#165964). The funders were not involved in the design or conduct of the study; collection, management, analysis, or interpretation of the data; or preparation, review, or approval of the manuscript. The analyses were performed using data from the Quebec Longitudinal Study of Child Development (QLSCD). The QLSCD was supported by many grants over the years, including from the Fonds de recherche du Québec – Société et Culture (FRQSC), Fonds de recherche du Québec – Santé (FRQS), the Social Sciences and Humanities Research Council of Canada (SSHRC), and the Canadian Institutes for Health Research (CIHR), as well as by funding from the Gouvernement du Québec, the Lucie and André Chagnon Foundation, the Robert-Sauvé Research Institute of Health and Security at Work, the Institut de la statistique du Québec, and Ste. Justine Hospital’s Research Centre.
Competing interests
The authors declare that the research was conducted in the absence of any commercial or financial relationships that could be construed as a potential conflict of interest.


 Open access