


Discussions of health inequalities often begin with the statement that such inequalities are ubiquitous; the less affluent in the population have always had worse health, they have worse health wherever they live and they suffer more from all forms of ill-health. The author entered the field thinking along these lines but, as with most generalizations, a more than superficial acquaintance with empirical studies revealed that there were important exceptions; indeed, it became clear that more could perhaps be learned about the processes generating inequalities in health by considering the exceptions rather than carrying out more and more studies to prove the rule.
The life-course perspective has offered one way of moving beyond simple generalizations about health inequalities. In the UK a major stimulus for embracing life-course approaches within epidemiology was the work of Barker and colleagues on the early-life origins of adult disease (Barker, Reference Barker1998). To the present author, and perhaps to other contemporary readers, Barker's initial 1986 Lancet publication in this area (Barker & Osmond, Reference Barker and Osmond1986) appeared to develop the ideas of Forsdahl from the early 1970s onwards (Forsdahl, Reference Forsdahl1973, Reference Forsdahl1977) on how adverse environmental conditions in infancy and early childhood could increase the risk of CVD in late adult life. Forsdahl (Reference Forsdahl1973) was concerned with the high mortality in the Norwegian county of Finnmark and drew attention to a possible cause ‘which has not been discussed earlier, namely that the considerably high mortality today is a late consequence of the adverse circumstances to which a large part of the population was exposed during their childhood and adolescence’. He showed that the main contributor to this high mortality was CHD and that the current pattern of conventional risk factors, such as smoking and diet in adulthood, did not seem to account for this elevated mortality risk (Forsdahl et al Reference Salmi and Forsdahl1974). He then analysed data across the whole of Norway and demonstrated that infant mortality rates early in the 20th century correlated strongly with CHD mortality rates 70 years later (Forsdahl, Reference Forsdahl1977; Fig. 1). Forsdahl (Reference Forsdahl1978) speculated that permanent damage may be caused by nutritional deficit in early life that renders individuals less able to tolerate particular forms of fat in their adult diet, a hypothesis he went on to test.
Correlation between mortality from arteriosclerotic heart disease in 1964–7 in men aged 40–69 years (standardised rates/100 000 population) and infant mortality rates 1896–1925; r +0·86, P<0·001 (Forsdahl, Reference Forsdahl1973).

In their initial studies, which built on the work of Forsdahl, Barker and colleagues (Barker & Osmond, Reference Barker and Osmond1986) interpreted their findings as indicating an influence of childhood nutrition. However, the focus of the studies quickly came to rest on the prenatal environment, and in particular in utero fetal nutrition (Barker et al Reference Barker, Osmond, Winter, Margetts and Simmonds1989). Only after a decade of almost exclusive concentration on this period did these studies again embrace the potentially modifying influence of experiences acting in later life (Forsen et al Reference Forsen, Eriksson, Tuomilehto, Reunanen, Osmond and Barker2000; Barker et al Reference Barker, Forsen, Uutela, Osmond and Eriksson2001). However, to many researchers in the ‘inequalities in health’ field, and to some epidemiologists working on the aetiology of particular diseases, the ‘fetal origins of adult disease’ hypothesis has stimulated thinking about influences acting from before birth and then right through the life course. A Life Course Approach to Chronic Disease Epidemiology edited by Kuh & Ben-Shlomo (Reference Kuh and Ben-Shlomo1997) collects together contributions from across the disciplinary and disease spectrum, and has established life-course thinking as central to the epidemiological endeavour.
A key problem with the initial studies in the early-life or fetal-origins field was that when relating early-life exposures to health outcomes many decades later the intervening social trajectories of individuals born into poor circumstances would tend to be less favourable than those of individuals who entered the world as members of more-comfortably-off families. Ben-Shlomo & Davey Smith (Reference Ben-Shlomo and Davey Smith1991) have demonstrated this potential problem in relation to the studies that have correlated past infant mortality rates with present-day mortality rates. Initially, the findings of Forsdahl and Barker were replicated showing that areas with high levels of infant mortality in the early part of the 20th century had high CHD mortality among elderly adults in the 1980s (Fig. 2(a)). It was then demonstrated, however, that statistical adjustment for an area-based measure of socio-economic disadvantage abolished this association (Fig. 2(b)). It was not concluded that the findings demonstrated that early-life factors were not important, but that it ‘is unhelpful to consider an either/or model, which would exclude the possible interaction and cumulative effect of factors acting early and later in life. These ecological associations, however, do clearly point out the importance of considering a lifecourse approach to disease aetiology’ (Ben-Shlomo & Davey Smith, Reference Ben-Shlomo and Davey Smith1991).
Infant mortality rates 1905–8 and female IHD mortality aged 65–74 years in 1969–73 before (a) and after (b) control for measures of adult deprivation. (△), (■), (○), Lowest, middle and highest deprivation tertiles respectively. (From Ben Shlomo & Davey Smith, Reference Ben-Shlomo and Davey Smith1991.)

The implications of these findings for epidemiology are that detailed data for periods covering the entire life course are required to identify the contribution of exposures acting at particular time-periods. Researchers in the health-inequality field were amongst the first to take up this challenge and attempt to better characterize the relative importance of influences acting at different stages of life to the generation of inequalities in health in adulthood.
Explanations for inequalities in health: the legacy of the Black Report
The Black Report on inequalities in health (Department of Health and Social Security, 1980) was published in the UK in 1980, and its handling by the Conservative government that had replaced the Labour administration that originally commissioned the report caused considerable controversy (Berridge, Reference Berridge2002). The recommendations in the Black Report focused particularly on the alleviation of child poverty, and implicitly suggested that this process would have long-term effects on reducing inequalities in health, in line with some earlier research of Morris, one of the Black committee members (Morris & Heady, Reference Morris and Heady1955). In relation to explanations for inequalities in health, the Black Report included some limited discussion of the potential contribution of early-life influences to later health. For example, it was suggested that class differences in low birth weight ‘can have, except under the most advantageous conditions, long-term implications for the health and development of the young child’. A general framework with four categories of explanation was put forward by the Black Committee, ‘artefact, social selection, behavioural/cultural influences and aspects of the material conditions of life’ (Department of Health and Social Security, 1980). In the attention that the Black Report received after its release it was the recommendations on how to reduce inequalities in health that were the focus of most interest. Initially, the approach of the Black Committee to the explanation received little comment, although a review by Blane (Reference Blane1985) began to redress this neglect. Blane's (Reference Blane1985) review and later reviews (for example, see Davey Smith et al Reference Davey Smith, Blane and Bartley1994) concluded that: the magnitude of health inequalities was probably underestimated (rather than overestimated) because of artefacts in data collection and analysis; unfavourable social circumstances led to adverse health outcomes (rather than poor health leading to less-favourable social locations); the origins of health inequalities could not be ascribed in any simple way to the unconstrained adoption of insalubrious lifestyle choices. One paper (Davey Smith et al Reference Davey Smith, Blane and Bartley1994) concluded that the clustering of advantage and disadvantage across the life course was key: A woman in a low-income household is more likely to be poorly nourished during pregnancy and to produce a low birth weight or premature baby. A child growing up in a low-income household is more likely to be disadvantaged in terms of diet, crowding, safe areas in which to play and opportunities for educational achievement. An adolescent from a low-income household is more likely to leave education at the minimum school-leaving age, with few qualifications and to experience unemployment before entering a low-paid, insecure and hazardous occupation, with no occupational pension scheme. An adult working in this sector of the labour market is more likely to experience periods of unemployment, to raise a family in financially difficult circumstances and to retire early because their prematurely expended health can no longer cope with the physical demands of their work. A retired person who does not have an occupational pension is more likely to experience financial deprivation in the years leading up to their death'.
Early-life influences on later disease
Life-course approaches to health inequalities explicitly considered how exposures acting from before conception through to death could have important health consequences. The novel aspect of these approaches, however, was certainly the inclusion of early-life factors, since previous explanatory approaches to adult health inequalities had generally concentrated on influences acting in adulthood. Thus, there was a considerable focus of life-course researchers on previously-neglected early-life influences, as reflected in the limited coverage of conventional adult risk factors for chronic adulthood disease seen in the edited collection of Kuh & Ben-Shlomo (Reference Kuh and Ben-Shlomo1997).
Many progenitors of life-course epidemiology could be resurrected to provide a historical lineage for work in this field (Davey Smith & Kuh, Reference Davey Smith and Kuh2001; Kuh & Davey Smith, Reference Davey Smith, Hart, Blane and Hole1993). The contention of Ciocco (Ciocco et al Reference Ciocco, Klein and Palmer1941) that many held the view that ‘disease in adulthood is often brought about by the cumulative effects over a long period of time of many pathological conditions, many incidents, some of which take place and are even perceived in infancy’ illustrates that this view was not in the minority. However, after the Second World War, as epidemiology came to focus on adult ‘lifestyles’, there was little interest in the childhood origins of adult disease until late in the century. The exception was the few studies relating to the aetiology of particular diseases, such as Gutensohn & Cole's (Reference Gutensohn and Cole1981) work on childhood social environment and Hodgkin's disease, but such work was generally not referred to within the health-inequalities field.
Interest in childhood social circumstances and adult health in the UK developed within the context of the national birth cohorts, in particular the 1946 and 1958 cohorts, that had collected data from the time of birth onwards. Much of the initial focus was on the way in which relating childhood social position and health to adulthood social position and health could address the question of health-related selection, and it was a contentious issue in the mid-1980s. Wadsworth (Reference Wadsworth and Wilkinson1986) and Power (Power et al Reference Power, Manor and Fox1991) and their colleagues reported detailed analyses of these issues from the birth cohorts. Demonstration of the contribution of social circumstances in childhood to adult morbidity and mortality followed on from this work, both in the birth cohorts (Power & Matthews, Reference Power and Matthews1997; Power et al Reference Power, Matthews and Manor1998; Kuh et al Reference Kuh, Hardy, Langenberg, Richards and Wadsworth2002) and elsewhere (Davey Smith et al Reference Davey Smith, Hart, Blane, Gillis and Hawthorne1997; Galobardes et al Reference Galobardes, Lynch and Davey Smith2004; Strand & Kunst, Reference Strand and Kunst2007). One study examining the association between childhood socio-economic circumstances and mortality in later adulthood (Frankel et al Reference Frankel, Davey Smith and Gunnell1999) involved a 60-year follow-up of a study initially established by Sir (later Lord) John Boyd Orr. A brief account of this study, instigated as it was by the scientist for whom the present lecture is named, is provided in the Appendix.
Models of life-course influences on adult disease
Many analyses of how socially-patterned exposures acting at different stages of the life-course affect health outcomes use unspecific measures such as all-cause mortality or overall subjective health ratings. These composite outcomes will be influenced by a wide range of exposures; for example, all the aetiological factors relating to the component causes of death will relate to all-cause mortality. Detailed models of how exposures acting at different stages of life come together to influence the final health outcome cannot be clearly specified in relation to such summary measures. The development of life-course epidemiology within particular health domains has made it clear that different processes come into play in relation to different health outcomes. Ben-Shlomo & Kuh (Reference Ben-Shlomo and Kuh2002) have developed a helpful typology of models for life-course epidemiology (see Table 1).
Conceptual life-course models (Ben-Shlomo & Kuh, Reference Ben-Shlomo and Kuh2002)

A simple model of life-course influences is that the accumulation of risk occurs such that an adverse exposure early in life that increases disease risk has an additive effect with adverse influences in later life. When examining all-cause mortality or a broad cause-of-death group, such as cardiovascular mortality, this model appears to be valid (Davey Smith et al Reference Davey Smith, Hart, Blane, Gillis and Hawthorne1997); a cumulative exposure measure of life course socio-economic circumstances, is created by simply adding up the instances of being in particular social locations across life. Similar analyses have been carried out for an overall measure of self-perceived health status in the 1958 birth cohort (Fig. 3; Power et al Reference Power, Manor and Matthews1999). Cumulative effects are also seen in relation to CVD mortality when combining early-life and later-life socio-economic and behavioural factors (smoking and excess drinking; Table 2; Davey Smith & Hart, Reference Davey Smith and Hart2002). In these cases the adverse exposures could either be found to be uncorrelated, e.g. high alcohol consumption is not strongly related to childhood or adulthood social class, or found to cluster. Clustering could occur either because poor social circumstances are related to a variety of other exposures, or could reflect more direct causal links, as when poor childhood educational attainment leads to an unfavourable adulthood occupation.
Poor health in (a) men and (b) women at age 33 years and cumulative socio-economic circumstances (from birth to age 33 years) in the UK (1958–91). (From Power & Matthews, Reference Power and Matthews1997.)

Cardiovascular mortality according to cumulative risk indicator (father's social class, screening social class, smoking, alcohol use; from Davey Smith & Hart, Reference Davey Smith and Hart2002)

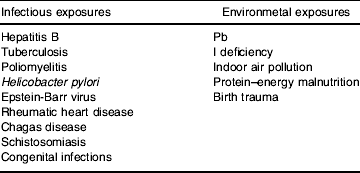
An alternative set of models sees the time window of exposure as key. This notion is well understood in a variety of situations, such as with prenatal infections or drug exposure, where during a particular period of fetal development these factors can lead to devastating permanent developmental changes, whereas if they were experienced just a few days earlier or later they would have no long-term impact. Such critical-period effects can also extend from before conception, throughout the growing period and beyond. Table 3 lists some infectious and environmental exposures for which critical periods seem to apply. The ‘fetal origins of adult disease’ hypothesis is, of course, one example of a critical-period model of adult disease. Infections acquired early in life may have adverse consequences, consistent with a critical-period model. The demonstration that stomach cancer, for example, appears to be particularly dependent on adverse social circumstances in childhood (Davey Smith et al Reference Davey Smith, Hart, Blane and Hole1998) presumably reflects this notion. Infection with Helicobacter pylori early in life is enhanced by social conditions that mitigate against good hygiene practices, and acquisition during a time when H. pylori was unrecognized, or infection was not diagnosed and treated, leads many decades later to increased stomach cancer risk. The number of siblings an individual has, which will also be related to the risk of H. pylori infection in early life, is also related to the risk of stomach cancer (Hart & Davey Smith, Reference Hart and Davey Smith2003). The exact age of acquisition of H. pylori seems to be related to the particular disease outcomes that result (H. pylori also causes stomach and duodenal ulcers), as with other infections such as hepatitis B for which very early infection (which mainly occurs in developing countries) appears to increase the risk many decades later of developing liver cancer. The age of acquisition of human papilloma virus through unprotected sexual intercourse may also influence the risk of subsequently developing cervical cancer, just as the particular age at which Pb exposure occurs will influence its neurodevelopmental consequences. Of course, the ultimate outcome of exposures experienced at critical periods can depend on later-life influences. A simple illustration of this association is that antibiotic treatment to eradicate H. pylori dramatically reduces the risk of developing stomach cancer (Uemura et al Reference Uemura, Okamoto, Yamamoto, Matsumura, Yamaguchi, Yamakido, Taniyama, Sasaki and Schlemper2001), and low birth weight appears to have greater detrimental consequences if followed by obesity in later life (Frankel et al Reference Frankel, Elwood, Sweetnam, Yarnell and Davey Smith1996).
Infectious and environmental exposures with age dependency
The absence of infections or exposure to dirt occurring during a particular critical period may also adversely influence later health, and it has been proposed that such a lack of exposure may lead to asthma, hayfever, Hodgkin's disease, non-Hodgkin's lymphoma and type 1 diabetes, among other conditions (Strachen, Reference Strachen1989). Disease occurring in later life clearly reflects the influence of factors acting at different stages, from before birth through to late adulthood, and therefore socio-economic inequalities in these conditions will reflect the social patterning of such exposures across the life course. The interplay of the accumulation of risk and critical-period exposures in generating health inequalities differs in relation to the health outcome under investigation (Davey Smith et al Reference Davey Smith, Hart, Upton, Hole, Gillis, Watt and Hawthorne2000a).
Inequalities in health: general or specific explanations?
One issue within the health-inequalities field that has been illuminated by life-course approaches is the consideration of the extent to which such inequalities reflect the outcome of a general process (with the component health outcome composition of the overall pattern of inequality being, in some senses, a mere contingency), or whether a case-by-case analysis of each health outcome contributing to overall health inequality is required. This issue is not exclusive to the health-inequality field, but is of relevance to epidemiology more generally. An influential exponent of what has been termed a ‘general susceptibility’ view of health inequalities was the US epidemiologist Cassel, whose classic paper, ‘The contribution of the social environment to host resistance’ (Cassel, Reference Cassel1976), is a touchstone for debates in this field. Cassel was largely concerned with what some consider to be stress-related morbidity and mortality. He concluded that it was more feasible to strengthen resistance to stressors than to reduce exposure, and thought that there was little aetiological specificity between breakdowns in host resistance and the health outcomes seen in particular settings. Cassel's (Reference Cassel1976) ideas were widely adopted in social epidemiology, particularly in relation to socio-economic differentials in health (Syme & Berkman, Reference Syme and Berkman1976; Marmot et al Reference Marmot, Shipley and Rose1984). At the same time researchers in other branches of public health and epidemiology were focusing on susceptibility. For example, McKeown's (1976) influential thesis about the importance of improved nutrition in relation to mortality declines in Britain across the second half of the 19th and 20th centuries saw inadequate nutrition as a factor underlying many diseases. The examination of height trends in Britain over the past two centuries has been taken to suggest that nutritional status, as reflected in height, has been a driving force for mortality change (Floud et al Reference Floud, Wachter and Gregory1990; Harris, Reference Harris2001).
The relevance of general susceptibility accounts of disease can be examined by answering a series of simple questions: have health inequalities always existed; do all current populations show general patterns of health inequality; do all or most health outcomes show social patterning in the same direction?
The first question is easy to answer: no, health inequalities have not always existed in the same way as they now do. In Britain, for example, before 1700 the wealthiest groups, the major and minor aristocracy, experienced similar life expectancy and infant mortality to the overall population (Johansson, Reference Johansson1999). These aristocrats had, of course, enormously privileged existences, but this factor did not translate into longer life for them or their babies. Various aspects of aristocratic living could have been detrimental to health; in particular, servants and tradesmen coming into the home, more travel and more time spent in large congregations, would increase the risk of exposure to infectious agents. Notions of what was the best food encouraged early weaning and the introduction of meat among infants, possibly helped by pre-chewing of solid food by a nursemaid. Wet-nursing of aristocratic children by poor women in their own homes was common. In terms of nutrition and subjective social status the aristocracy were highly privileged, but this factor failed to prevent them developing disease as frequently, or more frequently, than those in considerably-less-favourable social positions. As Johansson (Reference Johansson1999) has suggested, it took knowledge to convert wealth into health. Once the modes of existence that were salubrious became obvious, the better off could afford to practice them and began to live longer. A straightforward, but dramatic, example of this outcome relates to deaths from the plague in the middle of the 17th century in Italy. Fig. 4 shows the number of deaths occurring in Genoa on a week-to-week basis in 1656 and 1657. The data come from searchers, often widows who were paid to inspect the corpses of the dead and report cases of apparent plague. The period of missing data during the epidemic reflects the fact that the wealthy, who paid for this data collection, left the city and thus avoided the plague during epidemics. The less-well-off residents could not afford to leave. Once knowledge could be translated into action to avoid disease through the use of their material resources, the better off began to dramatically improve their health compared with the poor.
Deaths in Genoa attributed to the plague 1656–7 (Johansson, Reference Johansson1999).

The second question, of whether health inequalities exist in the same way in all contemporary populations, also gets a negative answer. Whilst in fully-industrialized societies there generally is a strong association between, for example, income and overall mortality, at the aggregate level exceptions exist. Within a country such as Japan areas of higher average incomes do not have better life-expectancy profiles (Mosk & Johansson, Reference Mosk and Johansson1986). In countries that are not yet fully industrialized there has also been noted in some places the lack of any area–level association between socio-economic position and health outcomes (Asthana, Reference Asthana1995). At an individual level there are few good data from developing countries. However, a recent study from Tanzania, for example, has demonstrated no socio-economic gradient in the incidence of diarrhoeal disease amongst children, but a strong gradient in terms of the treatments the ill children received (Schellenberg et al Reference Schellenberg, Victora, Mushi, de Savigny, Schellenberg, Mshinda and Bryce2003). For specific causes of ill-health rather than overall measures the situation is of considerable heterogeneity in the directions of association across different societies. Thus, while in the great majority of cases social circumstances correlate with worst health, and across the world today poverty is a major determinant of sickness, exceptions to this general situation do exist.
Many of the exceptions to the usual pattern of worse health among those individuals who are less well off probably reflect the adverse consequences of urbanization and industrialization, at least during its early stages (Szerter, Reference Szerter1997). The British aristocracy in the 17th and 18th centuries managed to create a pseudo-urban environment in their own homes, and suffered the ‘urban penalty’ even without experiencing the slums and cesspools of developing cities. Similarly, in countries that are currently industrializing the population in urban areas may have higher incomes and may own more assets (such as televisions or cars) than those who remain in rural areas, but they often experience worse health. Thus, across the whole population higher income may be associated with worse health because of the link between urbanization and access to economic resources. The health consequences of urbanization are largely a result of the exposure patterns that concentrated living conditions bring with them, providing a demonstration of the importance of differential exposure patterns. It is difficult to see the British aristocracy as lacking the factors considered to improve host resistance, adequate nutrition, or a sense of subjective social superiority.
The third question relates to the socio-economic distribution of particular causes of ill-health. The specific factors contributing to the socio-economic distribution of particular causes of ill-health and death have been investigated in less detail than have more general outcomes, such as overall mortality or self-rated poor health. This situation partly reflects the availability of data; most of the data sources used for documenting health inequalities do not contain detailed information about underlying social factors, potential mediators and specific health outcomes in large-enough populations to allow such analytical approaches (Hummer et al Reference Hummer, Rogers and Eberstein1998). However, the lack of attention to cause-specific analyses may also reflect investigators holding to a ‘general susceptibility model’ (Cassel, Reference Cassel1976; Syme & Berkman, Reference Syme and Berkman1976; Najman & Congalton, Reference Najman and Congalton1979; Pearce et al Reference Pearce, Davis, Smith and Foster1983; Marmot et al Reference Marmot, Shipley and Rose1984).
Several processes that could lead to increased susceptibility to disease in general amongst the less-economically-favoured in the population have been proposed, including psycho-social stress, poor diet, inadequate coping resources and genetic differences (Thurlow, Reference Thurlow1967; Najman, Reference Najman1980; Valkonen, Reference Valkonen1987). A wide range of physiological measures has been postulated to be potential mechanisms for the increased susceptibility to disease, largely within the stress paradigm (Sterling & Eyer, Reference Sterling and Eyer1981; Totman, Reference Totman1987; Brunner, Reference Brunner1997). However, data from several sources suggest that the general-susceptibility argument is inconsistent with the true complexity of socio-economic differentials in health. When particular causes of ill-health and death are examined there is a considerable extent of heterogeneity in their association with socio-economic position. Fig. 5 summarizes data relating to cancer mortality from the Whitehall Study of London civil servants, among whom there was a marked gradient in the association between employment grade and all-cause mortality (Marmot et al Reference Marmot, Shipley and Rose1984; Davey Smith et al Reference Davey Smith, Shipley and Rose1990). For overall cancer mortality the lower-grade civil servants (clerical and manual) had a 48% higher risk than the higher grades (administrators, professionals and executives). However, for the thirteen specific cancer sites examined grade-related risk varied by site. The low-grade civil servants had a greater mortality risk for seven of the cancer sites, the higher grades had a greater risk for six (Davey Smith et al Reference Davey Smith, Leon, Shipley and Rose1991). Similar findings in relation to the heterogeneity of site-specific cancer risk with socio-economic position have come from other studies (Faggiano et al Reference Faggiano, Partanen, Kogevinas, Boffetta, Kogevinas, Pearce, Susser and Boffeta1997; Fernandez & Borrell, Reference Fernandez and Borrell1999).
Relative risks of cancer by employment grade (lower grades v. higher grades) in the Whitehall Study. (From Davey Smith et al Reference Davey Smith, Leon, Shipley and Rose1991.)

Table 4 shows data for a wider range of causes of death from the mortality follow-up of 300 000 men in the US Multiple Risk Factor Intervention Trial (with presentation relative risks of mortality associated with a US $10 000 lower median income for the area of residence (using ZIP Codes); Davey Smith et al Reference Davey Smith and Egger1996). For some causes of death, including AIDS, homicide, respiratory disease, diabetes and rheumatic heart disease, large differentials were found, with relative risks >1·5 per US $10 000 lower ZIP Code income. For other causes of death, including such major contributors to all-cause mortality as CHD, lung cancer and stroke, the relative risks associated with US $10 000 lower ZIP Code income were found to be in the range 1·21–1·50. For a large number of causes of death, many of them relatively minor contributors to all-cause mortality, weak or reversed gradients between income and risk were found.
Proportional increase in cause-specific mortality (relative risk; RR) per US $10 000 decrease in median income for area of residence (using ZIP Codes) for US men screened in the Multiple Risk Factor Intervention Trial (Davey Smith et al Reference Davey Smith and Egger1996)

COPD, chronic obstructive pulmonary disease.
For some conditions that show a gradient of increasing risk with better-off social circumstances the reason seems straightforward. Melanoma risk is increased by exposure to sunlight, and the high-grade civil servants in the 1960s and 1970s would have been more likely to have been able to afford summer holidays in places where intense sunlight exposure occurs more often than in the UK. Thus, the better-off civil servants were found to have twice the risk of dying of melanoma (Fig. 5). In the Multiple Risk Factor Intervention Trial it is not surprising that participants from higher-income areas are more likely to die in flying accidents, since airline tickets are relatively expensive. For a large number of cancers that show either a reverse of the usual gradient or no gradient, such as prostate cancer and lymphoma, there is evidence that better nutrition and growth in childhood is associated with increased risk; taller individuals are also at greater risk of these conditions (Gunnell et al Reference Gunnell, Okasha, Davey Smith, Oliver, Sandhu and Holly2001). Individuals in better social circumstances across their lives are on average taller, and this factor is reflected in their cancer risk. The marked heterogeneity in the strength and even direction of the associations between socio-economic position and cause-specific mortality draws attention to the need for explanatory models that account both for the overall and specific health effects of socio-economic position.
Life-course approaches to inequalities in health make some contribution to considerations of general or specific susceptibility through identifying the particular times during life when socially-patterned exposures act to generate inequalities in health outcomes. The associated evidence suggests that for different health outcomes these aetiologically-relevant periods differ. For example, stomach cancer reflects adverse social conditions in childhood that lead to H. pylori infection. Haemorrhagic stroke similarly appears to be particularly dependent on deprivation in early life. Some non-smoking-related cancers, such as prostate cancer, appear to be influenced by growth rates in childhood, as discussed earlier, while others, such as Hodgkin's disease, may be influenced by an absence of infections in childhood. For others, such as lung cancer, exposures during adult life, in this case smoking, is key. For CHD and breast cancer, exposures acting right across the life course appear to be of importance, yet even in these cases some periods are more sensitive to exposures than others. For CHD, for example, the intrauterine environment may be a key period, whilst for breast cancer the period between puberty and first birth seems to be of particular importance.
It is clear that when examining the aetiology of particular conditions the life-course periods during which specific exposures act differ considerably. As a result, there are differences in the direction and strength of gradients between social position and various health outcomes. This trend however, is against a background in which most environmental exposures that are known to be (or in a common-sense way appear to be) noxious are more concentrated on individuals in adverse social circumstances. A recent review (Evans & Kantrowitz, Reference Evans and Kantrowitz2002), for example, has demonstrated how hazardous wastes, outdoor and indoor air pollution, water quality, ambient noise, household overcrowding and quality, safety at schools, childcare provider–child interactions, work environments and neighbourhood quality show strong social gradients in such a way as to generate inequalities in health outcomes. In this sense, there will be a reasonably general association between adverse social position and health, but one that works through social processes that will lead to the exploited, excluded and oppressed receiving the worst that life has to offer in relation to those resources that can be appropriated by the groups who have the necessary economic or social power.
The embodiment of social advantage and disadvantage across the life course
In the 19th century it was evident that disease and death were concentrated among the poorest urban residents (see Wing, Reference Wing1837; for more recent reprints of contemporary accounts by Thackrah, Reference Thackrah1931 and Engels, Reference Engels1987), and the abject physical condition of the poor was widely discussed. In his report of 1845 Engels (see Engels, Reference Engels1987) quoted a Dr Hawkins as saying that visitors to Manchester were struck ‘by the lowness of stature, the leanness and the paleness which present themselves so commonly to the eye’. In London Engels had observed ‘pale, lank, narrow-chested, hollow-eyed ghosts’ with ‘languid, flabby faces, incapable of the slightest energetic expression’. The physical effects of the living conditions of the poor started early; the female factory operatives worked when pregnant until the hour of delivery (because otherwise they lost their wages) and their offspring were said to be feeble. As children they shared the poor diets of their parents, and ‘the food of the labourer, indigestible enough in itself, is utterly unfit for young children, and he has neither means nor time to get his children more suitable food. Moreover the custom of giving children spirits, and even opium, is very general; and these two influences, with the rest of the conditions of life prejudicial to bodily development, give rise to the most diverse affections of the digestive organs, leaving life-long traces behind them’ (see Engels, Reference Engels1987).
These characteristics, which are reflected in the short, scrawny, pale and physically-degenerate factory worker, were considered to be produced by long working hours, hot, damp, dusty and overcrowded working environments, repetitive arduous work, physical abuse from overseers, poor food, lack of sleep and inadequate exposure to sunlight (Wing, Reference Wing1837; Thackrah, Reference Thackrah1931; Engels, Reference Engels1987). The resultant poor constitution increased susceptibility to disease and death and, in the words of a Leeds surgeon (Wing, Reference Wing1837), ‘never a year passes, but I see several instances where children are in the act of being worn to death by thus working in factories’.
With some improvement in social conditions and standards of living from the mid-19th century (Feinstein, Reference Feinstein1998), the focus on the inadequate physical condition of the poor may have decreased, although echoes of previous viewpoints continued to be heard. At the beginning of the next century the Inter-departmental Committee on Physical Deterioration (1904), which was established in response to the high proportion of men found unfit for military service in the Boer War, reported that while (despite its title) there was no evidence of actual deterioration, the physical condition of the British worker was poor.
With the economic depression of the 1930s there was a resurgence of popular and academic interest in the effects of poverty on health. Again, a particular focus was on physical condition. In their well-known book ‘Poverty and Public Health’ M'Gonigle & Kirby (Reference M'Gonigle and Kirby1936) detailed the shorter stature, lower weight, greater dental decay, greater prevalence of rickets and other bone diseases, worse posture and greater prevalence of squint among the inadequately-nourished children from poor households. According to these authors ‘Children cannot survive unscathed prolonged deprivations or deficiencies of certain essentials for normal nutrition’. The social medicine movement of the period was much concerned with social physiology; as Ryle (Reference Ryle1947) stated ‘The comparison of social class with social class in respect of height, weight, the routine clinical examination of systems, radiographic appearances, the common disabilities, and of mental and physical function tests should have much to teach us’. It is not for nothing that the initiators of the celebrated Peckham Health Centre, a pioneering project in integrated health care, much lauded today as a model that should be recreated, entitled their first book Biologists in Search of Material (Williamson & Pearse, Reference Williamson and Pearse1938).
It is clear that discussions of poverty and health over the 19th century and first half of the 20th century were much concerned with the effects of social disadvantage on the physique and constitution of the poor. However, the explosion of research into inequalities in health that has followed the 1980 publication of the Black Report (Department of Health and Social Security, 1980; Davey Smith et al Reference Davey Smith, Shipley and Rose1990) has been largely disinterested in differences in macroscopic physiology. A major concern has been the extent to which socio-economic and ethnic differentials in major causes of death, such as CHD, are explicable in terms of differences in behavioural patterns, such as smoking, drinking and exercise, and of conventional risk factors, such as blood pressure and cholesterol levels (Marmot et al Reference Marmot, Shipley and Rose1984; Davey Smith et al Reference Davey Smith, Hart, Blane and Hole1990). Much explanatory research has focused on psychological and psycho-social factors, such as lack of job control, hostility, depression and lack of social support among individuals (Hemingway & Marmot, Reference Hemingway and Marmot1998) and social anxiety within populations (Wilkinson, Reference Wilkinson1999). If biological factors are invoked they tend to revolve around over- or under-activation of the conventional stress system, the hypothalamic–pituitary–adrenal axis, and their consequences (Brunner, Reference Brunner1997).
Why has the literature relating to inequalities in health either been uninterested in biology or had a particularly constrained view of the biological factors of interest? An answer to this question may come from inspecting the limited literature that has taken a macro-biological approach. This literature tends to focus on genetic explanations; an example being Ellis' (Reference Ellis and Ellis1994) work that postulates a fundamental genetic determination of socio-economic differences in height, birth weight, brain size, intelligence, parental investment, work motivation, drug use and altruism, and thus of health. This approach is of course playing a very old tune indeed; in the 1840s the short stature and poor constitution of children working in mines was blamed on heredity (Kirby, Reference Kirby1995). The uncomfortable reaction produced by such hereditarian thinking, which Ellis (Reference Ellis and Ellis1994) anticipates, is surely conditioned by its resonance with the biologism that underlay eugenics, and thus the consequences of eugenics. The common sense view is that if something is biological it is resistant to change. The appropriate focus of inequalities in health research is on ways in which inequalities can be reduced and the health of the poor improved. The linguistic similarity and sometimes conceptual confusion between social selection views of the origins of health inequalities and Darwinian natural selection have been combined with an understandable distaste for genetic approaches to social problems to limit discussion of the biological basis of health inequalities to a discussion of unseen, and comfortably metaphorical, workings of the stress systems.
The dismissal of what are seen as overly-biological approaches to health inequalities may have unfortunate consequences if it focuses attention on areas that actually contribute little to the generation (and thus potential amelioration) of health inequalities, while simultaneously neglecting the socially-produced (but biological) aspects of life that generate inequalities. In LifelinesRose (Reference Rose1997), a biologist, lays out the multilevel, historically-contingent and highly-mutable nature of biological processes. Taking a similar approach to the production of health inequalities may prove helpful in the present impasse.
A key step is to consider time as a crucial dimension. Health is fundamentally shaped by time; at a given level of absolute standard of living, mortality rates are considerably lower today than they were in the 1930s. The conditions of life a particular society (and individuals within that society) experience depend on historical circumstances. The individual life course (even if artificially abstracted from its social location) unfolds over time, with each step being partially dependent on what has happened before and shaped by existing conditions, which are integrated into the nature of the individual who then faces (and reacts to) succeeding events.
Life-course approaches are clearly consistent with models that see social inequality being literally incorporated into the body (Najman & Davey Smith, Reference Ciocco, Klein and Palmer2000; Krieger & Davey Smith, Reference Krieger and Davey Smith2004). For example, maternal social environment is related to fetal growth and development, which appears to have a long-term influence on disease risk in adulthood. Following birth, nutrition and infections are related to growth in early infancy, which in turn determines adult height. Both fetal development and environmental exposures in infancy and childhood influence lung function, and thus respiratory health. Infections acquired in childhood can become permanent; individuals retain the infectious agents throughout their lives, as with H. pylori infection during early childhood and later risk of peptic ulcer and stomach cancer. Height has received particular attention (Marmot et al Reference Marmot, Shipley and Rose1984; Davey Smith et al Reference Davey Smith, Hart, Upton, Hole, Gillis, Watt and Hawthorne2000b), as have the components of height (leg length and trunk length; Gunnell et al Reference Gunnell, Davey Smith, Frankel, Kemp and Peters1998a), because evidence suggests that socially-patterned exposures in childhood are particularly related to leg length, measured both in childhood and adulthood (Gunnell et al Reference Gunnell, Davey Smith, Holly and Frankel1998b; Wadsworth et al Reference Wadsworth, Hardy, Paul, Marshall and Cole2002). Much of the work on leg length and health outcomes has come from the Boyd Orr cohort (see Appendix).
Epidemiological implications of life-course approaches
There has been considerable recent debate about the individualistic focus of much epidemiology on the lifestyles or physiological profiles of individuals abstracted from their social context (Diez-Roux, Reference Diez-Roux1998; Koopman & Lynch, Reference Koopman and Lynch1999; Krieger, Reference Krieger1994). These authors point out that there are broader social determinants of the risks to health that individuals suffer, and that attempts to reduce these risks should recognize this fundamental social determination. Other authors have strongly taken issue with this view (Rothman et al Reference Rothman, Adami and Trichopoulos1998).
The many weaknesses of epidemiological approaches that fail to locate exposure–disease associations within their historical, political and social context have been convincingly elaborated on (Krieger, Reference Krieger1994; Diez-Roux, Reference Diez-Roux1998; Koopman & Lynch, Reference Koopman and Lynch1999; Schwartz & Carpenter, Reference Schwartz and Carpenter1999). Perhaps less widely acknowledged is that the abstraction of such associations from their particular context can lead to severely misleading conclusions. Consider, for example, the extensive research on vitamin C consumption and the risk of CVD. A strong observational inverse association between plasma vitamin C levels and CHD mortality (Khaw et al Reference Khaw, Bingham, Welch, Luben, Wareham, Oakes and Day2001) was rendered implausible by a subsequent large randomized controlled trial of a vitamin supplement that raised plasma vitamin C levels substantially but left 5-year CHD mortality unchanged. In this case, the range of plasma vitamin C levels in the observational study and the change introduced by supplementation were similar, yet the outcomes of observation and experiment were very different (see Fig. 6; Heart Protection Study Collaborative Group, 2002). There are now a series of similar examples; hormone-replacement therapy, vitamin E and β-carotene intake in relation to CVD among them. What these examples have in common is that the groups of individuals who were apparently receiving protection from these substances in the observational studies were very different from the groups not using them in relation to a whole series of characteristics of their lives. In a cross-sectional study of late-middle-aged women (Lawlor et al Reference Lawlor, Davey Smith, Bruckdorfer, Kundu and Ebrahim2004) blood vitamin C levels were measured. It was found that women with higher vitamin C levels were less likely to: have had a father in a manual social class job; have had no bathroom and no hot water in their homes as a child; have come from a family with no car; have only completed minimal education; be in a manual social class in adulthood; have no car as an adult; be a smoker; be obese. They were also more likely to: have moderate daily alcohol intake; exercise in their leisure time; eat a low-fat diet; be tall; have longer legs. It is clear that a large range of confounding factors from across the life course would generate an apparent protective effect of vitamin C levels on CHD, even when no causal association exists.
Estimates of the effects of an increase of 15·7 μmol vitamin C/l plasma on CHD 5-year mortality estimated from the observational epidemiological European Prospective Investigation into Cancer and Nutrition (EPIC) Study (Khaw et al. Reference Khaw, Bingham, Welch, Luben, Wareham, Oakes and Day2001) and the randomized controlled Heart Protection Study (Heart Protection Study Collaborative Group, 2002). EPIC m, men, age-adjusted; EPIC m*, men, adjusted for systolic blood pressure, cholesterol, BMI, smoking, diabetes and vitamin supplement use; EPIC w, women, age-adjusted; EPIC w*, women, adjusted for systolic blood pressure, cholesterol, BMI, smoking, diabetes and vitamin supplement use.

Believing that these differences could be summed up in measures of a few ‘potential confounders’ and adequately adjusted for in statistical analyses fails to recognize the complexity of the reasons why individuals differ in relation to particular and general characteristics of their lives. It would be gratifying if the refutation of observational studies by evidence in these areas from randomized controlled trials led to a critical evaluation of approaches that abstract single elements (which are almost always behavioural, psychological or therapeutic) from the complexity of the life and times of individuals, and relate these elements to single health outcomes. It is likely, however, that as in many decaying research programmes auxiliary hypotheses will be mobilized to explain each apparent ‘mistake’ on a case-by-case basis.
Stress, psycho-social factors and health inequalities
Much current research into health inequalities is concerned with the potential aetiological contribution of stress, negative emotions and other psycho-social factors (such as low levels of social support or control at work). The author started work in the health-inequalities field much concerned with such factors; indeed, a polemic against approaches that failed to take into account the contribution of stress was included in an article written in 1987 (Radical Statistics Health Group, 1987). However, the current research evidence is far from convincing that such psycho-social factors make an independent direct aetiological contribution to disease. They do, of course, influence the patterns of exposure that individuals receive to known noxious agents, and in this way they are clearly causes of health inequalities. This rationale is not what is implied in much of the literature in the field, in which psycho-social factors are viewed as direct aetiological agents (acting through the stress systems in the body).
In a recent comprehensive review article Gallo & Matthews (Reference Gallo and Matthews2003) discuss the conditions that must be met for psycho-social factors to be accepted as mediators between social circumstances and health outcomes. Research must show that:
1. social position relates to health;
2. social position relates to psycho-social factors;
3. psycho-social factors relate to health;
4. when all factors are examined within a single framework the relationship. between social position and health is attenuated if the effects of psycho-social factors are taken into account.
What does a life-course approach add? The first condition is of course easily met, and life-course approaches merely add that social position across the life course relates to health outcomes. The second condition is also met, with additional evidence that social circumstances in early life (as well as during later life) relate to some (but not all) psycho-social factors (Davey Smith et al Reference Davey Smith, Ben-Shlomo, Lynch, Stansfeld and Marmot2002). The third condition is problematic; for those psycho-social factors that meet the second condition, i.e. are related to social position, it is unlikely that they would not be related to health, even if they had no causal role. Confounding by social circumstances and by socially-patterned causes of disease would guarantee that such psycho-social factors were related to disease outcomes. Indeed, associations of psycho-social factors with social circumstances across the life course would render this confounding more pervasive. Lack of convincing evidence of a causal association between psycho-social factors and health outcomes makes the interpretation of the fourth condition problematic. Statistical adjustment for correlates of social position may attenuate the association between social position and health even if these correlates are not causes of disease, depending on the particular measurement characteristics of the variables included in the statistical model (Phillips & Davey Smith, Reference Phillips and Davey Smith1991).
In the West of Scotland Collaborative study (MacLeod et al. Reference MacLeod, Davey Smith, Heslop, Metcalfe, Carroll and Hart2001, Reference MacLeod, Davey Smith, Heslop, Metcalfe, Carroll and Hart2002a,Reference Macleod, Davey Smith, Heslop, Metcalfe, Carroll and Hartb) a measure of the stress of daily (including working) life was examined. No convincing evidence was found that this factor was causally related to CHD or various other health outcomes (although it was related to admission to psychiatric hospital, suggesting that it did actually measure stress). It was also demonstrated empirically that confounding could distort the association between psycho-social factors and health outcomes, and also that reporting bias could generate spurious associations between psycho-social factors and health outcomes when both could be influenced by a tendency to accentuate the negative aspects of life.
The evidence on the contribution of psycho-social factors to health inequalities has been reviewed recently (Macleod & Davey Smith, Reference Macleod and Davey Smith2003). The current evidence was considered to be inconclusive, and it was also reasoned that a focus on such factors might lead to the well-established material causes of health inequalities remaining unaddressed. Although many (but by no means all) of the researchers in the psycho-social field emphasize the structural determinants of stress, the interventions that have been developed and tested so far have generally had a highly-individualistic focus. Further research within a life-course framework could help illuminate this area, with the consequences of psycho-social stress in early life being investigated along with later-life stress, and full consideration given to confounding by socially-patterned exposures acting across the life course. Experimental or quasi-experimental studies are preferable to observational studies, as the problems of confounding are reduced. This study design has produced suggestive preliminary evidence that job insecurity may have detrimental health effects (for example, see Ferrie et al Reference Ferrie, Shipley, Marmot, Stansfeld and Davey Smith1995), and further research utilizing this methodology would be valuable.
One particular issue that may be illuminated by the life-course perspective is the suggestion that since the gradient in health outcomes is continuous across the socio-economic spectrum it cannot be a result of absolute material standards. Thus, in relation to the Whitehall study of UK civil servants (Marmot et al Reference Marmot, Shipley and Rose1984) it has been suggested that the gradient in mortality among civil servants who were not poor provides support for the importance of psycho-social factors generated by internalization of position within the social hierarchy, and that these psychological factors must be important determinants of differentials continuing into the higher end of the socio-economic spectrum (Marmot & Bobak, Reference Marmot and Bobak2000). Table 5, however, demonstrates that there are clear differences in height by civil service employment grade, and since height is determined in childhood and is strongly influenced by socio-economic factors, it is clear that the professional and executive group experienced more childhood deprivation than the administrators. Another potential effect of early life is reflected in lung function measurements, with early-life environment being known to influence adulthood lung function (Mann et al Reference Mann, Wadsworth and Colley1992). Obesity in adultdhood is partly a reflection of childhood and social circumstances (Parsons et al Reference Parsons, Power, Logan and Summerbell1999) and car ownership is an indicator of wealth, accumulated across the life course partly from parental gifts and inheritance. A comprehensive survey of the social origins of civil servants was conducted around the time the Whitehall study was established (Kelly, Reference Kelly1980). This survey demonstrated that about three-quarters of administrative-grade civil servants had fathers in social class I and II occupations, as opposed to 34% of executive-grade civil servants and 23% of clerical-grade civil servants. Conversely, virtually no administrative-grade civil servants had fathers who were semi-skilled or unskilled manual workers, as compared with 15% of executive-grade civil servants and 22% of clerical grade civil servants. Only about one in ten administrative-grade civil servants had skilled manual fathers, whereas one-third of executive-grade civil servants and approximately 40% of clerical-grade civil servants had fathers in these occupations. It is clear that the social origins, and therefore the social circumstances in early life, of the administrative grade and other grades of civil servants differ considerably. Whereas very few administrative-grade civil servants would have experienced deprivation in childhood, a higher proportion of executive- and clerical-grade civil servants would have done so. Many studies have demonstrated that deprived circumstances in childhood increase the risk of poor health outcomes in adulthood, independent of later-life social circumstances (Davey Smith et al Reference Davey Smith, Hart, Upton, Hole, Gillis, Watt and Hawthorne2000; Claussen et al Reference Claussen, Davey Smith and Thelle2003; Galobardes et al Reference Galobardes, Lynch and Davey Smith2004). Indeed, as Table 5 shows, in the Whitehall Study the association between employment grade and stomach cancer mortality is considerably steeper than that between employment grade and CHD mortality. Stomach cancer risk is strongly related to deprivation in childhood, as has been discussed earlier, and this adds to the evidence that childhood socio-economic circumstances account for some of the association between adult employment grade and mortality. Indeed, when lifetime social circumstances are taken into consideration, the gradient is not mysterious and need not be attributed to psycho-social influences.
Employment grade and associated factors in the Whitehall Study of UK civil servants (data from Marmot et al Reference Marmot, Shipley and Rose1984; Davey Smith et al Reference Davey Smith, Shipley and Rose1990, Reference Davey Smith, Leon, Shipley and Rose1991; Van Rossum et al Reference Van Rossum, Shipley, Van de Mheen, Grobbee and Marmot2000)
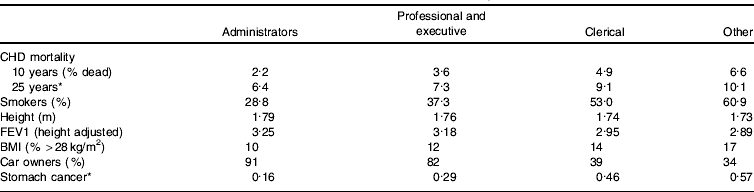
FEV1, forced expiratory volume in 1 s.
* Mortality per 1000 person years.
Income inequality, social capital and population health
Much recent research in the health-inequalities field has considered the potential contribution of general social inequality, and income inequality in particular, to overall levels of population health. Wilkinson (Reference Wilkinson1996) among others has argued that higher levels of income inequality within a country or region lead to worse overall health. Other investigators have suggested that ‘social capital’ mediates between income inequality and population health. The term ‘social capital’ has been used in a variety of ways (Muntaner et al Reference Muntaner, Lynch and Davey Smith2001; Szerter & Woolcock, Reference Szerter and Woolcock2004), but one definition given by a group of prominent investigators within the social epidemiology tradition (Kawachi et al Reference Kawachi, Kennedy, Lochner and Prothrow-Stith1997) is ‘the features of social organization, such as civic participation, norms of reciprocity and trust in others, that facilitate cooperation for mutual benefit’. Researchers in this tradition tend to see psycho-social factors as mediating between income inequality and health outcomes.
The evidence on income inequality and population health has come from cross-national studies and also from within-country investigations, in particular from studies carried out across the States of the USA (for example, see Kaplan et al Reference Kaplan, Pamuk, Lynch, Cohen and Balfour1996). However, given the known latency periods relating to some chronic adulthood diseases, with aetiological processes set in train many decades before the development of illness or death, income inequality must be working as a marker for long-term underinvestment in human resources if it is related to adult mortality (Davey Smith & Egger, Reference Davey Smith, Neaton, Wentworth, Stamler and Stamler1996). Indeed, adjustment for education, in part a measure of childhood socio-economic circumstances, abolishes the association between income inequality and mortality across the States of the USA, supporting this interpretation (Muller, Reference Muller2002).
Turning to the cross-national data the same caveats may apply. The original finding by Wilkinson (Reference Wilkinson1996) is not robust to the inclusion of data from additional countries (Lynch et al Reference Lynch, Davey Smith, Hillemeier, Shaw, Raghunathan and Kaplan2001; Fig. 7). This outcome may reflect changes within and between countries, such that income inequality is no longer a good indicator of investment in human and social resources across the life course. Similarly, an investigation of associations between income inequality, markers of social capital and various health outcomes across countries (Lynch et al Reference Lynch, Davey Smith, Hillemeier, Shaw, Raghunathan and Kaplan2001) does not provide support for the notion that markers of social capital and the psycho-social environment account for health differences between countries. Indeed, where associations were found they tended to be in the opposite direction to those expected. For example, countries in which individuals reported high levels of control over their lives, which would be expected to protect against CHD (Marmot et al Reference Marmot, Bosma, Hemingway, Brunner and Stansfeld1997), were actually found to have higher rates of CHD mortality (correlation between control and CHD mortality 0·63; P=0·02). Higher income inequality was found to be associated with higher infant mortality, which might be expected, since the lag period for factors influencing infant mortality will be shorter than that for adult mortality. Higher income inequality was found to be associated with lower rates of late adulthood mortality, demonstrating that an acute mortality-increasing effect of income inequality is not observed in this case.
Income inequality (Gini coefficient) and life expectancy (Lynch et al Reference Lynch, Davey Smith, Hillemeier, Shaw, Raghunathan and Kaplan2001). (a) For the same nine countries reported by Wilkinson (Reference Wilkinson1996) but with information updated to 1989–91; r −0·45. (b) After adding the other seven countries for which income-inequality data are now available in the Luxembourg Income Study, for the period 1989–91; r −0·09. (○), Represents the relative country population size.

Time-trend data also fail to support the notion that income inequality and social capital influence adult mortality in the short-term. Fig. 8 demonstrates that during a period when income inequality increased dramatically in the USA, mortality rates for both men and women continued to fall dramatically (Lynch & Davey Smith, Reference Lynch and Davey Smith2003). Similar data have been reported from the UK (Lynch et al Reference Lynch, Davey Smith, Kaplan and House2000). Furthermore, the percentage of the population voting, which has been taken by Putnam (Reference Putnam2000), a leading social-capital theorist, to be an important indicator of social capital, has declined substantially over the past two decades in the USA, a period during which mortality has also fallen (Fig. 9).
Income inequality (Gini coefficient) and gender-specific age-adjusted all-cause mortality in the USA, 1968–98. (▲–▲), Male mortality; (■–■), female mortality; (——), income inequality. (From Lynch & Davey Smith, Reference Lynch and Davey Smith2003.)

Ethnic-group-specific voting participation in Presidential elections and age-adjusted all-cause mortality in USA, 1968–98. (▲–▲), Black mortality; (■–■), white mortality; (- - -), black voting; (– – –), white voting. (From Lynch & Davey Smith, Reference Lynch and Davey Smith2003.)

Despite considerable popularity, psycho-social interpretations of the effects of social organisation on population health receive little support from empirical data. Unitary accounts of the determinants of population health, whether focused on psycho-social factors, lifestyle issues or genetic influences, appear inadequate (Davey Smith & Egger, Reference Davey Smith, Neaton, Wentworth, Stamler and Stamler1996). A life-course approach that considers the social and economic factors that have acted across the life courses of individuals currently developing disease and dying may be a more successful way of explaining population health differences, but currently there are few data. The available evidence is, however, encouraging. For example, mortality rates for lung cancer across time fit well with the lifetime smoking patterns of successive birth cohorts (Strachan & Perry, Reference Strachan, Perry, Kuh and Ben-Shlomo1997). Similarly, relating cross-national rates of late adulthood mortality to infant mortality rates for about the time older adults were born reveals strong correlations with conditions known to be influenced by early-life circumstances, i.e. stomach cancer, stroke and tuberculosis (see Fig. 10; Leon & Davey Smith, Reference Ciocco, Klein and Palmer2000). The life-course approach to population health, examining the extent to which socio-economic differentials within countries relate coherently to population health differences between countries and to time trends in disease rates, as a form of triangulation or conscilience, is an area that merits further research. Factors that account for all three of these important demographic health patterns are more plausible aetiological candidates. As discussed in detail elsewhere (Muntaner et al Reference Muntaner, Lynch and Davey Smith2001; Lynch et al Reference Lynch, Davey Smith, Hillemeier, Shaw, Raghunathan and Kaplan2001; Davey Smith et al Reference Davey Smith, Ben-Shlomo, Lynch, Stansfeld and Marmot2002; Macleod & Davey Smith, Reference Macleod and Davey Smith2003; Pearce & Davey Smith, Reference Pearce and Davey Smith2003) psycho-social factors, stress and social capital fail to meet this requirement.
Infant mortality 1921–3 v. stomach cancer mortality 1991–3 for men aged 65–74 years in twenty-seven countries. NZ, New Zealand; Swe, Sweden; Switz, Switzerland; Den, Denmark; Czechosl, Czechoslovakia. (From Leon & Davey Smith, Reference Ciocco, Klein and Palmer2000.)

Conclusions
From reviews of life-course influences related to inequalities in selected specific health problems it has become clear that socio-economic position at different stages of the life-course influences particular conditions in particular ways (Davey Smith et al Reference Davey Smith, Hart, Upton, Hole, Gillis, Watt and Hawthorne2000a; Galobardes et al Reference Galobardes, Lynch and Davey Smith2004). Two conditions, stroke and stomach cancer, appear to be particularly responsive to early-life influences while others, CHD, chronic obstructive respiratory disease, breast cancer and suicide, appear to be influenced by social-patterned exposure acting across life. Some conditions, e.g. lung cancer, appear to be mostly determined by socially-patterned factors acting in adulthood. Thus, there is no single answer to the question that was posed rhetorically 15 years ago (Ben-Shlomo & Davey Smith, Reference Ben-Shlomo and Davey Smith1991) of whether deprivation in childhood or adulthood is a more important determinant of adult mortality risk. Not only is there a difference between particular health conditions at one point in time in relation to early- or later-life determination of risk, but the relative importance of factors can change over time. For example, tuberculosis morbidity and mortality in adulthood has long been considered to reflect infection acquired in childhood (Frost, Reference Frost1939; Springet, Reference Springet1952), with social conditions in early life therefore being of key importance in determining adulthood tuberculosis risk. However, with the advent of HIV infection, in many places the major driving force for resurgent adulthood tuberculosis rates will be an adulthood phenomenon, acquisition of HIV.
The changing importance of early- and later-life determinants of adulthood mortality risk can be seen in the long-term trends in mortality in Britain over the last 160 years. Kermack et al (Reference Kermack, McKendrick and McKinlay1934) have demonstrated that all-cause mortality began to decline after about 1850 in a cohort-specific manner, with falls being seen first in young children, then young adults and then older adults. The mortality rates behaved as if individuals who were children after about 1850 took with them, as they aged, better health potential that had been established in early life. Interestingly, Kermack et al (Reference Kermack, McKendrick and McKinlay1934) point out that as infant mortality did not decline until the turn of the century it is unlikely that this improvement reflects intrauterine development; they therefore interpret their data as suggesting that nutrition and health in childhood determine later health. Thus, over the period 1850–1930 mortality risk in adulthood appears to have been importantly influenced by childhood environment. After 1930, however, serious disruption to the cohort-specific mortality trends occurred, with age-specific mortality rates changing together, rather than in the earlier stepped way (Kuh & Davey Smith, Reference Kuh and Davey Smith1993). This finding suggested that environmental factors acting in adulthood were of importance. The rise in smoking in the British population is one obvious candidate here. Another candidate is the introduction of medical therapies, which influenced mortality risk and resulted in a change in the balance of causes of death such that diseases with predominantly early-life determination (including tuberculosis, stomach cancer, rheumatic heart disease and stroke) decreased in importance, while those with adulthood determination (including lung cancer and accidental or violent death) or determination over the life course (including CHD and breast cancer) became of relatively greater importance. After 1930, therefore, the dominance of the early-life determination of mortality risk seems to have been replaced by a greater contribution of adulthood influences.
It is clear that specific patterns of life-course exposure are related to specific diseases, and there is little support for a simple model of general susceptibility entrained by psycho-social stress. Inequalities in overall health status result from the tendency for the important causes of ill-health, e.g. CHD, stroke, lung cancer and respiratory disease, to show large socio-economic differentials. The social processes that concentrate the exposures that increase the risk of these diseases on particular disadvantaged groups therefore underlie inequalities in overall health status.
The social structure leads to the clustering, over time and cross-sectionally, of multiple factors within the lives of the same individuals. Furthermore, the coexistence of a series of exposures within one individual's life may generate greater health problems than would be anticipated from the known effect of single exposures. For example, the combination of an occupational exposure (As or asbestos) and smoking generates a greater risk of lung cancer than would be expected from the single addition of the known effects of the exposures experienced separately (Hertz-Picciotto et al Reference Hertz-Picciotto, Smith, Holtzman, Lipsett and Alexeeff1992; Erren et al Reference Erren, Jacobsen and Piekarski1999). This synergistic effect of combined exposures would contribute to the poor health outcomes of individuals who experience disadvantage in several aspects of their lives.
A striking phenomenon, mentioned earlier, is the tendency for the most important causes of death to demonstrate the most marked socio-economic gradients. Indeed, as particular causes of death have become more important health problems over the course of this century, the tendency for them to be concentrated among the most deprived in the population tends to become greater. Table 6 presents data on male lung cancer from 1931–91. In 1931 when lung cancer caused 1% of deaths it showed no social class gradient; by 1991 there was a marked gradient, with the mortality rate in social class V men being 4·6 times that of social class I men. A similar picture could be seen in relation to social class differences in CHD during the period of rapid increase in this condition as a cause of death. It reflects the ability to avoid identified noxious exposures that is provided to individuals by more favourable social circumstances. The influence of these exposures occurs against the background of less-avoidable exposures (e.g. poor growth, health and development in childhood) to determine the overall pattern of disease.
Lung cancer mortality 1931–91; social class differences and contribution to total mortality among men of working age (Davey Smith et al Reference Davey Smith, Hart, Upton, Hole, Gillis, Watt and Hawthorne2000a)

While ‘general susceptibility’ as a unitary biological phenomenon does not appear to underlie health inequalities, it is certainly possible to identify social processes that lead to unfavourable exposures being concentrated on those in less-privileged social circumstances, from birth to death. Human bodies in different social locations become crystallized reflections of the social experiences within which they have developed. The socially-patterned nutritional, health and environmental experiences of the parents and of the individuals concerned influence birth weight, height, weight and lung function, for example, which are in turn important indicators of future health prospects. These biological aspects of bodies (and the histories of bodies) should be viewed as frozen social relationships, rather than as social explanations of health inequalities that, once accepted, exclude the social from consideration (Najman & Davey Smith, Reference Ciocco, Klein and Palmer2000). The life-course approach to health inequalities views the physical and the social as being mutually constitutive, since aspects of bodily form can influence social trajectory in the same way as social experiences become embodied. Comprehending the ways in which the social becomes biological, and the biological in turn becomes part of the social world, must be a central aspect of an agenda aimed at improved understanding of how health inequalities arise and how they can potentially be reduced.
Acknowledgements
Thanks to the many colleagues who have contributed to the studies mentioned in this lecture. Much of the material in the lecture was drawn from the book Davey Smith (2003) Health Inequalities: Life-Course approaches, Bristol: Policy Press.
Appendix
The Boyd Orr Cohort
The Boyd Orr Cohort is an historical cohort study based on the long-term follow-up of 4999 children who were surveyed in the Carnegie United Kingdom Trust's study of Family Diet and Health in Pre-War Britain (1937–9; Rowett, Reference Cassel1955). The Carnegie Survey was the brainchild of Sir (later Lord) John Boyd Orr, director of the Rowett Research Institute, Aberdeen, UK from 1914 to 1945. The original research was funded by a grant of £15 000 from the trustees of the Carnegie United Kingdom Trust. Key members of the original survey team were David Lubbock (research administrator), Isabella Leitch (study design), John Pemberton and Angus Thomson (medical examinations) and Isabel Dods (supervision of the diet survey team; Rowett, Reference Cassel1955).
The original Carnegie Survey was established following the publication of Boyd Orr's Food, Health and Income (Orr, Reference Brunner1936), which highlighted the inadequate content of the diet available to the working class in the UK at that time. The book received considerable publicity and the Carnegie Trust became interested in taking forward its findings, with a focus on potential action points that could lead to improved diet and nutrition (Smith, Reference Ciocco, Klein and Palmer2000). Having been approached by the Carnegie Trust Boyd Orr made two proposals. One proposal was the establishment of an experimental farm where unemployed workers could produce their own food, remain physically fit and gain part-time employment. His second proposal was for an ‘investigation on the connection between economic and social factors and physical welfare’ that he hoped would encourage government action to improve the condition of the poor (Smith, Reference Ciocco, Klein and Palmer2000). When asked to elaborate on his proposals Boyd Orr developed a more detailed outline for an economic, dietary and clinical survey of 1000 working class families, together with an investigation of the effect on health and growth of improving the diet of 200 families. Work on the project started in 1937 and continued until April 1939, by which time 1300 families comprising about 8000 individuals living in sixteen districts in England and Scotland had undergone detailed dietary assessments that involved 7 d records of their food consumption and recording of the occupations, food expenditure and quality of housing. Approximately 4000 of the children from these families were examined in specially-convened clinics over the same period, and in eight of the survey centres a dietary supplementation study was undertaken, with nutritional supplementation being given to selected children with the aim of determining its influence on their health and growth (Gunnell, Reference Barker, Osmond, Winter, Margetts and Simmonds2000).
In 1988 a follow-up of the children from the Carnegie survey was instigated, with mortality records, cancer registrations, a questionnaire follow-up, a clinical examination on a subsample and a detailed sociological investigation using life-grid methods (Blane, Reference Asthana2005; Martin et al Reference Blane2005). This follow-up has documented: the extent to which deprivation in childhood is related to later mortality (Frankel et al Reference Frankel, Davey Smith and Gunnell1999, Dedman et al Reference Barker and Osmond2001); the influence of socio-economic and dietary factors on childhood growth and anthropometric characteristics, in particular leg length (Gunnell et al Reference Gunnell, Davey Smith, Frankel, Kemp and Peters1998a); the influence of such childhood growth patterns on later mortality in cancer risk (Gunnell et al Reference Gunnell, Davey Smith, Holly and Frankel1998b,c); and various aspects of how infant and childhood diet are related to later health (for references, see Martin et al Reference Blane2005).



