


Introduction
Reliable data is one of the fundamental building blocks of the overall success of a country's health system. High-quality data can be used to effectively implement national interventions and programmes for women, children, and vulnerable populations. However, poor data quality negatively impacts healthcare at individual and population levels. Over time, inconsistent data quality contributes to misleading trends that result in inaccurate interventions and health policies, concurrently obscuring the magnitude of malnutrition in a country(Reference Assaf, Kothari and Pullum1).
Child anthropometry is prone to measurement errors(Reference Corsi, Perkins and Subramanian2). Many factors affect the accuracy and reliability of the data, such as human and technical errors, and lack of accessibility to anthropometric equipment. National surveys such as the DHS and Multiple Indicator Cluster Surveys flag and remove biologically implausible measurements but do not fully account for poor data quality in their survey reports(Reference Shireen, Kothari and Pullum3). According to the WHO–UNICEF Technical Expert Advisory Group, the data quality of child anthropometry can be assessed by seven indicators: (1) completeness, (2) sex ratio, (3) age heaping, (4) digit preference of measurements, (5) implausible z-score values, (6) the standard deviation (sd) of z-scores and (7) normality of z-score(4). Out of these indicators, the ones which are used commonly are the biological implausibility and sd of z-scores. Biological implausible measurements must fall below 1 % to be considered a good quality survey. The sd of the observed mean z-score is an additional way to easily assess the quality, since it is subjected to the summary statistics(Reference Mei and Grummer-Strawn5). For instance, the mean z-score sd must fall between 0·8 and 1·2 for the survey to be considered a good quality survey(6).
Using an index of anthropometric data quality for the DHS, a previous study reported that the greatest variability among surveys was observed in Sub-Saharan Africa(Reference Perumal, Namaste and Qamar7). A number of countries have misreported the age(Reference Lyons-Amos and Stones8); height measurements tend to be inaccurate due to difficulties keeping children still, especially those under the age of 2 years(Reference Betts, Voss and Bailey9,Reference de Onis10) . DHS surveys have also shown improvement in misreporting with socio-economic development in Sub-Saharan Africa, but improvement did not occur in all countries – including Namibia(Reference Lyons-Amos and Stones8).
Namibia is an upper-middle-income country in Southern Africa. According to the Gini index, Namibia experiences one of the worst inequality levels in the world(11). In 2013, Namibia DHS (NDHS) reported high malnutrition rates of stunting (24 %) and wasting (6 %) among children under age 5 years; but 12 % of child measurements were biologically implausible(12). This high percentage indicates poor data quality and suggests that prevalence estimates could be inaccurate.
Over ten local languages are spoken across this ethnically and racially diverse country. Among Namibians, ethnic identity is closely tied with the language spoken. The indigenous groups are associated with certain geographical regions in the country, and many groups maintain traditional lifestyles. Many people in the Northern area of the country rely on subsistence agriculture, which has been identified with higher levels of poverty(Reference Stell and Fox13,Reference Mchombu and Mchombu14) .
Surveys that collect anthropometry face challenges with consistent, high-quality measurements. An existing analysis method, the PROBIT method, takes into account poor quality anthropometry and allows the use of such data, even when poor quality, is helpful for targeting interventions in resource-limited areas. Correcting for poor quality anthropometry can also help governments and international organisations to properly plan and implement nutritional aid to high-risk areas. However, although poor quality anthropometry is common, the PROBIT method is not often used to adjust for poor quality.
The objectives of the present study were twofold: (1) conducting a comparative analysis of two malnutrition prevalence estimation methods (the standard method of WHO flags and the PROBIT method) in Namibia by using the Namibia Demographic and Health Surveys and the Namibia Household Income and Expenditure Survey 2015/16; (2) analysing trends and identifying high-risk target populations and regions using these two distinct methods.
Methods
Measures
The nutritional status of children was defined by comparing their height, weight and age to the 2006 WHO Child Growth Standards. The malnutrition indices used in the present study were height-for-age z-score (HAZ) and weight-for-height z-score (WHZ). Children with HAZ below −2 standard deviations (sd) from the median were considered stunted. Stunting is a long-term effect of chronic malnutrition. Children with WHZ below −2 sd from the median were considered wasted. Severe acute malnutrition (SAM) was defined as WHZ below −3 sd from the median. Wasting reflects acute malnutrition.
The NHIES indicates the main language spoken in the household. The main languages were collapsed into the following categories: Khoisan, Zambezi, Otjiherero, Rukavango, Nama/Damara, Oshiwambo, Afrikaans and others. The main spoken languages that had less than 30 children younger than 5 years of age when disaggregated were collapsed into ‘others’. The present study used stratified language as a variable for ethno-linguistic groups.
The main indicator of wealth was adjusted per capita income (APCI). The APCI was classified according to the poverty lines (current Namibian dollar/adult/year). Based on the rates in 2016, the food poor line was N$3517·66 (USD 263·10), the lower bound poverty line (severely poor) was N$4672·00 (USD 349·44), the upper bound poverty line (poor) was N$6249·40 (USD 419·69) and non-poor was above N$6249·40 (USD 419·69).
Data source
The present study used data extracted from two sources: the NDHS and the most recent NHIES 2015/16. The NDHS collects information on population, health, nutrition and environmental variables(12). It was implemented by the Ministry of Health and Social Services (MoHSS) in collaboration with the Namibia Statistics Agency (NSA) and the National Institute of Pathology. The objective is to provide information for policymaking, planning, monitoring and evaluation at national and regional levels. The NDHS provides anthropometric data on height and weight for the nutritional status of children younger than 5 years. The present study analysed the nutritional status data of children from 1992 to 2013. The 1992, 2000, 2006/7 and 2013 surveys were used to plot child stunting and wasting trends across time in Namibia.
The present study also used the NHIES 2015/16 for a secondary analysis of stunting and wasting prevalence among children younger than 5 years of age. The NHIES is a household survey designed to measure living conditions that is conducted approximately every 5 years by the NSA. The objectives of the NHIES 2015/16 were to measure patterns of consumption and income and other socio-economic indicators. This survey sampled 10 368 households from April 2015 to March 2016. The survey provided representative child anthropometric data at the national level for each of the 14 regions in the country. This was used to assess the prevalence of stunting and wasting in children younger than 5 years of age based on background characteristics, and to compare regional differences in malnutrition.
The two main differences between the data sources lie in the data collection period and the measurement protocol. The NDHS data was collected over a shorter period from May to September, whereas the NHIES collected data across the whole year from April to March of the following year. Also, the measurement protocol of the sources varied between the two sources. The methodology of NDHS was transparent since it specified the procedures for measuring the height/length of the children. Standing height was measured for children older than 2 years and lying length was obtained in children less than 2 years old. However, NHIES did not state details about the measurement protocol in the final report.
The inclusion criteria for our analysis of NHIES anthropometry were children younger than 60 months and measurements of height and weight within the biological parameters – children with out-of-range measurements or missing age were excluded. The analysis for this survey followed the methodology and definitions used in the DHS. Detailed information on NDHS and NHIES sources and methodology is available in the survey reports(12,15) .
Statistics
For our study using the NHIES data, the prevalence of malnutrition in children younger than 5 years of age in Namibia was analysed using two methods: the standard World Health Organization (WHO) flags to remove biologically implausible measurements and the PROBIT method to account for high variance caused by random error. Both methods relied on the use of the 2006 WHO Child Growth Standards. The WHO flags define biological implausibility as a z-score lying outside <−6|>6 for HAZ and <−5|>5 for WHZ. PROBIT is an alternative method for estimating prevalence recommended by the WHO when data quality is poor. The PROBIT method assumes that the mean is robust and the sd is not and uses an sd of 1 as a hypothetical value if the data quality is perfect. The PROBIT is (−2 – [observed mean z-score])(16).
Analysis of WHO flags was performed using IBM SPSS Statistics for Windows, Version 24.0 (IBM Corp., Armonk, NY, USA). The SPSS macro from the WHO was used to calculate the z-scores for HAZ and WHZ. PROBIT analysis relied on a Microsoft Excel spreadsheet (Microsoft, Redwood, Washington, USA) and the mean z-scores from the WHO flags. PROBIT is defined by the following function in Microsoft Excel: = (NORM.DIST(-2,x,1,TRUE)) × 100.
All data on NDHS were extracted from the DHS Program StatComplier(17). Regional prevalence maps according to the threshold were created using ArcGIS (ArcGIS 10.7, Esri, Berkeley, CA, USA).
The background characteristics of HAZ and WHZ were generated using descriptive analysis. The study followed the DHS background characteristics and methodology to disaggregate the estimates of nutritional status. The WHO/UNICEF standards were used for the prevalence thresholds for HAZ and WHZ(Reference De Onis, Borghi and Arimond18).
Ethics
This is a secondary analysis of anonymous data where no individual, cluster or village location could be identified; so, formal ethical clearance was not required. The dataset obtained from the NSA is publicly available.
Results
Response
Fig. 1 shows the flowchart of the NHIES 2015/16 individual dataset, with a total of 41 581 people including 6205 children younger than 5 years of age, who were eligible to be measured. The enumerators measured 5741 children, giving an overall response rate of 92·5 % for child anthropometry. After excluding children with missing measurement dates (n 0), date of birth (n 774), and with an invalid age in months (n=7), the total number of children remaining for analysis was 4960. The total number of children who were considered for HAZ and WHZ was 4780 and 4637, respectively. The rest were excluded due to WHO flags or out-of-range measurements. The percentage of biologically implausible measurements was 9 %, indicating NHIES collected poor quality child anthropometry.
Flowchart of 2015/16 NHIES sample selection.

Comparing two methods with overall prevalence
Table 1 shows that WHO flags resulted in a higher total stunting prevalence (30·3 %) than PROBIT (20·9 %). In the disaggregated analysis among ethno-linguistic groups, the stunting prevalence was above 60 % with both methods for Khoisan group, whereas the other language groups showed a 32 % or less incidence of stunting. In addition, Khoisan group also displayed the highest wasting prevalence compared to the one of other ethno-linguistic groups, with both the WHO flags (19 %) and the PROBIT method (12·5 %). Furthermore, while WHO flags produced a similarly high prevalence of SAM across ethno-linguistic groups, the PROBIT method indicated that the SAM prevalence in the Khoisan group was three times greater than that in any other group (1·6 % for Khoisan v. <0·5 % for all other groups).
Prevalence of stunting and wasting in children under 5 years with WHO flags and PROBIT method
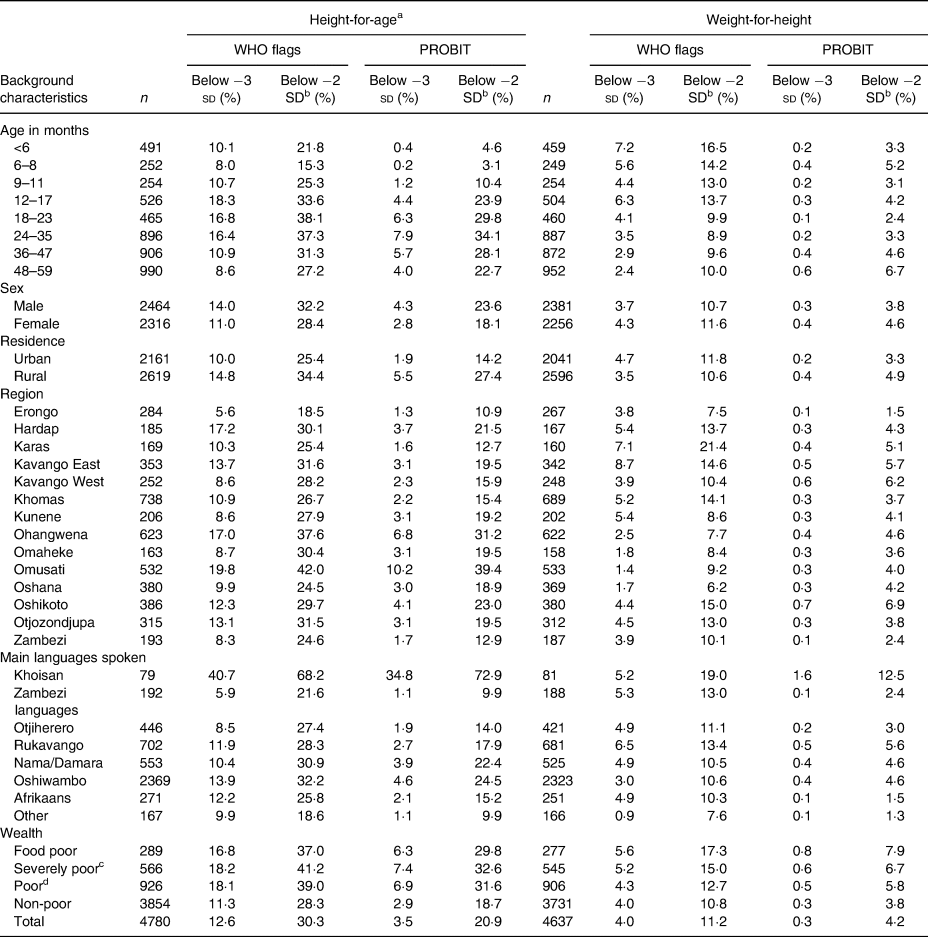
Table is based on children who stay in the household on the night before the interview. Table is based on children with valid dates on birth (month and year) and valid measurement of both height and weight. Each of the indices is expressed in standard deviation units (sd) from the median of the WHO child growth standards. Wealth is classified with the poverty lines (current Namibian Dollars/adult/year). The food poor line was N$3517·66 (USD 263·10), the lower bound poverty line (severely poor) was N$4672·00 (USD 349·44), the upper bound poverty line (poor) was N$6249·40 (USD 419·69) and non-poor was above N$6249·40 (USD 419·69), based on the rates in 2016.
a Recumbent length is measured for children under age 2 and in the few cases when the age of the child is unknown and the child is less than 85 cm; standing height is measured for all other children.
b Includes children who are below −3SD.
c Includes children who are food poor.
d Includes children who are in severely poor and food poor.
Comparing two methods with trends over time
We compared the trends in the national prevalence of stunting and wasting among children younger than 5 years of age using WHO flags and the PROBIT method (Figs 2 and 3). These trends present the prevalence of child stunting and wasting across two types of surveys: the NDHS (1992, 2000, 2006/7, 2013) and the NHIES (2015/16). As shown in Fig. 2, both methods demonstrated a similar trend from 1992 to 2013, but the prevalence of stunting was lower across all years with the PROBIT method than with WHO flags. However, the increase in stunting prevalence from 2013 to 2016 was greater with WHO flags (6·6 percentage points) than with the PROBIT method (2·5 percentage points). Fig. 3 shows pronounced differences between the two methods for wasting trends from 2013 to 2016. From 2013 to 2016, the prevalence of child wasting increased by 5·0 percentage points using the WHO flags; in contrast, only 0·6 percentage point increase was seen using the PROBIT method.
Trends in the national prevalence of stunting among children under age 5 comparing WHO flags and PROBIT method.

Trends in the national prevalence of wasting among children under age 5 comparing WHO flags and PROBIT method.

Comparing two methods with targeting
A comparison between WHO flags and PROBIT methods in reporting stunting and wasting prevalence in children younger than 5 years of age in Namibia is shown in Fig. 4. Stunting prevalence thresholds were the following: very low (<2·5 %), low (2·5–<10 %), medium (10–20 %), high (20–<30 %) and very high (≥30 %). Using the WHO flags, six out of the fourteen regions were classified as ‘very high’ for child stunting prevalence (Fig. 4(a)), whereas the PROBIT method identified only two northern regions (Omusati and Ohangwena) (Fig. 4(b)). No regions achieved the ‘very low’ or ‘low’ stunting levels with either method. The figures are available in the Supplementary Material.
Wasting prevalence thresholds were the following: very low (<2·5 %), low (2·5–<5 %), medium (5–10 %), high (10–<15 %) and very high (≥15 %). More than half of the regions were classified as ‘medium’ or ‘higher’ in the prevalence of wasting using WHO flags (eight out of the fourteen regions) (Fig. 5(a)). The PROBIT method, on the other hand, showed that all regions exhibit ‘medium’ to ‘very low’ levels of wasted children (Fig. 5(b)). Four out of the fourteen regions were classified at a ‘medium’ level and the rest achieved ‘very low’ or ‘low’ levels. One region, Karas, shifted from ‘very high’ to ‘medium’ when comparing the results between the WHO flags and the PROBIT method.
Discussion
Overview
The present study showed that different analysis methods result in varying stunting and wasting prevalence in children younger than 5 years of age when using the data from national surveys with poor quality child anthropometry. The largest difference between the two methods is in the calculated estimates. The WHO flags resulted in a higher prevalence than the PROBIT method.
The results of the WHO flags were possibly due to the overestimation of measurement errors. When random errors occur in measurements, the sd increases, causing more children to fall into the tails of the distribution; therefore, our results most likely reflected an overestimated prevalence. Previous studies that investigated the cleaning criteria for malnutrition prevalence revealed that the WHO 2006 criteria were the most inclusive, resulting in the highest prevalence among different cleaning criteria(Reference Crowe, Seal and Grijalva-Eternod19). Another study argued that even modest random errors can cause a doubling of malnutrition prevalence(Reference Grellety and Golden20).
PROBIT estimates were smaller because they assume a normal distribution. Since this method estimates the prevalence of malnutrition indirectly by computing the area under the normal distribution curve, it excludes extreme values and produces a smaller standard error for the prevalence estimate than the applications of WHO flags. As a result, the PROBIT estimates were affected to a lesser extent by measurement errors than the WHO flags. These findings are similar to those of a previous study, which analysed the performance of PROBIT and WHO flags and reported that the 95 % confidence interval was lower for the PROBIT method than for WHO flag estimates(Reference Blanton and Bilukha21). Our results with the PROBIT method possibly led to less misinterpreted results.
Implications of using the different methods for the national prevalence and trends
The present study showed that estimation methods affected the reported national prevalence of stunting and wasting from 1992 to 2016. The prevalence of wasting estimated with WHO flags showed an abrupt change indicative of an acute emergency from 2013 to 2016; however, there was only a small increase in acute malnutrition over the same period when estimated by the PROBIT method. According to WHO thresholds, a wasting prevalence of 15 % or more, or a prevalence between 10 and 14 % with exacerbating conditions, requires attention(Reference De Onis, Borghi and Arimond18). This revealed a problematic trend because the estimate with WHO flags suggested that immediate intervention and supplementary feeding are called for, while the PROBIT method suggested that there is little to no public health emergency. This profound difference in wasting estimates reveals the magnitude of influence the data adjustment has on prevalence and trends. Furthermore, it can potentially lead to inefficient action in the implementation of malnutrition treatment and interventions, depending on which analysis method is utilised.
Implications of targeting regions with different methods
High-risk regions were easily identified by comparing the regions according to the WHO prevalence thresholds. PROBIT allowed us to compare regions based on the mean z-score, which revealed prominent changes in prevalence as well as thresholds in priority regions. A previous study stated that the PROBIT method provided results that were more precise than the WHO estimates, and therefore recommended the former for surveillance and monitoring(Reference Dale, Myatt and Prudhon22).
The Government of Namibia reported the most detrimental nutritional challenges lie in Northern areas (Oshana, Ohangwena, Omusati, Oshikoto, Kavango and Zambezi)(23). The target regions suggested by the PROBIT method support similar northern regions, while the WHO flags showed high or medium stunting and wasting across the entire country. Since poor quality anthropometry results in overestimation of prevalence, relying solely on WHO flags may result in overestimation of the number of priority areas. Using the PROBIT method when poor quality anthropometry is suspected may help identify regional differences for prioritisation that would have otherwise been masked by high prevalence in all regions when using WHO flags.
Implications for identifying vulnerable groups
One of the most notable results of the present study was the malnutrition status of ethno-linguistic groups. The Khoisan language group, spoken by Namibia's San ethnic group, exhibited the highest prevalence of stunting with both WHO flags (68·2 %) and PROBIT (72·9 %) methods as compared to other language groups. The San community is the most vulnerable and impoverished group in the country(Reference Suzman24). Even when compared to Burundi, which has the world's highest prevalence of stunting (57·7 %), the San had surpassed these estimates(Reference Akombi, Agho and Merom25). For SAM estimates, ethno-linguistic groups resulted in little difference across the groups with WHO flags. However, with the PROBIT method, the San would be a priority target group for therapeutic feeding because SAM prevalence was three times higher than any other group.
As Dale et al. reported, the PROBIT method is argued to be more advantageous for smaller sample sizes of less than 150 compared to a larger sample size(Reference Dale, Myatt and Prudhon22). A study by Blanton et al. also reported the advantages of the PROBIT method for lower sample sizes(Reference Blanton and Bilukha21). Of the ethno-linguistic groups, San was the only group with a sample size of less than 150, and this was the only occasion where the PROBIT method displayed a greater estimate than the WHO flag prevalence. In addition, a higher SAM prevalence among the San was completely masked when using WHO flags. Therefore, the San estimates could have better reflected the characteristics of the PROBIT method because of the smaller sample size than that of the other ethno-linguistic groups.
Implications for caseload and coverage estimation
The NHIES findings resulted in different caseloads for treating SAM, with the WHO estimate (4·0 %) being 13 times greater than the PROBIT estimate (0·3 %). Previous literature suggests that caseload estimates from SAM prevalence should be used with caution for services and policies(Reference Deconinck, Pesonen and Hallarou26). Similar results have been found, where the precision of estimates of caseload and burden was improved by using PROBIT to estimate the prevalence of SAM(Reference Bulti, Briend and Dale27). Therefore, the present study shows that the use of PROBIT to avoid overestimation of caseload is particularly important when using surveys with poor quality child anthropometry.
Way forward
The true prevalence is more likely to be accurately represented through high-quality surveys with consistent and intensive field supervision during data collection. Considering the differing data qualities among DHS across countries, extensive training and adequate supervision can improve the overall standard and achieve higher quality anthropometric data(Reference Bilukha, Couture and McCain28,Reference Leidman, Mwirigi and Maina-Gathigi29) . During field work, quality assurance procedures are recommended such as measuring each child twice and taking the average, and a practical test on measurement as part of an extensive training of data collectors and incorporating in-process quality checks for intra- and inter-observer technical error of measurement(Reference Stomfai, Ahrens and Bammann30,Reference Jamaiyah, Geeta and Safiza31) .
The present study highlights the importance of high-quality anthropometric data in public health and is relevant to other low- and middle-income countries with similar data quality issues in child anthropometry. However, what constitutes poor data quality and ways to standardise poor data adjustments are still an ongoing challenge and a topic of debate. There are limitations in using the PROBIT method because it assumes that the population has a normal distribution. Given Namibia's extreme inequality, a normal distribution with an sd of 1 may not properly represent the true population of the country. Additionally, there is no consensus on the sample size for which the PROBIT method works well.
After comparing the two methods of analysis for calculation of malnutrition prevalence, it was revealed that the prevalence estimates, trends, target regions and vulnerable groups varied with the analysis method. The findings presented the importance of data adjustment for surveys with poor data quality, and how poor quality can mask important differences and lead to incorrect interpretations. In surveys with minimal measurement error, the use of the standard method of removing biologically implausible measurements with WHO flags is sufficient to capture and remove outliers caused by human error. However, the use of WHO flags does not adequately remove the overdispersion caused by frequent, random measurement error; which means that prevalence is typically overestimated in surveys with poor quality anthropometry. The present study supports the recommendation to use PROBIT to analyse poor quality anthropometry data. Despite the existing WHO recommendation, the PROBIT method is not often used to re-analyse poor quality child anthropometry. The present study showed that the PROBIT method can make poor quality data useful, helping to identify high-risk populations, meaningfully assess trends and effectively plan service delivery.
Supplementary material
The supplementary material for this article can be found at https://doi.org/10.1017/jns.2022.67.
Acknowledgements
The authors are grateful for Oleg Bilukha for his advice. We would also like to thank our contacts at Namibia Statistics Agency for providing us guidance about the dataset.
M. S. F. and J. C. designed the research and analysed the data. M. S. F. and J. C. wrote the manuscript. M. J. and M. V. W. supervised overall content. M. S. F. had primary responsibility for final content. All authors contributed to the editing and read and approved the final manuscript.
The authors declare that they have no conflicts of interest.


 Open access