


I. Introduction
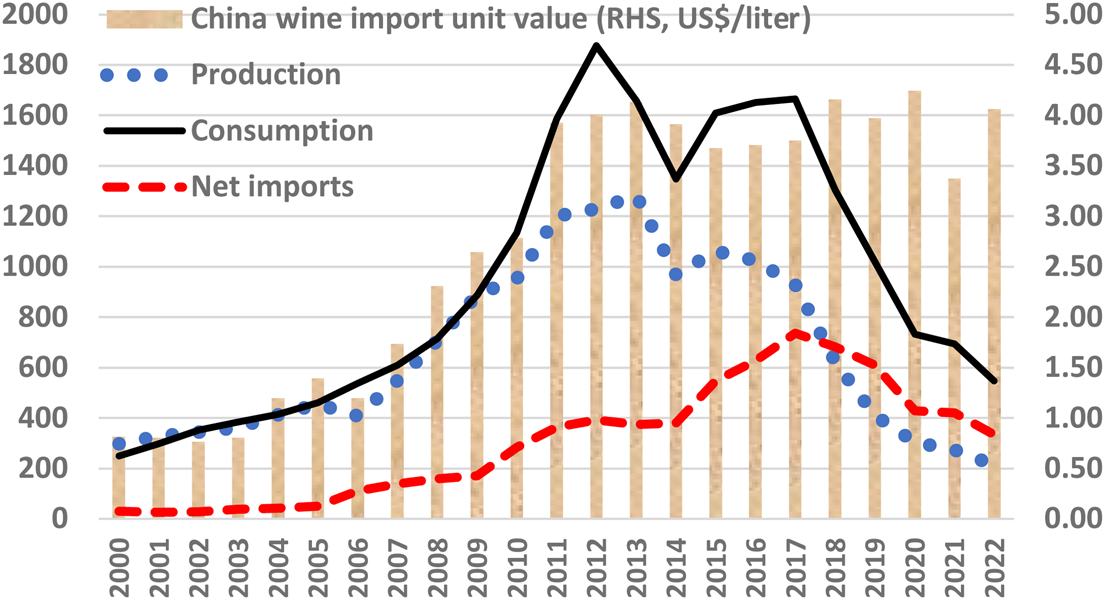
China has been one of the most important sources of growth in global wine demand this century (Anderson and Wittwer, Reference Anderson and Wittwer2015; Anderson, Reference Anderson2020). It accounted in volume terms for 7.5% of the world's wine consumption by 2012 and 7–8% of global imports by 2017, four-plus times its 2005 shares (Anderson and Pinilla, Reference Anderson, Pinilla and Holmes2021). That market has since plummeted (Figure 1). This article brings together disparate data to explore the extent of that demise and speculate on the reasons behind it.
China's wine production, consumption, and net import volumes, and average price of imports, 2000 to 2022 (ML and current U.S.$/liter).
Source: See Table A1 in the Appendix.
All wine-exporting countries have an interest in this development, but especially Australia because (a) it was by far the most exposed to that market, accounting for two-fifths of the value of its wine exports in the late 2010s, and (b) it was hit in late 2020 by a set of punitive tariffs of up to 218% on China's imports of Australian wines.Footnote 1 That bilateral trade flow—worth around U.S.$750 million per year—virtually disappeared in 2021. Some Australian exporters found markets elsewhere as other countries expanded their wine exports to China, but global exports of wine were projected (using the Wittwer and Anderson (Reference Wittwer and Anderson2020) model of global beverage markets) to fall by more than U.S.$200 million and Australia's average producer prices of grapes and wine to fall by 11–12% as a consequence of that tariff shock (Wittwer and Anderson, Reference Wittwer and Anderson2021a), and more so for reds because China's wine imports are more than 80% red.
With ministerial meetings being renewed between Australia and China in mid-2023, there is speculation as to whether China might soon remove its high tariff on Australian wine. Many imagine that if it did, that would see an immediate reduction in the excessive stocks of red wine that are accumulating in Australia as a consequence of that tariff (see Wine Australia, 2022) and an eventual rebuilding of the country's total wine exports. However, even if those punitive tariffs were to be removed this year, trade with China is likely to become only a fraction of what it was in the late 2010s, thanks to the recent shrinkage in the overall wine market in China—something that was exacerbated by COVID-19 and the associated slowdown in China's income growth (Wittwer and Anderson, Reference Wittwer and Anderson2021b), but which began several years before that pandemic. Furthermore, the shrinkage is continuing even though China's COVID lockdowns ceased in late 2022: according to official data, China's wine imports in January–April 2023 were down 31% by volume and 21% by U.S.$ value on the year before.
This article begins by explaining the uncertain nature of wine statistics in China. It then provides various estimates of key indicators of the Chinese wine market to show how much smaller that market has become. It briefly speculates on the reasons behind the downturn and finishes by drawing implications for wine-exporting countries.
II. Wine statistics for China
Compiling statistics on China's wine market is a fraught business. While official trade statistics may be reasonably reliable (apart from unmeasurable smuggling from Hong Kong), annual wine production and consumption estimates vary hugely across sources. Historically, the government's national production statistics relied on provincial government data, but they may well have been inflated for at least two reasons. One is because much of the wine that is imported by China in bulk containers is bottled as is or blended with domestic wine and then sold in bottles labeled “Product of China.” Another reason is that some wine is internally traded between provinces in bulk before being bottled but is counted as output in the source province as well as the destination province—a case of double-counting (Anderson and Harada, Reference Anderson and Harada2018).
The Food and Agriculture Organization of the United Nations (FAO) provided official government wine production statistics up to 1990 but thereafter only its own rounded estimates, the most recent being exactly 2 million tonnes for 2020, which is several times the likely number (FAO, 2023). The International Organization of Vine and Wine (OIV) used to adopt FAO numbers but now generates its own much lower estimates (OIV, 2023). Meanwhile, the National Bureau of Statistics of China (NBSC), which periodically alters its series, now has data for recent years that are considerably lower than even OIV's latest numbers. However, if the OIV production numbers are discounted by the extent of China's bulk wine imports, for the reasons mentioned in the previous paragraph and by Anderson and Harada (Reference Anderson and Harada2018), they come close to the NBSC data (see Table A1 in the Appendix). Hence, the latest NBSC production data are adopted here and, together with UN COMTRADE-based international trade data, are used to estimate China's wine consumption as production plus imports net of exports. That does not take into account changes in stocks, but there are no reliable data on wine stocks in China. Nor are smuggled wine imports from Hong Kong or Macao able to be included in the estimate of China's wine consumption.Footnote 2
III. Wine market shrinkage in China
Based on the data noted previously and the considerations used to generate Table A1, we estimate that China's per capita wine consumption has fallen almost every year since its peak in 2012, and in 2022 it was one-third of that peak. Import volumes also peaked that year, but they have dropped by 55% since 2017. Imports from Australia (the lead supplier) kept rising until 2018, then dropped along with China's total wine imports in 2019 and 2020 before collapsing in 2021. China's local wine production, which began declining after 2013, according to NBSC, continued—and its pace of decline slowed only slightly following the imposition of higher tariffs on Australian wine in late 2020 (Figure 1).
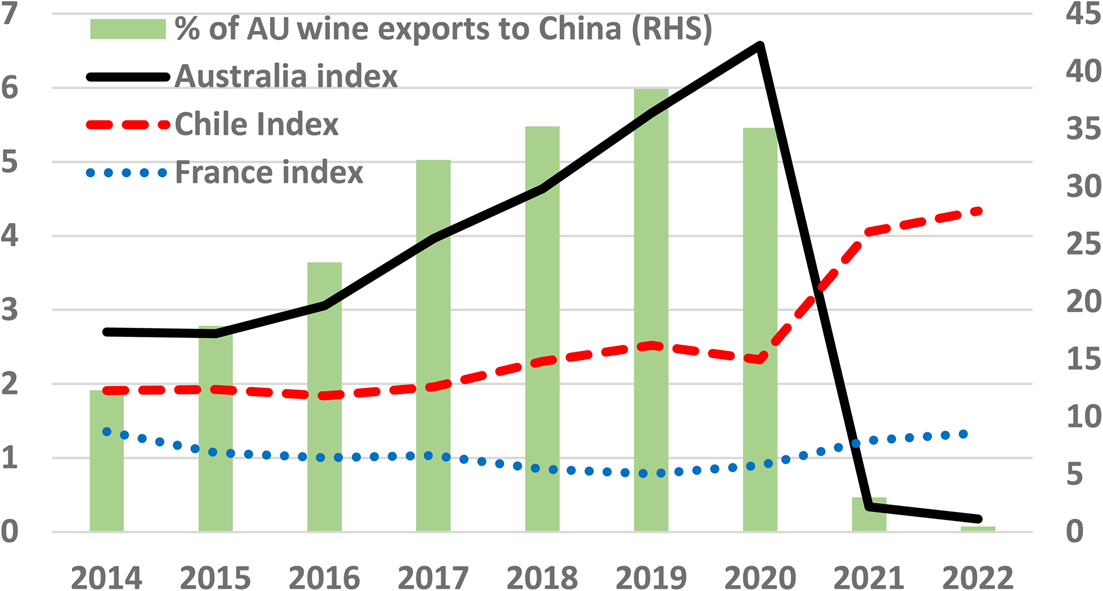
Thus, China's shares of world wine consumption volume and of import volumes and values peaked in 2016–2017, and they have more than halved since then (Table 1). Even so, the share of the value of Australia's wine exports going to China continued to rise and averaged 36% during 2018–2020, or nearly six times China's value share of global wine imports. Other suppliers, by contrast, were much less exposed, including the two next-largest: the share of France's exports going to China remained similar to China's share of world imports, and Chile's remained about twice China's share of world imports, until both exporters’ shares rose in 2021 and 2022 when the punitive tariffs shrunk Australian exports (Figure 2).
Index of intensity of wine exports to China from Australia, Chile, and France,a and share of Australia's wine exports going to China, by value, 2014 to 2022.
Note: aDefined as the value share of a country's wine exports to China divided by China's share of the value of global wine imports.
Source: FAO (2023).
China's shares of world wine production and consumption volumes, and world wine import volume and value, 2000 to 2022 (%)

Sources: Estimated using Part (c) of Table A1 plus earlier and updated global data from Anderson and Pinilla (Reference Anderson, Pinilla and Holmes2021).
Within China, wine's share of total alcohol consumption by 2022 was one-third of its peak in 2012. The COVID-19 disruption accounts for some of that since 2019, with China's overall alcohol consumption in 2022 being 12% below that in 2019. But the fall in consumption between 2019 and 2022 was considerably larger for wine (47%) than for spirits (17%) and beer (3%). As a result, wine's share of alcohol consumption in China fell by two-fifths over those three COVID years, according to the data in Table 2.
Wine's share in the volume of alcohol consumption in China (%), and China's per capita consumption of alcohol by type (liters of alcohol/year),a 2000 to 2022

Note: a Wine is assumed to average 12% alcohol, beer 4.5%, and spirits 40%.
Sources: See Part (c) of Table A1 for wine data; beer and spirits data are from an update of Anderson and Pinilla (Reference Anderson, Pinilla and Holmes2021).
IV. Why the decline?
The decline in China's wine market is due to a combination of short-run/temporary shocks and longer-run structural changes. The two important short-run shocks are COVID and (at least for Australia) the imposition of tariffs on China's wine imports from Australia. The longer-run structural phenomena are possible changes in domestic vignerons’ profitability expectations and consumer preferences in China.
A. Short-run shocks
The severe lockdowns in China aimed at limiting the spread of COVID slowed economic growth and limited socializing and, hence, spending on beverages. It also altered the mix of spending on beverages because, in China, wine is more commonly consumed away from home than beer and spirits. China did not go into recession, but income growth dipped severely in both 2020 and 2022 (Figure 3). Wittwer and Anderson (Reference Wittwer and Anderson2021b) projected that global wine consumption volume might decline by around one-tenth because of COVID. Hence, that may explain some of the decline in China in 2020–2022—but not prior to 2020 and not after 2022, when incomes in China are projected to grow at around 5% through the mid-2020s (World Bank, 2023b).
Real gross national income per capita and its annual growth rate, China, 2000 to 2022 (PPP at constant 2017 international $, and %/year).
Source: World Bank (2023a).

Coinciding with COVID has been the imposition of punitive tariffs on China's wine imports from Australia since the end of 2020. While that has had a large impact on Australian producers, on its own it is estimated to have reduced China's total wine imports by less than 1% because China was able to, and did, source more wine from other wine-exporting countries (Wittwer and Anderson, Reference Wittwer and Anderson2021a, Reference Wittwer and Anderson2021b).
B. Longer-run structural changes
The decline in China's local wine production may be a consequence of new domestic producers disinvesting because their earlier profit expectations were not realized. Given the rapid growth in China's wine production up until the mid-2010s, some of that would have been made from multi-purpose grapes that lead to low-quality wine. Some might also have been made from varieties of winegrapes planted in regions not well suited to them. The production decline might have slowed once the tariff was imposed on imports from Australia had it (a) not coincided with the COVID-driven decline in wine demand and (b) not been possible for other wine-exporting countries to rapidly fill the void left by Australia.
Wine is a normal good in most settings, meaning its national consumption increases as a country's adult population and real income per capita increase unless its price relative to that of substitutes rises (Fogarty, Reference Fogarty2010). One might also expect its share of total alcohol consumption to converge on the global average (Stigler and Becker, Reference Stigler and Becker1977), based on other countries’ experiences (Holmes and Anderson, Reference Holmes and Anderson2017). Thus, the growth to 2013 in China's wine consumption shown in Figure 1 is unsurprising given China's rapid rise in per capita income (Figure 3). But the plateauing and then dramatic decline in consumption since then while incomes continued to grow requires further explanation.
Part of that decline from 2013 (and of the fall in domestic wine production?) may be attributable to the austerity measures introduced by President Xi that frowned upon lavish official dinners and other conspicuous consumption and gift-giving, and more recently that also discouraged consumption of exotic/imported goods. However, the decline in sales volume was much faster for wine than for beer and spirits (Table 2). That suggests there has been either a preference swing against wine (because it is viewed politically as an exotic product?) and/or a greater premiumization of preferences for wine than for beer or spirits (a shift from quantity to quality). The latter is not consistent with the plateauing in the average price of wine imports from 2011 (Figure 1), shortly after which the share of bulk wine in total wine import volumes also plateaued (at around 25%, see Column (4) of Table A1).
V. Implications for wine-exporting countries
These downward trends in China's wine market may reverse a little as incomes recover somewhat following the abandonment in late 2022 of the country's draconian COVID lockdowns. The OECD (2023) and World Bank (2023b) expect China's real GDP growth rate to rise from 3% in 2022 to 5% in the mid-2020s, although more recent forecasts are a little lower. Even if that were to lift consumption, the volume of China's wine imports in the short term is unlikely to become much more than half what it was at its peak.
So if Australia were to be able to claw back its 2018–2020 share of China's wine imports (one-quarter by volume, a little over one-third by value), that would amount to an export increase of not 130 ML or U.S.$750 million per year but perhaps only half those amounts. Even that may be too optimistic as a short-term forecast because numerous Australian wineries that have invested in developing new markets after 2020 may be reluctant to go back to what is now perceived to be a less reliable Chinese market. Selling excess stocks of red wine in bulk to China would provide some relief to tanks in Australia, but both the volume and price may be low: in 2020 and 2021, China imported little more than 100 ML/year in bulk at an average price of just 88¢ U.S. per liter. All this vindicates the move by Australian vignerons since 2020 to diversify their exports to other markets in Asia, North America, and Europe—even though, over the longer term, China's wine market will likely expand as incomes rise and the quality of local production improves and entices more consumers to include wine in their beverage consumption bundle.
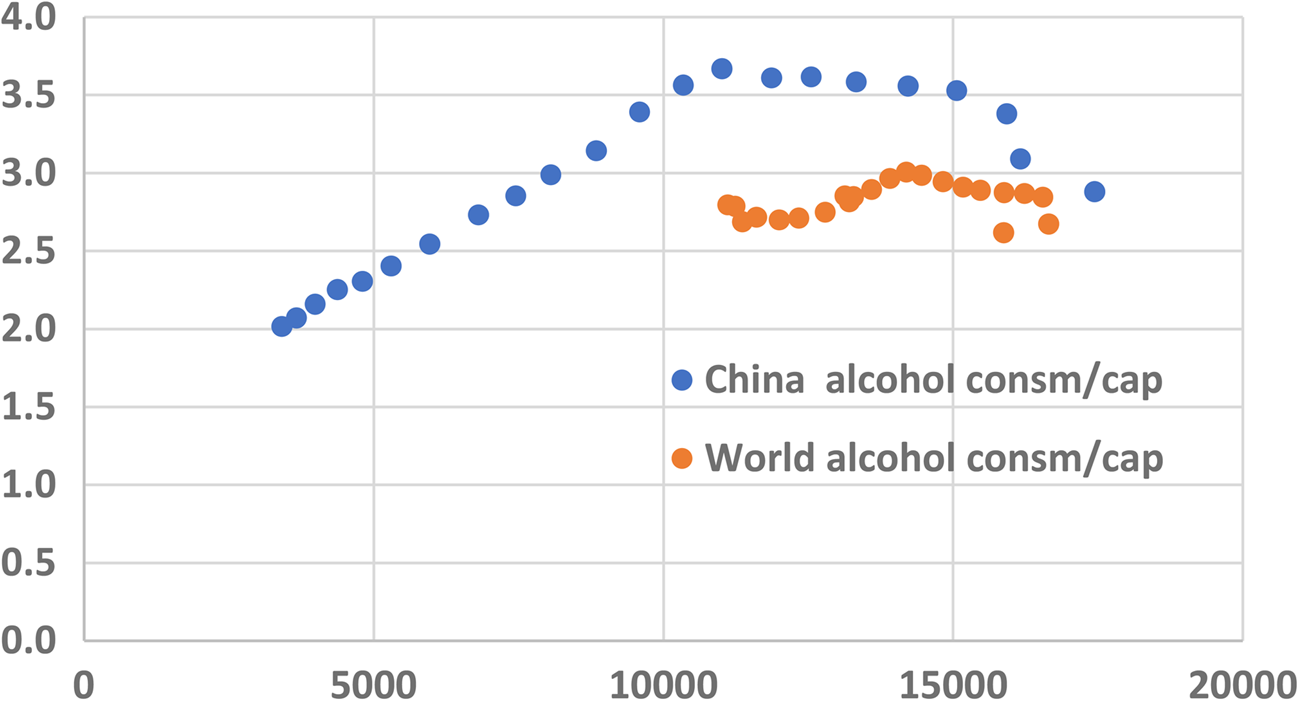
A longer-run expectation of growth in wine demand in China, notwithstanding the projection of slower income growth than in the past two decades, is not unreasonable for two reasons: (a) overall alcohol consumption per capita in China is currently no higher than the rest of the world's at its current per capita income (Figure 4), and (b) wine's share of that consumption was only 4.6% at its peak in 2012 and is now 1.5% (Table 2), in contrast to the global average over the past decade of 13%. Bigger (unknowable) unknowns are how rapidly China might converge on that global average volume share, how much more it might premiumize its wine consumption, and from which countries its imported wine will come.
Real gross national income and total recorded alcohol consumption, per capita, China and the world, 2000 to 2021 (PPP at constant 2017 international $ and liters of alcohol).
Sources: World Bank (2023a) for GNI and Anderson and Pinilla (Reference Anderson, Pinilla and Holmes2021) for alcohol consumption.
Acknowledgments
The author is grateful for helpful journal referee and editor comments, and for financial support from Wine Australia under Research Project UA1803-3-1 and from the University of Adelaide's School of Agriculture, Food & Wine and its Faculty of Arts, Business, Law and Economics. This is an expansion and update of an earlier version with an Australian focus that appeared in the Australian and New Zealand Grapegrower and Winemaker 712: 79–82, May 2023.
Appendix
China's wine production estimates, trade and apparent consumption, 2005 to 2022 (ML, liters, and %)


 Open access