


1. Introduction
Vortex-induced vibration (VIV) of a circular cylinder is a classical fluid mechanics problem involving complex flow–structure interaction, which has attracted extensive fundamental and engineering interests over the past few decades. The fundamentals of VIV have been comprehensively reviewed by, for example, Bearman (Reference Bearman1984), Sarpkaya (Reference Sarpkaya2004), Williamson & Govardhan (Reference Williamson and Govardhan2004), Gabbai & Benaroya (Reference Gabbai and Benaroya2005) and Sumer & Fredsøe (Reference Sumer and Fredsøe2006). In engineering practice, VIV is an important design consideration for cylindrical bluff bodies such as deck and cables of suspended bridges in the medium of air, and offshore pipelines, cables and risers in the medium of water. Because VIV may result in fatigue damage and catastrophic failure of a structure, it is of vital importance to predict the VIV response reliably.
1.1. Problem definition and key parameters
The present study focuses on a canonical yet highly practical two-degree-of-freedom (2-DOF) VIV scenario depicted in figure 1. Under a steadily and uniformly approaching water flow, an elastically mounted rigid circular cylinder is allowed to vibrate in both the in-line (streamwise) and cross-flow (transverse) directions. The origin of the coordinate system is located at the centre of the cylinder at its rest position, and (x, y, z) are Cartesian coordinates in the in-line, cross-flow and spanwise directions, respectively. This VIV system can be described by several non-dimensional parameters listed in table 1. In this study, the structural properties including m, c and k are identical in the in-line and cross-flow directions, so that subscripts x and y are omitted.
The cross-flow vibration amplitude (A* y ) listed in table 1 can be calculated based on several different definitions:
-
(i) The maximum vibration amplitude over the entire statistical time range, which is denoted A* y,max (= y max /D) (e.g. Khalak & Williamson Reference Khalak and Williamson1997a , Reference Khalak and Williamson1999).
-
(ii) The mean value of the largest 10 % amplitude peaks over the statistical time range, which is denoted A* y,10 (= y 10/D) (e.g. Govardhan & Williamson Reference Govardhan and Williamson2006; Zhao et al. Reference Zhao, Leontini, Lo Jacono and Sheridan2014). Compared with A* y,max , the A* y,10 value is not dictated by a rare occurrence of y max .
-
(iii) The root-mean-square (RMS) value (y rms ) of the time history of y over the statistical time range (e.g. Khalak & Williamson Reference Khalak and Williamson1999). To facilitate comparison of this definition with A* y,max and A* y,10, the A* y,rms value can be defined as
Non-dimensional parameters describing the VIV system, where m is mass of the cylinder, m
d
is mass of displaced water, m
a
is added mass, c is damping coefficient, k is spring stiffness, U is free-stream velocity, D is cylinder diameter, ν is kinematic viscosity of the fluid, $f_{nw}$
(=
$f_{nw}$
(= $\sqrt{k/(m+m_{a})}/2\pi$
) is natural frequency of the system in water, A
x
is vibration amplitude in the in-line direction, A
y
is vibration amplitude in the cross-flow direction, f
x
is vibration frequency in the in-line direction, f
y
is vibration frequency in the cross-flow direction, F
x
and F
y
are drag and lift forces in the in-line and cross-flow directions, respectively, ρ is fluid density and L
z
is spanwise length of the cylinder. According to Jauvtis & Williamson (Reference Jauvtis and Williamson2004), a fixed C
A
of 1.0 is used.
$\sqrt{k/(m+m_{a})}/2\pi$
) is natural frequency of the system in water, A
x
is vibration amplitude in the in-line direction, A
y
is vibration amplitude in the cross-flow direction, f
x
is vibration frequency in the in-line direction, f
y
is vibration frequency in the cross-flow direction, F
x
and F
y
are drag and lift forces in the in-line and cross-flow directions, respectively, ρ is fluid density and L
z
is spanwise length of the cylinder. According to Jauvtis & Williamson (Reference Jauvtis and Williamson2004), a fixed C
A
of 1.0 is used.

Schematic diagram of an elastically mounted rigid circular cylinder free to vibrate in both the in-line and cross-flow directions.

 \begin{equation} A^{*}_{y,\textit{rms}}=\frac{\sqrt{2}y_{\textit{rms}}}{D}=\frac{\sqrt{2}\times \sqrt{\frac{1}{N}\sum\limits_{i=1}^{N}{y}_{i}^{2}}}{D}. \end{equation}
By including $\sqrt{2}$
in the numerator of (1.1), a time-periodic time history of y would give A*
y,rms
= A*
y,max
= A*
y,10. For a quasi-periodic time history of y from a turbulent flow, A*
y,max
points out the largest/extreme amplitude, A*
y,10 is representative of relatively large amplitudes, while A*
y,rms
measures the overall response.
$\sqrt{2}$
in the numerator of (1.1), a time-periodic time history of y would give A*
y,rms
= A*
y,max
= A*
y,10. For a quasi-periodic time history of y from a turbulent flow, A*
y,max
points out the largest/extreme amplitude, A*
y,10 is representative of relatively large amplitudes, while A*
y,rms
measures the overall response.
For the in-line vibration amplitude (A*
x
), the above-mentioned three types of definition can also be used, but the mean offset of the x signal over the statistical time range (denoted $\overline{x}$
) should be subtracted from the x signal first. Based on the time history of (
$\overline{x}$
) should be subtracted from the x signal first. Based on the time history of ( $x-\overline{x}$
), the A*
x,max
, A*
x,10 and A*
x,rms
values can be calculated in a similar manner to their counterparts for the y direction.
$x-\overline{x}$
), the A*
x,max
, A*
x,10 and A*
x,rms
values can be calculated in a similar manner to their counterparts for the y direction.
1.2. Literature review on 2-DOF VIV of a circular cylinder
Prior to a literature review on the 2-DOF VIV, it is worth mentioning that significant research efforts have also been devoted to a simplified scenario, namely one-degree-of-freedom (1-DOF) VIV of a circular cylinder restricted to vibrate only in the cross-flow direction (e.g. Khalak & Williamson Reference Khalak and Williamson1996, Reference Khalak and Williamson1997a , Reference Khalak and Williamsonb , Reference Khalak and Williamson1999; Govardhan & Williamson Reference Govardhan and Williamson2000, Reference Govardhan and Williamson2006; Lucor, Foo & Karniadakis Reference Lucor, Foo and Karniadakis2005; Zhao et al. Reference Zhao, Cheng, An and Lu2014; Soti et al. Reference Soti, Zhao, Thompson, Sheridan and Bhardwaj2018; Jiang et al. Reference Jiang, Ju, Zhao, Zhou, Draper, An, Watson, Lei and Wang2024). However, in terms of offshore engineering applications involving VIV of pipelines and cables, the 1-DOF set-up contains certain limitations:
-
(i) Jauvtis & Williamson (Reference Jauvtis and Williamson2004) found that the cross-flow vibration predicted by 1-DOF and 2-DOF set-ups agreed well for m* > 6, whereas significant differences existed for m* < 6. Stappenbelt, Lalji & Tan (Reference Stappenbelt, Lalji and Tan2007) made a similar comparison and reported a critical m* at approximately 10. Therefore, a rationale for the use of the simplified 1-DOF set-up is that the problem of interest has an m* value larger than 6–10. However, typical m* values for offshore pipelines and cables vary between 1.3 and 3.4 (Jiang et al. Reference Jiang, Ju, Zhao, Zhou, Draper, An, Watson, Lei and Wang2024), which suggests that the cross-flow vibration predicted by the simplified 1-DOF set-up is inaccurate.
-
(ii) Another rationale for the use of the simplified 1-DOF set-up is that, in the 2-DOF set-up, the cross-flow response is significantly larger than the in-line response (Jauvtis & Williamson Reference Jauvtis and Williamson2004). Nevertheless, for offshore pipelines where only relatively small vibrations are allowed in practice, the in-line vibration is an important component to be quantified (DNV-RP-F105; Caruso Reference Caruso2021). Specifically, Caruso (Reference Caruso2021) stated that the fatigue capacity of pipeline is mostly dominated by the in-line VIV.
Due to the above-mentioned limitations associated with the simplified 1-DOF set-up, it is necessary to employ the 2-DOF set-up to predict the VIV response of an offshore pipe.
The 2-DOF VIV of a circular cylinder has also been studied extensively in the literature. Among which, the remainder of this study focuses on the following conditions:
-
(i) m* < 5, which is relevant to offshore pipelines, cables and risers in the medium of water,
-
(ii) Re in the turbulent regime (Re ≳ 103), which is the case for most engineering problems, and
-
(iii) same or very similar m and k values in the in-line and cross-flow directions, which is the case for most practical problems (Jauvtis & Williamson Reference Jauvtis and Williamson2004). In contrast, some experimental studies in the literature used noticeably different m and/or k values for the two degrees of freedom, and the VIV response was thus significantly altered (Dahl et al. Reference Dahl, Hover, Triantafyllou, Dong and Karniadakis2007, Reference Dahl, Hover, Triantafyllou and Oakley2010; Assi, Bearman & Kitney Reference Assi, Bearman and Kitney2009; Kang & Jia Reference Kang and Jia2013).
Based on these three conditions, table 2 lists relevant experimental studies on the 2-DOF VIV of a circular cylinder. In physical experiments, it is a common practice to vary V r by varying the free-stream velocity, such that Re is varied accordingly (listed in table 2). The experimental study by Ashrafipour et al. (Reference Ashrafipour, Zeinoddini, Tamimi, Rashki and Jadidi2022) adopted slightly different structural properties (m, ζ and k) in the in-line and cross-flow directions, and their results are also included in table 2. Figure 2 further summarises the VIV response predicted by several experimental studies with similar m* (∼ 2.4–2.6), together with the vibration branches labelled by Jauvtis & Williamson (Reference Jauvtis and Williamson2004), including the SS (streamwise symmetric), AS (streamwise antisymmetric), initial, super-upper, lower and desynchronised branches. Figure 2 shows relatively large discrepancies for the in-line responses predicted by different studies, which is likely because the in-line response is much smaller than the cross-flow response and is thus more difficult to measure accurately. In particular, only Jauvtis & Williamson (Reference Jauvtis and Williamson2004) were able to confidently identify two separate in-line response branches at V r ≲ 4 (i.e. the SS and AS branches). In contrast, these two in-line branches were hardly identified by Franzini et al. (Reference Franzini, Gonçalves, Meneghini and Fujarra2013) and Ashrafipour et al. (Reference Ashrafipour, Zeinoddini, Tamimi, Rashki and Jadidi2022) (figure 2 a), and either unidentified or excluded in other 2-DOF VIV studies (annotated in table 2). For the cross-flow response shown in figure 2(b), discrepancy mainly lies in the lower branch, where only Jauvtis & Williamson (Reference Jauvtis and Williamson2004) presented a relatively stable lower branch (over V r ∼ 8–10).
Experimental studies on the 2-DOF VIV of a circular cylinder.

High-fidelity numerical studies on the 2-DOF VIV of a circular cylinder.

The VIV response predicted by several experimental studies with m* ∼ 2.4–2.6: (a) in-line vibration amplitude; (b) cross-flow vibration amplitude.

The VIV response predicted by several high-fidelity numerical studies with m* ∼ 2.6: (a) in-line vibration amplitude; (b) cross-flow vibration amplitude.

Table 3 lists relevant high-fidelity numerical studies on the 2-DOF VIV of a circular cylinder. The numerical methods included direct numerical simulation (DNS), large-eddy simulation (LES) and detached-eddy simulation (DES), where the latter is a hybrid model combining both high-fidelity LES and low-fidelity Reynolds-averaged Navier–Stokes (RANS) model. For high-fidelity methods, it is a common practice to fix the Re value (see table 3) so as to eliminate the influence of Re. The numerical studies listed in table 3 all chose m* ∼ 2.6 and performed validation against the experimental results by Jauvtis & Williamson (Reference Jauvtis and Williamson2004), as reproduced in figure 3. Based on figure 3, several conclusions on the numerical validation can be drawn.
-
(i) The numerical studies listed in table 3 did not focus on the SS, AS and initial branches in figure 3(a). For each study, only one data point was assigned to V r < 4, which was unable to reveal the first two in-line response branches. The V r range over the initial branch also contained at most one data point, and the variation trends in Gsell, Bourguet & Braza (Reference Gsell, Bourguet and Braza2016) and Nguyen & Nguyen (Reference Nguyen and Nguyen2016) were significantly different, which cannot help identify the V r range (or even the existence) of the initial branch.
-
(ii) The largest amplitude in the super-upper branch appears to be a major focus of previous numerical studies. Specifically, the super-upper branch predicted by Nguyen & Nguyen (Reference Nguyen and Nguyen2016) and Pastrana et al. (Reference Pastrana, Cajas, Lehmkuhl, Rodríguez and Houzeaux2018) agreed well with the experimental results by Jauvtis & Williamson (Reference Jauvtis and Williamson2004). Verma & De (Reference Verma and De2022) did not capture the super-upper branch, and they attributed this discrepancy to the use of a relatively small Re of 1000 in their study.
-
(iii) Beyond the super-upper branch, all numerical studies were able to capture a relatively stable lower branch, which implies that the experimental results by Jauvtis & Williamson (Reference Jauvtis and Williamson2004) may outperform other experimental results (which did not capture a relatively stable lower branch; see figure 2 b).
-
(iv) Beyond the lower branch, Pastrana et al. (Reference Pastrana, Cajas, Lehmkuhl, Rodríguez and Houzeaux2018) and Verma & De (Reference Verma and De2022) observed a transition to desynchronisation, whereas Gsell et al. (Reference Gsell, Bourguet and Braza2016) and Nguyen & Nguyen (Reference Nguyen and Nguyen2016) did not. Gsell et al. (Reference Gsell, Bourguet and Braza2016) attributed this discrepancy to the use of ζ = 0 in their DNS whereas ζ = 0.0036 in Jauvtis & Williamson (Reference Jauvtis and Williamson2004), but this argument contradicts the results by Pastrana et al. (Reference Pastrana, Cajas, Lehmkuhl, Rodríguez and Houzeaux2018) and Verma & De (Reference Verma and De2022) where ζ = 0 was also used.
In addition to the high-fidelity methods, low-fidelity RANS models have also been widely used in the literature, owing to their much lower computational cost than that of the high-fidelity methods. Nevertheless, RANS models cannot predict flow separation on the cylinder accurately, such that the numerical results may be significantly affected. For example, Jiang et al. (Reference Jiang, Ju, Zhao, Zhou, Draper, An, Watson, Lei and Wang2024) reviewed RANS studies on 1-DOF VIV of a circular cylinder and found that the RANS models were unable to predict both amplitude and frequency responses accurately. For the 2-DOF VIV of a circular cylinder, nearly all RANS studies considered m* = 2.6 and performed validation against Jauvtis & Williamson (Reference Jauvtis and Williamson2004). The RANS studies may reproduce the super-upper, lower and desynchronised branches relatively well (e.g. Zhao & Cheng Reference Zhao and Cheng2011; Xu et al. Reference Xu, Wu, Jia and Wang2021; Fu et al. Reference Fu, Fu, Zhang, Han, Ren, Xu and Zhao2022; Wang & Zhao Reference Wang and Zhao2023), but to the best knowledge of the authors, none of the RANS studies were able to identify the SS, AS and initial branches.
1.3. Motivation of the present study
Overall, for the scenario of 2-DOF VIV of a circular cylinder, the super-upper, lower and desynchronised branches have been relatively well studied in the literature. In particular, abundant experimental and numerical results are available at m* ∼ 2.6 (figures 2 and 3). In contrast, the SS, AS and initial branches have been much less and inadequately studied in the literature. In particular, among all published experimental and numerical studies, only Jauvtis & Williamson (Reference Jauvtis and Williamson2004) identified two separate in-line response peaks for the SS and AS branches. Nevertheless, their SS branch was inferred by merely two data points (figure 2 a) and was somewhat different from the response curve given by the design guideline DNV-RP-F105, which still warrants further examination. The inadequate examination of the SS, AS and initial branches in the literature may be due to the following reasons.
-
(i) The first three branches existed over a relatively small range of V r and were tested at the lowest velocity range of the experimental facility, such that the experimental uncertainties were relatively large and impeded accurate measurement.
-
(ii) For high-fidelity numerical studies, prohibitive computational cost was a reason why the first three branches could not be mapped out with a sufficient resolution in V r .
-
(iii) The first three branches displayed relatively small vibration amplitudes, which received much less attention compared with the large amplitude in the super-upper branch (figures 2 and 3).
Nevertheless, according to DNV-RP-F105 and Caruso (Reference Caruso2021), a major design consideration for subsea pipeline is to accurately quantify the small vibrations, including the SS and AS branches for the in-line response and V r corresponding to A* y = 0.15, which is defined as the onset of cross-flow VIV in DNV-RP-F105. An accurate quantification of these small vibrations is perhaps more important than an accurate quantification of the large cross-flow response, because large vibration of a pipeline is simply not allowed in practice (Caruso Reference Caruso2021).
The inadequate study yet vital importance of the small-amplitude SS and AS branches form a major motivation of the present study. Owing to a rapid increase in computing power in recent years, high-fidelity LES has become possible. In this study, a series of 20 LES cases were performed at a relatively large Re = 104, m* = 2.6, ζ = 0.0032 and various V r (= 1.13–14.70) covering all 2-DOF VIV branches. The present Re was the same as that used in a recent 1-DOF VIV study by the authors (Jiang et al. Reference Jiang, Ju, Zhao, Zhou, Draper, An, Watson, Lei and Wang2024), where several reasons for the choice of this Re were given. The present m* and ζ were almost equal to those used by Jauvtis & Williamson (Reference Jauvtis and Williamson2004), such that detailed numerical validation could be performed against their experimental results. Among the 20 LES cases, 11 cases were assigned to V r ≤ 4.52, which helped to reveal separate SS and AS branches numerically for the first time. After validating the present VIV response against Jauvtis & Williamson (Reference Jauvtis and Williamson2004) and DNV-RP-F105, the detailed LES datasets enable further analysis of new VIV characteristics and physical mechanisms that have not been explored previously.
2. Numerical model
2.1. Numerical method
The numerical method for the present 2-DOF VIV of a circular cylinder followed that used in a recent 1-DOF VIV study by the authors (Jiang et al. Reference Jiang, Ju, Zhao, Zhou, Draper, An, Watson, Lei and Wang2024). Specifically, OpenFOAM (www.openfoam.com) was used to perform the three-dimensional LES. The governing equations for the flow were filtered continuity and incompressible Navier–Stokes equations, while the cylinder motion was considered by the arbitrary Lagrangian–Eulerian scheme:
 \begin{equation} \frac{\partial \overline{u}_{i}}{\partial x_{i}}=0, \end{equation}
 \begin{equation} \frac{\partial \overline{u}_{i}}{\partial t}+\left(\overline{u}_{\!j}-u_{\!j,\textit{mesh}}\right)\frac{\partial \overline{u}_{i}}{\partial x_{\!j}}=-\frac{1}{\rho }\frac{\partial \overline{p}}{\partial x_{i}}+\nu \frac{\partial ^{2}\overline{u}_{i}}{\partial x_{\!j}\partial x_{\!j}}-\frac{\partial \tau _{\textit{ij}}}{\partial x_{\!j}}, \end{equation}
where (x 1, x 2, x 3) = (x, y, z) are Cartesian coordinates, u i is the velocity component in the direction x i , t is time, u i,mesh is the velocity component of the mesh element in the direction x i , p is pressure and τ ij is the subgrid-scale stress tensor. The overbar in (2.1) and (2.2) denotes a filtered quantity. The deviatoric part of τ ij is
 \begin{equation} \tau _{\textit{ij}}-\frac{1}{3}\tau _{kk}\delta _{\textit{ij}}=-2\nu _{t}\overline{S}_{\textit{ij}}, \end{equation}
where $\overline{S}_{\textit{ij}}$
is the rate-of-strain tensor, written as
$\overline{S}_{\textit{ij}}$
is the rate-of-strain tensor, written as
 \begin{equation} \overline{S}_{\textit{ij}}=\frac{1}{2}\left(\frac{\partial \overline{u}_{i}}{\partial x_{\!j}}+\frac{\partial \overline{u}_{\!j}}{\partial x_{i}}\right)\! , \end{equation}
and ν t is the turbulent eddy viscosity, which was calculated by the wall-adapting local eddy-viscosity turbulence model (Nicoud & Ducros Reference Nicoud and Ducros1999):
 \begin{equation} \nu _{t}=\big(C_{w}V^{1/3}\big)^{2}\frac{\big({S}_{\textit{ij}}^{d}{S}_{\textit{ij}}^{d}\big)^{3/2}}{\left(\overline{S}_{\textit{ij}}\overline{S}_{\textit{ij}}\right)^{5/2}+\big({S}_{\textit{ij}}^{d}{S}_{\textit{ij}}^{d}\big)^{5/4}} , \end{equation}
where $C_{w}$
= 0.325 is the model constant, V is the volume of a cell and
$C_{w}$
= 0.325 is the model constant, V is the volume of a cell and ${S}_{\textit{ij}}^{d}$
is the traceless symmetric part of the square of the velocity gradient tensor, which is calculated as
${S}_{\textit{ij}}^{d}$
is the traceless symmetric part of the square of the velocity gradient tensor, which is calculated as
 \begin{equation} {S}_{\textit{ij}}^{d}=\frac{1}{2}\big({\overline{g}}_{\textit{ij}}^{2}+{\overline{g}}_{\textit{ji}}^{2}\big)-\frac{1}{3}\delta _{\textit{ij}}{\overline{g}}_{kk}^{2}, \end{equation}
where
 \begin{equation} \overline{g}_{\textit{ij}}=\frac{\partial \overline{u}_{i}}{\partial x_{\!j}}, \end{equation}
 \begin{equation} {\overline{g}}_{\textit{ij}}^{2}=\overline{g}_{\textit{ik}}\overline{g}_{\textit{kj}}. \end{equation}
The governing equations were solved by the finite volume method and PISO (pressure implicit with splitting of operators) algorithm (Issa Reference Issa1986). The convection, diffusion and time derivative terms were discretised, respectively, using a blended second-/first-order linear upwind scheme, a second-order linear scheme and a blended scheme consisting of a second-order Crank–Nicolson scheme and a first-order Euler implicit scheme.
The governing equations for the structural vibration in the x and y directions were
 \begin{equation} m\ddot{x}+c\dot{x}+kx=F_{x}, \end{equation}
 \begin{equation} m\ddot{y}+c\dot{y}+ky=F_{\!y}, \end{equation}
where double dots and single dot denote acceleration and velocity, respectively. Equations (2.9) and (2.10) were solved by the Newmark-β method. After an update of the cylinder location, the mesh elements moved according to the Laplace operator:
 \begin{equation} \boldsymbol{\nabla }\left(\gamma \boldsymbol{\nabla }\boldsymbol{S}\right)=0, \end{equation}
where $\boldsymbol{S}$
is the displacement matrix of the mesh elements. The mesh diffusivity
$\boldsymbol{S}$
is the displacement matrix of the mesh elements. The mesh diffusivity $\gamma$
is defined as
$\gamma$
is defined as
 \begin{equation} \gamma =\frac{1}{d_{\textit{cyl}}}, \end{equation}
where d cyl is the distance from each cell centre to the cylinder surface. Equation (2.12) ensured that the mesh elements close to the cylinder did not display excessive deformation.
2.2. Computational details
The computational domain and mesh for the present three-dimensional LES of 2-DOF VIV are the same as those used in a recent 1-DOF VIV study by the authors (Jiang et al. Reference Jiang, Ju, Zhao, Zhou, Draper, An, Watson, Lei and Wang2024). Specifically, a circular computational domain with radius r = 30D was used in the x–y plane (figure 4). For the inlet boundary at r = 30D and x< 0, a uniform velocity u x = U was specified, while the pressure followed a zero-gradient Neumann condition. For the outlet boundary at r = 30D and x> 0, the Neumann condition was used for the velocity, while the pressure was set to a reference value of zero. On the cylinder surface at r = 0.5D, a no-slip condition was applied, i.e. the fluid velocity on the cylinder surface equalled the vibrating velocity of the cylinder, while the pressure followed a zero-gradient Neumann condition. At the two lateral boundaries perpendicular to the spanwise direction, a periodic boundary condition was used.
(a) Computational mesh in the x–y plane and (b) a close-up view of the mesh around the cylinder (Jiang et al. Reference Jiang, Ju, Zhao, Zhou, Draper, An, Watson, Lei and Wang2024).

Figure 4 also shows the computational mesh in the x–y plane. At the cylinder surface, the height of the first layer of cells was 1 × 10⁻⁴ D, which resulted in non-dimensional wall distance y + < 0.25 for Re = 104. For the entire domain, the cell expansion ratio was kept below 1.08. The cell numbers in the radial and circumferential directions were 377 and 464, respectively. Along the spanwise direction, 120 layers of mesh elements were used over the spanwise domain length L z = 3D. The total number of cells was 377 × 464 × 120 = 20 991 360.
Based on the above-mentioned baseline mesh and a globally refined mesh with 1.54 times the total cell number, Jiang et al. (Reference Jiang, Ju, Zhao, Zhou, Draper, An, Watson, Lei and Wang2024) reported a mesh convergence study for the 1-DOF VIV of a circular cylinder with Re = 104, m* = 2.4 and V r = 5.69 and 9.10, which were typical cases in the upper and lower branches, respectively. The adequacy of the baseline mesh was demonstrated by a close agreement in the amplitude and frequency responses and hydrodynamic coefficients computed by the two meshes. In addition to the mesh convergence study, Jiang et al. (Reference Jiang, Ju, Zhao, Zhou, Draper, An, Watson, Lei and Wang2024) also reported numerical validation of (i) the mean flow and hydrodynamic characteristics of flow past a stationary cylinder at Re = 104 and (ii) the 1-DOF VIV characteristics of a circular cylinder with Re = 104, m* = 2.4 and V r across all VIV branches. The close agreement between the numerical results and the experimental results by Khalak & Williamson (Reference Khalak and Williamson1997a , Reference Khalak and Williamson1999) and Zhao et al. (Reference Zhao, Leontini, Lo Jacono and Sheridan2014) provided strong confidence to the quality of the present 2-DOF VIV simulations.
For each of the present 2-DOF VIV cases, the simulation started independently from a fully developed instantaneous flow field obtained from the case of flow past a stationary cylinder at Re = 104. A time-step size Δt* (= ΔtU/D) of 8 × 10⁻⁴ was used, which generally satisfied a Courant–Friedrichs–Lewy (CFL) limit of 1.0. On average, each simulation was performed for ∼ 520 non-dimensional time units (denoted t* = tU/D), and the last ∼ 390 time units of the fully developed flow were used for the statistics. By using 256 processors for parallel computation, each simulation took ∼ 100 days of wall-clock time to complete. The total computational cost for the 20 cases computed in this study was approximately 12.3 million core hours (excluding additional cases in § 2.3 on the numerical convergence), which was a significant amount.
2.3. Numerical convergence
First, the adequacy of the computational mesh resolution is examined. Based on the baseline mesh introduced in § 2.2, two variation meshes were constructed. Variation mesh 1 considered a refinement of the spanwise mesh resolution by increasing the number of spanwise mesh layers from 120 to 180, such that the total number of cells was 1.5 times that of the baseline mesh. Variation mesh 2 considered a refinement of the mesh resolution in the x–y plane by increasing the number of cells in both the x and y directions to 1.24 times that of the baseline mesh, such that the total number of cells was also ∼ 1.5 times that of the baseline mesh. For variation mesh 2, the time-step size was also reduced from Δt* = 8 × 10⁻⁴ to 6.25 × 10⁻⁴, so as to meet the same CFL limit, and thus the computational cost for variation mesh 2 was almost twice that for the baseline mesh.
In this section, variation meshes 1 and 2 were tested at V r = 3.39 and 5.65, which were representative cases in the AS and super-upper branches, respectively. Table 4 summarises several key parameters on the cylinder vibration and hydrodynamic coefficients computed by the baseline and variation meshes. The relatively close agreement between the results computed by the baseline and variation meshes suggested that the baseline mesh was suitable for the main body of this study.
Mesh dependence check for several different V r values.

Second, the adequacy of L z /D = 3 for the present simulations is analysed. For the case of flow past a stationary cylinder over Re = 400–3900, Jiang & Cheng (Reference Jiang and Cheng2021) demonstrated based on LES results with both L z /D = 3 and 6 that ‘L z /D = 3 is adequate for Re = 2500–3900’. Since the spanwise wavelength of the streamwise vortices decreases with increase in Re (Gsell, Bourguet & Braza Reference Gsell, Bourguet and Braza2018), L z /D = 3 is considered also adequate for Re> 3900. For a cylinder subjected to 2-DOF VIV, Gsell et al. (Reference Gsell, Bourguet and Braza2018) showed that the spanwise wavelength of the streamwise vortices is comparable to that of a stationary cylinder, such that the choice of L z for a stationary cylinder may be transferable to a vibrating cylinder.
Furthermore, direct evidence for the adequacy of L z /D = 3 was provided by additional simulations with an extended L z /D = 4.5 at V r = 3.39, 5.65 and 10.17, which were representative cases in the AS, super-upper and lower branches, respectively. For L z /D = 4.5, 180 layers of mesh elements were used, such that the spanwise mesh resolution was unchanged. Table 4 lists the LES results computed with L z /D = 4.5, which agreed well with those computed with L z /D = 3. Therefore, L z /D = 3 was used for the main body of this study.
Third, the appropriateness of the mesh diffusivity model given in (2.12) was evaluated by testing another model expressed as
 \begin{equation} \gamma =\frac{1}{{d}_{\textit{cyl}}^{2}}. \end{equation}
Compared with the mesh diffusivity model given in (2.12), (2.13) resulted in diminished mesh deformation close to the cylinder. Based on the mesh diffusivity model in (2.13), the present LES results for V r = 3.39 and 5.65 are also summarised in table 4. Relatively close agreement is observed between the results computed by these two mesh diffusivity models.
The VIV response across all VIV branches: (a) in-line vibration amplitude, (b) cross-flow vibration amplitude and (c) vibration frequency. In (c), the diagonal dashed line shows the Strouhal number St 0 = 0.197 for the case of flow past a stationary cylinder at Re = 10 000.

3. Results and discussion
3.1. Amplitude response
As an overview of the VIV response, figure 5(a,b) shows the in-line and cross-flow vibration amplitudes (A* x and A* y ) calculated based on the three types of definition introduced in § 1.1, where A max > A 10 > A rms . The experimental results by Jauvtis & Williamson (Reference Jauvtis and Williamson2004) are also plotted in figure 5(a,b). However, Jauvtis & Williamson (Reference Jauvtis and Williamson2004) did not specify in their study which definition of the vibration amplitude they used. Therefore, we present different types of definition for the present LES results, so as to better compare with the experimental results by Jauvtis & Williamson (Reference Jauvtis and Williamson2004). Overall, both in-line and cross-flow amplitude responses predicted by the present LES agree well with those measured by Jauvtis & Williamson (Reference Jauvtis and Williamson2004), and more details are discussed below.
For the in-line response shown in figure 5(a), the experimental results by Jauvtis & Williamson (Reference Jauvtis and Williamson2004) revealed three peak regions at V r = 1.9–2.5, 2.5–3.9 and 5.0–8.3, which are termed SS, AS and super-upper branches, respectively. For the region between the AS and super-upper branches, A* x is relatively small, and Jauvtis & Williamson (Reference Jauvtis and Williamson2004) termed it an initial branch. However, for the present LES results, the initial branch is almost absent, which is likely due to the Re effect (Re ∼ 4000–5000 for the initial branch in Jauvtis & Williamson (Reference Jauvtis and Williamson2004) whereas Re = 10 000 for the present study). Based on the present in-line response shown in figure 5(a), the initial branch cannot be identified confidently. However, based on the present frequency response shown in figure 5(c), a noticeable jump in frequency between V r = 3.96 and 4.24 suggests that the case V r = 4.24 might belong to the initial branch. Because the V r range for the initial branch may be very small, we refrain from mapping out such detail with excessive resolution in V r , and instead focus on the more important SS and AS amplitude peaks in subsequent analysis.
Without considering the initial branch, the present LES shows three consecutive peak regions over the in-line response, which are marked as inline–I, inline–II and inline–III (super-upper) in figure 5(a). The reason why we name the first two branches inline–I and inline–II, instead of SS and AS used by Jauvtis & Williamson (Reference Jauvtis and Williamson2004), is explained in § 3.2. To the best knowledge of the authors, this is the first numerical study that confirms the existence of three in-line response peaks, originally identified by Jauvtis & Williamson (Reference Jauvtis and Williamson2004) through physical experiments. Other than an overall agreement on the existence of three in-line response peaks, the present LES results differ from the experimental results of Jauvtis & Williamson (Reference Jauvtis and Williamson2004) in that
-
(i) the onset of in-line response (at V r ∼ 1.0) is much smaller than that reported by Jauvtis & Williamson (Reference Jauvtis and Williamson2004) (at V r ∼ 1.9),
-
(ii) the inline–I branch displays a much smaller gradient of growth with V r and
-
(iii) the boundary between the inline–II and inline–III branches (Vr ∼ 4.5) does not coincide with the boundary of either the AS or super-upper branch identified by Jauvtis & Williamson (Reference Jauvtis and Williamson2004), but sits in the middle of the initial branch.
Nevertheless, in terms of the above-mentioned three discrepancies, the present results agree very well with the response curve given by DNV-RP-F105 (calculated with ζ = 0.0032 and without considering safety factors for engineering conservatism), which adds credibility to the present results. It is noted that DNV-RP-F105 considers the inline–I and inline–II branches as a whole (for ease of use in engineering design), without giving the sharp drop in A* x between the inline–I and inline–II branches.
At the transition between the super-upper and lower branches, Jauvtis & Williamson (Reference Jauvtis and Williamson2004) observed a hysteresis loop, as shown by the existence of two A* x values over V r = 7.9–8.3. For the present LES, each case is started independently from an initial condition of zero vibration, such that the transition should occur at the lower bound of the hysteresis range, which is indeed the case in figure 5(a).
Frequency spectra of (a) x* and (b) y* for the cases in the super-upper and lower branches.

In the lower branch, the A* x,max values are much larger than A* x,10 and A* x,rms . This is because in the lower branch, the time history of the in-line displacement x* (presented in figure 17 a in Appendix A) displays low-frequency modulation, where x* may build up over several vibration periods to reach an extremely large value. In this case, the A* x,max values obtained in figure 5(a) are somewhat arbitrary. Figure 17(a) also shows the second A* x,max over the lower branch, which is obtained after removing one period of low-frequency modulation containing the occurrence of x max . The second A* x,max values are significantly decreased and are much closer to A* x,10 and A* x,rms . Considering the large difference between the A* x,max and the second A* x,max over the lower branch, it may not be a good choice to quantify the in-line vibration amplitude using the A* x,max definition. For the A* x,10 and A* x,rms definitions, it is unclear which definition was used by Jauvtis & Williamson (Reference Jauvtis and Williamson2004) in figure 5(a), and thus a direct comparison between the present LES results and the experimental results by Jauvtis & Williamson (Reference Jauvtis and Williamson2004) cannot be made. Assuming that the A* x,rms definition was used by Jauvtis & Williamson (Reference Jauvtis and Williamson2004), the agreement between the present LES and Jauvtis & Williamson (Reference Jauvtis and Williamson2004) over the super-upper and lower branches appears fairly good. Assuming that the A* x,10 definition was used by Jauvtis & Williamson (Reference Jauvtis and Williamson2004), the present results become larger than those predicted by Jauvtis & Williamson (Reference Jauvtis and Williamson2004), which may result from the use of a constant Re (= 10 000) for the present study whereas varying Re (= 2000–13 500) for Jauvtis & Williamson (Reference Jauvtis and Williamson2004). At V r ∼ 10 where both studies used Re ∼ 10 000, the agreement appears fairly good.
The phenomenon of low-frequency modulation in the lower branch can be picked up by the fast Fourier transform of the time history of x*. Figure 6 shows the frequency spectra of x* and y* for several V
r
in the super-upper and lower branches. The frequency spectra are normalised by $\sqrt{2}$
times the RMS value of the signal. In this way, the normalised value is unaffected by the absolute value of the signal (which may vary significantly from case to case) and reveals more clearly the relative strengths of the frequency peaks. In figure 6(b), the frequency spectra of y* display a sharp peak at the cylinder vibration frequency f
y
. Correspondingly, the frequency spectra of x* shown in figure 6(a) display a sharp peak at 2f
y
, which is expected. In addition, a low frequency (denoted f
low
) of the order of 10−1 × (2f
y
) is observed for the cases in the lower branch, which corresponds to the low-frequency modulation shown in Appendix A. At V
r
= 7.91, the strong f
low
peak (figure 6
a) also gives rise to two minor frequency peaks (f
y
± f
low
) at the two sides of f
y
in figure 6(b). Although the frequency peaks (f
y
± f
low
) are small in amplitude, an identification of their physical origin is important. This is because in figure 10 we found that at V
r
= 7.91 the frequency peak (f
y
+ f
low
) coincides with the vortex-shedding frequency for a stationary cylinder (denoted St
0), and based on the above analysis we can conclude that this is simply a coincidence, rather than a desynchronisation similar to the case of V
r
= 14.70, although the frequency spectra for V
r
= 7.91 and V
r
= 14.70 both show a noticeable peak at St
0 (figure 10
a,b).
$\sqrt{2}$
times the RMS value of the signal. In this way, the normalised value is unaffected by the absolute value of the signal (which may vary significantly from case to case) and reveals more clearly the relative strengths of the frequency peaks. In figure 6(b), the frequency spectra of y* display a sharp peak at the cylinder vibration frequency f
y
. Correspondingly, the frequency spectra of x* shown in figure 6(a) display a sharp peak at 2f
y
, which is expected. In addition, a low frequency (denoted f
low
) of the order of 10−1 × (2f
y
) is observed for the cases in the lower branch, which corresponds to the low-frequency modulation shown in Appendix A. At V
r
= 7.91, the strong f
low
peak (figure 6
a) also gives rise to two minor frequency peaks (f
y
± f
low
) at the two sides of f
y
in figure 6(b). Although the frequency peaks (f
y
± f
low
) are small in amplitude, an identification of their physical origin is important. This is because in figure 10 we found that at V
r
= 7.91 the frequency peak (f
y
+ f
low
) coincides with the vortex-shedding frequency for a stationary cylinder (denoted St
0), and based on the above analysis we can conclude that this is simply a coincidence, rather than a desynchronisation similar to the case of V
r
= 14.70, although the frequency spectra for V
r
= 7.91 and V
r
= 14.70 both show a noticeable peak at St
0 (figure 10
a,b).
For the cross-flow response shown in figure 5(b), the differences among A* y,max , A* y,10 and A* y,rms are much smaller than those for A* x,max , A* x,10 and A* x,rms shown in figure 5(a), which suggests that the cross-flow vibration is more regular than the in-line vibration. The cross-flow responses represented by the A* y,max , A* y,10 and A* y,rms values all agree well with the cross-flow response reported by Jauvtis & Williamson (Reference Jauvtis and Williamson2004) and the response envelope given by DNV-RP-F105 (without considering safety factors for engineering conservatism). In addition, we identify a small peak at V r ∼ 1.7, which is considered an in-line VIV-induced cross-flow peak, because this region is prior to the monotonic growth of the cross-flow response and cannot be excited by an otherwise 1-DOF VIV. The physical mechanism for this small peak is elucidated in § 3.3 with the aid of the frequency response.
3.2. Vortex-shedding patterns for the inline–I and inline–II branches
The first two peak regions in the in-line response are termed inline–I and inline–II branches in the present study, in contrast to SS and AS branches in Jauvtis & Williamson (Reference Jauvtis and Williamson2004). The terminology by Jauvtis & Williamson (Reference Jauvtis and Williamson2004) is based on the observation of a symmetric (S) pair of vortices over each vibration cycle for the first peak region, whereas an antisymmetric (A) pair of vortices over each vibration cycle for the second peak region. However, the present LES results show that the symmetric vortex-shedding pattern does not cover the entire inline–I branch, as summarised in figure 7. Therefore, the present study did not follow the terminology by Jauvtis & Williamson (Reference Jauvtis and Williamson2004), and instead uses the terms inline–I and inline–II (or IL–I and IL–II for brevity).
In-line response over the inline–I and inline–II branches. The vortex-shedding pattern for each case/branch is labelled with either ‘Symmetric’ or ‘Antisymmetric’.

Specifically, at the beginning of the inline–I branch (e.g. at V r = 1.13), antisymmetric vortex shedding is observed (figure 8 a). This is understandable because at sufficiently small vibration amplitude the vortex-shedding pattern should return to that of a stationary cylinder, namely alternate/antisymmetric shedding of two vortices over a vortex-shedding period. Close to the end of the inline–I branch (e.g. at V r = 2.83), antisymmetric vortex shedding is also observed (figure 8 c). In the experimental study by Jauvtis & Williamson (Reference Jauvtis and Williamson2004), the use of only two data points in the inline–I branch (figure 5 a) may be the reason why they missed out the antisymmetric vortex-shedding pattern close to the two ends of the inline–I branch.
Instantaneous span-averaged spanwise vorticity fields for (a) V r = 1.13, (b) V r = 2.26, (c) V r = 2.83 and (d) V r = 3.39. The rotation of the spanwise vortices is marked by curved arrows.

In the middle range of the inline–I branch, the symmetric vortex-shedding pattern is indeed observed in this study (figure 8 b). The corresponding vibrating trajectory of the cylinder is either a dominant in-line motion (figure 9 c,d) or a fairly regular elliptic motion (figure 9 b), as indicated by the phase-averaged vibrating trajectory plotted in green. The elliptic motion at V r = 1.70 has not been discovered by previous studies, which, according to its physical mechanism elucidated in § 3.3, is likely because the elliptic motion occurs over a very narrow range of V r , which may be missed out by an insufficient resolution in V r in the inline–I branch in previous studies. When the vortex-shedding pattern transitions from symmetric to antisymmetric at V r = 2.83 (figure 8 c), the vibrating trajectory displays a figure-of-eight pattern (figure 9 e). In the inline–II branch, the vortex-shedding pattern is entirely antisymmetric (figure 8 d), and the vibrating trajectory consistently displays the figure-of-eight pattern (figure 9 f–h).
(a–h) Lissajous plot of the vibrating trajectory of the cylinder for the cases in the inline–I and inline–II branches. The green curves show phase-averaged vibrating trajectory.

Frequency spectra of (a) y*, (b) C y and (c) u y sampled at (x/D, y/D) = (3, ±2) for the cases across all VIV branches.

3.3. Frequency response
In the literature, dominant frequencies of the VIV system have been usually determined by the time history of the cross-flow displacement y* (e.g. Jauvtis & Williamson Reference Jauvtis and Williamson2004; Ashrafipour et al. Reference Ashrafipour, Zeinoddini, Tamimi, Rashki and Jadidi2022), which is likely because y* is relatively easy to measure in physical experiments. In the present study, the frequency spectra shown in figure 10 are determined by the fast Fourier transform of several different signals, including y* of the cylinder motion, C
y
on the cylinder surface and u
y
sampled in the near wake. The u
y
signals are sampled at (x/D, y/D) = (3, ±2) and 12 equally spaced spanwise locations across the span. Owing to the statistical symmetry about the wake centreline and the spanwise homogeneity of the cylinder body, each u
y
spectrum shown in figure 10(c) is an average of the 24 u
y
spectra determined from the 24 u
y
signals, which maximises the length of statistical data. Similar to figure 6, the frequency spectra shown in figure 10 are then normalised by $\sqrt{2}$
times the RMS value of the signal. The purposes for a collective examination of the frequency spectra of y*, C
y
and u
y
are (i) to provide a more complete picture of the frequency response of the system by analysing commonalities and differences in the frequency spectra of y*, C
y
and u
y
, (ii) to confidently identify and distinguish not only the major frequencies of the system, but also the harmonic frequencies and modulated frequencies and (iii) to add credibility to the present results, especially where discrepancies are observed between the present LES and previous experimental results.
$\sqrt{2}$
times the RMS value of the signal. The purposes for a collective examination of the frequency spectra of y*, C
y
and u
y
are (i) to provide a more complete picture of the frequency response of the system by analysing commonalities and differences in the frequency spectra of y*, C
y
and u
y
, (ii) to confidently identify and distinguish not only the major frequencies of the system, but also the harmonic frequencies and modulated frequencies and (iii) to add credibility to the present results, especially where discrepancies are observed between the present LES and previous experimental results.
Figure 5(c) summarises the frequency response determined by the frequency peaks shown in figure 10. The harmonic frequencies and the frequencies modulated by f low are not plotted in figure 5(c). In general, the frequency response predicted by the present LES agrees very well with that measured by Jauvtis & Williamson (Reference Jauvtis and Williamson2004). Nevertheless, two major discrepancies can be observed.
-
(i) In the experimental result of Jauvtis & Williamson (Reference Jauvtis and Williamson2004), a single frequency value is reported for each V r , whereas in the present LES two governing frequencies are identified for the inline–I, inline–II and desynchronised branches.
-
(ii) For V r ≤ 2.60 in the inline–I branch, the present LES results follow the diagonal dashed line St 0 = 0.197 (see also figure 10, where the frequency spectra of y*, C y and u y all show a peak at St 0 = 0.197, as highlighted by a vertical dashed line), whereas Jauvtis & Williamson (Reference Jauvtis and Williamson2004) suggest that an in-line resonance induces f y * ∼ 0.5.
To address the first discrepancy, the twin governing frequencies for the inline–I, inline–II and desynchronised branches are examined in detail. In the inline–I branch, in addition to a major frequency at St 0, another major frequency is clearly observed at f* ∼ 1. To facilitate visualisation, the exact location of f* = 1 is highlighted by a red arrow in figure 10. The frequency peak at f* ∼ 1 is best captured by the y* signal, followed by the C y signal, and is hardly observed in the u y spectra. This is because f* = 1 indicates structural resonance, which is directly related to the cylinder motion (e.g. y*), followed by the flow characteristics on the cylinder (e.g. C y ) and that in the wake (e.g. u y ). In the inline–II branch, the frequency peak at f* ∼ 1 becomes minor, but it can still be determined confidently from the y* spectra in a log-scale vertical axis (not shown). The frequency peak at f* ∼ 1 determined from the y* spectra are then plotted in figure 5(c). The present results match the theoretical resonant value f* = 1 well.
With the existence of the frequency peak at f* ∼ 1, in particular for several V
r
within the inline–I branch where the twin major frequencies are of comparable strengths (figure 10
a), the competition of the two frequencies gives rise to a phenomenon called ‘phase slipping’ observed in the time history of Φ (presented in figure 17
c in Appendix A), where Φ(t) may slip through 360° periodically. In this study, Φ is defined as the phase difference between C
y
and y* and is obtained by Hilbert transform. On a side note, figure 17(c) confirms the finding by Jauvtis & Williamson (Reference Jauvtis and Williamson2004) that the mean Φ value jumps from ∼ 0° to ∼ 180° at the transition from the super-upper to lower branch. In addition, figure 11 shows the frequency spectra of Φ over the inline–I and inline–II branches. A frequency peak can be observed at approximately the difference between the two major frequencies of the system, namely at approximately ( $f_{nw}$
–
$f_{nw}$
– $f_{w\textit{ake}}$
), where
$f_{w\textit{ake}}$
), where $f_{nw}$
represents the resonant frequency peak at f* ∼ 1 (figure 10
a), while
$f_{nw}$
represents the resonant frequency peak at f* ∼ 1 (figure 10
a), while $f_{w\textit{ake}}$
represents the vortex-shedding frequency peak observed in figure 10(c). In figure 11, the exact location of (
$f_{w\textit{ake}}$
represents the vortex-shedding frequency peak observed in figure 10(c). In figure 11, the exact location of ( $f_{nw}$
–
$f_{nw}$
– $f_{w\textit{ake}}$
) is indicated by an arrow. Physically, the frequency (
$f_{w\textit{ake}}$
) is indicated by an arrow. Physically, the frequency ( $f_{nw}$
–
$f_{nw}$
– $f_{w\textit{ake}}$
) is the frequency of ‘phase slipping’ shown in figure 17(c). The observation of a frequency peak at approximately (
$f_{w\textit{ake}}$
) is the frequency of ‘phase slipping’ shown in figure 17(c). The observation of a frequency peak at approximately ( $f_{nw}$
–
$f_{nw}$
– $f_{w\textit{ake}}$
) also suggests the inherent existence of a frequency f* ∼ 1 in the VIV system.
$f_{w\textit{ake}}$
) also suggests the inherent existence of a frequency f* ∼ 1 in the VIV system.
Frequency spectra of Φ for the cases over the inline–I and inline–II branches.

In the desynchronised branch, however, the vortex-shedding frequency peak is best captured by the u y signal (figure 10 c), followed by the C y signal (figure 10 b), because u y is sampled near the location where vortices are actually shed, while C y is sampled further away (at x ∼ 0) yet C y is still governed by the vortex shedding in the wake (Jiang & Cheng Reference Jiang and Cheng2021). The vortex-shedding frequency peak in the y* spectrum is very minor (figure 10 a), which may be the reason why Jauvtis & Williamson (Reference Jauvtis and Williamson2004) did not report this frequency in their study. Based on the present LES results, we conclude the existence of twin frequencies in the desynchronised branch. For the case V r = 14.70 located in the desynchronised branch, the vortex-shedding frequency deviates slightly from St 0. A similar deviation is also observed in the 1-DOF VIV results, e.g. LES results by Jiang et al. (Reference Jiang, Ju, Zhao, Zhou, Draper, An, Watson, Lei and Wang2024) and experimental results by Zhao et al. (Reference Zhao, Leontini, Lo Jacono and Sheridan2014) (figure 5 c). This agreement adds further credibility to the present LES result.
To address the second discrepancy at V
r
≤ 2.60 (on whether f
y
* follows the diagonal line St
0 = 0.197 or a nearly constant level at f
y
* ∼ 0.5), frequency spectra of the in-line signals (presented in figure 18 in Appendix B) are also examined to facilitate discussion. Figure 12 summarises the frequency peaks identified by both the in-line signals (x* and C
x
) and cross-flow signals (y* and C
y
). The low frequency f
low
and its modulations are not included. For V
r
≥ 2.83, the frequency response of f
x
* follows 2 $f_{w\textit{ake}}$
(figure 18) while f
y
* follows
$f_{w\textit{ake}}$
(figure 18) while f
y
* follows $f_{w\textit{ake}}$
, such that f
x
*/f
y
* = 2. For V
r
≤ 2.60, however, the frequency response of f
x
* no longer follows 2
$f_{w\textit{ake}}$
, such that f
x
*/f
y
* = 2. For V
r
≤ 2.60, however, the frequency response of f
x
* no longer follows 2 $f_{w\textit{ake}}$
(i.e. the 2St
0 diagonal line in figure 12) and instead follows f* ∼ 1.0, which does suggest an in-line resonance. Meanwhile, the frequency response of f
y
* displays a partially synchronous state by following both f
y
* ∼ 1.0 and St
0 = 0.197. The absence of a frequency response f
y
* ∼ 0.5 claimed by Jauvtis & Williamson (Reference Jauvtis and Williamson2004) (figure 5
c), or more specifically the transition from f
x
*/f
y
* = 2 for V
r
≥ 2.83 to f
x
*/f
y
* ≠ 2 for V
r
≤ 2.60 (figure 12), is because the vortex-shedding pattern transitions from an antisymmetric pattern with a figure-of-eight cylinder vibration trajectory (figure 9
e) to a symmetric pattern with an in-line-dominated vibration trajectory (figure 9
d), which no longer locks to the rule f
x
*/f
y
* = 2, such that an in-line resonance does not propagate to the cross-flow direction for V
r
≤ 2.60 (or in other words, the cross-flow vibration is decoupled from the in-line resonance). In contrast, the in-line resonance does propagate to the cross-flow direction for the inline–II branch (which gives rise to a deviation of f
y
* from the diagonal line St
0 = 0.197 in figure 12), and the cross-flow resonance does propagate to the in-line direction for the super-upper and lower branches, as the cylinder vibration trajectory follows the figure-of-eight pattern.
$f_{w\textit{ake}}$
(i.e. the 2St
0 diagonal line in figure 12) and instead follows f* ∼ 1.0, which does suggest an in-line resonance. Meanwhile, the frequency response of f
y
* displays a partially synchronous state by following both f
y
* ∼ 1.0 and St
0 = 0.197. The absence of a frequency response f
y
* ∼ 0.5 claimed by Jauvtis & Williamson (Reference Jauvtis and Williamson2004) (figure 5
c), or more specifically the transition from f
x
*/f
y
* = 2 for V
r
≥ 2.83 to f
x
*/f
y
* ≠ 2 for V
r
≤ 2.60 (figure 12), is because the vortex-shedding pattern transitions from an antisymmetric pattern with a figure-of-eight cylinder vibration trajectory (figure 9
e) to a symmetric pattern with an in-line-dominated vibration trajectory (figure 9
d), which no longer locks to the rule f
x
*/f
y
* = 2, such that an in-line resonance does not propagate to the cross-flow direction for V
r
≤ 2.60 (or in other words, the cross-flow vibration is decoupled from the in-line resonance). In contrast, the in-line resonance does propagate to the cross-flow direction for the inline–II branch (which gives rise to a deviation of f
y
* from the diagonal line St
0 = 0.197 in figure 12), and the cross-flow resonance does propagate to the in-line direction for the super-upper and lower branches, as the cylinder vibration trajectory follows the figure-of-eight pattern.
Frequency peaks identified by the in-line and cross-flow signals.

In addition, we designed a specific case at V r = 1.70, where the in-line resonance occurs with f x * right at 1.00 (see the close-up view in figure 12). This perfect in-line resonance excites a major cross-flow resonant frequency peak at f y * = 1.00 (figure 10 a,b). Hence the cylinder vibration trajectory shows an elliptic pattern (figure 9 b) following f x */f y * = 1, which has not been discovered before. We have also confirmed the persistence of this elliptic trajectory by observing the same trajectory in each short time window of 50 non-dimensional time units. This persistent in-line resonance-induced cross-flow resonance is the reason why a noticeable cross-flow amplitude peak is observed at V r = 1.70 (figure 5 b), which occurs well before the monotonic growth of the major cross-flow amplitude response.
Variation of the hydrodynamic coefficients across all VIV branches: (a) the RMS lift coefficient, (b) the RMS drag coefficient and (c) the mean drag coefficient.

It is worth noting that this perfect in-line resonance at V r = 1.70 occurs over a very narrow range of f x *. For the two neighbouring cases at V r = 1.13 and 2.26, the f x * values are 0.985 and 1.025, respectively, and such resonance is absent. The absence of such resonance for a very small (e.g. 1.5 %) deviation of f x * from unity suggests that the V r range for this resonance is very narrow, which may explain why such resonance has not been discovered by previous studies (where the resolution in V r in the inline–I branch was relatively low). Considering the significant computational cost for the present LES at Re = 10 000, we did not attempt to map out the parameter range (e.g. V r or ζ) for the existence of this resonant state. The present LES result at V r = 1.70 is an isolated numerical observation that suggests the existence of such a resonant state.
3.4. Hydrodynamic coefficients
Figure 13 shows the variation of several key hydrodynamic coefficients across the VIV branches, including the RMS lift (C y,rms ), RMS drag (C x,rms ) and mean drag (C x,mean ) coefficients. The mean lift coefficient (C y,mean ) is practically zero and is not shown. The C y,rms and C x,rms values are calculated as
 \begin{equation} C_{y,\textit{rms}}=\sqrt{\frac{1}{N}\sum\limits_{i=1}^{N}\left(C_{y,i}-C_{y,\textit{mean}}\right)^{2}}\! , \end{equation}
 \begin{equation} C_{x,\textit{rms}}=\sqrt{\frac{1}{N} \sum\limits_{i=1}^{N}\left(C_{x,i}-C_{x,\textit{mean}}\right)^{2}}\! , \end{equation}
where N is the number of values in the time history.
As shown in figure 13, the hydrodynamic coefficients predicted by the present LES generally agree well with the experimental results by Jauvtis & Williamson (Reference Jauvtis and Williamson2004) and Franzini et al. (Reference Franzini, Gonçalves, Meneghini and Fujarra2013). However, relatively larger discrepancies are observed at the smallest V r values (e.g. in the inline–I branch), which may be induced by two factors. First, in physical experiments the smallest V r values correspond to the smallest velocities of the experimental facility, which causes relatively large experimental uncertainty. Supporting evidence is that between the experimental results by Jauvtis & Williamson (Reference Jauvtis and Williamson2004) and Franzini et al. (Reference Franzini, Gonçalves, Meneghini and Fujarra2013), relatively large discrepancies in the hydrodynamic coefficients and variation trends of the coefficients are also observed in the inline–I branch. The second factor is the difference in Re in different studies. While the present LES uses Re = 10 000, the experimental studies by Jauvtis & Williamson (Reference Jauvtis and Williamson2004) and Franzini et al. (Reference Franzini, Gonçalves, Meneghini and Fujarra2013) used Re ∼ 2000–13 500 and 3000–15 000, respectively. Although for the super-upper and lower branches, the largest vibration amplitude (Jauvtis & Williamson Reference Jauvtis and Williamson2004) and the hydrodynamic coefficients shown in figure 13 appear to be insensitive to Re, the inline–I branch is more dependent on Re (as the results should approach to those of a stationary cylinder when V r approaches zero). For Jauvtis & Williamson (Reference Jauvtis and Williamson2004), Franzini et al. (Reference Franzini, Gonçalves, Meneghini and Fujarra2013) and the present LES, the lowest Re in the inline–I branch are 2000, 3000 and 10 000, respectively. To facilitate comparison, figure 13 also plots the hydrodynamic coefficients for the extreme condition of a stationary cylinder (i.e. V r = 0 with infinite spring stiffness) at Re = 2000, 3000 and 10 000 (data from Jiang & Cheng (Reference Jiang and Cheng2021) and Jiang et al. (Reference Jiang, Ju, Zhao, Zhou, Draper, An, Watson, Lei and Wang2024)). For Re from 2000 and 3000–10 000, relatively large variation is observed for C y,rms (figure 13 a), which partly explains the discrepancy between the present LES result and those measured by the experiments.
Another major feature shown in figure 13 is a discontinuous drop in the hydrodynamic coefficients (as well as the in-line and cross-flow vibration amplitudes shown in figure 5 a,b) at the transition from the super-upper to the lower branch. An explanation of this discontinuity is not difficult, as Jauvtis & Williamson (Reference Jauvtis and Williamson2004) observed a corresponding transition in the vortex-shedding pattern from two triplets of vortices over a cylinder vibration period (denoted 2T) for the latter half of the super-upper branch to the shedding of two pairs of vortices over a cylinder vibration period (denoted 2P) for the lower branch. The correspondence between a transition in the vortex-shedding pattern and a consequent discontinuity in the hydrodynamic coefficients has been commonly observed in various bluff-body flows, such as the wake transition to three-dimensionality for different bluff bodies (Jiang et al. Reference Jiang, Cheng, Draper, An and Tong2016; Jiang & Cheng Reference Jiang and Cheng2018; Jiang Reference Jiang2021), and the wake transition of a cylinder under forced oscillation with varying frequencies (Morse & Williamson Reference Morse and Williamson2009; Ping et al. Reference Ping, Zhu, Zhang, Zhou, Bao, Xu and Han2021).
In addition to the 2T ↔ 2P transition between the super-upper and lower branches, Jauvtis & Williamson (Reference Jauvtis and Williamson2004) reported another wake transition within the super-upper branch, where the vortex-shedding pattern transitions from two single vortices over a cylinder vibration period (denoted 2S) to 2T. As demonstrated by Jauvtis & Williamson (Reference Jauvtis and Williamson2004), the transition from 2S to 2T corresponds to the emergence of small-amplitude third-order harmonics in the time history of C y (see e.g. figure 14 c), which occurred as V r increased from 5.6 to 7.3 in their study. In this study, the 2S ↔ 2T transition is thus identified indirectly by the absence/existence of the third-order harmonics in the time history of C y . This indirect method is more efficient and objective than a direct visualisation of individual vortices in instantaneous vorticity fields, because it avoids (i) the laborious task in extracting and examining a large number of instantaneous vorticity fields and (ii) subjective interpretation of the existence of the 2T pattern, as ‘vortex 2’ in each triplet is relatively weak (Jauvtis & Williamson Reference Jauvtis and Williamson2004). Figure 14 shows the time histories of C y from the present LES, where the absence of third-order harmonics at V r = 5.65 (figure 14 a) and emergence of third-order harmonics at V r = 7.35 (figure 14 c; see also a significant third-order harmonic frequency in the frequency spectrum of C y shown in figure 10 b) indicate that the transition from 2S to 2T occurs as V r increases from 5.65 to 7.35, which is very similar to that reported by Jauvtis & Williamson (Reference Jauvtis and Williamson2004).
Time histories of C y for (a) V r = 5.65, (b) V r = 6.78, (c) V r = 7.35 (super-upper branch) and (d) V r = 7.91 (lower branch).

In analogy with the 2T ↔ 2P transition discussed in the previous paragraph, a natural question arises for the 2S ↔ 2T transition as to why the hydrodynamic coefficients (figure 13) and vibration amplitudes (figure 5 a,b) do not display a discontinuity similar to that for the 2T ↔ 2P transition. To answer this question, we computed an additional case between V r = 5.65 (2S) and V r = 7.35 (2T). As shown in figure 14(b), the C y history for V r = 6.78 displays small-amplitude third-order harmonics intermittently, which suggests an intermittent emergence of the 2T vortex-shedding pattern. In addition, the amplitude of the third-order harmonics for V r = 6.78 is generally smaller than that for V r = 7.35, which suggests that the vortex strength of the 2T pattern increases with increasing V r . In other words, there is not a particular critical V r for the 2S ↔ 2T transition. With the increase in V r , the probability of occurrence of the 2T pattern increases, and overall the 2T pattern displays increasing vortex strength. The gradualness in the 2S ↔ 2T transition over a range of V r explains why the hydrodynamic coefficients (figure 13) and vibration amplitudes (figure 5 a,b) display a continuous variation amid a transition from 2S to 2T. In contrast, the 2T ↔ 2P transition is not a gradual process, as can be seen by the complete disappearance of third-order harmonics in the C y history at V r = 7.91 (figure 14 d). Consequently, a discontinuity is observed in the hydrodynamic coefficients (figure 13) and vibration amplitudes (figure 5 a,b) at this transition.
3.5. Spanwise correlation of primary vortex shedding
The spanwise correlation of primary vortex shedding is commonly evaluated by the two-point correlation of a specific flow property sampled at a same (x, y) location but various spanwise locations. For a stationary cylinder, the spanwise correlation of primary vortex shedding has been well studied in the literature based on specific flow properties sampled on the cylinder surface or in the near-wake region where vortices are shed (Norberg Reference Norberg2003). For the present VIV scenario, we use streamwise and cross-flow velocity signals sampled at near-wake locations (x/D, y/D) = (3, ±2). This is because for a vibrating cylinder, flow properties sampled on the cylinder surface record not only the vortex-shedding characteristics but also the cylinder vibration characteristics (see e.g. the frequency spectra of the lift coefficient shown in figure 10 b), where the latter is perfectly correlated along the span. In contrast, the velocity signals sampled at (x/D, y/D) = (3, ±2) reflect almost entirely the vortex-shedding characteristics (figure 10 c), which is a more suitable candidate for an estimation of the spanwise correlation of vortex shedding. At x/D = 3, individual primary vortices have formed completely.
Based on the u x and u y time histories sampled at (x/D, y/D) = (3, ±2) and various spanwise locations, the two-point correlation between a reference location z = 0 and a sampled location z (= 0–2.75D with a spanwise interval 0.25D) is calculated as
 \begin{align} R_{x}\left(z\right)&=\frac{\overline{\left(u_{x}\left(z=0\right)-\overline{u}_{x}\left(z=0\right)\right)\left(u_{x}\left(z\right)-\overline{u}_{x}\left(z\right)\right)}}{\sqrt{\overline{\left(u_{x}\left(z=0\right)-\overline{u}_{x}\left(z=0\right)\right)^{2}}}\sqrt{\overline{\left(u_{x}\left(z\right)-\overline{u}_{x}\left(z\right)\right)^{2}}}}\! , \\[-12pt]\nonumber \end{align}
 \begin{align} R_{\!y}\left(z\right)&=\frac{\overline{\left(u_{\!y}\left(z=0\right)-\overline{u}_{\!y}\left(z=0\right)\right)\left(u_{\!y}\left(z\right)-\overline{u}_{\!y}\left(z\right)\right)}}{\sqrt{\overline{\left(u_{\!y}\left(z=0\right)-\overline{u}_{\!y}\left(z=0\right)\right)^{2}}}\sqrt{\overline{\left(u_{\!y}\left(z\right)-\overline{u}_{\!y}\left(z\right)\right)^{2}}}}\! , \end{align}
where an overbar denotes time average. In addition to the time average, the correlation coefficients R x and R y are also averaged between the two sample locations at y/D = ±2 (owing to the statistical symmetry of the cylinder wake about y = 0) and between z/L z = 0–0.5 and 0.5–1 (owing to the spanwise periodicity at the two ends of the cylinder), which maximise the length of statistical data.
It is noted that the velocity signals sampled in the near wake capture not only large-scale vortex-shedding characteristics but also smaller-scale higher-frequency turbulence (Jiang et al. Reference Jiang, Hu, Cheng and Zhou2022), where the latter is certainly uncorrelated and contaminates the estimation of spanwise correlation of vortex shedding. Therefore, before calculating R
x
and R
y
using (3.3) and (3.4), the time histories of u
x
and u
y
are processed by a low-pass filter with a cut-off frequency at 3.5 $f_{w\textit{ake}}$
, which filters out high-frequency turbulent fluctuations but retains the vortex-shedding frequency
$f_{w\textit{ake}}$
, which filters out high-frequency turbulent fluctuations but retains the vortex-shedding frequency $f_{w\textit{ake}}$
and its noticeable second- and third-order harmonics (figure 10
c).
$f_{w\textit{ake}}$
and its noticeable second- and third-order harmonics (figure 10
c).
Figure 15 illustrates spanwise variation of the correlation coefficients R x and R y for several V r values in different vibration branches. In general, R x and R y decrease with increasing distance from the reference location z = 0. To present the variations in R x and R y over the VIV branches more clearly, figure 16 summarises the R x and R y values at the mid-span (z/D = 1.5) for various V r values. For the ranges of V r values with relatively small vibration amplitudes, including the inline–I and inline–II branches, first half of the super-upper branch and the desynchronised branch (figure 5 a,b), the R x and R y values are generally above 0.9, which indicates strong spanwise correlation of vortex shedding. This feature is consistent with the finding by Novak & Tanaka (Reference Novak and Tanaka1977), who found that spanwise correlation of vortex shedding increases significantly when the cylinder is forced to vibrate transversely even at a relatively small amplitude (their study covered A/D up to 0.1). An exception is the R y value in the inline–I branch, which drops to a minimum value of 0.73. This is because in the inline–I branch the symmetric vortex-shedding pattern induces two horizontal rows of vortices in the wake (figure 8 b), which can be well recorded by the u x signal but less detected by the u y signal.
Spanwise variation of the correlation coefficients: (a) R x and (b) R y .

Correlation coefficients at mid-span (z/D = 1.5) across all VIV branches.

Lowest R x and R y values are observed over the super-upper and lower branches, although the vibration amplitudes over these branches are highest, which suggests that besides a positive correlation between the vibration amplitude and the degree of spanwise correlation of vortex shedding (Novak & Tanaka Reference Novak and Tanaka1977), a more important factor dominates the significant drop in R x and R y . We believe that the lowest spanwise correlation in the super-upper and lower branches is induced by the development of complex vortex structures in these branches. In contrast to the other vibration branches where only two vortices of comparable size and strength are developed over a cylinder vibration period (e.g. figure 8), in the latter half of the super-upper branch (e.g. V r = 6.78 and 7.35 shown in figure 14 b,c) two triples of vortices (i.e. six vortices) are developed over a cylinder vibration period, while in the lower branch two pairs of vortices (i.e. four vortices) are developed over a cylinder vibration period, and these vortices may be of very different sizes and strengths (Jauvtis & Williamson Reference Jauvtis and Williamson2004). The development of additional vortices with very different sizes and strengths induces complex interactions among the vortices, which induces a more chaotic wake and lowest spanwise correlation of the primary vortices.
4. Conclusions
This study re-examines the canonical 2-DOF VIV of a circular cylinder based on high-fidelity LES at Re = 104, m* = 2.6, ζ = 0.0032 and various V r (= 1.13–14.70) covering all VIV branches. Overall, the in-line and cross-flow vibration amplitudes, frequency responses and hydrodynamic coefficients predicted by the present LES agree well with the experimental results by Jauvtis & Williamson (Reference Jauvtis and Williamson2004). In particular, we present the first numerical evidence for the existence of the inline–I and inline–II response regions. In addition, in terms of the V r range and shape of the in-line response curve, the present LES results agree with the design guideline DNV-RP-F105 better than published results summarised in figures 2(a) and 3(a) (judged visually), which is likely because relatively large experimental uncertainty exists at the lowest velocity range of the experimental facility.
Despite close agreement, the frequency response predicted by the present LES and by Jauvtis & Williamson (Reference Jauvtis and Williamson2004) displays two major discrepancies. First, in contrast to a single frequency for each V r identified by Jauvtis & Williamson (Reference Jauvtis and Williamson2004), the present LES identifies two governing frequencies (resonant frequency and vortex-shedding frequency) for each V r in the inline–I, inline–II and desynchronised branches, which indicates partial synchronisation of the system. Second, for V r ≤ 2.60 in the inline–I branch, the present LES identifies an in-line resonant frequency (f x * ∼ 1.0) and a cross-flow non-resonant vortex-shedding frequency (f y * = St 0), rather than f y * ∼ 0.5 (= f x */2) claimed by Jauvtis & Williamson (Reference Jauvtis and Williamson2004). The transition from f x */f y * = 2 for V r ≥ 2.83 to f x */f y * ≠ 2 for V r ≤ 2.60 is physically because the vortex-shedding pattern transitions from an antisymmetric pattern with a figure-of-eight cylinder vibration trajectory (following f x */f y * = 2) to a symmetric pattern with an in-line-dominated vibration trajectory, which decouples the cross-flow vibration from the in-line resonance. Nevertheless, for a perfectly in-line resonant condition at V r = 1.70 (with f x * = 1.00), a cross-flow resonance is also excited, which generates a new cylinder vibration trajectory displaying an elliptic pattern (following f x */f y * = 1).
Beyond the first two in-line branches, we found that the 2S ↔ 2T transition in the vortex-shedding pattern in the super-upper branch is a gradual process over a range of V r (within 5.65–7.35). With the increase in V r , the probability of occurrence of the 2T pattern increases, and overall the 2T pattern displays increasing vortex strength. The gradualness in the 2S ↔ 2T transition explains why the hydrodynamic coefficients and vibration amplitudes display a continuous variation over this wake transition. In contrast, the 2T ↔ 2P transition between the super-upper and lower branches is a sudden process, which results in a discontinuity in the hydrodynamic coefficients and vibration amplitudes.
The 2T and 2P vortex-shedding patterns in the super-upper and lower branches also induce lowest spanwise correlation of vortex shedding across the vibration branches. In contrast to the other vibration branches where only two vortices of comparable size and strength are developed over a cylinder vibration period, the development of six or four vortices with very different size and strength induces complex interactions among the vortices, which induces a more chaotic wake and thus lowest spanwise correlation of the primary vortices.
Acknowledgements
H.J. acknowledges support from the National Natural Science Foundation of China (grant no. 52301341) and the Key R&D Program of Zhejiang Province (grant no. 2024SSYS0089). X.J. acknowledges support from the National Natural Science Foundation of China (grant no. W2533020). P.W. holds the Shell Chair in Offshore Engineering at The University of Western Australia, sponsored by Shell Australia. H.J., H.A. and P.W. further acknowledge support from the Australian Research Council (ARC) Industrial Transformation Research Hub for Transforming Energy Infrastructure through Digital Engineering (TIDE), led by The University of Western Australia in collaboration with The University of Wollongong and other national and international partners, with funding from the ARC and industry partners including INPEX Operations Australia, Shell Australia, Woodside Energy, Fugro Australia Marine, Wood Group Kenny Australia, RPS Group, Bureau Veritas and Lloyd’s Register Global Technology (grant no. IH200100009). This work also used resources provided by the Pawsey Supercomputing Centre, funded by the Australian Government and the Government of Western Australia.
Funding
This work was supported by the National Natural Science Foundation of China (grant nos. 52301341 and W2533020), the Key R&D Program of Zhejiang Province (grant no. 2024SSYS0089), and the Australian Research Council Industrial Transformation Research Hub for Transforming Energy Infrastructure through Digital Engineering (TIDE) (grant no. IH200100009).
Declaration of interests
The authors report no conflict of interest.
Appendix A. Time histories of the simulated cases
To provide an extra level of detail of the present LES results, figure 17(a,b) shows time histories of the in-line and cross-flow displacements (x* and y*) for the simulated cases, while figure 17(c) shows time histories of Φ, where Φ is defined as the phase difference between C y and y* and is obtained by Hilbert transform.
Time histories of (a) x*, (b) y* and (c) Φ for the simulated cases. The range of Φ is shown from −90° to 270° so as to facilitate visualisation of the fluctuations around 0° and 180°.

Frequency spectra of (a) x* and (b) C x for the simulated cases.

Appendix B. Frequency spectra of the in-line signals
To provide an extra level of detail of the present LES results, figure 18 shows frequency spectra of the in-line signals, which include x* of the cylinder motion (figure 18
a) and C
x
on the cylinder surface (figure 18
b). Other than the low frequency f
low
and its modulations, the frequency spectra of x* and C
x
are dominated by a single major frequency at 2 $f_{w\textit{ake}}$
for V
r
≥ 2.83. However, for V
r
≤ 2.60 the major frequency gradually deviates from 2
$f_{w\textit{ake}}$
for V
r
≥ 2.83. However, for V
r
≤ 2.60 the major frequency gradually deviates from 2 $f_{w\textit{ake}}$
. A physical explanation is given in § 3.3.
$f_{w\textit{ake}}$
. A physical explanation is given in § 3.3.


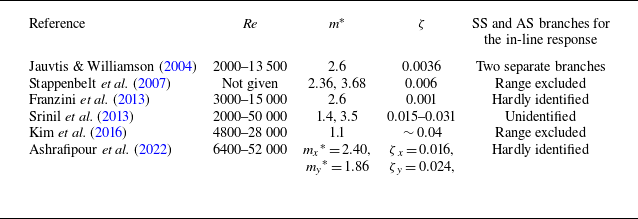
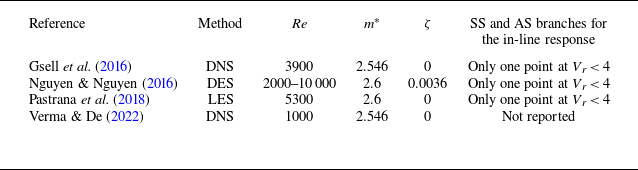


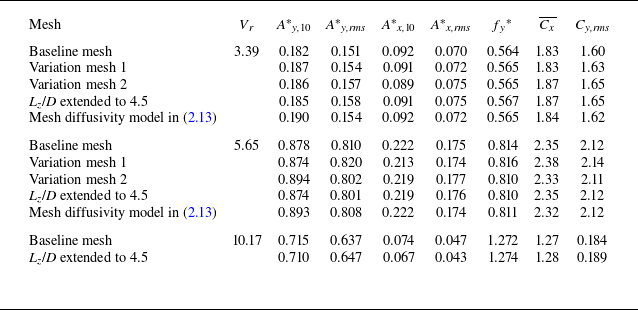


 Open access