


Iodine is critical for the production of thyroid hormones, which are essential regulators of growth, development and body metabolism. Iodine is naturally prevalent in seafood, and in the soil and groundwater of certain regionsReference Leung, Braverman and Pearce (1) . Locales that are naturally iodine deficient include landlocked or mountainous regions where seafood is not readily available. Historically, iodine deficiency in these settings has manifested as endemic goitre. In the developing fetus, severe iodine deficiency can lead to cretinism, a condition of severely impaired mentation, growth and development. Mild to moderate iodine deficiency in pregnancy, however, is also of concern as it can result in impaired neurocognitive developmentReference Jameson, Mandel and Weetman (2) . In children and adults, iodine deficiency impairs cognition and mental abilities, and in this way can impact greatly the potential of an entire community to develop and to prosper (3) .
Early research in Armenia identified the country as iodine deficient using the presence of endemic goitre, most significantly noted in the southern regions of the country( Reference Ghazarian 4 , Reference Karamian 5 ). Despite efforts in the early 1990s by the major domestic salt producer to voluntarily iodize food salt, deficiency remained prevalent( 6 , Reference Rossi and Branca 7 ). To address endemic iodine deficiency, in 2004 the Government of Armenia mandated universal salt iodization (USI) at a standard concentration of 50±15 mg/kg( 6 , 8 ). After a survey in 2005 identified excellent household coverage of iodized salt and a median urinary iodine concentration (UIC) in school-age children (SAC) of 313 μg/l, somewhat higher than the upper limit of WHO recommendations, the standard iodine concentration was reduced to 40±15 mg/kg( 9 ). A follow-up study conducted in 2016 confirmed the excellent household coverage of iodized salt throughout the country and excellent iodine status of the population based on median UIC in SAC, pregnant women (PW) and non-pregnant women of reproductive age (WRA)( Reference Hutchings, Aghajanova and Baghdasaryan 10 ). No recent goitre survey has been conducted in the country; however, established goitre often remains evident especially in adults even after population iodine status has been improved and is thus of uncertain value in assessing changes in iodine nutrition( 3 ).
The USI strategy in Armenia requires iodization of all food-grade salt produced in, or imported into, the country. Used in processed food manufacturing or purchased for use in the household, iodized salt becomes an intrinsic part in the common diet of the population and provides a major source of supplemental iodine intake. The intake of iodine from salt in processed foods and from household salt adds to the intake from naturally occurring iodine in foods and dietary liquids (referred to as ‘native iodine’). These three sources of iodine together should ideally reach a total iodine intake that meets the nutritional requirements( 11 ).
The goal of the current study was to assess the outcome of Armenia’s USI strategy and consider whether an adjustment of the iodized salt standard is needed. We therefore aimed to quantify the iodine intakes attributable to the three main dietary sources: native iodine, processed food salt-derived iodine and household salt-derived iodine. In addition, quantifying the total salt intake of the population is necessary so that if recommendations are made regarding changes in salt iodine content, they can take account of how this will change the population’s overall iodine economy.
Methods
We conducted a cross-sectional study to measure urinary and salt iodine concentrations obtained from PW, WRA and SAC in the context of a national survey of iodine nutrition( Reference Hutchings, Aghajanova and Baghdasaryan 10 ).
Participant selection
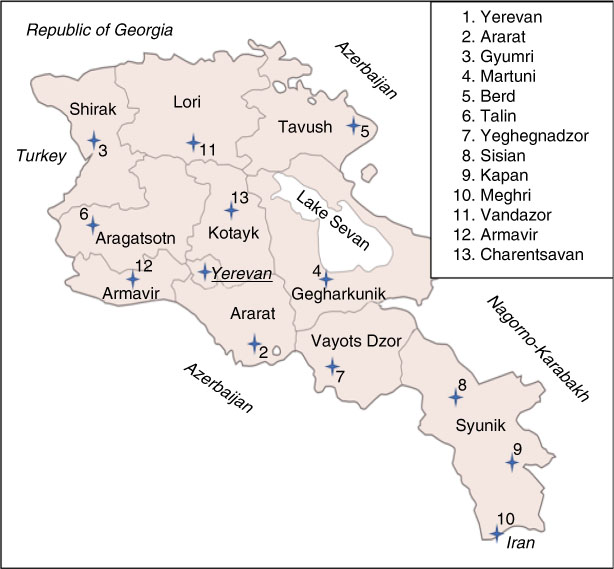
The methods of participant selection have previously been described( Reference Hutchings, Aghajanova and Baghdasaryan 10 ); in brief, a convenience sample of thirteen maternity clinics in Armenia were chosen, covering all the provinces and the capital city of Yerevan (see Fig. 1). At each site, a local site coordinator obtained verbal consent from twenty-five to thirty WRA aged 17–49 years from the clinic staff who then provided casual (spot) urine and table salt samples from their homes. The local site coordinator also obtained verbal consent from a convenience group of twenty-five to thirty PW who received antenatal care at the clinic, who similarly provided urine and table salt samples. Approximately 20% of participants were requested to provide a second spot urine sample at least 24 h after the initial sample.
(colour online) Map of study sites in Armenia with provinces labelled
In the same community as the clinics, research staff obtained verbal assent from twenty-five to thirty SAC of a single 4–6th grade class at a local primary school, who provided samples of urine and table salt. Twenty per cent were then requested provide a second urine sample at least 24 h after the initial sample.
All participants completed a demographic questionnaire. Inclusion criteria were appropriate age and permanent residence in their community. Exclusion criteria were previous thyroidectomy; history of thyroid cancer; use of iodine-containing medications such as thyroxine and amiodarone, or use of iodine supplements within the past 60 d (except for the PW group); exposure to iodine-containing radiologic contrast in the last 60 d; pregnancy or lactation (except for the PW group); and not having spent at least 50 of the past 60 d in the community( Reference Nimmons, Funk and Graham 12 ).
Laboratory analyses
All urine samples were transported from the research sites to the central laboratory in Yerevan where they were frozen and stored. Samples were then shipped frozen to the Boston Medical Center Iodine Research Laboratory. Salt samples were also transported from the research sites to the central laboratory in Yerevan where they were stored dry until being shipped dry to the Boston Medical Center Iodine Research Laboratory. Urine and salt samples were then analysed for iodine content via spectrophotometry using a Technicon Autoanalyzer (Technicon Instruments, Inc., Tarrytown, NY, USA), according to a modification of the method of Benotti et al.( Reference Benotti, Benotti and Pino 13 ). All urine samples were further analysed for Na content at the central hospital laboratory of Boston Medical Center using the Abbott Architect C8000 (Abbott Diagnostics, Lake Forest, IL, USA). Urine samples of WRA were analysed for creatinine content at the Boston Medical Center Iodine Research Laboratory using the Parameter Creatinine assay kit (R&D Systems, Minneapolis, MN, USA).
Statistical analyses
Raw UIC measurements were used to produce summary statistics for each group. Values were adjusted via the Institute of Medicine method, which uses the ratio of the intra-individual to inter-individual standard deviation for each group to reduce the effect of individual variability of the spot urine data. In this way, the adjusted UIC values more closely resemble the true habitual UIC value for each individual( Reference Zimmermann, Hussein and al Ghannami 14 – Reference Mackerras, Singh and Eastman 17 ). Urinary Na concentration (UNaC) data were adjusted in the same way as the UIC values.
The method of statistical analysis has been previously described( Reference Van der Haar, Knowles and Bukania 18 ); however, in brief, UNaC and salt iodine concentration (SI) were used as independent explanatory variables in multiple linear regression analyses with the UIC as the dependent variable. In our analysis, we used the natural logarithm of UIC to reduce the skew of the UIC distribution, and therefore the findings from UIC constituent analyses are geometric mean values. The resulting regression equations explain the UIC values as a function of the UNaC and SI values: UIC=A+B×UNaC+C×SI. Setting both UNaC and SI to 0 as in a situation of no salt intake, UIC equals the intercept, which is interpreted as the portion of UIC attributable to native iodine intake alone. Setting UNaC in the equation to the mean group UNaC value while holding SI at 0 provides an estimate for the portion of UIC that is attributable to native iodine plus iodine contained in salt from processed foods. The difference between this value and the intercept is interpreted as the contribution of processed food salt-derived iodine. Lastly, the difference between the total mean UIC for the group and the UIC estimate from native and processed food salt contribution is interpreted as the UIC portion attributable to iodine intake from household salt. This process was completed separately for the three different groups.
Raw urinary creatinine (UCr) results for the WRA were used with the raw UNaC results to provide raw ratios of UNaC to UCr, which were then adjusted in the same way as the UIC values. Adjusted ratios were then used to approximate 24 h Na consumption, using the method and reference values for German women from Johner et al. ( Reference Johner, Boeing and Thamm 19 ) (see Fig. 2 and Table 1).
Calculation scheme for the estimation of 24 h sodium excretion for a given urine sample from corresponding sodium and creatinine concentration measurements using the tool of separately established 24 h creatinine reference values (UNaC, spot urinary sodium concentration; UCr, spot urinary creatinine concentration; Cr Refence, 24 h creatinine reference value; see Table 1). Adapted from Johner et al.( Reference Johner, Boeing and Thamm 19 )

Urinary creatinine reference values for German women. Adapted from Johner et al.( Reference Johner, Boeing and Thamm 19 )

Data transformation, adjustment and summary statistics were calculated using Microsoft® Excel 2016. Associations and pairwise comparisons were investigated using ANOVA and linear regression with R.
Results
From the thirteen sites in Armenia, urine and table salt samples were obtained from a total of 1125 participants, of whom 955 provided sufficient quantity for laboratory analysis. This total number included 312 SAC (mean age 10·5 years, 45% female), 311 PW (mean age 26·1 years) and 332 WRA (mean age 35·7 years). Repeat urine samples were obtained from 177 (18·5%) participants. Adjusted median UIC was 243 μg/l for SAC, 227 μg/l for PW and 308 μg/l for WRA. Differences between groups were statistically significant (P<2·2×10−16), but there were no statistically significant differences across sites. The overall mean SI was 35·5 mg/kg, with 93·4% of samples within the national standard range of 25–55 mg/kg. Summary characteristics are presented in Table 2; further analyses and discussion of these findings are reported elsewhere( Reference Hutchings, Aghajanova and Baghdasaryan 10 ).
Summary characteristics of participants according to population group, Armenia, September–November 2016

P25, 25th percentile; P75, 75th percentile; Adj. UIC, adjusted urinary iodine concentration; Adj. UNaC, adjusted urinary Na concentration; SI, salt iodine concentration; Adj. UNaC/UCr, adjusted ratio of urinary Na to urinary creatinine (mmol/l/mg/dl).
* Percentage of participants who responded ‘yes’ to survey question asking if participant has taken iodine supplements in the past 60 d or who reported taking a prenatal vitamin supplement known to contain iodine, out of the total number of participants who responded to that survey question, which had only a 36 % response rate.
Constituent regression equations are presented in Table 3. In all three groups, the effects of the UNaC and SI values on the UIC were statistically highly significant (P<1×10⁻¹³). UIC portion estimates revealed significant differences between groups: the estimated native iodine intake was 114 µg/l (46% of the total UIC) in SAC, 185 µg/l (81%) in PW and 180 µg/l (56%) in WRA. Iodine intake estimates from household salt were much less, namely 47 µg/l (19%) in SAC, 2 µg/l (1%) in PW and 43 µg/l (13%) in WRA. However, the UIC variation explained by the UNaC and SI values was less than 24% for each model (see Fig. 3).
(colour online) Constituent components (![]() , iodine from table salt;
, iodine from table salt; ![]() , iodine from salt used in processed foods;
, iodine from salt used in processed foods; ![]() , native iodine) of urinary iodine concentration (UIC) according to population group (SAC, school-age children; PW, pregnant women; WRA, non-pregnant women of reproductive age) Armenia, September–November 2016
, native iodine) of urinary iodine concentration (UIC) according to population group (SAC, school-age children; PW, pregnant women; WRA, non-pregnant women of reproductive age) Armenia, September–November 2016

Constituent analysis of iodine intake and multivariate linear regression equations according to population group, Armenia, September–November 2016

SAC, school-age children; PW, pregnant women; WRA, non-pregnant women of reproductive age; Ln(Adj. UIC), natural log of adjusted urinary iodine concentration (in μg/l); Adj. UNaC, adjusted urinary Na concentration (in mmol/l); SI, salt iodine content (in mg/kg).
Urine samples from a total of 332 WRA were of sufficient quantity for analysis of UCr, including forty-five who provided repeat samples. The adjusted UNaC/UCr ratios approximate an average 24 h sodium intake of 5·5 g/24 h (95% CI 4·7, 6·3 g/24 h). This is equivalent to a salt intake of 13·9 g/24 h, on the assumption that all Na ingested was in the form of NaCl( Reference Xu, Wang and Chen 20 ) (see Table 4 and Fig. 4).
(colour online) Histogram of estimated sodium excretion per 24 h among non-pregnant women of reproductive age, Armenia, September–November 2016

Estimates of 24 h urinary sodium excretion (in g/24 h) among non-pregnant women of reproductive age, Armenia, September–November 2016
P25, 25th percentile; P75, 75th percentile.
Discussion
The present study examined the constituent analysis estimates of iodine intake among three population groups in Armenia, considered at risk for adverse outcomes from iodine insufficiency: SAC, PW and WRA. Median UIC for SAC and PW are within the WHO range indicative of adequate iodine nutrition, and that of WRA is slightly higher, however the importance of this elevation is unclear( 3 , Reference Katagiri, Yuan and Kobayashi 21 , Reference Zimmermann and Andersson 22 ). The iodine intake estimate in SAC attributed to native sources of iodine in the diet accounted for 107 μg/l, minimally above the lower limit of the most recent WHO recommendation for this age group (100–299 μg/l)( Reference Katagiri, Yuan and Kobayashi 21 ). The contributions from iodine in processed food salt and salt used in household food preparation led to an increase in the mean adjusted weighted UIC of SAC solidly in the range indicative of optimum iodine nutrition. Of note, these findings are very similar to those of a 2017 survey of SAC in Georgia, a neighbouring country similar to Armenia in geography and diet( Reference Gerasimov, van der Haar and Ugulava 23 ).
The findings from analysis of the PW measurements estimated that the iodine intake from non-salt sources of iodine accounts for 185 µg/l, which falls moderately above the lower concentration limit indicative of adequate iodine nutrition (median UIC of 150–249 μg/l). In this group, the contribution of iodine from all salt sources is more modest and responsible for almost 20% of the total intake.
Estimated iodine intake from native sources represented 180 μg/l of the UIC for WRA. The UIC finding for this group is above the conventional cut-off at 300 μg/l. The Na excretion estimate of 5·5 g/24 h in WRA is far above the recommended level of 2 g/24 h, so given the constituent analysis findings that 44% of their iodine intake is obtained from iodized food and household salt, the relatively high iodine intake in this group may be directly related to the high salt intake. Estimated 24 h Na excretion for SAC was not calculated because UCr, height and weight measurements were not collected; however, dietary similarities between WRA and SAC, as well as the constituent analysis finding that 54% of iodine intake of SAC is obtained from iodized food and household salt, suggest that the robust iodine intake in the SAC group may also be related to high salt intake.
Across all three groups, the component of iodine intake attributed to salt from processed foods was greater than that attributed to household salt. This reflects the impact and success of the USI strategy which concerns both table salt in the households and salt used in processed foods prepared outside the home. The iodine from salt intake used in processed food production includes store-bought processed foods as well as foods eaten in restaurant meals and work canteens, and appears to play a significant role in providing iodine intake to the population.
There are remarkable differences in the estimates for iodine intake portions between the groups which is most likely related to different dietary habits. While the findings of SAC and WRA were broadly comparable and in line with other survey findings, those of PW were very different, with a vast majority of the intake coming from non-salt sources, and household salt representing less than 1% of the overall iodine intake. This may partly be associated with adherence to low-salt diets, as is commonly recommended by clinicians during the prenatal period, or with use by PW of iodine-containing nutritional supplements which in the current analysis forms part of the non-salt-derived iodine intake; sample size was too small, however, to allow for subgroup analysis.
The estimated 24 h Na excretion of 5·5 g is remarkable for the high level of salt intake in the WRA group. A nationwide survey of non-communicable disease risk factors conducted in Armenia in 2016 utilizing the WHO STEPS methodology found a mean Na intake considerably lower at 3·3 g/24 h among adult women( 24 , 25 ). Nevertheless, both these findings are far above the recommended upper limit of 2 g Na/24 h and reflect common dietary habits high in salt in adult women in Armenia.
Iodine from the dietary salt sources provides important contributions to the overall iodine intake in the three groups studied and reflects successful performance of the USI strategy in Armenia. Importantly, however, native iodine was the largest contributor towards UIC in all three groups. The high intake of dietary Na in WRA is consistent with previous survey findings in Armenia( Reference Powles, Fahimi and Micha 26 ) and with the authors’ expectations. While there is no current strategy to reduce population salt consumption in Armenia, recent attention to the burden of non-communicable diseases has led to significant discussion among the public health community in Armenia about the effects of high salt intake on the overall health of the community. The sufficient level of iodine nutrition in the three groups studied suggests that there is leeway for efforts to reduce salt intake without adversely affecting the iodine status of the population while providing potentially other health benefits.
A major strength of the present study is the inclusion of the PW and WRA groups along with the traditionally targeted SAC. The most critical times for optimal iodine nutrition are in utero and the neonatal period, which is influenced by the iodine status of the mother both immediately before and during pregnancy( Reference Wong, Sullivan and Perrine 27 , 28 ). Further study strengths include the collection of repeat samples from approximately one-fifth of participants, allowing for statistical adjustment of the data to reduce the typical intra-individual variability inherent in spot urinary iodine and Na measurements; the large sample size of over 950 participants in a country with a population of only 3 million; geographic stratification with participant recruitments from every region of the country; and reliability of using a WHO reference laboratory for the urine sample analyses.
One limitation of the study is that interpretation of the findings is limited by the fact that multiple linear regression models accounted for only a small portion of the overall variance in iodine intake which makes for high uncertainty of the component estimates, as is apparent by the low R 2 values. Thus, other factors of influence on the iodine intake of each group remain unaccounted for. In addition, the study was limited by practical considerations for the selection of study sites in a non-randomized fashion: sites were chosen based on which towns in each region had maternity wards with a sufficient number of PW to allow full enrolment at the site within one to two weeks. SAC and WRA were then recruited from these same sites. Due to this recruitment strategy, the urban and semi-urban portion of the Armenian population is over-represented in the study. However, given the overall small size of the country and high similarity in common dietary patterns across the country, we consider it unlikely that this would have a significant impact on the results of the study.
Despite these limitations, the current study provides important information on the sources of iodine intake among the three populations most affected by iodine deficiency in Armenia, using a method that can be used to predict how changes in diet and certain health interventions may impact iodine nutrition. In addition, the study highlights the success and importance of the USI strategy in ensuring sufficient intake for the entire population.
Acknowledgements
Acknowledgements: The authors gratefully acknowledge Drs Gregory Gerasimov, Lusine Kalantaryan and Suren Amiryan; teachers and clinicians throughout Armenia who served as site coordinators; the staff of the MD/MS joint degree programme of Columbia University College of Physicians & Surgeons; and the study participants. Financial support: This study was made possible with support from the MD/MS in Biomedical Sciences (Global & Population Health Focus) of the Columbia University Center for Global and Population Health, and from Boston Medical Center and Iodine Global Network, with additional support from the Fulbright US Student Program, the John & Hasmik Foundation, and the Anna and Hirair Hovnanian Foundation, and with the collaboration of the Ministries of Health, of Education and Science, and of Territorial Affairs of the Republic of Armenia. The funding agencies had no role in the design, analysis or writing of this article. Conflicts of interest: The authors declare no conflicts of interest. Authorship: N.H. designed the study, led the research team, conducted analysis of data and drafted the manuscript; E.A. provided local academic and logistical support; S.B., M.Q. and C.S. were members of the research team who conducted the study; X.H. and L.B. conducted laboratory analyses of the samples; F.v.d.H. provided guidance in study design and assisted with data analysis and drafting the manuscript; J.P.B. provided academic oversight, assisted with design of the study, analysis of data and drafting the manuscript. Ethics of human subject participation: This study was conducted according to the guidelines laid down in the Declaration of Helsinki and all procedures involving human subjects were approved by the Human Research Protection Office of Columbia University and the Ethics Committee of Yerevan State Medical University. Verbal informed consent was obtained from all subjects. Verbal consent was witnessed and formally recorded.


