Rice, wheat and maize account for 94 % of the total cereal consumption worldwide(Reference Ranum, Peña-Rosas and Garcia-Casal1), and amongst these, rice (Oryza spp.) is the staple for more than half of the world population by providing 30–70 % of energy requirements. It is particularly important in Asia, where 90 % of rice produced is consumed, and the annual per capita consumption is often > 100 kg compared with about 5 kg in Europe(2). It has been well established that brown (whole grain or unmilled or unpolished) rice contains more nutrients than white rice(Reference Pinto, Almeida and Ferreira3,Reference Saleh, Wang and Wang4) . Similarly, though not an Oryza species, nutrient benefits provided by wild rice (Zizania spp.) were reported as early as the 1920s and in many subsequent reports(Reference Surendiran, Alsaif and Kapourchali5). However, 85 % of consumed rice is white(Reference Se, Khor and Karupaiah6), produced by removing the outer husk, germ and bran layers through milling. Milling, on average, produces 65 % white rice, 25 % husk, 10 % bran and germ(Reference Chen, Siebenmorgen and Griffin7). The bran layers (pericarp, aleurone and subaleurone layers, and germ) are reservoirs of several essential nutrients, and a substantial proportion of these are lost during this process(Reference Lamberts, De Bie and Vandeputte8). For example, polishing removes 75–90 % of vitamins B1, B6, E and niacin(Reference Steiger, Müller-Fischer and Cori9), along with several other vital minerals.
There are forty-nine essential nutrients required to meet the metabolic demands for human growth and function. These include water, carbohydrates, proteins, lipids, nutrient elements (NE) and vitamins(Reference Welch and Graham10). Macro NE are Na, K, Ca, Mg, S, P and Cl, whereas micro NE are Fe, Zn, Cu, Zn, Mn, I, F, B, Se, Mo, Ni, Cr, V, Si, As and Sn. Micronutrient deficiencies have a high prevalence worldwide, with more than 3 billion people affected(Reference Welch and Graham10). Amongst micro NE, Fe and Zn deficiencies are more widespread than the others with very similar geographical prevalence (many parts of Africa, the Middle East, Central, South and South-East Asia, and Latin America), and, according to the WHO, are each responsible for 0·8 million deaths per year(Reference Bashir, Takahashi and Nakanishi11,Reference Dipti, Bergman and Indrasari12) . For example, Fe deficiency anaemia affects a quarter of the global population(Reference Shaw and Friedman13), mostly from developing countries with high rice consumption levels. In these regions, Zn deficiencies are also common(Reference Dipti, Bergman and Indrasari12). Approximately 15 % of the population is deficient in Se, an essential trace element required to ensure antioxidant protection to cells(Reference Combs14). Se is also thought to offer some protection against arsenic toxicity, a problem seen in many parts of Asia(Reference Spallholz, Boylan and Rhaman15).
NE deficiencies are not limited to developing countries. For instance, a recent analysis(Reference Derbyshire16) of data obtained from 3238 adults in the UK (National Diet and Nutrition Survey or NDNS; years from 2008/2009 to 2013/2014) showed that a quarter of women had Fe and K intake below LRNI (Lower Reference Nutrient Intake), whereas a significant proportion of the population (about 50 % of females and about 25 % of males) had a Se intake less than the LRNI. In particular, adults in their twenties had a significantly lower intake of minerals such as Ca, Mg, K and Cu than adults in their thirties, forties and fifties.
Some micro NE can be toxic to human health if consumed in excess. For example, inorganic arsenic (iAs) is a ubiquitous element and is a Group 1 carcinogen(17). Though rice can be part of a healthy and balanced diet, there are concerns about the concentration of iAs. Rice takes up more iAs than other cereal crops as it is a semi-aquatic crop and typically grown in submerged soils which favours iAs uptake(Reference Meharg, Lombi and Williams18). Due to this, iAs is regulated and monitored in the marketed rice in some countries and regions (e.g. USA, China, Australia and the EU). For example, based on the EU specifications(19,20) , iAs concentration in rice shall not exceed 0·2 and 0·25 mg kg−1 for white and brown rice, respectively. Since infants, toddlers and children are more vulnerable to iAs exposure(20,21) , iAs in rice meant for consumption for these groups(19) are set at < 0·1 mg kg−1. Nevertheless, rice is consumed by more than half of the global population; it is also a staple in many countries such as Bangladesh or India, yet no such regulations are in place to restrict iAs in rice.
Whether the average per capita rice consumption is low (e.g. about 15 g/d in the UK(Reference Schenker22)) or high (e.g. 474 g/d in Bangladesh), we need to evaluate risks and benefits for making informed decisions to select suitable rice types for consumption(Reference Sirot, Leblanc and Margaritis23). This requires a rigorous evaluation of NE and iAs in rice types and an optimisation approach to evaluate benefits and risks. This paper demonstrates a novel optimisation approach for identifying rice types that maximise nutrient intake and quantify the risks from iAs using the margin of exposure (MOE) in adults and children for different daily intake scenarios. Though NE and iAs concentrations in rice have been extensively studied, it is seldom combined or modelled to provide rice choices. Here we show the essential NE from fifty-five different rice samples from the UK comprised of wild, brown and white rice types, which were used to optimise the daily intake requirements. We used iAs data from previously published work(Reference Menon, Sarkar and Young24) on the same rice types to evaluate MOE. Our specific objectives were to: (1) determine NE concentrations in a range of various rice types marketed in the UK; (2) compare and rank rice types in meeting daily NE targets under various consumption scenarios through a newly developed optimisation approach and (3) determine the MOE of different rice intake scenarios to ensure the potential increased exposure to iAs balances any recommendation based on NE density.
Methods
Sample collection and processing
Fifty-five rice samples (0·5–1 kg of raw rice packets) were collected from various UK retailers in 2018. Suppliers were made anonymous. The samples consisted of wild (n 6), white (n 36) and brown (n 13), either organically (n 16) or conventionally produced (n 39) as shown in the complete list in Supplementary Table 1. Approximately 200 g of each rice sample from each packet was finely ground using a ball mill grinder (Retsch MM 200 Model Mixer Mill). The grinding jars were cleaned between samples using acetone and ultrapure water (18·2 MΩ cm) and left to dry to avoid cross-contamination. Ground rice (i.e. rice flour) was thoroughly mixed and divided into three subsamples (replicates). We used 2–5 g from these replicates for chemical analysis as described below.
Chemical analysis
Using the methods previously established(Reference Menon, Sarkar and Young24), approximately 0·2 g (dry weight) of rice flour samples were microwave-digested in 6 ml HNO3 (Primar grade, Fisher Scientific) in perfluoroalkoxy (PFA) vessels (Multiwave; Anton Paar GmbH). The digested samples were diluted to 20 mL and then 1-in-10 with Milli-Q water (18·2 MΩ cm) before the elemental analysis by inductively coupled plasma mass spectrometry or ICP-MS (Thermo-Fisher Scientific iCAP-Q; Thermo Fisher Scientific). The instrument was run employing a collision-cell (Q cell) using He with kinetic energy discrimination (He-cell) to remove polyatomic interferences. Samples were introduced from an autosampler (Cetac ASX-520) incorporating an ASXpress™ rapid uptake module through a PFA Microflow PFA-ST nebuliser (Thermo Fisher Scientific). Internal standards were introduced to the sample stream on a separate line via the ASXpress unit and included Ge (10 µg/l), Rh (10 µg/l) and Ir (5 µg/l) in 2 % HNO3. External multi-element calibration standards (Claritas-PPT grade CLMS-2 from SPEX Certiprep Inc.) included Ag, Al, As, Ba, Be, Cd, Ca, Co, Cr, Cs, Cu, Fe, K, Li, Mg, Mn, Mo, Na, Ni, P, Pb, Rb, S, Se, Sr, Ti, Tl, U, V and Zn, in the range 0–100 µg/l (0, 20, 40 and 100 µg/l). A multi-element (1000 mg/l) calibration solution (Qmx Laboratories Ltd) was used to create Ca, Mg, Na and K standards in the range 0–30 mg/l. P, S and B calibrations utilised in-house standard solutions (KH2PO4, H3BO3 and K2SO4). Peak dwell times were 10 mS with 300 scans per sample. Sample processing was undertaken using Qtegra™ software (Thermo-Fisher Scientific) utilising external cross-calibration between pulse-counting and analogue detector modes when required.
The elemental analysis was carried out in two batches (thirty-seven and eighteen rice samples). For quality assurance purposes, we included operational blanks and certified reference material (NIST 1568b, rice flour) for each digestion batch. Please see Supplementary Table 2 for limit of detection (LoD), limit of quantification, correction factors and the number of samples where correction factor was applied, and the average recovery of elements from both batches based on the reference material concentrations.
Calculating nutrient element contributions
Using the concentrations of NE (Ca, P, Na, Mg, K, Zn, Fe, Mn, Cr, Mo and Se) in rice samples, we calculated the NE contributions. We used European Food Standard Agency (EFSA)’s dietary reference values (DRV)(25) for these elements except Cr(26). Cr is recognised as an essential micronutrient in both the USA and the UK(Reference White and Broadley27), hence considered in this study. The NE contributions were calculated using adequate intake or population reference intake. An adequate intake is the average nutrient level, based on observations or experiments, which is assumed to be adequate for the population needs, and used when there is not enough data to calculate an average requirement. Population reference intake represents the intake of a nutrient that is likely to meet almost all healthy people’s needs. An exception is Na, for which we used a ‘safe and adequate’ intake rate as other indices were not available. It is important to note that Zn intake is influenced by the levels of phytate intake (LPI)(Reference Ma, Li and Jin28,Reference Hambidge, Michael and Leland29) , and therefore, the EFSA’s Zn intake recommendations vary according to the daily LPI intake scenarios (e.g. 300, 600, 900 and 1200 mg/d LPI) for adults. The UK adult LPI intake(Reference Amirabdollahian and Ash30) is estimated to be 809 mg/d; therefore, we selected 900 mg/d from EFSA.
The NE contributions were produced for male and female adults (> 18 years) and children (4–10 years, male and female) as per the recommended uncooked (raw) rice portion, which was 75 g rice for adults(31) and 50 g for children(32).
Scenario modelling
We considered only eight NE (P, K, Mg, Fe, Zn, Cr, Mo and Se) as these contributed at least 2 % of the DRV, based on a standard rice portion of adults and children as outlined in section 2·3. A linear cost minimisation approach was used to identify the most nutrient-rich rice types in the market, similar to other linear programming optimisation strategies for nutrition(Reference Castañón, Campos and Doménech Martínez33). For a given rice sample (mean of 3 replicate subsamples), nutrient and daily target intake (either population reference intake or adequate intake), the fraction of the DRV for that nutrient was calculated (nutrient element contribution, NEC i ):
 $$NE{C_i} = \frac{concentration \times daily\;intake\;mass}{daily\;target\;intake}$$
A loss (or cost) function referred to here as mean daily deficit (MDD) was defined for n NE:
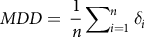 $$MDD = \;\frac{1}{n} \sum\nolimits_{i = 1}^n {\delta _i}$$
where
 $${\delta _i} = \max \left( {0,{\rm{\;}}1 - NE{C_i}} \right)$$
MDD is more appropriate than other distance metrics (such as root mean squared error) in this case as it does not penalise or reward delivering more than 100 % of DRV (i.e. there is assumed to be no nutritional cost or benefit from having more than the DRV for any of the eight NE listed).
We present modelling scenarios for mean daily intake in six countries (UK, Japan, China, Indonesia, Vietnam and Bangladesh) representing a range of average rice consumptions, from 75 to 474 g/d(34). Child rice consumption was assumed to be 2/3 of adult daily consumption. For each intake, MDD was used to rank each of the fifty-five samples by nutrient density for the selected nutrients.
The margin of exposure from inorganic arsenic
It is essential to realise the risks involved while consuming different rice types, particularly when brown rice is known to have higher iAs than white rice due to bran(Reference Sun, Williams and Carey35). In this paper, we evaluated the risk from consuming white, brown and wild rice types for two consumption scenarios (the UK and Bangladesh), representing low and high rice-consuming populations. We consider adults (male and female) and 7-year-old children as target groups.
MOE is calculated as follows:
 $$MOE = {\rm{\;}}\frac{BMDL}{EDI}$$
EDI (estimated dietary intake) is calculated as:
 $$EDI = {\rm{\;}}\frac{AC\, \times \,ADC}{bw}$$
where AC is the average concentration of iAs in rice (mg kg−1), ADC is the average daily consumption rate of rice (kg/d) and bw represents the average body weight of the local population (kg). The body weights were derived from existing literature(Reference Khan, Hawkesworth and Hawlader36–Reference Sultana, Karim and Ahmed38), and children of 7 years of age used to represent children aged 4–10 years.
MOE should be > 1 to avoid iAs exposure; however, the MOE will depend on Benchmark Dose Lower Confidence Limit (BMDL) values used in Eq. 4; for instance, BMDL0·1 (subscript indicates dose needed for 0·1 % increase in the incidence of cancers) ranges from 0·0003 to 0·008 mg/kg bw per d(21). In the UK, 0·003 mg/kg bw per d was used in assessing iAs risks earlier(39), which was based on BMDL0·5. Therefore, we calculated MOE for three different BMDL values; MOE-1 and 3 will represent BMDL values of 0·0003 to 0·008 mg/kg bw per d(21), whereas MOE-2 will be based on 0·003 mg/kg, according to the UK’s Food Standard Agency (FSA).
Using the above equations, we determined the maximum rice one could consume (i.e. denoted by ADC max ) for a target MOE as shown in Eq.6. We used MOE = 10, as per the Committee of Toxicity (COT) in the UK(39), which would be considered of low concern:
 $$AD{C_{max}} = \frac{BMDL\, \times \,bw}{MOE\, \times \,AC}$$
Statistical analysis
We used GraphPad Prism (version 8.4.2, www.graphpad.com) for statistical analysis and production of graphs presented in the results section. Before the statistical analysis, data from the ICP-MS were checked for values below the LoD, where values were below the LoD, they were replaced with a correction factor of half the LoD (see LoD in online Supplementary Table 2), which is one of the data-censoring methods followed in such situation(Reference Wood, Beresford and Copplestone40,Reference Croghan and Egeghy41) .
The NE concentration data were heteroscedastic (i.e. standard deviation for each rice type was different for a given NE) and tested for normality using D’Agastino and Pearson test. Based on the Q-Q (quantile-quantile) plots of individual NE, Welch’s ANOVA test was used due to the differences in rice-type sample sizes and its robustness, even though all NE data were not entirely normally distributed(Reference McDonald42). To compare different rice types, we used Dunnett’s test to identify pairs with significant differences. While comparing different types of rice, the following notations were used in figures: ‘ns’ for P > 0·05 (not significant), ‘*’ for P ≤ 0·05, ‘** ’ for P ≤ 0·01, ‘***’ for P ≤ 0·001 and ‘****’ for P ≤ 0·0001. The error bars in graphs represent the standard error of means. All modelling analyses were done using Python, and plots were generated with MatPlotLib or Seaborn Python packages.
Results
Sampling and nutrient element concentrations
Though our overall strategy was to collect as many samples as possible from major retailers and online suppliers, white rice dominated (hence more samples). Wild rice was included in the study due to its increasing presence in the form of wild-white rice mix products in UK supermarkets. However, we had to use online suppliers to obtain unmixed (i.e. 100 % wild rice) samples. As a result, only six wild rice samples could be obtained compared with thirteen brown and thirty-six white rice. Please see Supplementary Table 3 for descriptive statistics of NE from various rice types.
Different rice types influenced P concentrations in rice grains (P = < 0·0001), and the concentrations of P, K and Mg in brown and wild rice were significantly higher (2–3 times) than white rice (Fig. 1(a)). P and K concentrations were significantly different between brown and wild rice; however, there was no difference in Mg. Rice types significantly influenced Ca concentrations in rice samples (P = 0·0016). Both white and brown rice Ca concentrations were significantly higher than the wild rice, whereas the difference between white and brown rice was not statistically significant (Fig. 1(b)). However, Ca concentrations were below the LoD with 44 % white and 50 % wild rice samples (see online Supplementary Table 2), whereas only one brown rice sample had Ca below the LoD, indicating that Ca is likely to be associated with the bran. Na concentration in white rice was also significantly lower than in brown or wild rice. Similar to Ca, 41 % of white rice samples were also below LoD for Na.
(a–d) Concentrations of different macro and micronutrient elements from white, brown and wild rice samples (‘ns’ = P > 0·05, ‘*’ = P ≤ 0·05, ‘**’ = P ≤ 0·01, ‘***’ = P ≤ 0·001 and ‘****’ = P ≤ 0·0001). Error bars represent sem. Please note the difference in the Y-axis scale between graphs.
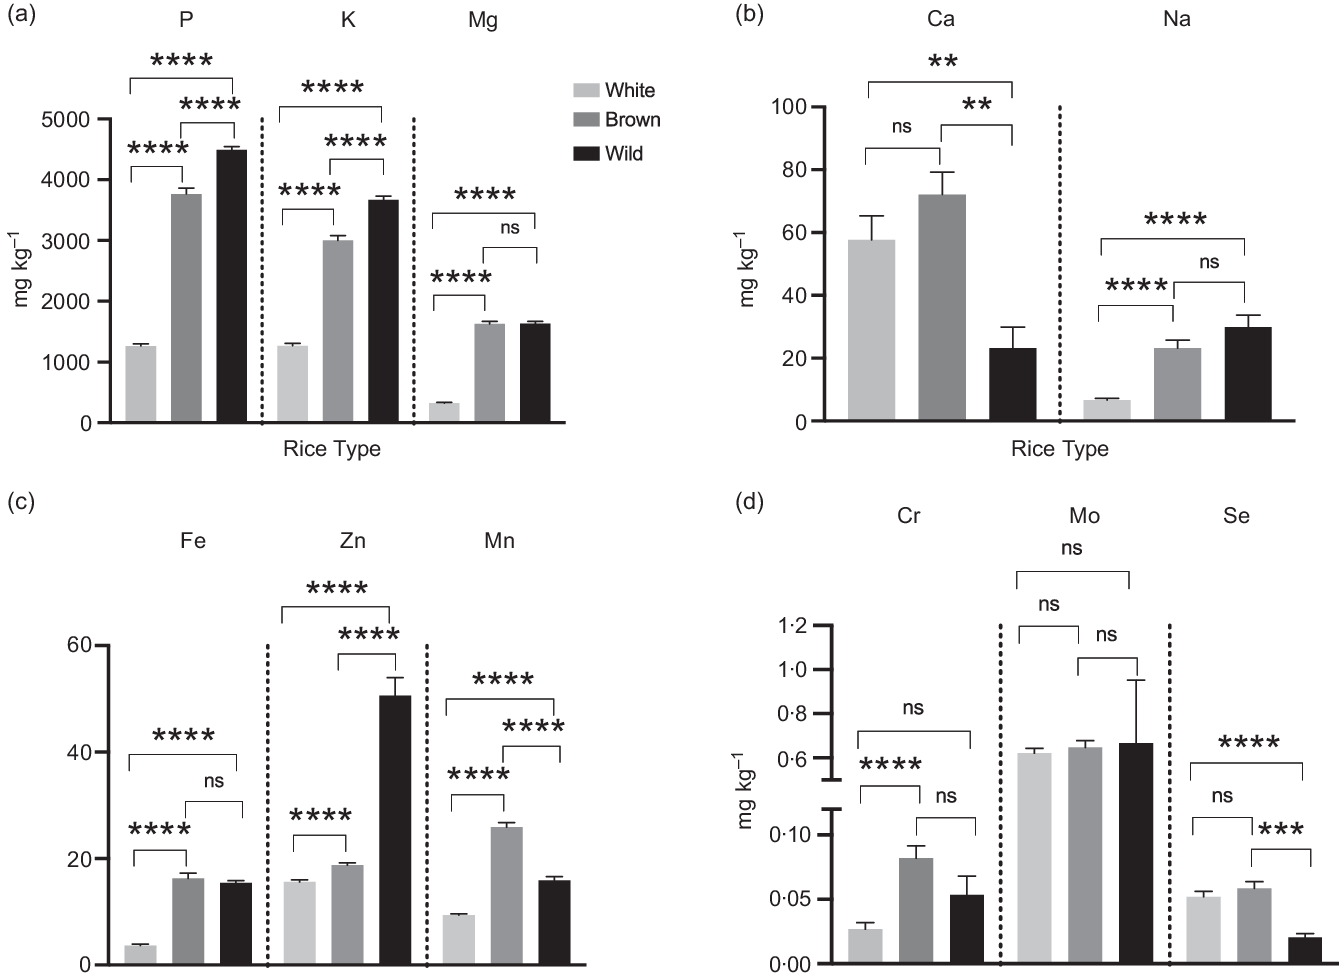
Fe concentrations were significantly influenced by rice type (P < 0·0001), and the average Fe was 15·43 ± 1·79, 16·27 ± 6·38 and 3·67 ± 2·84 mg/kg in wild, brown and white rice, respectively. The difference between white and brown or wild was also statistically significant (Fig. 1(c)). Different rice types significantly influenced the Zn (Fig. 1(c)) content (P < 0·0001). The concentration of Zn was significantly higher in brown rice (18·77 ± 2·94 mg/kg) than white rice (15·60 ± 4·16 mg/kg). However, Zn concentration in the wild rice (56·60 ± 14·57 mg/kg) was at least three times higher than the other two rice types, and the difference was statistically significant.
Mn (Fig. 1(c)) concentrations suggested a statistically significant difference between rice types, with the highest in brown rice followed by wild and white rice. A similar trend was observed for Cr, except that the only difference between white and brown rice was statistically significant (Fig. 1(d)). The average Mo (Fig. 1(d)) concentrations in different rice types were very similar (about 0·6 mg/kg); the differences between rice types (white v. wild and brown v. wild) were not found to be significant. Note that the Se for wild rice was much higher than the other two rice types (see online Supplementary Table 3), which is likely due to the difference in origin or environment in which it was produced. Se concentration in white and brown rice was significantly higher than wild rice (Fig. 1(d)). Please note that Cu was not detected in 98 % of samples except a few wild rice samples, hence not presented here.
Dietary contributions from rice
Measured NE concentrations of white, brown and wild were used to calculate DRV contributions (%) as shown in Table 1, based on a typical UK rice portion for adults and children using 75 and 50 g of raw rice, respectively. Since the DRV contributions of Ca, Mn and Na from rice were negligible (< 2 % of the DRV), they were not presented.
Mineral nutrient contribution (%) from a portion of various rice types (adults: 75 g and children: 50 g). Dietary reference values (DRV) were calculated based on adequate intake or population reference intake or safe/adequate intake as described in section 2.3
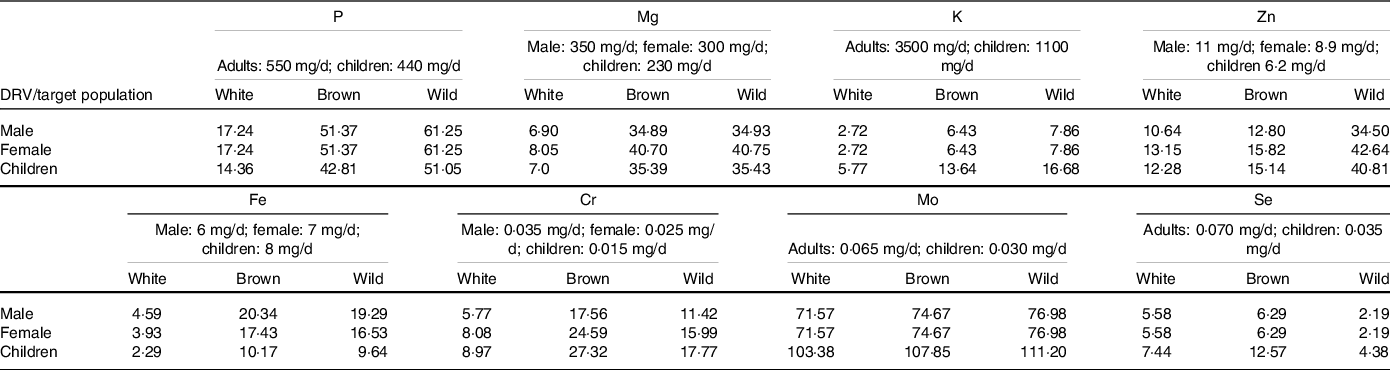
Consumption of one portion of rice can contribute 51 % and 61 % of daily P requirements for adults for brown and wild rice, respectively, and 43 % and 51 % of the P requirements for children. On the other hand, white rice contributes 17 % of P requirements in adults and 14 % for children. Similarly, standard portions of brown or wild rice meet more than one-third (35–41 %) of the daily Mg requirements for adults and children (35 %). A similar portion of white rice could contribute to only 7–8 % of adults and 7 % of children Mg requirement. For K, white and brown and wild rice contributed 3, 6 and 8 % of the adult DRV. In contrast, this was 6, 14 and 17 % for DRV of children.
Amongst micro NE, a portion of white, brown and wild rice contributes 11–13, 13–16 and 35–43 % of the adult Zn requirements. For children, this was 12, 15 and 41 % for white, brown and wild rice, respectively. In the case of Fe, white rice contributes 2–5 % of the DRV for children and adults, whereas the same portion of brown and wild rice can provide at least four times Fe towards DRV than white rice.
Based on recommended Cr intake rates for adult males (0·035 mg/kg) and females (0·025 mg/kg), it can be seen that white, brown and wild rice contribute 6–8, 17–25 and 12–16 %, respectively, of the recommended intake. However, for children aged 4–8 years, recommended intake is 0·015 mg/kg(Reference White and Broadley27,43) , and we found that the Cr contribution from brown rice was the highest amongst all (24 %) rice types, followed by wild (18 %) and white rice (9 %).
Amongst all NE, Mo contribution was the highest from rice types. It was found that 70–100 % of DRV for adults and children. For Se, the contribution of brown and white rice (6 %) was higher than the wild rice (2 %) towards the adult DRV, whereas, for children, brown (15 %) > white (7 %) > wild rice (4 %).
Optimising for nutrient element density
Ranking rice types across eight nutrient element
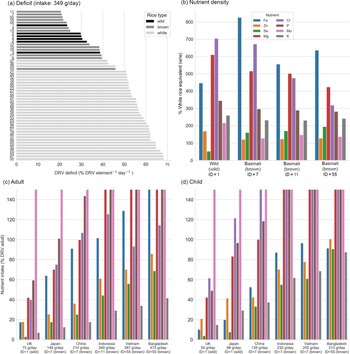
The rice samples were ranked by MDD in an optimisation scenario for eight key NE (P, K, Mg, Fe, Zn, Cr, Mo and Se). The MDD for an exemplar intake scenario (Indonesia, 349 g/d) are presented with the different types ranked from the smallest deficit (highest rank) to the most significant deficit (lowest rank) indicating that rice could contribute between 21 % and 68 % of the target NE intakes depending on the choice of rice type (Fig. 2(a)). Across the six different intake scenarios, the high-ranking rice types for adults were wild rice at the lowest intake (intake of 75 g/d; Identifier (ID) 1) and brown Basmati at moderate to high intakes (intake of ≥ 148 g/d, ID 7, 11 and 55). Note that rice ID are provided in Supplementary Table 1. For children, wild rice was ranked as highest in the two lowest intakes (intakes of 50 and 97 g/d, ID 1), however, brown rice ranked highest for moderate to high intake (> 98 g/d, ID 7, 11 and 55).
(a–d) Dietary intake of essential NE from rice for P, K, Mg, Fe, Zn, Cr, Mo and Se. (a) Mean daily deficit (MDD) for every rice sample, ranked for the Indonesian intake scenario (349 g/d). Rice type is indicated by bar colour. For plots b–d, bar colour indicates nutrient. (b) Percentage nutrient density for the high-ranked samples (sample ID 1, 7, 11 and 55) relative to the mean nutrient density of all white rice samples. (c) Adult nutrient intake per day for the high-ranking rice sample for each scenario. (d) Child nutrient intake per day for the high-ranking rice sample for each scenario. Note that subplots C and D are truncated at 150 % DRV for legibility. DRV, dietary reference value.
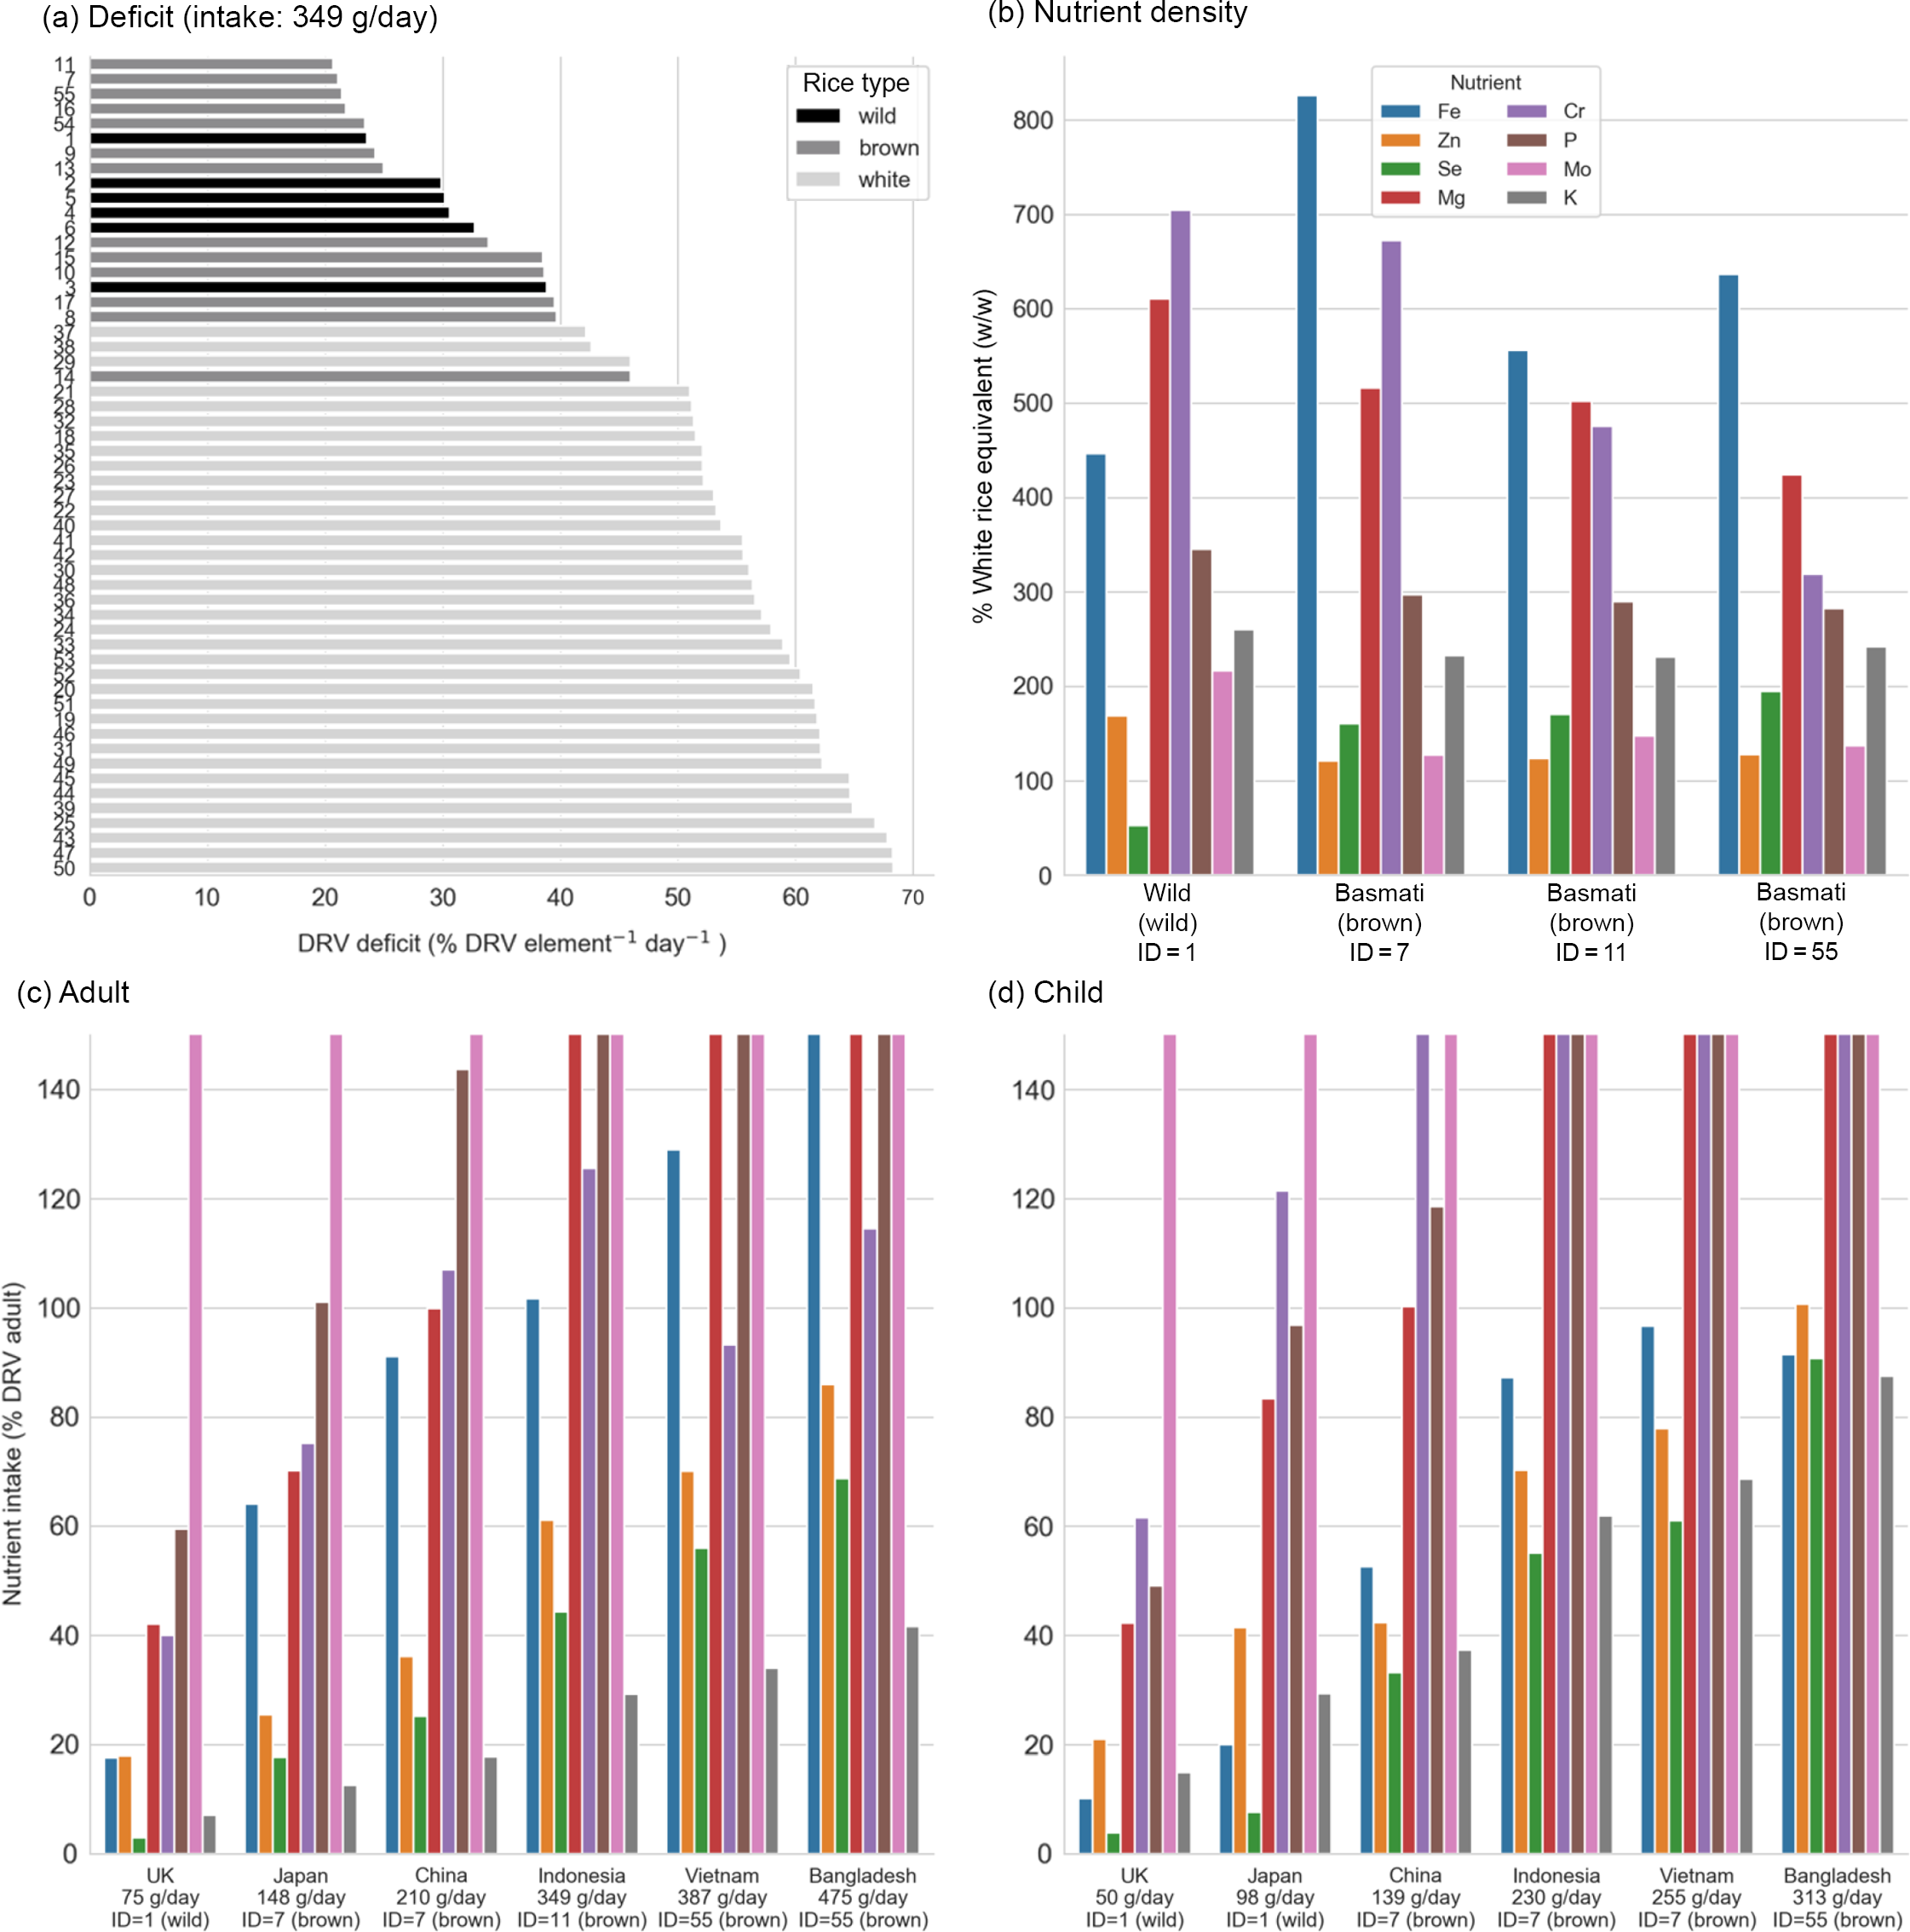
For the UK intake scenario (75 g for adults and 50 g for children), wild rice (ID 1) could provide a mean of 36 % (38 % child) DRV per nutrient (across all eight NE), compared with only 22 % (24 % child) provided by the highest-ranked white rice (Fig. 2(c) and 2(d)). In the high intake scenario of Bangladesh (475 g for adults and 313 g for children), brown rice could provide 87 % (96 % child) DRV per nutrient compared with 68 % (73 % child) by the highest-ranked white rice. In the example (moderate) scenario (349 g/d), the high-ranking white rice were medium grain arborio (ID 37), short-grain pudding rice (ID 38) and long-grain basmati (ID 29; Fig. 2(a)).
Comparison of rice types
The four NE-dense rice samples (ID 1, 7, 11 and 55) compared with the mean of all white rice samples in the study (Fig. 2(b)). Except for Se in the wild rice sample (ID 1), all of the high-ranking rice exceeded the equivalent daily intake from white rice by a factor of 1·1 to 8·2. The biggest gains were in Fe, Mg and Cr (> 3 times mean white rice), with moderate gains in K and P (> 2 times mean white rice). Although gains in Mo were small, the intake from even the smallest daily intake would far exceed the DRV, so an increase is not practically significant (Fig. 2(c) and (d)). The highest-ranked wild rice had 1·7 times the Zn of the white rice mean, whereas the highest-ranked brown rice was comparable to white rice (1·1–1·2 times). The same wild rice sample contained less than half the Se of mean white rice, compared with 1·5 to 2·0 times the white rice mean observed in brown rice (Fig. 2(b)). As such, switching to wild rice may be inappropriate for addressing Se deficiency.
Brown rice can deliver essential micronutrients in both adult and child diets (Fig. 2(c) and (d)). At higher intakes (> 349 g/d), adults achieve 100 % or more of the DRV for Fe, Mg, P and Mo, and at 387 g/d and above, the DRV for Cr is also met. Between 10 % and 40 % of adult, DRV for K (dependent on intake) would be met by brown rice types by providing about 2·5 times more K than the white rice. For child rice intakes, 100 % or more DRV for Mg, Cr, P and Mo could be met at moderate intakes (> 139 g/d) with the same samples (ID 7 and 55) as the adults. However, even at higher intakes, DRV would still not be met for Fe, Se, K (Fig. 2(d)) for all scenarios and only in the highest intake scenario (313 g/d) would the DRV for Zn be achieved.
Ranking rice for iron/zinc
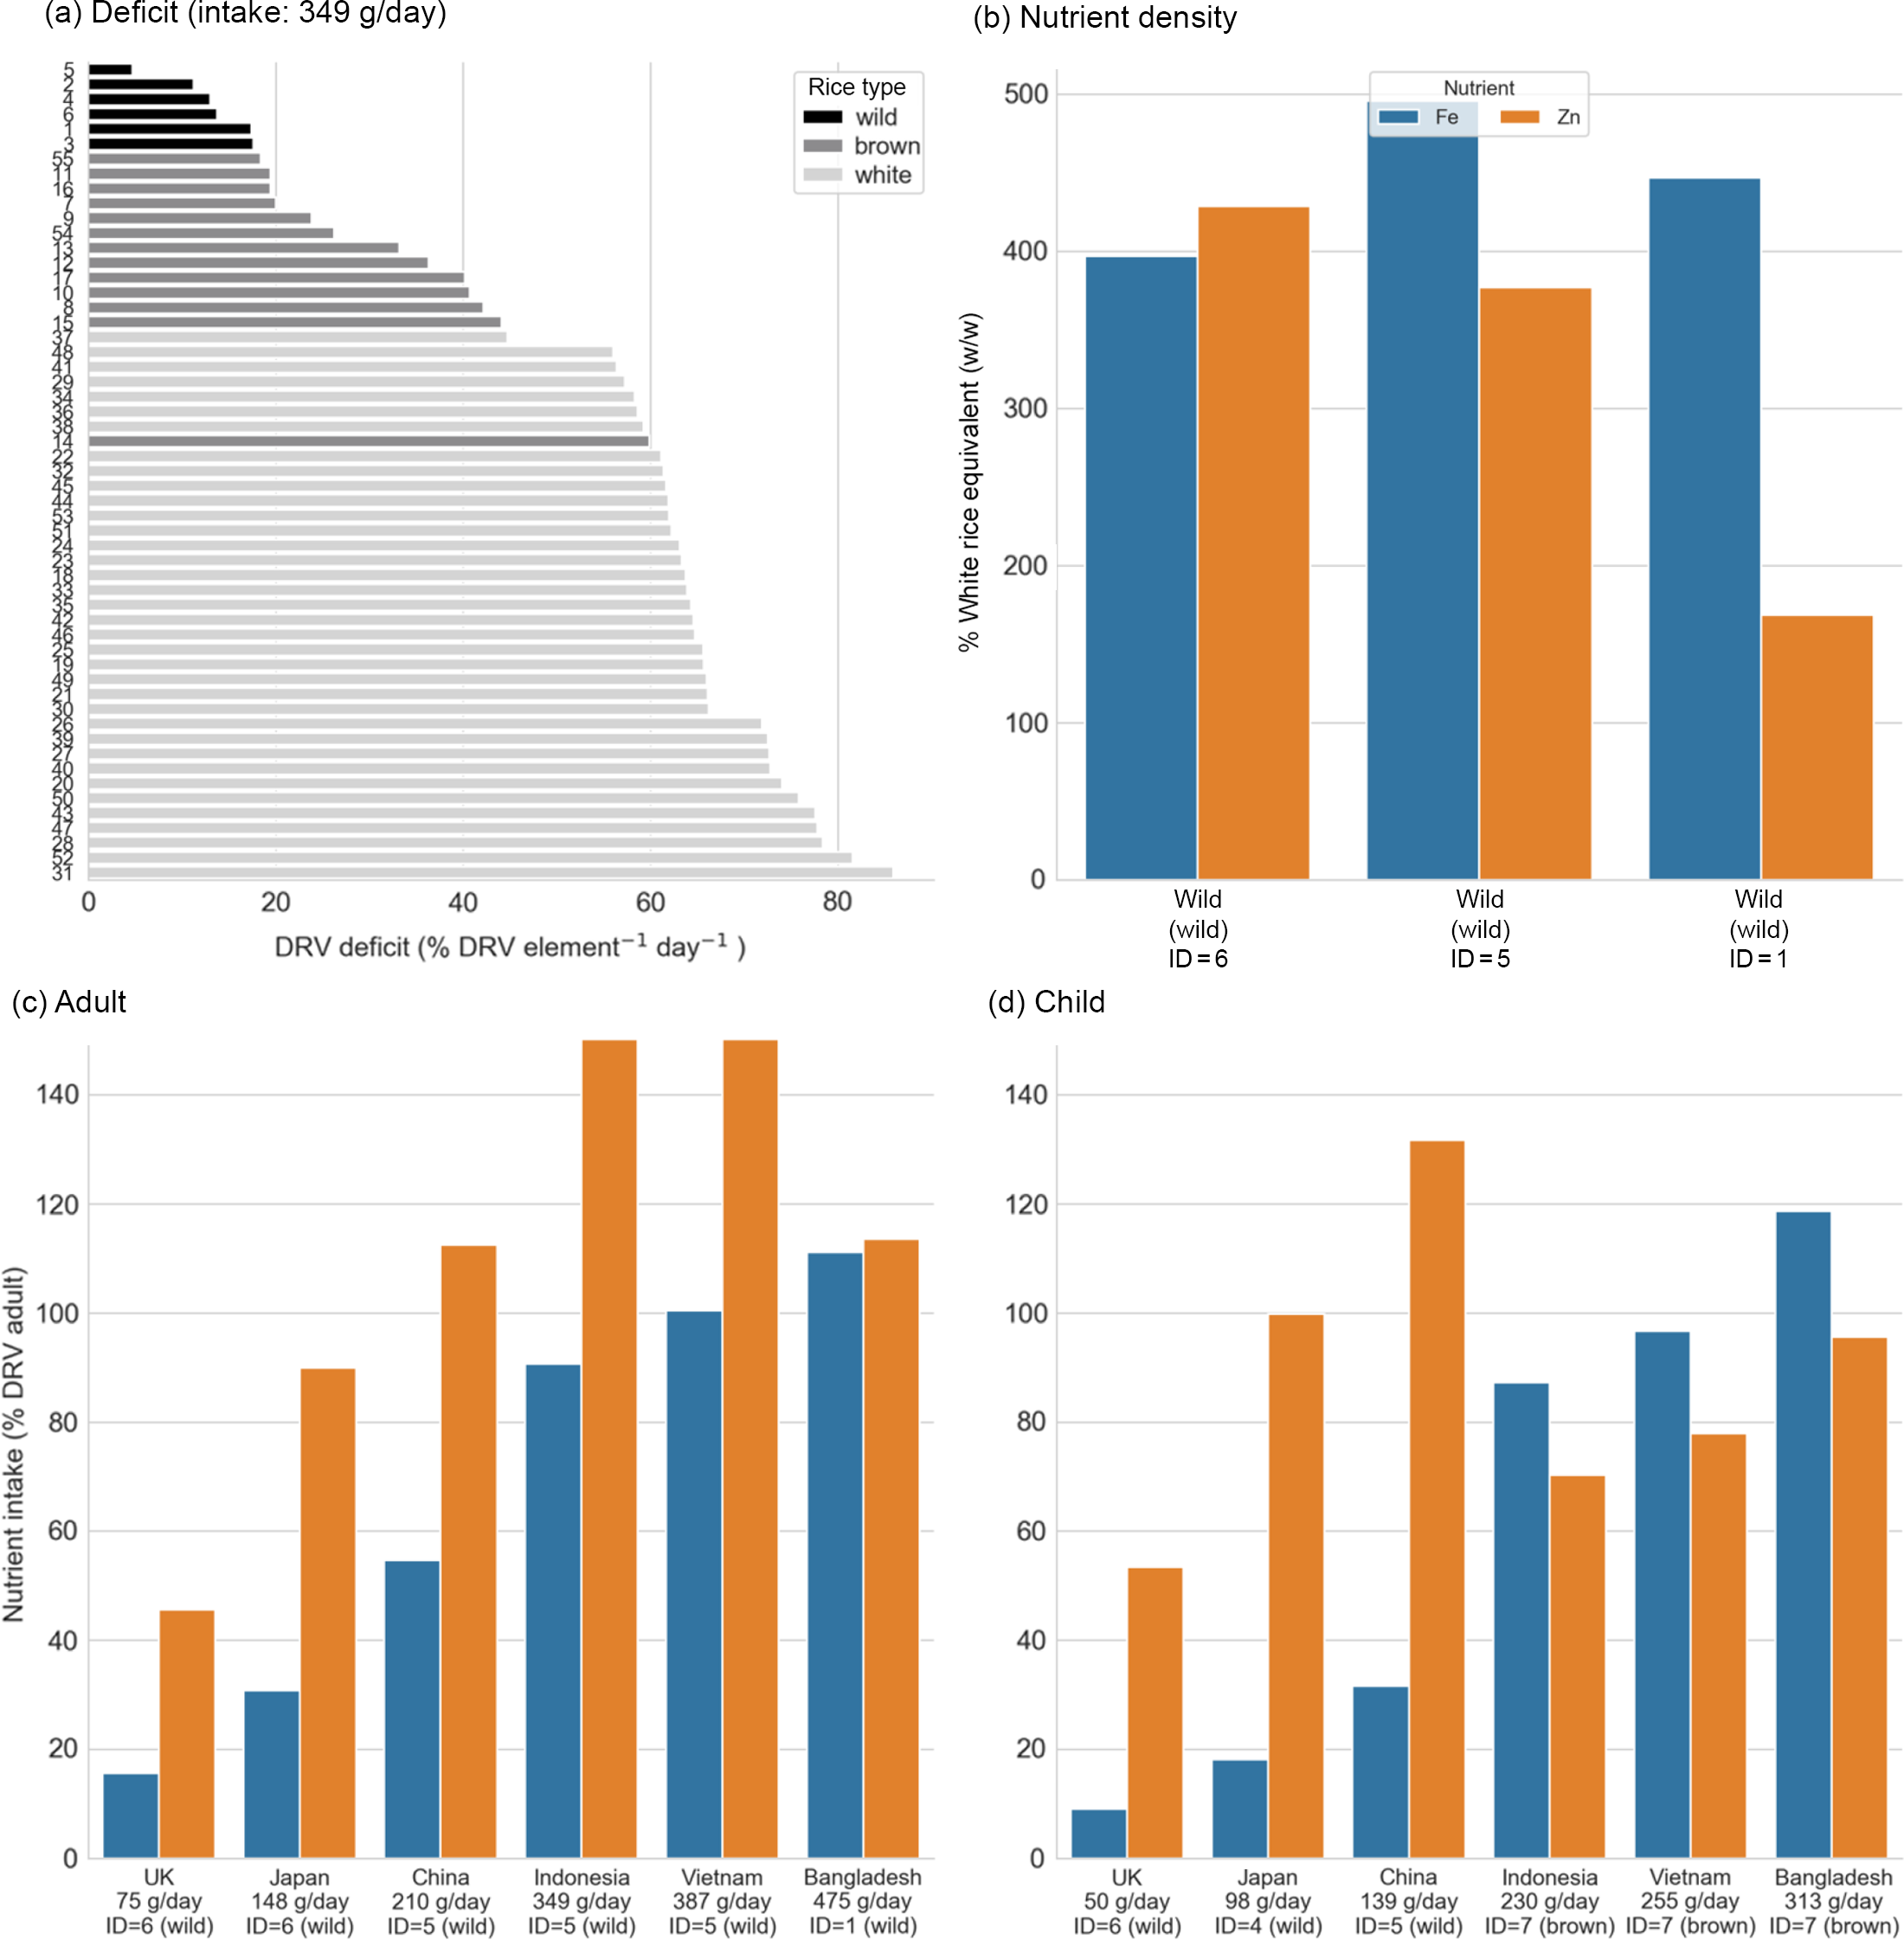
The same analysis was performed as above but only optimising for Fe/Zn. This identified wild rice as the high-ranking candidates for most intake scenarios, with the top six samples all wild rice for the Indonesian intake scenario (Fig. 3(a)). Replacement of white rice with the optimal rice type could increase dietary Fe by 5–8 times and Zn by 1·1–5 times the levels attainable from the mean white rice in the study (Fig. 3(b)). For adults, all wild rice varieties (ID 1 and 5) were a better choice than brown and white rice for the Indonesian intake scenario (349 g/d, Fig. 3(a) and 3(c)); however, for children in higher intake categories, brown basmati rice performed better overall (Fig. 3(d)). In the two highest intake scenarios, at least 100 % of both Fe and Zn adult DRV was achieved by rice alone (Fig. 3(c)); however, 100 % DRV intake of Fe for children was only achieved in the Bangladesh scenario (313 g/d) and 100 % DRV Zn would not be achieved (Fig. 3(d)).
Dietary intake of micronutrients from rice for Zn and Fe. (a) Mean daily deficit (MDD) for every rice sample, ranked for the Indonesian intake scenario for the Indonesian intake scenario (349 g/d). Rice type is indicated by bar colour. For plots b–d, bar colour indicates nutrient. (b) Percentage nutrient density for the high-ranking samples (sample ID 1, 5 and 6) relative to the mean nutrient density of all white rice samples. (c) Adult nutrient intake per day for the high-ranking rice sample for each scenario. (d) Child nutrient intake per day for the high-ranking rice sample for each scenario. Note that subplots c and d are truncated at 150 % DRV for legibility. DRV, dietary reference value.
Margin of exposure from inorganic arsenic
In Table 2, we used three different BMDL values to derive MOE (1–3) using the average iAs concentrations reported by the authors for white, brown and wild rice (0·11 ± 0·04, 0·17 ± 0·06 and 0·15 ± 0·04 mg/kg, respectively). Two consumption scenarios representing the daily serving of the UK size portions (adult and child) and highest per capita rice-consuming country in the world, Bangladesh, are also presented (please note the differences in ADC and bw in two scenarios presented in Table 2). In contrast to the UK population, MOE are an order of magnitude lower Bangladesh for all rice types. It was found that MOE-2 and 3 were > 1 for adults and children in both countries for all rice types. However, in the most conservative scenario (MOE-1)(Reference Menon, Sarkar and Young24,Reference Guillod-Magnin, Brüschweiler and Aubert44,Reference Rintala, Ekholm and Koivisto45) , the risk is confined to children in the UK if they consume brown or wild rice daily, whereas both adults and children are at risk in Bangladesh, regardless of rice types. If we consider MOE-2 or 3 as a standard, switching to brown or wild rice from white rice is feasible in both scenarios. In the last three columns of Table 2, we presented ADCmax (1–3) using three BMDL values; however, it was constrained with a target MOE = 10. Thus, under the BMDL value of 0·0003 mg/kg bw per d (i.e. ADCmax-1), the maximum consumption of rice is an order of magnitude lower than the other two scenarios (i.e. ADCmax-2 & 3) in both countries. ADCmax-2 shows that the UK adults could consume all type of rice more than the standard portion size and, whereas ADCmax-2 of brown and wild rice for children is very close to the standard portion size. However, for the Bangladesh scenario, a substantial reduction in rice intake is required to raise the MOE to 10, based on ADCmax-2 and 3 scenarios.
Margin of exposure (MOE) using different rice consumption scenarios 1 and 2 representing the UK and Bangladesh, respectively
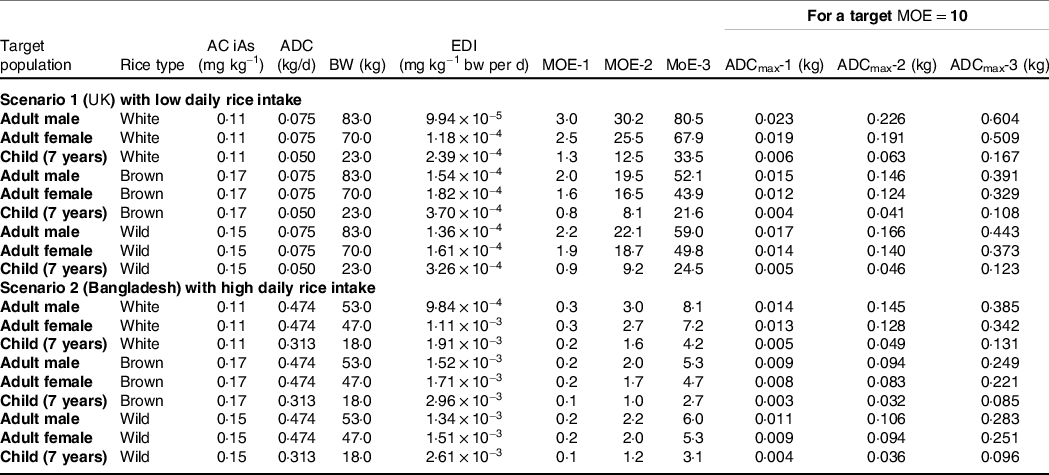
AC, average concentration of iAs; ADC, average daily consumption of rice; bw, body weight; EDI, estimated daily intake.
MOE-1, BMDL0·1 (0·0003 mg/kg bw per d); MOE-2, BMDL0·5 (0·003 mg/kg bw per d) and MOE-3, BMDL0·1 (0·008 mg/kg bw per d). ADCmax (1–3) represent maximum daily consumption of rice to keep MOE of 10 under different BMDL scenarios (0·0003, 0·003 and 0·008 mg/kg bw per d)
Discussion
Nutrient element concentrations in rice and dietary contributions
The overarching aim of this study was to analyse the nutrient benefits and risks from iAs from different rice types marketed in the UK. Please refer to Supp to compare the NE data from this and previous publications and the UK database (McCance and Widdowson’s Composition of Foods Integrated Dataset (CoFID))(46) (Supplementary Table 4). Pinto et al. compared 86 samples comprising of white (n 56), brown (n 13) and wild rice (n 6) sold in Portuguese and Spanish markets(Reference Pinto, Almeida and Ferreira3) and reported higher nutrient concentrations in brown and wild rice than the white; however, the concentrations of many nutrients were lower than in this study. They found that the concentrations of P, K, Mg, Mn and Fe were significantly higher than the other types of rice. In contrast, we found concentrations of the above nutrients (except Fe) were statistically similar in brown and wild rice. However, similar to our findings, Pinto et al. also found that Zn concentrations in wild rice were significantly higher in Zn than the other types(Reference Pinto, Almeida and Ferreira3). Based on the per capita consumption rate of 35·5 g/d, they reported that rice can be an important dietary source of P, Zn, Mn, Cu, Mo and Se by contributing > 5 % of the US-RDA and rice does not contribute significantly towards daily Na, Ca and Fe. Our findings are mostly in agreement with Pinto et al. except for Fe, where we found both brown and wild rice can contribute considerably more than towards the DRV for both adults and children than has been previously reported. The contributions of NE were higher in our study because of the difference in portion size used in the calculation. The recommended intake values (RDA, RNI, DRV, etc.) could also contribute to the differences.
The reported NE concentration ranges for wild rice were (mg kg−1) Ca: 110–250, P: 2360–5000, Na: 13·4–60, K: 550–5600, Cr: 0·9–1·4, Zn: 12–120, Fe: 12–51, Mg: 800–1610 and Mn: 9·3–18(Reference Surendiran, Alsaif and Kapourchali5). Our data fit well within these ranges except for Ca, which was found to be an order of magnitude smaller than the above values.
A study comparing white and brown(Reference Antoine, Fung and Grant47) rice types from Jamaica found that brown rice was higher in P, K, Na, K, Mg, Mn, Zn, Cr and Se compared with the white rice types. They also found that Ca and Fe concentrations in white rice were higher than in brown rice, which was not in agreement with our findings. Based on Jamaican per capita consumption (71·2 g/d), Antoine et al. (Reference Antoine, Fung and Grant47) found that both white and brown rice contribute at least 10 % towards US-RDA (male or female) for P, Mg, Fe, Zn and Mo. However, the contribution of these minerals from brown rice was higher than the white rice, aligned with our findings.
The concentration profiles of NE (K, Mg, Na, Ca, Mn, Zn, Fe, Mo and Cr) were similar to a study conducted in Brazil(Reference Runge, Heringer and Ribeiro48). Similar to this study, they also found that the brown rice Ca, K, Mg, Mn, Zn, Fe and Se contents were significantly higher than the white rice samples. The authors compared brown, parboiled and white rice samples collected from different processing stages in this investigation. The only exception was Se which was nearly double the concentrations found in our study. They also found no significant difference in Na and Cr concentrations between white and brown rice, which differed from our findings.
We compared NE reported for white, brown and wild rice using McCance and Widdowson’s (UK) CoFID database (online Supplementary Table 4). It was found that the concentrations of these nutrients were consistently lower than those found in this and previous studies. We suspect that improvements in the analysis have occurred and so the more recent values should be favoured over those presented by McCance and Widdowson.
From this and previous studies, it can be seen that brown and wild rice were reservoirs of several important NE. Although our data mostly agree with similar previous studies, some deviations are expected, caused by factors such as soil type, water and nutrient management, and cultivar differences. The degree of polishing has also been shown to impact the NE concentrations in white rice(Reference Chen, Siebenmorgen and Griffin7,Reference Lamberts, De Bie and Vandeputte8) .
From the perspective of iAs concentration, our MOE assessments showed that other rice types are relatively less risky in the UK as rice imported and marketed has to comply with the European Commission’s regulations on iAs limits in rice, whereas iAs in rice is not regulated in many Asian countries where it is the staple. When rice is a substantial part of the diet, such as in Bangladesh, rice becomes a significant source of arsenic exposure. Our analysis showed that MOE could not be elevated > 10 in both MOE-2 and 3 scenarios in Bangladesh. In contrast, it could reach as high as 80 in the UK (e.g. MOE-3 for an adult male, see Table 2). This analysis suggested that the exposure is driven mainly by the amount of daily rice consumed and population characteristics (e.g. body weight) and less on rice types used (i.e. switching from white to brown or wild rice results in a very marginal decrease in MOE, as shown Table 2). Therefore, to achieve a MOE of 10, the population would need to substantially reduce rice intake to reduce iAs exposure, which is probably unrealistic in a country where rice is a staple. Studies have shown that malnourished individuals are more vulnerable to arsenic toxicity(Reference Milton, Hasan and Shahidullah49). Therefore, the daily intake of rich brown or wild rice could be beneficial in countries where iAs exposure through the food chain is very high, provided iAs concentrations in rice is less than the recommended limits. Since rice types play a relatively marginal role in arsenic exposure, the provision of micronutrients through brown and wild rice is likely to outweigh the risks from iAs in this setting. Also, other sources of iAs (e.g. water) could be considered for a robust MOE estimate. It must be noted that iAs risks can be further reduced if we reduce the portion size or frequency of these rice types.
Opportunities and challenges
It is clear that switching to brown or wild rice will ensure higher dietary content of eight essential NE identified by this study as available at nutritionally relevant levels in rice. Current fortification efforts have been less effective in tackling these deficiencies. A recent systematic review by the WHO(50) of rice fortification programmes found minimal impacts on adults. For instance, fortification of rice with Fe (or in combination with other Zn, vitamin A or folic acid) made little or no difference to the risk of anaemia for the population. Notably, Fe compounds used in fortification cause an undesirable change in rice colour, rendering this a technique requiring further research. Similarly, biofortification is oriented towards nutrient-rich cultivars as a long-term sustainable solution(Reference Sperotto, Ricachenevsky and de Abreu Waldow51).
Both brown and wild rice are less prevalent in traditional diets than white rice despite their NE benefits. Low preference for brown rice(Reference Saleh, Wang and Wang4) could be due to the astringent taste, nutty flavour or chewy texture. Brown rice also requires more cooking time compared with white rice types, and its shelf life at ambient temperature is shorter than white rice due to the presence of oil in the bran, which becomes rancid in warmer climates. The shorter shelf life of grains may lead to food vulnerability and may increase food waste. Although brown rice may also take longer to cook, thus requiring more fuel in households, energy gains could be made in brown rice production as it does not require polishing. Additional efforts are required to develop healthy brown rice-based products with high edible and sensory qualities(Reference Saleh, Wang and Wang4), similar to whole wheat grain food products.
Wild rice production is mainly confined to the northern latitudes (mainly the USA and Canada), and it requires slow-moving fresh shallow water bodies to grow(Reference Surendiran, Alsaif and Kapourchali5). It is slowly gaining popularity in other parts of the world as expensive gourmet food. Efforts could be put in place to popularise wild rice in major rice-growing parts of Asia. For instance, Z. latifolia is an Asian wild rice variety and has a similar chemical composition as the western varieties such as Z. aquatica and Z. palustris (Reference Surendiran, Alsaif and Kapourchali5). However, wild rice yield is relatively low compared with rice (Oryza spp.), so this may not be economically viable. Some progress has been made into interspecific hybridisation between Zizania and Oryza(Reference Dong, Wang and Dong52).
We believe that stripping away naturally sequestered nutrients from rice through milling is not a good strategy in health, economic and environmental perspectives to tackle nutrient deficiencies of a growing population. Instead, more efforts are needed to incorporate readily available and affordable brown or rice products in diets. This could be the immediate priority alongside long-term strategies such as biofortification. Furthermore, if available and affordable, wild rice could offer a much broader range of nutritional benefits.
Both regulation and labelling will immensely help reduce iAs exposure through rice. When living in iAs in the environments, intake of iAs from all other sources (e.g. drinking water) must be evaluated to reduce the exposure. It is important to note that the current study evaluated the risks and benefits from uncooked (raw rice samples), the concentrations of NE and contaminants are likely to be affected by rice-cooking methods. Therefore, it may be necessary to consider cooking practices while evaluating the risks and benefits. Several cooking studies have demonstrated that cooking in excess water effectively reduces the iAs concentration in the cooked (drained) rice, although this method could result in loss of some water-soluble nutrients. On the other hand, the absorption method, where rice is simmered until the water is fully absorbed, NE and iAs are more likely to be retained as no water is discarded. In our recent study, Menon et al. (Reference Menon, Dong and Chen53) developed a new method in which a substantial amount (54 %) of iAs could be removed from brown rice while retaining most nutrients, including Zn. In this method, rice is parboiled for 5 min first, and then water is discarded before it is cooked again using freshwater using the absorption method. Further research is required in this direction to consider local preferences such as choice or availability of rice types and prevailing cooking methods, including nutrient interactions and bioavailability.
Conclusion
This study used laboratory-based NE concentrations of various rice types (white, brown and wild) and a novel optimisation method to assess the dietary contribution of these rice types using different rice consumption scenarios. We found that both brown and wild rice provided a suite of NE higher than white rice. Based on optimisation modelling, we found that wild and brown rice were top-ranked and exceeded the equivalent daily intake from white rice by a factor of 1·1 to 8·2, for eight selected NE, except Se. We found that wild rice was the best choice for consumers for most intake scenarios for meeting Fe and Zn requirements in adults, whereas brown basmati rice performed better overall, especially for children under in higher rice intake scenarios. The top-ranked white varieties for adult Zn and Fe intake were all arborio or pudding rice. Based on the MOE from iAs, we found that switching to brown and wild rice is possible provided iAs in rice does not exceed the regulatory limits. However, this requires appropriate regional/national regulations on iAs in marketed rice, including product labelling containing information on the safety for infants and children.
Acknowledgements
The authors also thank Dr Binoy Sarkar and Dr Joseph Hufton (University of Sheffield), as well as Dr Saul Vazquez Reina and Dr Scott Young (School of Biosciences, University of Nottingham). The authors are also grateful to Dr John McDonald (Department of Biological Sciences, University of Delaware) for providing advice on statistical analysis.
The project was funded by the Science and Technology Research Council (STFC) Food Network (Grant No: ST/P003079/1), UK (https://www.stfcfoodnetwork.org/).
Credit statement: MM: funding acquisition, conceptualisation, investigation, methodology, project administration, supervision and writing (original draft). AS: formal analysis, visualisation and writing (review and editing). JF: formal analysis, visualisation, software and writing (review and editing).
The authors declare that they have no known competing financial interests or personal relationships that could have appeared to influence the work reported in this paper.
Supplementary material
For supplementary material/s referred to in this article, please visit https://doi.org/10.1017/S0007114521004025