


Introduction
Integrated systems in SiGe technologies are reaching increasingly high operating frequencies. The large and continuous frequency ranges available in the WR 3.4 waveguide band, including the J-band, offer unique opportunities and challenges for wireless applications from sensing to communication [Reference Yi, Wang, Hu, Holloway, Khan, Ibrahim, Kim, Dogiamis, Perkins, Kaynak, Yazicigil, Chandrakasan and Han1, Reference Kissinger, Kahmen and Weigel2]. High resolution and high precision frequency-modulated continuous wave (FMCW) radar systems in the D-band and above have been shown to benefit greatly from these large available bandwidths. Examples from precise thickness measurements in rolling mills [Reference Gütgemann, Krebs, Küter, Nüßler, Fischer and Krauthäuser3, Reference Leuchs, Krebs, Gütgemann, Wickmann, Perske, Cetinkaya, Pohl, Fischer, Tolin, Campo, Bruni, Romstadt, Papurcu, Haschke and Huge4] and non-destructive testing of composite fiber materials [Reference Walther, Froehly, Herschel, van Delden, Wallrath and Musch5, Reference Hansen, Bredendiek, Briese, Froehly, Herschel and Pohl6] to high-resolution imaging [Reference Baumann, Gashi, Meier and Zech7, Reference Thomas, Froehly, Bredendiek, Herschel and Pohl8] and material characterization [Reference Abouzaid, Jaeschke, Barowski and Pohl9] demonstrate this clearly.
Short-range communication systems have shown a similar trend. The IEEE 802.15.3d family of standards allocates up to 69 GHz of continuous bandwidth from 252.72 to 321.84 GHz for (sub)THz communication [Reference Petrov, Kurner and Hosako10]. An 80 Gb/s link, using a 300 GHz transceiver in CMOS [Reference Lee, Hara, Yoshida, Amakawa, Dong, Kasamatsu, Sato and Fujishima11], and a 110 Gb/s link, using a 230 GHz transceiver in SiGe [Reference Rodriguez-Vazquez, Grzyb, Heinemann and Pfeiffer12], have shown that this bandwidth can be leveraged to achieve enormous data rates over short distances.
The co-integration of both sensing and communication functionality on one hardware platform has generated much interest [Reference De Lima, Belot, Berkvens, Bourdoux, Dardari, Guillaud, Isomursu, Lohan, Miao, Barreto, Aziz, Saloranta, Sanguanpuak, Sarieddeen, Seco-Granados, Suutala, Svensson, Valkama, Van Liempd and Wymeersch13, Reference vom Boegel, Sezgin, Pohl, Vossiek, Weimer, Wessel, Wietfeld, Thill, Braun, Haferkamp, Sivadevuni, Koegel, Haeger, Boecker and Geiss14]. Since the architectures of FMCW radar and communication transceivers are similar, reconfigurable front-ends can be developed that reuse a large part of their components [Reference Lu, Ma, Feng, He, Fan, Chen, Chen, Wang, Wang, Liu, Fan and Li15–Reference Lee, Kim, Lee, Cho, Choi, Lee, Koo and Song17].
This work is an extended version of our recently published conference paper [Reference Ziegler-Bellenberg, Funke, Bredendiek, Hansen, Wessel and Pohl18], where we presented a transceiver based on a custom-developed SiGe MMIC that integrates both radar and communication functionalities. We have shown radar measurements with an FMCW chirp from 330 to 240 GHz, that achieve a spatial resolution of 3.9 mm with a target at a distance of 0.5 m. Additionally, a two-stage up-conversion mixer in the transmit path was presented, which allows the system to be configured either as a standalone radar system or as a flexible RF front-end, which can up-convert and down-convert arbitrary external signals. The system uses on-chip antennas, eliminating the need for costly RF interfaces.
This paper expands on the radar capabilities of this system in unlocking its full bandwidth potential. With the use of a calibration method, the spatial resolution is improved significantly and the potential industrial use of this resolution is demonstrated in a plastic thickness measurement scenario. In addition to this, the transmit path is characterized extensively for radar operation and as an up-converting front-end. The design methodologies used to extend the usually narrow bandwidth of systems relying on on-chip patch antennas are expanded upon. Finally initial communication measurements that use this system as an RF front-end in conjunction with laboratory equipment are shown.
The paper is organized as follows: Section 2 describes the design and realization of the proposed transceiver and system with a focus on the custom-developed MMIC. Section 3 presents results characterizing the system and is followed by Section 4, where calibrated and uncalibrated distance measurements are shown and discussed. Communication measurements are presented in Section 5. A comparison with the state of the art for integrated radar sensors and transceivers is made in Section 6.
System concept and realization
Figure 1 shows the compact transceiver system. Its electronic components are housed on a stack three low cost FR4 printed circuit boards (PCB), which are connected by pin headers. The custom-developed transceiver MMIC is glued and wire-bonded directly to top side of the topmost PCB in the stack, the front-end PCB. This board includes a phase locked loop (PLL) for frequency stabilization of the voltage controlled oscillator (VCO) on the MMIC and FMCW ramp generation, as well as sockets for the external IF signals coming from or going to the MMIC. For FMCW radar operation the IF signal coming from the MMIC can also be processed internally by the sensor. To that end the front-end PCB houses an IF pre-amplification stage. Its output is routed to the other PCBs in the stack. The middle PCB serves as a breakout board and as an adapter to the bottommost PCB, the back-end. This back-end module is an advanced revision on the module presented in [Reference Jaeschke, Bredendiek, Küppers and Pohl19]. On this module the IF signal for radar operation is sampled using an analog-to-digital converter (ADC) after being sent through a second amplification stage and an anti-aliasing filter. A micro-controller is used to configure the ADC and the PLL on the front-end. It is also used to transmit the sampled data from the ADC to a PC via a USB connection for signal processing. The back-end also includes the power supply for all components of the system powered by the same USB connection. Finally the reference quartz oscillator for the PLL is placed on the back-end PCB.
Photographs of the 300-GHz transceiver. (a) Assembled transceiver with PTFE lens. (b) Disassembled PCBs used in the transceiver. (c) Top side of the transceiver with visible MMIC.

Mechanically the stack of three PCBs is mounted inside of a 3D-printed casing. An elliptical PTFE (polytetrafluoroethylene) lens is mounted over the MMIC to focus the radiated signal of the integrated on-chip antennas. The use of on-chip antennas eliminates the need for costly high frequency interfaces, by handling all signals with frequencies above 10.5 GHz on the chip. This way, an easy integration using only commercial of the shelf (COTS) components and low cost FR4 PCBs in conjunction with the custom MMIC is possible. The MMIC consumes 700 mW of DC power from a 3.3 V power supply, while the entire system consumes 3.13 W from a the 5 V USB power supply. This results in a very compact system with approximate dimensions of  $70\,\rm{mm} \times 60\,\rm{mm} \times 45\,\rm{mm}$ including the lens, that can be operated as a standalone radar system with only one USB connection to a PC.
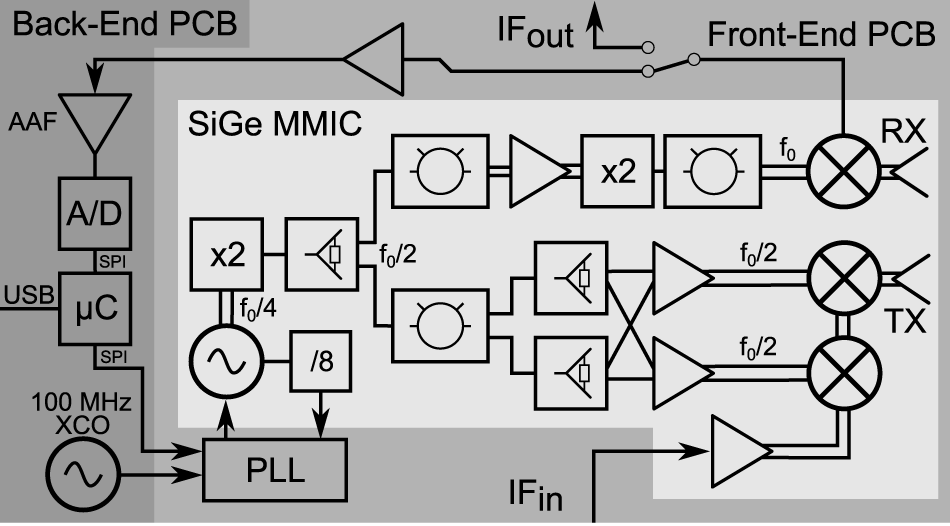
The presented system is made up of three main building blocks spread over the MMIC and the PCBs. These blocks will be discussed in detail in the following subsections. The first building block is the ultra wide-band LO generation in the D-band. This D-band LO is used in the second and third building blocks, the receive path (RX) and the transmit path (TX). Figure 2 shows the block diagram of the whole system. Wether a component is integrated on the MMIC, the front-end PCB or the back-end PCB, is shown by the gray-scale background.
Block diagram of the proposed 300-GHz transceiver. Differential signals are drawn as two parallel lines.

Figure 3 shows a micrograph of the SiGe transceiver MMIC. The chip has a size of 2.7 mm by 1.3 mm. Components on the chip belonging to one of the building blocks are marked as such. The differential on-chip patch antennas are clearly visible on the leftmost side of the micrograph. This MMIC is fabricated using the SiGe BiCMOS technology B12HFC by Infineon Technologys AG. This process features high-speed hetero-junction bipolar transistors with a  $f_{\rm{T}}$ of 300 GHz and $f_{\rm{max}}$ of 520 GHz in addition to a 90 nm CMOS node. The metal stack consists of eight layers. The topmost aluminum layer is used for pads and for the on-chip antennas, two thick metal layers are used for transmission lines and passive components, one intermediate layer is used as the ground reference for the transmission lines and four thin metal layers are used for routing.
Micrograph of the transceiver MMIC.

2.1. LO generation
The core of the LO generation block is an ultra-wide-band VCO with a center frequency of 75 GHz. Its output is fed into a push-push frequency doubler to generate the D-band LO signal required for receive and transmit paths. The oscillators output is also fed into a static divide-by-eight chain to provide a signal for frequency stabilization. These three components integrated on the MMIC are largely derived from components developed in Infineon’s preceding technology B11HFC. [Reference Hansen, Bredendiek, Briese, Froehly, Herschel and Pohl6] describes the design and configuration of these preceding components most closely. The VCO and divider chain were first reported in [Reference Bredendiek, Aufinger and Pohl20], whereas the used Collpits-Clapp topology was first discussed in [Reference Pohl, Rein, Musch, Aufinger and Hausner21]. By carefully co-designing the VCO and the frequency doubler, a signal generation block tunable from 121.6 to 178.0 GHz was realized in [Reference Hansen, Bredendiek, Briese, Froehly, Herschel and Pohl6]. This corresponds to a relative tuning range (rFTR) of 37.7%. The minimum phase noise at an offset frequency of 1 MHz was observed to be −94 dBc/Hz.
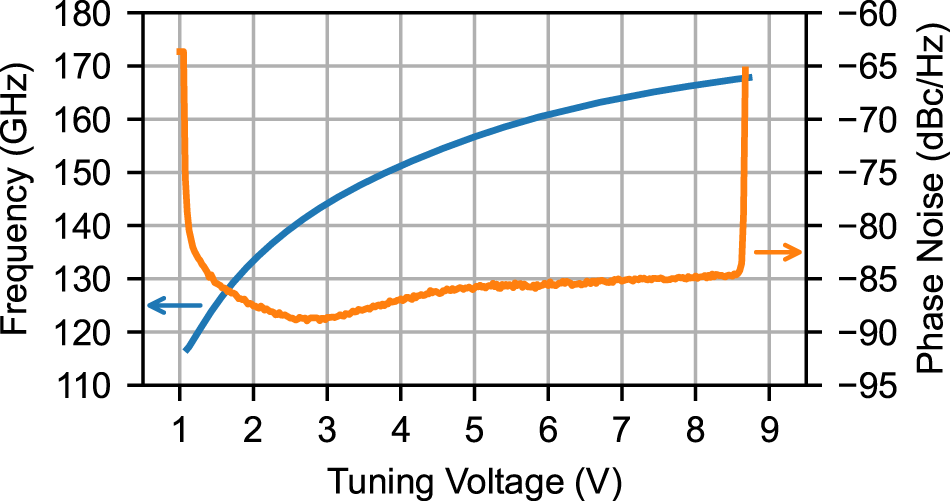
The conversion of the signal generation block from B11HFC to B12HFC, while being very similar technologies, still required an extensive redesign. To validate its performance the VCO, doubler and divider chain was manufactured as a breakout circuit. Figure 4 shows the measured output frequency of the doubler, as a function of VCO tuning voltage, as well as the phase noise at the same output with an offset frequency of 1 MHz. The signal generation block used in this work is tunable from 116.8 to 167.8 GHz, which corresponds to a rFTR of 35.8%. The phase noise is −89 dBc/Hz at its lowest point increasing by 4 dB toward the band edges. The slightly worse and shifted tuning range and the increased phase noise show that this LO generation block is less optimized than its version in the previous technology. Having access to higher speed transistors should ideally reduce the noise figure. While there is no improvement gained from the technology shift in the LO generation block, the higher  $f_{\rm{T}}$ transistors are indispensable to achieve sufficient performance in the highest frequency components in the transmit path and the receive path.
Measured tuning curve and phase noise at 1 MHz offset of the D-band LO generation breakout circuit, including the E-band VCO and the frequency doubler.

In order to operate in the J-band, the common D-band LO undergoes another frequency doubling in the receive path or the transmit path. Therefore the transmit signal used for radar operation can be tuned from 233.6 to 335.6 GHz. While the relative tuning range does not change, the phase noise is expected to increase by 6 dB due to the frequency doubling.
The PLL integrated on the front-end PCB to stabilize the VCOs frequency and to generate FMCW ramps is build up around the ADF4169 fractional-N frequency synthesizer. It uses the MMICs divider chain output and a 100 MHz reference signal generated by the CVSS-945 ultra-low noise crystal oscillator placed on the back-end PCB as inputs. Its output, filtered by a forth order active loop filter using a LT6202 operational amplifier, is used to regulate the VCOs tuning voltage.
This phase locked loop is stable for J-band output frequencies between 238 and 331 GHz, a range lower than the maximum possible tuning range. All radar measurements are done using down chirps from 330 to 240 GHz to ensure reliable locking. This results in the reported tuning range of 90 GHz around a center frequency of 285 GHz.
Receive path
The receive path is made up of components placed on the MMIC as well as components integrated on the front-end and back-end PCBs. To down-convert the received signal from the J-band to the kHz-range for FMCW radar operation or several GHz, if the resulting IF signal is processed externally, a Gilbert-Cell based mixer is integrated on the MMIC. To enable the mixer to drive low ohmic loads, if an external IF is connected, as well as the high ohmic input of the IF amplifier on the front-end PCB, two common collector circuits are integrated at the differential IF outputs of the Gilbert cell. The radio frequency input of this mixer, the bases of the differential pair in Gilbert cell, is connected to one of the differential on-chip patch antennas using a transmission line for matching. These antennas will be discussed in more detail in Section 2.4. To generate the required LO signal for the mixer the common D-band LO signal coming from the LO generation building block needs to be doubled in frequency. This doubling is done using a push-push frequency doubler. It is similar in topology to the doubler used in the LO generation. Since push push frequency doublers require a differential input signal and generate a single ended output signal, two transmission line based rat-race couplers needed to be designed. One coupler operating in the J-band, to accommodate the differential LO input of the Gilbert cell mixer, and one operating in the D-band, to generate a differential signal from the single ended output of the LO generation building block. To maximize the output signal strength of the doubler, an inter-stage amplifier was placed between the D-band rat-race coupler and the frequency doubler. This amplifier, consisting of a differential pair with a cascode stage, biased by a current mirror, ensures that the frequency doublers LO input is saturated.
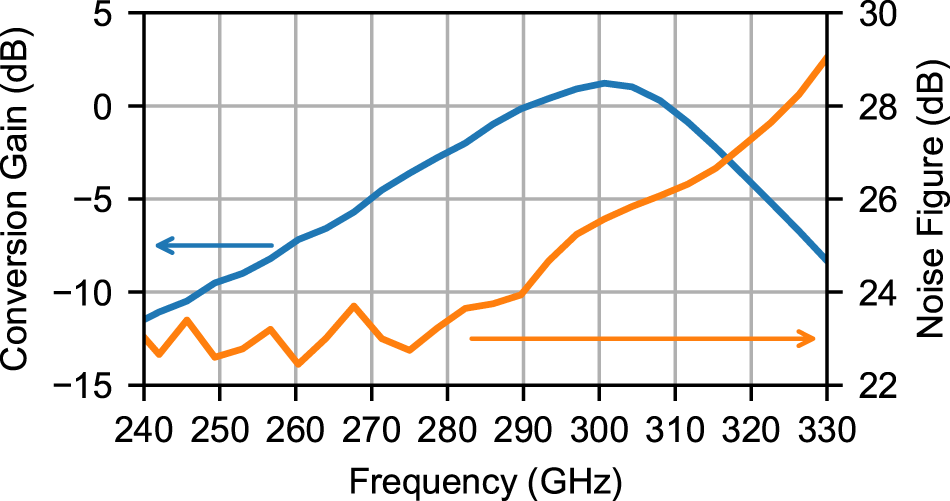
Figure 5 shows the simulated conversion gain of the receive path as well as its simulated noise figure. The simulated conversion gains maximum is centered around 300 GHz as is the antenna gain of the on-chip antenna. Its maximum is at 1.22 dB and the peak has a 6 dB width of 51.3 GHz. Its frequency selectivity is mainly caused by variation of LO power in the receive path.
Simulated conversion gain and noise figure of the receiver components on the MMIC swept over LO frequency for an IF of 2 GHz.

The IF output of the MMIC can take one of two paths on the front-end PCB. To that end the differential signal is routed into two single-pull-double-throw (SPDT) switches. These HMC536 model switches are rated to operate from DC to 6 GHz and can be configured by the micro-controller on the back-end PCB. If the IF signal from the MMIC needs to be accessed externally, the switches are configured to route one of differential lines into a mini-SMP socket, while the other line is terminated with 50  ${\Omega}$. This allows any number of devices to be connected via coaxial cable to the IF output of the mixer. Alternatively the SPDTs can be configured to route the MMICs IF output differentially into the IF pre-amplifier on the front end, which is based on two LT6203 operational amplifiers. Its output is routed to the back-end PCB where it is filtered by an anti-aliasing filter (AAF) with a corner frequency of 400 kHz before being digitized using the 16-Bit ADC LTC2378IMS-16. The corner frequency of the AAF limits the maximum range of the radar system for a given set of ramp parameters. All radar measurements presented in this paper use a 5 ms long down-chirp with a ramp bandwidth of 90 GHz, which results in a maximum range of 3.3 m for stationary targets. The range of the system can only be increased by using longer ramp times, since the filters cannot be dynamically adjusted.
Transmit path
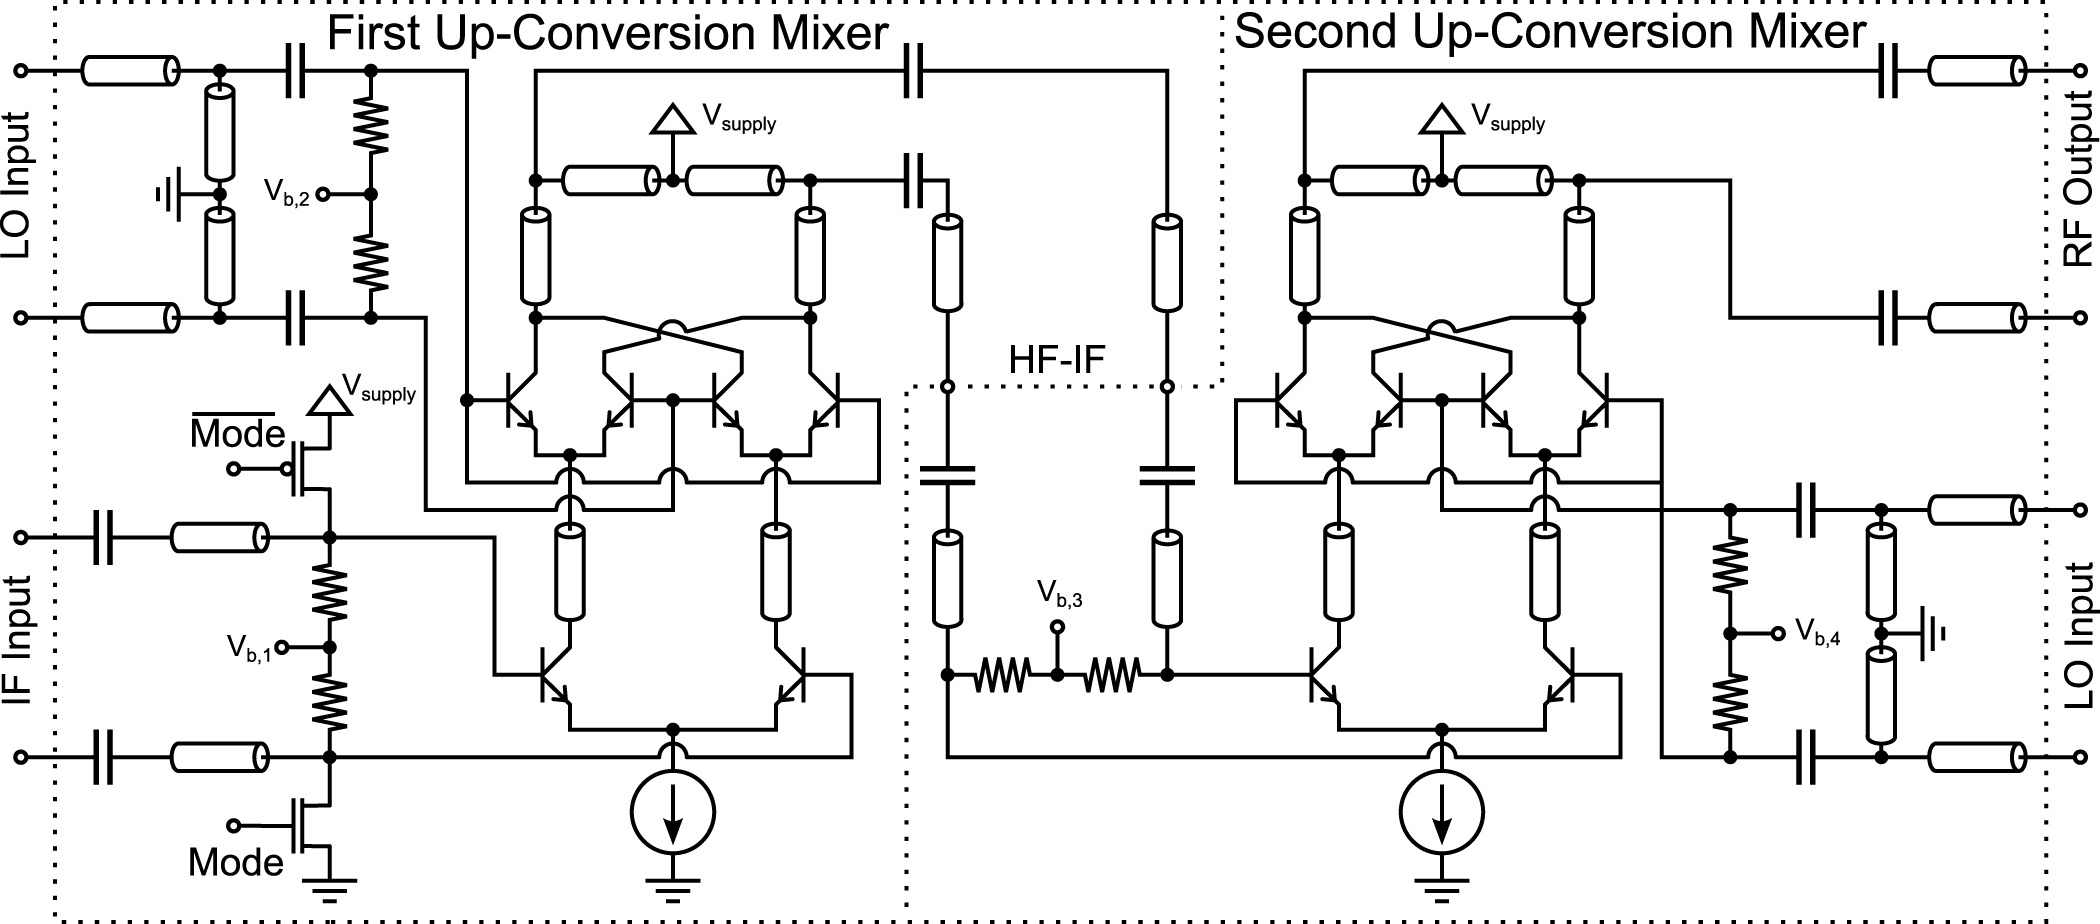
The transmit path needs to be able to serve two functions. Up-conversion of an external IF signal and frequency doubling for radar operation. Its architecture is based around two Gilbert cell mixers as shown in Figure 6. The RF output of the first mixer serves as the IF input of the second mixer. Both mixers operate with the common D-Band LO signal at their LO inputs. The external IF signal at the input of the first mixer gets modulated to the D-band. This high frequency D-band IF signal gets mixed with a D-band signal originating from the same LO in the second mixer, to arrive at the targeted frequencies in the J-band, that are radiated using the on-chip antenna.
Schematic of the two up-conversion mixers with the Mode-pin to enable feed-through mode.

The external IF signal for up-conversion is connected to the system using a mini-SMP socket on the front-end PCB. This single ended signal is converted to differential by an active balun circuit on the MMIC, which is based on a differential pair. Its output serves as the IF input of the first up-conversion mixer. Frequency doubling with this set-up can be achieved by effectively choosing an IF frequency of 0 Hz at the first mixer. Since this is not practically possible using the external IF due, to DC blocking capacitors in the signal path, two MOS transistors where placed at the base nodes of the differential pair in the Gilbert cell of the first mixer. If the digital Mode-pin is activated (see Figure 6), these MOS transistors shift the bias potentials of both bases in opposite directions, which maximizes LO feed-through. For this “feed-through mode” no external IF signal is present. Now that the LO signal is present at the output of the first mixer, the second mixer get the same LO signal at both its IF input and its LO input. In this way the second mixer get reconfigured to act as a Gilbert cell based doubler. The Mode-pin and the input of the CMOS inverter that drives the  $\overline{Mode}$-pin are routed to a pad and connected directly to the micro-controller on the back-end PCB. If the micro-controller sets this pin to 0 V the TX-path operates in up-conversion mode. If it is set to 3.3 V the two stage mixer acts as a frequency doubler.
This architecture is in many ways similar to a subharmonic approach, which has been shown to be effective in the required frequency range [Reference Abdo, Fujimura, Miura, Tokgoz, Hamada, Nosaka, Shirane and Okada22, Reference Lee, Kim, Lee and Song23] and in the used technology [Reference Zhao, Ojefors, Aufinger, Meister and Pfeiffer24]. When operating close to or above the transit frequency of the given technology, generating sufficient LO power becomes challenging. This is alleviated by the two-stage mixing architecture, which allows for the LO signal to be generated more efficiently at half of the targeted frequency. To provide the two Gilbert cells with differential D-band LO signals, generated from the single ended output of the common LO generation building block, a network of lumped-element Wilkinson power dividers, in conjunction with a D-band rat-race coupler and two inter-stage amplifiers, identical the components discussed for the receive path, is used (see Figure 2).
The entire transmit path including both mixers, inter-stage amplifiers and the on-chip antenna was comprehensively co-designed to maximize the bandwidth of the radiated power. 100  ${\Omega}$ matching between the components was not followed, the components where matched to each other directly. Additionally the frequency at which the components transfer maximum power was slightly shifted in respect to the frequency at which the antenna generates its maximum gain. This technique can extend the bandwidth of the system, at the cost of output power resulting in exceptional range resolution.
Antenna system
Both transmit path and receive path use two identical on-chip antennas in a quasi-mono-static configuration. As can be seen in the chip micrograph in Figure 3, this antenna is a differential patch fabricated in the top most aluminum layer with a transmission line based matching network. The patch is a square with an edge length of 253  ${\mu m}$. The center points of the receive and transmit patches are 500
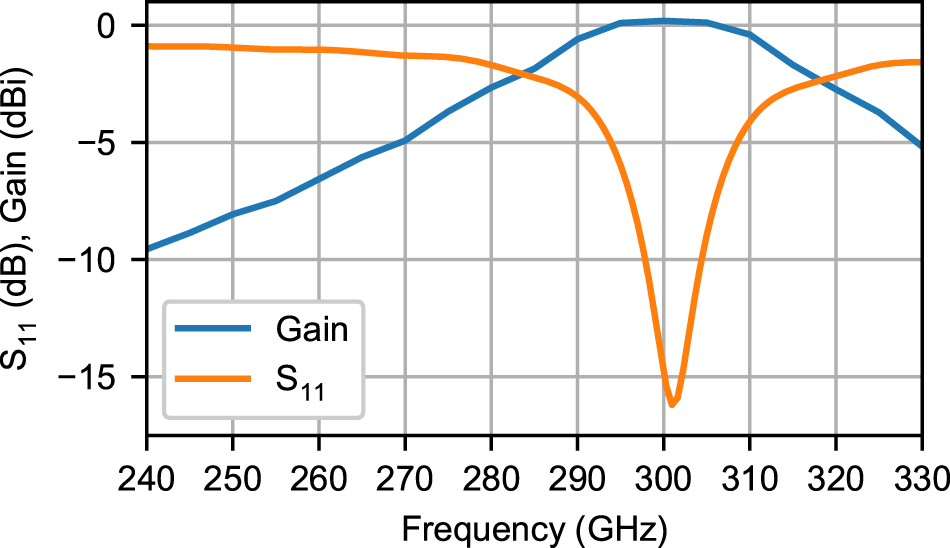
  ${\mu m}$ apart from one another. The performance of this antenna, which is similar to [Reference Thomas, Bredendiek and Pohl25] and [Reference Starke, Wittemeier, Vogelsang, Sievert, Erni, Rennings, Rücker and Pohl26], is limited by the fixed configuration of the metal stack and compliance with strict metal density rules. Figure 7 shows the simulated gain and the reflection coefficient $\rm{S_{11}}$ of the antenna, assuming a 100
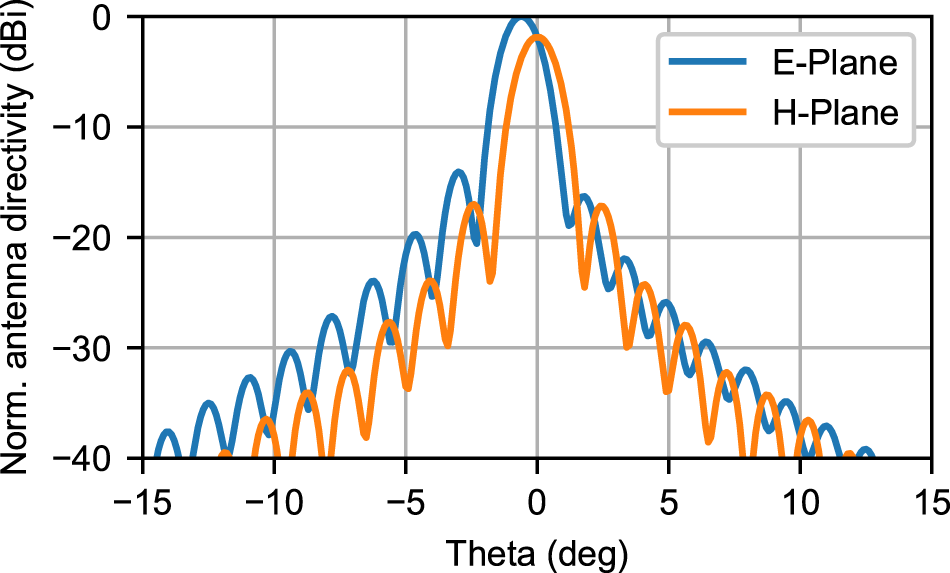
  ${\Omega}$ source impedance. In a frequency range of 41 GHz centered on 300 GHz the gain of the antenna is within 3 dB of its maximum of 0.19 dBi, assuming perfect matching. This can be used as a metric for the bandwidth of the on-chip antenna, even though the bandwidth of the radiated power, that will be discussed in Section 3, is larger. One contributing factor to the low gain of the on-chip antenna is its poor radiation efficiency. At the center frequency only 30% of the accepted power is radiated, due to the very close proximity of the patch on the top most metal layer and its ground plane on the bottom most metal layer. To enhance the gain and increase the range of the system, an elliptical PFTE lens is used to focus the radiation of the antennas. The lens is based on the concept presented in [Reference Pohl and Gerding27]. With the lens, the gain of the resulting antenna system is increased to 32.5 dBi. Ideally, the on-chip antennas need to be placed in the focus point of the lens. Since a quasi-mono-static configuration is used, the focus point of the lens lies in between the two antennas. This results in a slight shift of main lobe direction of 1.5∘ in the E-plane. As can be seen in Figure 8, the gain in the direction normal to the antenna plane is reduced by 1.9 dB.
Simulated reflection coefficient  $\rm S_{11}$ and gain of the on-chip antenna over frequency.

Simulated normalized directivity of the on-chip antenna with PTFE lens in the E-plane and H-plane.

System measurement results
Free space EIRP measurements
To characterize the performance of the system its output power was measured under several system conditions. These measurements needed to be done over the air, since the system only has an on-chip antenna as its high frequency interface. The equivalent isotropic radiated power (EIRP), the product of the antennas gain and the power accepted by the same antenna, was measured using a R&S FPL1007 spectrum analyzer in conjunction with a VDI SAX WR3.4 spectrum analyzer extension module, equipped with a Mi-Wave 261J-20 20 dBi standard gain horn antenna. The external LO input of the SAX was swept using a HP 83640A signal generator so that the entire WR3.4 waveguide band could be down-converted to a number of slices around 400 MHz, that the spectrum analyzer could measure. Assuming far-field conditions and perfect alignment of the device under test and the horn antenna, the EIRP can be calculated from the measured power at the spectrum analyzer with
 \begin{align}
EIRP = \frac{P_{\rm{meas}}}{G_{\rm{RX}}\cdot G_{\rm{conv}}}\cdot\left(\frac{4\pi\cdot d \cdot f}{c}\right)^2,
\end{align}
\begin{align}
EIRP = \frac{P_{\rm{meas}}}{G_{\rm{RX}}\cdot G_{\rm{conv}}}\cdot\left(\frac{4\pi\cdot d \cdot f}{c}\right)^2,
\end{align} where  $P_{\rm{meas}}$ is the power measured by the spectrum analyzer, $G_{\rm{RX}}$ is the antenna gain of the receiving standard horn and $G_{\rm{conv}}$ is the conversion gain of SAX. The expression $\left(\frac{4\pi\cdot d \cdot f}{c}\right)^2$ is also known as the free space path loss FSPL derived from the Friis transmission equation. It is calculated with the distance d from the transmitting antenna under test to the receiving antenna, the operating frequency f and the light speed in air c.
Figure 9 shows the EIRP measurement set-up. The system under test is placed on a fixture, adjustable by micrometer screws to allow alignment, which is in turn fixed on a high precision translation stage. The distance at which the EIRP measurement is taken can be varied while maintaining alignment with this set-up. Every measurement is done for a number of distances. Results for low distances that do not agree with the  $\frac{1}{d^2}$ distance relation from the Friis equation are discarded, since they imply that far field conditions are not met. The mean value of the remaining results is used as the result of the EIRP measurement. This has the added advantage of mitigating standing wave effects between the DUT and the SAX module, that could skew the results for specific combinations of operating frequencies and distances. All EIRP measurements of the presented system are done without the PTFE lens. Its very high directivity made alignment difficult for large distances, while the far-field distance is increased considerably by the greater aperture size.
Photograph of the free space EIRP measurement set-up.

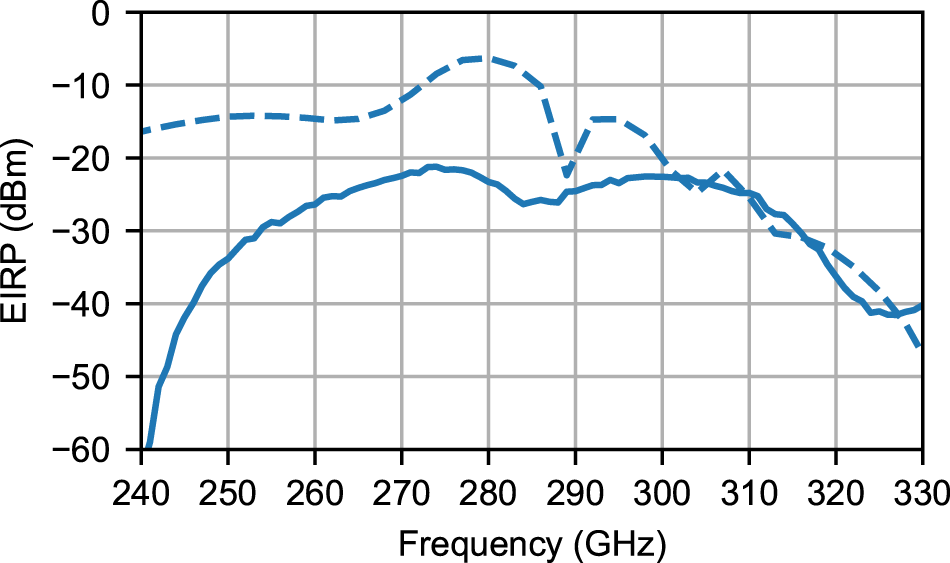
Figure 10 shows the EIRP of the system configured as a radar system, in feed-through mode. The measured radiated power has 6 dB bandwidth of 54 GHz from 258 to 312 GHz. Two almost equal maxima at 274 and 298 GHz lie in this range with EIRP of −21.2 and −22.6 dBm respectively. The second maximum corresponds to the antenna gain maximum shown in Figure 7, whereas the first maximum is at the frequency where the two stage mixer transfers its maximum power. All EIRP simulation results are produced using combined EM and circuit simulations of the entire transmit path. Parasitics close to critical active devices are RC extracted and load networks and matching networks for frequencies in or above the D-band are modeled using EM simulations. The antenna is modeled using the broadband S-parameters from a full wave simulation. The power accepted by the antenna model is combined with the radiation efficiency and directivity from the full wave simulation to arrive at the simulated EIRP. The measured results agree well with the simulated results for high frequencies. The considerable mismatch at lower frequencies may be caused by an overestimation of the antenna gain or matching far from its center frequency. With the simulated directivity improvement from PTFE lens, the EIRP of the system is expected to be as high as 9.2 dBm, for radar operation.
EIRP of the TX in feed-through mode as a function LO Frequency. The solid line marks the measured result and the dashed line the corresponding simulation result.

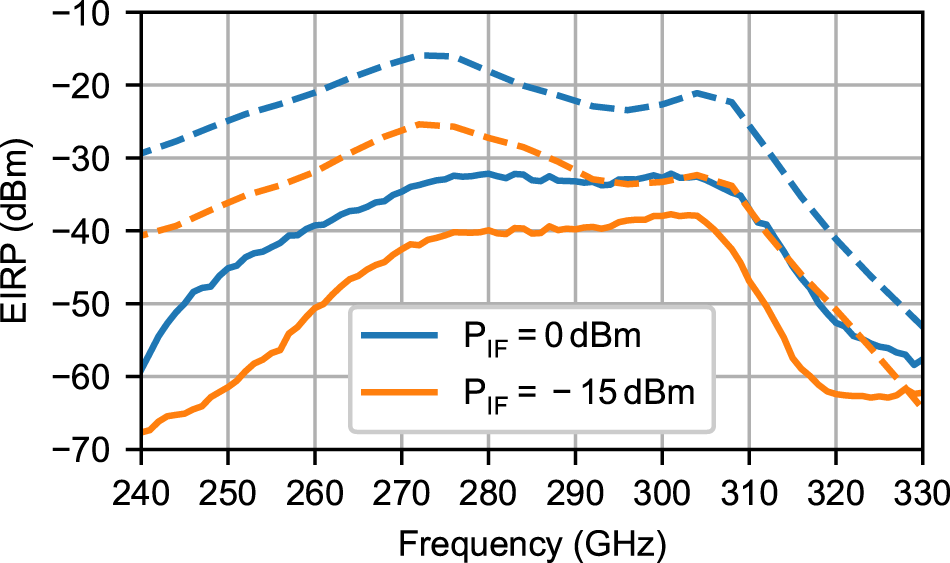
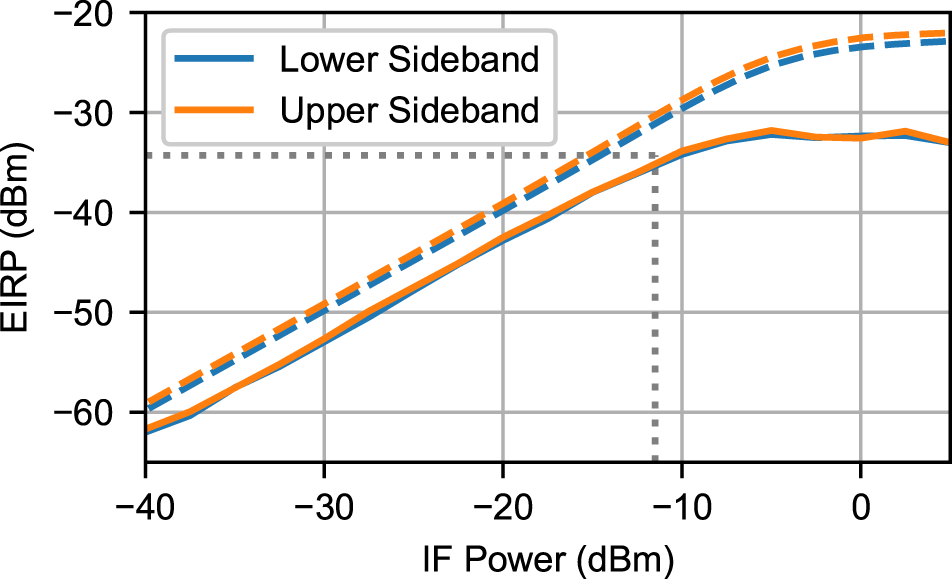
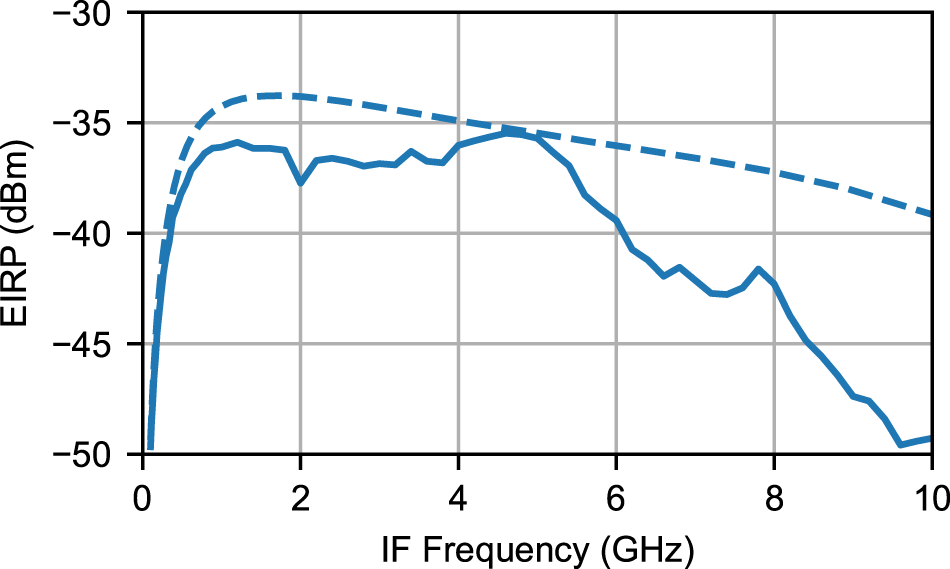
To understand the capabilities of the system as an up-converting RF front-end a number of EIRP measurements were done with an external IF signal source. A Keysight E8257D PSG signal generator is connected to the external IF input on the front-end PCB using a coaxial cable and the measurement process as described before is repeated with the transmit path configured for up-conversion. Figure 11 shows the first of these measurements. The LO frequency is swept using the PLL of the system for two IF power levels, while the IF frequency is kept constant at 2 GHz. At 0 dBm input power the system operates in saturation, while it operates in the linear region at −15 dBm (see Figure 12). The saturated power swept over the LO frequency is considerably lower than the EIRP recorded in feed-through mode (see Figure 10). This suggests, that the maximum voltage amplitude at the bases of the differential pair in the first mixer, generated by the external IF, is lower than the voltage level shift generated by the feed-through mode MOS transistors. This implies that the active balun circuit between the differential IF input of the first mixer and the single ended external IF input was improperly modeled and cannot generate sufficient output power to saturate the first mixing stage. The LO frequency dependence of EIRP is similar to the feed-through mode case with a 6 dB bandwidth of 49 GHz for 0 dBm IF input power. To analyze the linearity of the transmit path, Figure 12 shows the EIRP dependent on the input power level. The LO frequency and IF frequency are held constant at 300 and 2 GHz respectively. Both the upper mixing product at 302 GHz and the lower mixing product at 298 GHz, which are almost identical as expected for a dual sideband mixer, are shown in this plot. The mixer is linear up to the OP1dB input power −11.5 dBm, which corresponds to an EIRP of −35.3 dBm. Simulations and measurement agree well for the linear region but differ significantly in the saturated region. The simulated saturated EIRP is very similar to the simulated and measured result in feed-through mode at 300 GHz (see Figure 10), supporting the claim that the active balun was improperly modeled and limits the linearity of the mixers. Finally the IF bandwidth is investigated by sweeping the IF frequency for a fixed LO frequency of 300 GHz, while operating in the linear region, with an input power of −15 dBm. Figure 13 shows a very flat response in the 6 dB width of the EIRP, which spans from 260 MHz to 6.8 GHz.
EIRP of the TX in up-conversion mode as a function of LO frequency for two IF input Powers. IF frequency is set to 2 GHz and only the upper sideband is shown. The solid lines mark the measured results and the dashed lines the corresponding simulation results.

EIRP of the TX in up-conversion mode as a function of IF Power. Both the upper and lower sideband are shown. IF frequency is set to 2 GHz and the LO frequency set to 300 GHz. The solid lines mark the measured results and the dashed lines the corresponding simulation results.The dotted line marks the OP1dB of the measured results, where the EIRP is compressed by 1 dB.

EIRP of the TX in up-conversion mode as a function of IF frequency. The IF power is set to −15 dBm, the LO frequency is set to 300 GHz and only the upper sideband mixing product is shown. The solid line marks the measured result and the dashed line the corresponding simulation result.

These measurements show, that this system can up-convert an arbitrary IF signal with a bandwidth of up to 6.5 GHz, like a QAM signal or an OFDM waveform modulated on to a carrier frequency of 3.25 GHz, to the J-band. The system can place this up-converted signal in a large part of the frequency range allocated by IEEE 802.15.3d while maintaining an EIRP greater than −16.9 dBm for the 6 dB bandwidths in LO and IF frequency. This is done in conjunction with the lens, while operating linearly at the OP1dB.
PLL stabilized phase noise
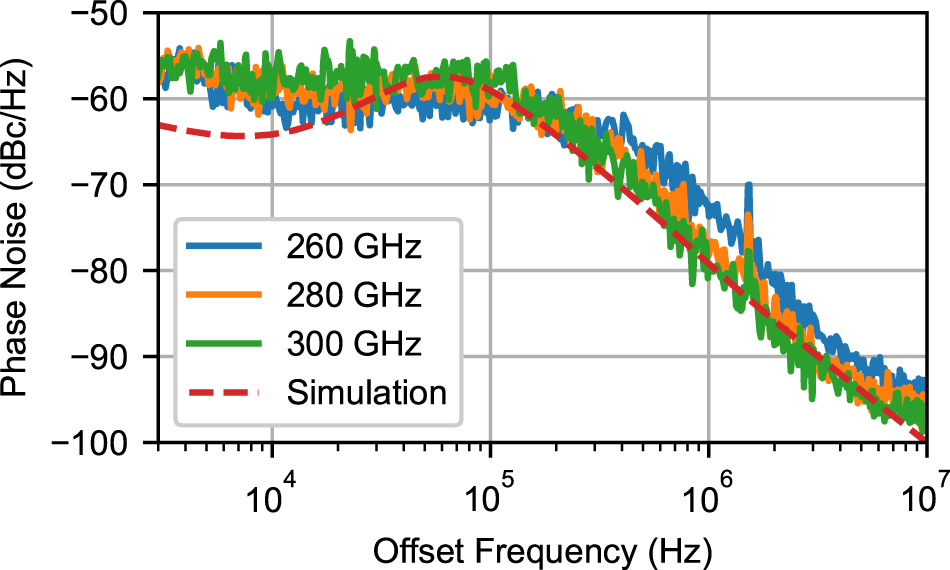
Finally the PLL stabilized phase noise of the transmit signal in feed-through mode was investigated. The measurement set-up is identical to the set-up used for EIRP measurements in feed-through mode, only this time the spectrum analyzer in combination with the extension module was used to measure the phase noise instead of the output power. Figure 14 shows the result of this measurement at several frequencies as well as a simulation of the systems phase noise at 300 GHz, which agree very well. At an offset frequency of 1 MHz and carrier frequency of 300 GHz the measurements done with the D-band LO generation breakout circuit give a phase noise of −87 dBc/Hz (see Figure 4). These results only deviate by 2 dB from the PLL stabilized results in Figure 14, which are −79 dBc/Hz at a 1 MHz offset, if the 6 dB increase in phase noise expected by the frequency doubling in the transmit path building block is taken into account. The measurements are limited by the noise of the spectrum analyzer for frequencies very close to the carrier. This is why the simulation deviates from the measured results for offset frequencies under 20 kHz.
PLL stabilized phase noise of the system measured at several frequencies (solid lines) and simulated at 300 GHz (dashed line).

Distance measurements
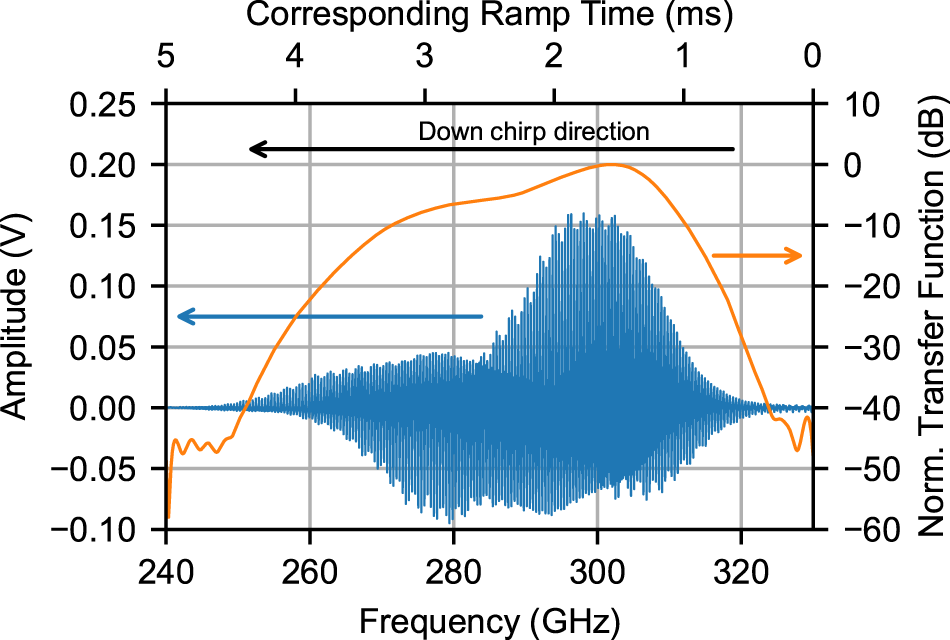
The capabilities of the presented system were validated by performing several short range radar measurements. Figure 15 shows the used measurement set up. A fixture for radar targets is placed roughly 0.35 m in front of the sensor. All radar measurements were performed with a FMCW down chirp from 330 to 240 GHz, limited by the frequency range in which the PLL is stable. A ramp duration of 5 ms was used. Figure 16 shows a time domain representation of the measured IF signal for one down ramp with a metal plate placed in the fixture. The X axis shows the corresponding frequency points as well as the ramp time of the chirp in reversed order. The IF signal shows a strong frequency selectivity. At the targeted design frequency of 300 GHz, the IF signal is at its maximum.
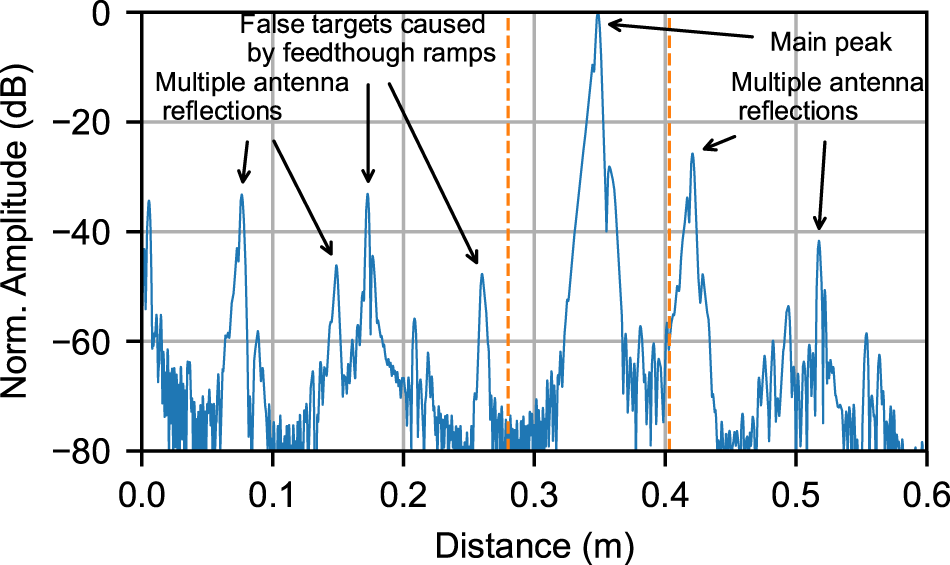
To derive range information, a Fourier transform was applied to the measured IF signal. Figure 17 shows the frequency domain representation of the IF signal, normalized its maximum amplitude. At a distance of 0.35 m the main peak can be observed. This peak presents a signal to noise ratio (SNR) of 60 dB. Apart from this, multiple smaller peaks can be distinguished. These have multiple origins, which are annotated in Figure 17. Due to the unwanted feed-through of the input signals at all doublers, unwanted FMCW ramps are present. In this case peaks caused by ramps at half and three quarters of the intended frequency are visible at the corresponding distances. Clutter and multi-path propagation is mitigated by the very high directivity lens.
Photograph of the radar measurement set-up.

Measured IF signal (blue line) for a 90 GHz down chirp in 5 ms with a metal target at 0.35 m and normalized transfer function of the system (orange line) derived from the distance-gated IF signal for calibration. The upper X-axis shows the ramp, time whereas the lower X-axis shows the corresponding frequency point in the ramp or the frequency for the transfer function.

Frequency domain representation of the measured IF signal for a 90 GHz down chirp with a metal target at 0.35 m. The origins of the peaks are marked. The orange dashed lines show the distance window used to calculate the transfer function.

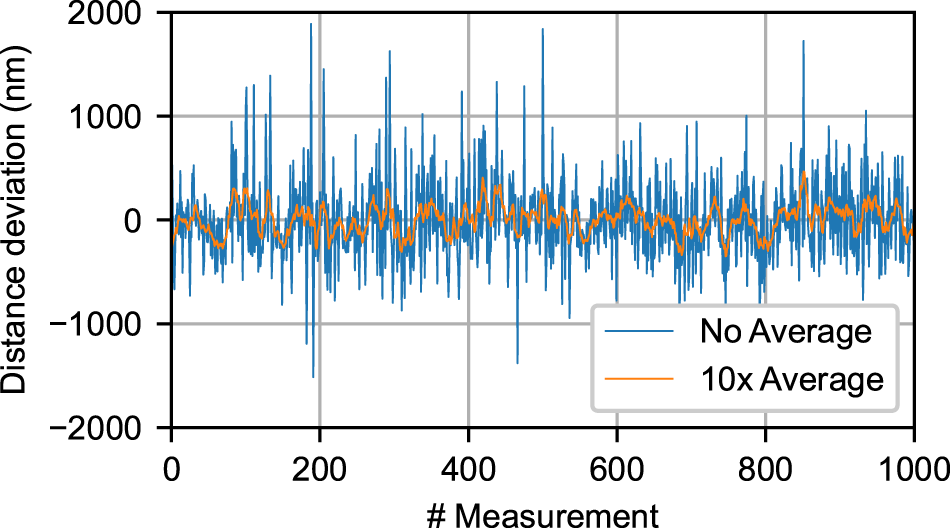
To validate the stability of the system, 1000 measurements were taken, with a metal plate as a target. Figure 18 shows the distance deviation from the mean recorded distance, as well as the result of a sliding average over ten measurements. The standard deviation is 0.39 µm without averaging and 0.14 µm with averaging. This shows the capability of the system to achieve sub-micrometer stability in its distance measurements.
Distance deviation from the mean distance for 1000 consecutive measurements with the same target at 0.35 m.

The spatial resolution of an idealized FMCW radar system, is given by
 \begin{align}
\Delta R = \frac{c}{2\cdot B}.
\end{align}
\begin{align}
\Delta R = \frac{c}{2\cdot B}.
\end{align}The theoretical limit for a system with a bandwidth B of 90 GHz is 1.67 mm. The resolution of this radar system for uncalibrated measurements lies well above this limit at 4.1 mm, as can be discerned from the 6 dB width of its main peak in Figure 17. This mismatch is caused by the non-ideal frequency response of the presented radar system, which can be interpreted as an additional windowing function modulating the received IF signal. Window functions have the effect of widening the target peaks in the Fourier transformed IF signal [Reference Harris28]. Since the frequency response depends almost entirely on the characteristics of the systems components, which do not change between measurements, this effect can be calibrated using the method described in [Reference Thomas, Froehly, Bredendiek, Herschel and Pohl8] and [Reference Thomas29].
The measured IF-signal Y is assumed to be the product of the ideal IF-signal X for a given target scenario and the transfer function H of the radar sensor. The ideal IF-signal for single target at known distance is given by  $X = e^{-j\cdot\omega_{IF}\cdot t}$, which corresponds to a unit impulse at the targets distance in its frequency domain representation. To compute the transfer function the average IF-signal from the aforementioned 1000 consecutive measurements is used as a reference measurement. To only correct the frequency components of the IF-signal corresponding to the main target, a rectangular window is applied to reference measurement data in the frequency domain. The width of this window is marked by the orange dashed lines in Figure 17. The transfer function is computed by dividing the reference data by the ideal IF-signal and plotted in its normalized form as the orange line in Figure 16. This frequency response closely resembles the product of measured EIRP (see Figure 10), simulated conversion gain of the receive path (see Figure 5) and the simulated gain of the receive antenna. The coinciding maxima of the transmit path and receive path around 300 GHz correspond to the transfer functions maximum at the same frequency. The transmit paths maximum at 274 GHz clearly extends the usable ramp bandwidth to lower frequencies.
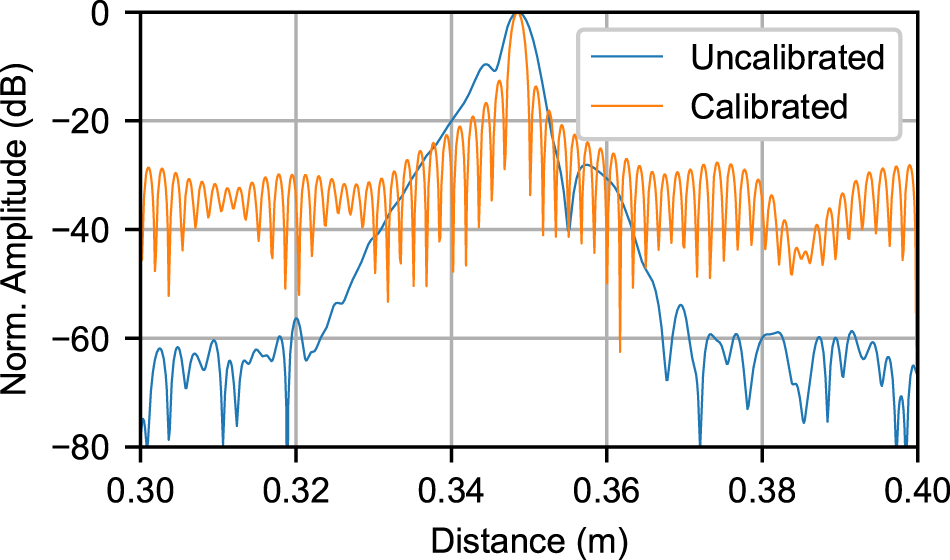
Figure 19 shows the Fourier transformed IF signal for a second measurement with a metal plate as a target in its uncalibrated form and calibrated by dividing the measured IF data by the previously calculated transfer function. Applying the calibration decreases the width of the main peak considerably to only 1.97 mm. The effective bandwidth of ideal system with this resolution, calculated using equation 2, would correspond to 76 GHz. The increased resolution comes at the cost of decreased dynamic range, as can be seen in Figure 19. The remaining difference in range resolution to the optimum of 1.67 mm can be explained by ramp-non linearity due to the high loop gain variation of the PLL [Reference Pohl, Jaeschke and Aufinger30].
Frequency domain representation for a calibrated and uncalibrated IF signal recorded with a metal plate at 0.35 m distance.

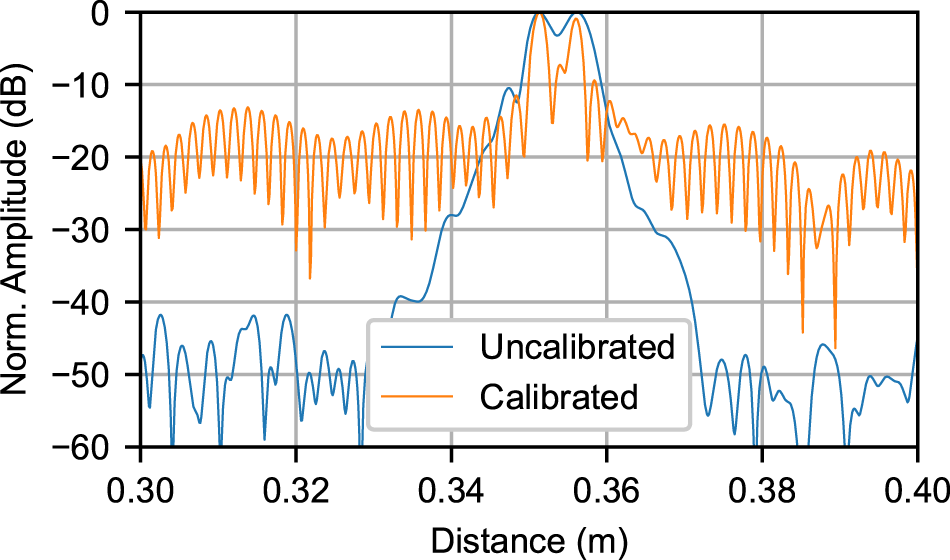
An industrial application of FMCW radar where bandwidth and spatial resolution are especially important is the precise measurement of material thickness. To demonstrate the presented systems capabilities in such an application, a 3.4 mm thick disk made of 3D-printed poly-propylene plastic was placed in the target fixture shown in Figure 15. The IF data of this measurement is calibrated using the same transfer function as before (see Figure 16), recorded with a metal plate instead of the plastic sample. Figure 20 shows both calibrated and uncalibrated results. The target peaks for both sides of the plastic sample are visible and distinguishable in both cases. The depth of the minimum between the target peaks is only 3.2 dB in the uncalibrated case, too little to separate the targets reliably, while it is 15.3 dB when calibrated. This shows the ability of the calibration to increase the range resolution of the radar system considerably by making more of the tuning range of the system usable, ensuring the reliable separation of the targets. Such an effective calibration is only possible due to the already extraordinarily large EIRP bandwidth described in Section 3.
Frequency domain representation for a calibrated and uncalibrated IF signal recorded with a 3.4 mm thick plastic disk at 0.35 m distance.

Communication measurements
Communication measurements and digital signal processing.

To show the potential of the presented system in a communication context a superheterodyne on-off keying (OOK) link is set up. As can be seen in Figure 21(a) two systems, configured as RF front-ends, are aligned to one another with a distance of 0.3 m. One acts as a transmitter and one acts as a receiver. The IF-signals are generated and recorded directly using high-performance laboratory equipment. A Keysight M8190A arbitrary waveform generator (AWG) is used to generate the signal that is up-converted by the transmitting system. A pseudo-random binary sequence (PRBS) with a symbol rate of 100 MBd is used to modulate a 500 MHz carrier signal. This on-off keyed IF-signal can be seen in Figure 21(b). The transmitter mixes this signal with an LO-frequency of 300 GHz, resulting in the radiation of two mixing products around 299.5 and 300.5 GHz. The PLL of the receiving system was set to 302 GHz to ensure that the down-converted mixing products do not overlap. The IF-output of the receiving system is recorded using a Keysight MSOS804A oscilloscope, at a sample rate of 10 GSa/s. A trigger signal from the AWG is connected directly to the Oscilloscope. It marks the beginning of the PRBS. The IF signal is recorded for 10 µs before and after this trigger. It provides a known time reference to more easily compare the demodulated signal against the original PBRS. Figure 21(c) shows the frequency components of received IF-singal. The down-converted mixing products of the AWGs signal are visible around 1.5 and 2.5 GHz, in addition to the down-converted LO feed-through of the transmitting system at 2 GHz. This strong LO feed-though is caused by asymmetries in the layout of the transmit mixers.
The following demodulation steps (see Figure 21(d))are done entirely in the digital domain, independent from the measurement set-up. First, the lower mixing product is isolated by applying a bandpass filter with a 175 MHz wide rectangular transfer function centered on the peak at 1.5 GHz. The width of this filter is a trade-off between noise and quality of the usable signal. Figure 21(e) shows the filtered IF-Signal. The maxima corresponding to the PRBS (comp. Figure 21(b)) are visible again, but its rectangular character is lost, since the filter width only includes the second harmonic of the highest frequency components of the PRBS. To separate the baseband component from the 1.5 GHz carrier, the signal envelope of the filtered IF-signal is calculated (see Figure 21(e)). This simple demodulation method, while only allowing for amplitude modulations, does not require any form of carrier recovery, which mitigates the effect of the phase and frequency uncertainty introduced by the unsynchronized PLLs of the transmitter and receiver. Using the trigger signal as a time reference and the known symbol rate of 100 MBd, the average of the signal envelope is calculated for each symbol. This symbol value is plotted for all recorded symbols as a histogram with 100 bins in Figure 21(f). The bit string is recovered by assigning 1 to symbols with values above the mean of all symbol values and 0 to symbols below the mean value. When the recovered bit string is compared to the initial PRBS used by the AWG, a bit error rate (BER) of 0.55% is calculated.
These results show that a short range link with moderate data rates can be set up using two ultra-wide-band radar sensors as RF front-ends. The use of simple modulation and demodulation methods like OOK relaxes the requirements on the baseband components and the signal processing. A promising approach is to co-integrate compact SDR-like front-ends with the radar sensor to replace the laboratory equipment and build up self-contained nodes in a wireless sensor network.
Comparison
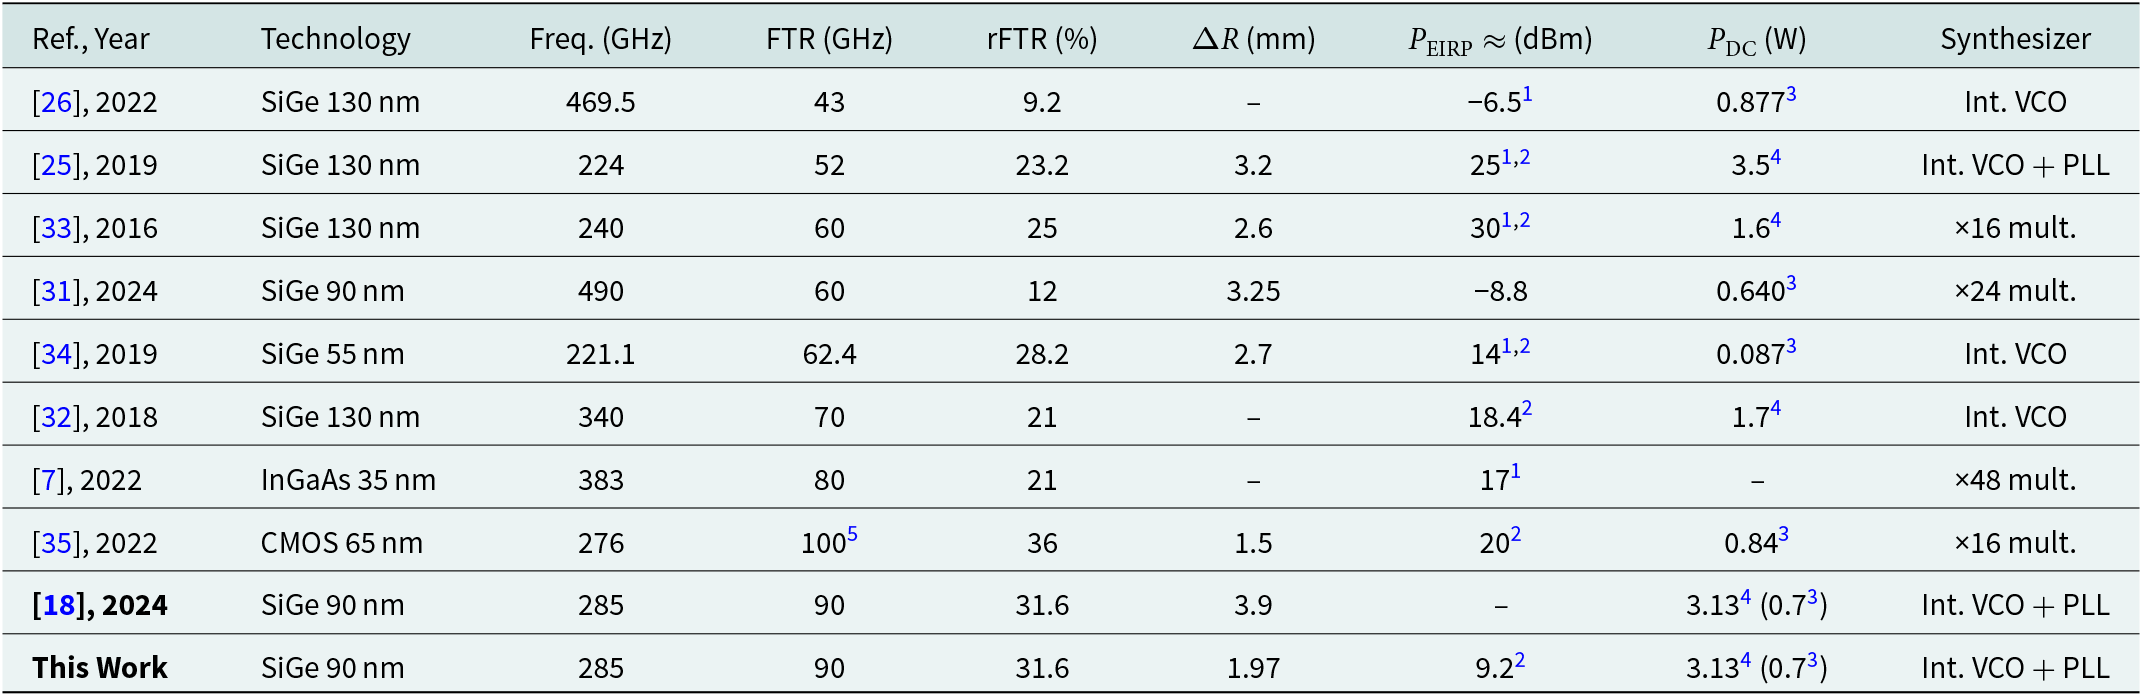
Table 1 gives an overview of comparable wide-band radar systems and transceivers. All of them are highly integrated and use on-chip antennas. This work with a center frequency of 285 GHz falls in the middle range of the compared systems. Transceivers in comparable SiGe technologies like [Reference Mangiavillano, Kaineder and Stelzer31], [Reference Starke, Wittemeier, Vogelsang, Sievert, Erni, Rennings, Rücker and Pohl26] or [Reference Al-Eryani, Knapp, Kammerer, Aufinger, Li and Maurer32] can work at much higher frequencies. Yet these transceivers have lower absolute and relative tuning ranges, which is the key metric to achieve high range resolution. By leveraging its ultra-wide-band VCO the presented system reports the second highest relative and absolute tuning range of compared systems, the highest in systems using an integrated VCO for their signal generation. The spatial resolution was only reported in [Reference Thomas, Bredendiek and Pohl25, Reference Mangiavillano, Kaineder and Stelzer31, Reference Grzyb, Statnikov, Sarmah, Heinemann and Pfeiffer33–Reference Yi, Wang, Lu, Wang, Grajal and Han35]. No radar measurements are presented in [Reference Starke, Wittemeier, Vogelsang, Sievert, Erni, Rennings, Rücker and Pohl26, Reference Al-Eryani, Knapp, Kammerer, Aufinger, Li and Maurer32], as they only present transceiver MMICs. The InGaAs mHEMT based system in [Reference Baumann, Gashi, Meier and Zech7] does present radar measurements in an imaging application, but does not report a spatial resolution. The resolution for this system is expected to be near the optimum for a tuning range of 80 GHz, which would correspond to 1.87 mm, very close to the results of the presented system. The results reported in the original conference publication of this system [Reference Ziegler-Bellenberg, Funke, Bredendiek, Hansen, Wessel and Pohl18] fall at the low end of compared systems, with 3.9 mm. Using the calibration method presented in this paper much more of the very large tuning range is made usable in measurements, boosting the range resolution to just below 2 mm. To the best of the authors knowledge only [Reference Yi, Wang, Lu, Wang, Grajal and Han35] has reported a higher range resolution for FMCW radar sensors. This system uses an innovative, but much more complex, approach where five narrow-band on-chip radar channels, with offset frequencies, are combined to function as a single system with extraordinary bandwidth and range resolution. The greatest shortfall of this system is its low EIRP, being the lowest for systems using a lens, making this system only applicable for short range use-cases. The final advantage of presented system is its high level of integration. No external laboratory equipment is needed for signal generation, as in the systems using multiplier chains, making a compact and straight forward stand-alone integration in an industrial setting possible.
Comparison of integrated wide-band radar sensors and transceivers around 300 GHz using on-chip antennas

1 Not explicitly given.
2 Using lens.
3 Only MMIC DC power consumption.
4 System DC power consumption.
5 Five combined channels with 20 GHz BW each.
Conclusion
In this article, we presented a high-resolution FMCW radar sensor that is built around a custom-developed SiGe transceiver MMIC. The dual-function of this transceiver system was realized by integrating a reconfigurable two-stage up-conversion mixer in the transmit path. The ability to act as a frequency doubler, allows the system to be either used as a standalone radar sensor or as a flexible RF front-end capable of up-converting and down-converting arbitrary modulated IF signals.
The ultra-wide-band integrated VCO on the MMIC in conjunction with PLL integrated off-chip allows for a rFTR of 31.6%, making stabilized output frequencies in a tuning range of 90 GHz centered on 285 GHz possible.
Two on-chip patch antennas in conjunction with a highly focusing PTFE lens eliminate the need for costly RF interfaces. The extensive co-design of these antennas with the integrated circuits make wide-band radiation possible using typically narrow-band on-chip patch antennas. The characterization of the transmit path shows that the EIRP of the system configured for radar operation is greater than 3.2 dBm in a bandwidth of 54 GHz. Configured as an up-converting front end, the system can place an arbitrary external IF signal with a bandwidth of up to 6.5 GHz in a large part of the frequencies allocated by the IEEE 802.15.3d standard while operating linearly and maintaining an EIRP greater than −16.9 dBm.
The capabilities of this system as a standalone radar sensor were investigated in a single target scenario. A down chirp from 330 to 240 GHz in 5 ms and a metal plate as target placed at a distance of 0.35 m were used. Uncalibrated measurements show a spatial resolution of 4.1 mm. The proposed calibration method improves this spatial resolution greatly to 1.97 mm.
The feasibility of this system in an industrial application was shown in a thickness measurement scenario. Both sides of a 3.4 mm thick plastic disk could be separated clearly utilizing the radar calibration method.
Additionally a communication link over a distance of 0.3 m was set up with two sensors configured as RF front-ends. Laboratory equipment was used to handle the IF-Signals. A 100 MBd OOK signal was received and demodulated with a BER of 0.55%.
Its compact size, cost-effective integration and reconfigureability make the presented system a viable and practical candidate for many future industrial and scientific terahertz applications.
Acknowledgements
This work has received funding by the German Federal Ministry of Education and Research (BMBF) in the course of the 6G research hub under grant number 16KISK041. This work was partially funded through the project “terahertz.NRW” (NW21-068A). The project “terahertz.NRW” is receiving funding from the programme “Netzwerke 2021”, an initiative of the Ministry of Culture and Science of the State of Northrhine Westphalia. The sole responsibility for the content of this publication lies with the authors. The authors would also like to thank Infineon Technologies AG and its staff members for fabricating the chips.
Competing interests
None declared.

Till Ziegler-Bellenberg received the B.Sc. and M.Sc. degrees in electrical engineering and information technology from Ruhr-University Bochum, Bochum, Germany, in 2019 and 2022, respectively, where he is currently pursuing the Ph.D. degree. Since 2023, he has been with the department of Integrated Circuits, Fraunhofer Institute for High Frequency Physics and Radar Techniques FHR, Wachtberg, Germany. His research interests include the design of integrated SiGe circuits and system concepts for communication and sensing above 200 GHz.

Dominic Funke received the Dipl.-Ing. and Dr.-Ing. degrees in electrical engineering from Ruhr University Bochum, Bochum, Germany, in 2012 and 2019, respectively. From 2012 to 2019 he concurrently worked as a research associate with the Analog Integrated Circuits group and the Chair for Integrated Systems at Ruhr University Bochum, where his research areas included ultralow-power circuits in CMOS technology, as well as mmW RFID systems. From August 2019, he held a postdoctoral position at the Chair for Integrated Systems at Ruhr University Bochum, focusing on high-frequency RFID transponders in CMOS technology. Since 2023, he is working at the Fraunhofer Institute for High Frequency Physics and Radar Techniques FHR, where he is serving as the head of the SiGe-Technologies research group. His current research interests include millimeter wave to terahertz integrated circuits and mixed-signal integrated circuits for radar applications.

Christian Bredendiek was born in Gelsenkirchen, Germany, in 1981. He received the Dipl.-Ing. and Dr.-Ing. degrees in electrical engineering from Ruhr University Bochum, Bochum, Germany, in 2008 and 2014, respectively.
From 2008 to 2014, he was a Research Assistant with the Institute of Integrated Systems, Ruhr University Bochum. Since 2015, he has been with the Department of Integrated Circuits, Fraunhofer Institute for High Frequency Physics and Radar Techniques FHR, Wachtberg, Germany. His current research interests include frequency synthesis, working on system concepts and integrated circuits for various mm-Wave applications.
Dr. Bredendiek was a recipient of the EuMIC Best Paper Award from European Microwave Week in 2012 and a co-recipient of the EuMIC 2021 Best Student Paper Award.

Steffen Hansen received his M.Sc. degree in electrical engineering from Hamburg University of Technology, Hamburg, Germany, in 2017, and his Dr.-Ing. degree from Ruhr University Bochum, Bochum, Germany, in 2024.
Since 2016, he has been with the Chip Design research group at the Fraunhofer Institute for High Frequency Physics and Radar Techniques FHR in Wachtberg, Germany. His research focuses on integrated circuits and system components for a range of mm-wave applications, including harmonic radar systems and tag-based joint communication and sensing.

Jan Wessel Jan Wessel received the Dipl.-Ing. degree from Ruhr-University Bochum, Germany, in 2009. From 2009, he was with the IHP GmbH, Frankfurt (Oder), Germany, where he was responsible for high-frequency biosensor development. Jan Wessel received his doctoral degree from the University of Paderborn in 2018. From 2020, he led a research group developing millimeter-wave and terahertz circuits. In 2021, he joined the Fraunhofer Institute for High Frequency Physics and Radar Techniques FHR, where he and his research department work in the field of integrated circuits for radar technologies. His current research interests include circuits, RF systems and MMICs.

Nils Pohl (Fellow, IEEE) received the Dipl.-Ing. and Dr.-Ing. degrees in electrical engineering from Ruhr University Bochum, Bochum, Germany, in 2005 and 2010, respectively.
From 2006 to 2011, he was a Research Assistant and subsequently from 2011, an Assistant Professor with Ruhr University Bochum. In 2013, he became the Head of the Department of mm-wave radar and high frequency sensors with the Fraunhofer FHR, Wachtberg, Germany. Since 2016, he has been a full professor of integrated systems at Ruhr University Bochum, while also maintaining a part-time affiliation with Fraunhofer FHR. He is involved in several third-party-funded research projects and is a co-founder of the start-up 2Pi-Labs. He is currently supervisor of 27 PhD students and several PostDocs. He has authored or coauthored more than 300 scientific papers and has issued several patents. His current research interests include ultra-wideband mm-wave radar, design, and optimization of mm-wave integrated SiGe circuits and system concepts with frequencies up to 500 GHz, frequency synthesis, and antennas.
He is a member of IEEE, VDE, ITG, EUMA, and URSI. He is actively involved in the scientific community, having served on the program committees of IMS, EUMW, RWW, SIRF, BCICTS, GEMIC, IMWS-AMP, and EUCAP. He is a reviewer for several IEEE journals, has been a Guest Editor for TMTT, and is currently an Associate Editor for Transactions on Radar Systems. He served as chair of the MTT TC 24 “Microwave/mm-Wave Radar, Sensing, and Array Systems Committee” and is currently the spokesman of the microwave section in the German VDE/ITG.
He received the Karl-Arnold Award from the North Rhine-Westphalian Academy of Sciences, Humanities and the Arts in 2013, the International IHP “Wolfgang Mehr” Fellowship Award for research in high-frequency electronics in 2017, the IEEE MTT Outstanding Young Engineer Award in 2018, and the VDE-ITG Award in 2023. He was also a co-recipient of the Best Demo Award at RWW 2015, Best Student Paper Awards at RadarConf 2020, RWW 2021, and EuMIC 2021, and Best Paper Awards at EuMIC 2012, AWPL 2022, and SENSL 2023.


 Open access