


1. Introduction
Compression/pressure waves under the ocean surface may be excited by explosions within the ocean depth or on the seafloor, large atmospheric pressure disturbances, and nonlinear interactions of surface waves. When compression waves in the water column excite stress waves in the half-space below (and including) a deformable seafloor, the waves in the two media may form a coupled wave system. Of particular interest to this work are water-column compression waves generated by nonlinear interactions among multi-directional ocean surface waves. Nonlinearly interacting surface-wave fields may be produced by local atmospheric pressure disturbances and changing wind patterns, swells approaching from different storm systems, swells and wind waves in confused seas, or swells/waves and their own reflections from the shores. Nonlinear surface-wave interactions have received considerable attention in the literature; see, for example, Longuet-Higgins (Reference Longuet-Higgins1950), Phillips (Reference Phillips1960, Reference Phillips1981), Hasselmann (Reference Hasselmann1962, Reference Hasselmann1963, Reference Hasselmann1966) and Bretherton (Reference Bretherton1964). Seafloor waves generated by nonlinear surface-wave interactions have been studied extensively – e.g. Longuet-Higgins (Reference Longuet-Higgins1950), Hasselmann (Reference Hasselmann1963), Haubrich, Munk & Snodgrass (Reference Haubrich, Munk and Snodgrass1963), Hughes (Reference Hughes1976), Webb (Reference Webb1986), Herbers & Guza (Reference Herbers and Guza1994), Kibblewhite & Wu (Reference Kibblewhite and Wu1991), Ardhuin et al. (Reference Ardhuin, Stutzmann, Schimmel and Mageney2011), Ardhuin, Gualtieri & Strutzmann (Reference Ardhuin, Gualtieri and Strutzmann2015), Bromirski & Dunnebier (Reference Bromirski and Dunnebier2002), Dunnebier et al. (Reference Dunnebier, Lukas, Nosal, Aucan and Weller2012).
Hasselmann (Reference Hasselmann1963) analysed wave propagation in a two-layer system comprised of the ocean water column and the deformable half-space below the seafloor, and derived dispersion relations for the natural modes of this system. He next developed expressions for the wavenumber–frequency spectra for the seafloor surface waves, accounting for refraction over seafloor depth contours. He further quantified the relationship that connected the forcing due to interacting surface waves and seafloor microseisms. This connection had been examined previously by Longuet-Higgins (Reference Longuet-Higgins1950), who obtained expressions for the second-order potentials and pressure oscillations (in the fluid) due to opposing and obliquely approaching surface waves, using these to evaluate seafloor microseism amplitudes in the far field. Hughes (Reference Hughes1976) analysed generation of low-frequency ambient noise by interacting multi-directional surface-wave fields. Water-column pressure oscillations due to interacting surface waves were studied further as a source of ambient ocean noise by Kibblewhite & Wu (Reference Kibblewhite and Wu1991). Both works found the surface-wave generated underwater compression waves to be the dominant component of low-frequency ambient ocean noise (Hughes Reference Hughes1976; Kibblewhite & Wu Reference Kibblewhite and Wu1991), to be accounted for in ocean acoustics applications. In addition, Kibblewhite & Ewans (Reference Kibblewhite and Ewans1985) used a simplified form of the seafloor frequency spectrum of Hasselmann (Reference Hasselmann1963) to correlate ocean-wave conditions to observed microseism amplitudes in the ocean. Separately, Kibblewhite & Wu (Reference Kibblewhite and Wu1993) also used a multi-layer seafloor model to correlate surface-wave spectra with seafloor deformations. Similar expressions for seafloor pressure excitation by interacting surface-wave fields with a  $\cos ^2\theta$ directional distribution were used by Webb & Cox (Reference Webb and Cox1986) and Webb (Reference Webb1986).
Ardhuin et al. (Reference Ardhuin, Gualtieri and Strutzmann2015) and Ardhuin (Reference Ardhuin2018) applied the principle underlying the treatment of primary microseisms in Hasselmann (Reference Hasselmann1963) to investigate the generation of microseisms by surface and infragravity waves interacting with a sinusoidal seafloor, and more generally in their identification of the mechanisms behind the Earth's ‘hum’. Near-shore microseisms due to obliquely intersecting surface-wave fields were investigated theoretically and observationally by Elgar, Herbers & Guza (Reference Elgar, Herbers and Guza1994), Elgar et al. (Reference Elgar, Herbers, Chandran and Guza1995) and Herbers & Guza (Reference Herbers and Guza1991, Reference Herbers and Guza1994), who made measurements of the acoustic-gravity pressures on the seafloor and at mid-depth using arrays of pressure transducers.
Renzi & Dias (Reference Renzi and Dias2014) solved a Cauchy–Poisson problem to show that in a slightly compressible ocean, first-order compression waves in the ocean water column would be co-generated along with surface gravity waves by the same surface pressure disturbance (such as during a storm), referring to the co-generated compression waves as ‘hydroacoustic waves’. Ardhuin & Herbers (Reference Ardhuin and Herbers2013) investigated compression waves arising from second-order interactions among multi-directional surface waves and their relationship to ocean noise and seafloor surface waves, referring to such compression waves as ‘acoustic-gravity waves’. For groups of interacting surface waves, Ardhuin & Herbers (Reference Ardhuin and Herbers2013) studied (i) the effects of nonlinear surface pressures and the resulting seafloor pressures on ocean noise, and (ii) the generation of seismic waves due to seafloor pressures, but did not investigate the propagation of wave groups comprised of water-column compression waves and seafloor seismic waves.
Acoustic-gravity waves and seafloor surface waves were investigated by Eyov et al. (Reference Eyov, Klar, Kadri and Stiassnie2013), who derived analytical solutions to a system of wave equations for hyperbolic waves in uniform media in a compressible ocean water column and on an elastic seafloor. Their focus was on the natural modes of the coupled system for constant and shoaling depths, with seafloor wave solutions decaying exponentially with depth below the seafloor. Williams & Kadri (Reference Williams and Kadri2023) extended the solutions of Eyov et al. (Reference Eyov, Klar, Kadri and Stiassnie2013) to study generation of propagating ocean surface waves, acoustic-gravity waves and seafloor surface waves by impulsive excitation of the seafloor (e.g. due to seismic events) such as may lead to tsunamis. Abdolali, Kadri & Kirby (Reference Abdolali, Kadri and Kirby2019) showed the importance of accounting for ocean compressibility and seafloor elasticity in projections of tsunami paths and arrival times, with both ocean compressibility and seafloor elasticity accounted for. A time-domain approach was used recently by Meza-Valle, Kadri & Ortega (Reference Meza-Valle, Kadri and Ortega2023) to derive a means to utilize faster travelling compression waves to estimate the location of rogue-wave generation on the ocean surface.
Jensen et al. (Reference Jensen, Kuperman, Porter and Schmidt2011, chapter 5) modelled an infinite half-space with the ocean forming a finite top layer and the seafloor forming a semi-infinite bottom layer. They recognized the system as a singular Sturm–Liouville problem, and utilized the dynamic conditions at the water–seafloor interface to derive a depth-dependent Green's function that admitted wave solutions going into the semi-infinite seafloor. This approach provided the full set of wave modes (including discrete modes and continuous spectra) for constructing solutions. They accounted for the depth dependence of seawater density with this approach, and using a numerical solution procedure, observed how depth dependence of density led to spreading and dissipation (due to leaky modes) of a localized compression wave front as it propagated through a compressible ocean over an elastic seafloor. Michele & Renzi (Reference Michele and Renzi2020) developed an analytical solution using a perturbation expansion up to third order of the depth-dependent acoustic speed to study, for example, the propagation of a hydroacoustic wave front generated by a source in the far field. For this study, they assumed the seafloor to be rigid.
It is noted that the group behaviour of the acoustic-gravity waves and the seafloor seismic waves in an infinite two-media half-space is not yet fully explored in the literature studying the propagation of these waves. A focus on wave groups of in-water-compression-seafloor-seismic waves (as defined by the dispersion relation arising from the interface conditions) enables unification into a single formulation of the treatments of low-frequency ambient ocean acoustic noise amplitudes, seafloor power densities, and the estimation of seafloor microseism amplitudes.
This paper develops such a unified formulation for groups of in-water-compression-seafloor-seismic waves through a two-layer infinite half-space. This formulation is able to account for all of the modes as in Jensen et al. (Reference Jensen, Kuperman, Porter and Schmidt2011, chapter 5), but the solution procedure of this paper is analytic, though the solutions for stationary random wave fields are derived in the form of wavenumber–frequency spectra (which may be inverted at the last step). The present formulation thus also admits solutions that couple compression waves with seismic body waves (i.e. P-waves and S-waves) in addition to seafloor surface waves. However, here detailed solutions are developed only for seismic surface waves, designated in the literature as Scholte waves (which are essentially Rayleigh waves that propagate on a liquid–solid interface rather than an air–solid interface).
A particular focus of the detailed solutions is on groups of coupled acoustic-gravity and Scholte waves under resonant excitation by stationary random ocean surface-wave fields. The acoustic-gravity and Scholte waves therefore are also treated as stationary random processes, thus requiring a solution procedure leading to wavenumber–frequency spectra. Additionally, this work also develops a method to account for depth-dependent non-uniformity in the seawater density, along with non-uniformity and anisotropy in the seafloor. As a first step, the analytic solution of this paper assumes that both media are mildly non-uniform (i.e. slowly varying functions of the spatial variable(s)). Finally, the dispersion relations of § 2 and the free-wave solution procedure of § 3.1 are applicable to impulsively generated groups of compressive Scholte waves and hydroacoustic waves, and additionally, much of the material in § 4 is also applicable to hydroacoustic waves.
Kadri & Akylas (Reference Kadri and Akylas2016) analysed a case where two opposing surface waves interact to produce a higher-order acoustic-gravity wave as part of a resonant triad, and determined that the cubic terms in the expansion introduce a detuning effect in locally confined wave packets. For the random waves in the deep ocean being studied in this work, detuning could lead to slow changes in the wavenumber–frequency spectra of the acoustic-gravity–Scholte waves (cf. Komen & Hasselmann (Reference Komen and Hasselmann1996) for slow changes in surface-wave spectra due to nonlinearity), but here as the fast-moving underwater wave groups move away from the original generation area on the ocean surface, they may be reinforced along their propagation paths by other generation areas with interacting ocean surface waves. Higher-order detuning and changes in the spectral content are accounted for indirectly in the present work via the inclusion in the energy balance equations of § 4 of multiple finite generation areas with relatively short interaction times.
General solutions are derived for free waves and forced waves. Detailed forced wave solutions are next obtained for wave systems produced by interacting surface waves (Hasselmann Reference Hasselmann1963). Depth dependence of seawater density and horizontal dependence of seafloor elasticity are accounted for, respectively, via the depth dependence of seawater acoustic speed and the variation in the horizontal plane of the dilatational and distortional wave speeds in the seafloor. The present formulation draws on the treatment of wave group propagation through non-uniform media in Whitham (Reference Whitham1973, chapter 11). Refraction of acoustic-gravity waves into the atmosphere or the excitation of microbaroms by direct action of interacting surface waves (Posmentier Reference Posmentier1967) are not considered at present. Wave attenuation due to dissipation over the seafloor can be appreciable for some seafloors (Kibblewhite Reference Kibblewhite1989), but these effects also are neglected in the present study. Results based on the proposed theory in this paper are discussed in the context of pressure measurements from April 2013 over a sensor array in the Atlantic Ocean at 36 $^\circ$N, 34 $^\circ$W. These measurements were conducted as part of the MARINER research project aimed at understanding the ‘Rainbow’ hydrothermal field near the Mid-Atlantic Ridge (Canales, Dunn & Sohn Reference Canales, Dunn and Sohn2013).
The present results could contribute to quantification and comparative analysis of ocean ambient noise and seafloor microseism activity. Acoustic-gravity waves may be of interest as a possible energy source that, if harnessed, could provide long-term power for seafloor instrumentation or other uses (e.g. Molin et al. Reference Molin, Lajoie, Jarry and Rousseaux2008; Grimmett, Wang & Chen Reference Grimmett, Wang and Chen2021; Korde & McBeth Reference Korde and McBeth2022). For seafloor energy research and for climate research based on long-term observation of ocean ambient noise (e.g. Illyina, Zeebe & Brewer Reference Illyina, Zeebe and Brewer2010), study of the group behaviour of water-column compression waves and seafloor waves could provide practical insights. Similarly, studies such as the present work also could enhance techniques used for tracking of tropical cyclones and other storms at sea (e.g. Butler & Aucan Reference Butler and Aucan2018; Fan et al. Reference Fan, McGuire, de Groot-Hedlin, Hedlin, Coats and Fiedler2019; Retailleau & Gualtieri Reference Retailleau and Gualtieri2019).
In these contexts, the present results should (a) help to quantify the potential for utilizing acoustic-gravity waves on the seafloor for energy conversion, and (b) enable use of seafloor-based hydrophones and seismometers to observe tropical cyclone activity from the seafloor. Specifically, this work may provide insights into optimal placement of arrays of small energy converters on the seafloor, and facilitate coordinated use of seafloor seismometers (and hydrophones where available) to identify unrecorded historical tropical cyclones and to track tempests (‘storm tracking’).
This paper is organized as follows. Section 2 discusses the present two-media coupled system, the interface boundary conditions, and the dispersion surfaces for the compression–Scholte wave groups propagating through the two media. Purely vertically propagating acoustic-gravity waves on a deformable seafloor and on a rigid seafloor are derived as special cases. Section 3 discusses the propagation of the compression–Scholte wave groups when the seawater and seafloor material properties (as reflected by acoustic phase speeds) are mildly non-uniform, with expressions derived for the wavenumber spectra of the free-wave groups of compression–Scholte waves. Section 4 examines the evolution and propagation of forced wave groups when the forcing is quantified by wavenumber–frequency spectra, and wavenumber spectra for the acoustic-gravity and Scholte waves are derived, for single and multiple generation areas along a group's propagation path. Section 5 adopts the approach of Hasselmann (Reference Hasselmann1963) in determining the wavenumber–frequency spectra for the second-order surface pressure due to interacting multi-directional surface waves, and discusses the relevance of favourable three-wave interactions involving two surface waves and one acoustic-gravity wave. That treatment provides the forcing wavenumber–frequency spectrum for § 4, while accounting for surface-wave wavenumber–direction combinations over  $(-{\rm \pi}, {\rm \pi})$ radians. Sections 6 and 7 discuss results of calculations based on surface-wave hindcasts relative to observational data for seafloor pressures and deformations at multiple stations at the Atlantic Ocean site. Section 7 also considers implications of the present findings for seafloor energy conversion, storm tracking, and characterization of ocean ambient noise and microseisms. Principal conclusions are included in § 8. Supplementary material § 1.1 (available at https://doi.org/10.1017/jfm.2024.682) presents the context for the mild non-uniformity assumption for wave propagation in the two-media system of this paper, and supplementary material § 1.2 develops the method of § 3 for purely vertically propagating compression waves.
2. Waves in the ocean–seafloor system
Waves in the two media are coupled together by the boundary conditions at the interface. The two media are considered to be mildly non-uniform, in that the acoustic speed in ocean water is a slowly varying function of the vertical coordinate, and the acoustic speeds in the seafloor are slowly varying functions of the horizontal coordinates (see supplementary material § 1.1). For the present analysis, the water depth  $h$ is assumed to be uniform. Although a typical seafloor may be comprised of several layers that could play a role in the overall dynamics, here the seafloor is assumed to be made up of a single semi-infinite layer with averaged properties. Energy dissipation effects in water and along the seafloor are assumed to be negligible. In this and the following sections, consistent with the representations in Phillips (Reference Phillips1960) and Hasselmann (Reference Hasselmann1963), the symbols ${\rm d}C_1$, ${\rm d}C_2$, ${\rm d}A_1$, ${\rm d}A_2$, ${\rm d}A'_1$, ${\rm d}B'_1$ are used to denote the Fourier coefficients in the Fourier–Stieltjes integral representations of the stationary random waves being analysed.
As shown in figure 1, the origin is located on the seafloor, with  $(x_1, x_2)$ representing two mutually orthogonal horizontal directions, and with the $y$ axis pointing vertically upwards. However, a more insightful and compact representation is possible if a particular wave group is followed, with the $x$ axis along the propagation direction as represented by a wavenumber ${\boldsymbol k}$. For a propagation direction $\theta _p$ in the $(x_1, x_2)$ plane,
 \begin{gather} x = x_1\cos\theta_p + x_2\sin\theta_p, \end{gather}
 \begin{gather} k_1 = k\cos\theta_p,\quad k_2 = k\sin\theta_p, \end{gather}
 \begin{gather} {\rm and}\quad {\boldsymbol k}\boldsymbol{\cdot} {\boldsymbol x} = kx,\quad k^2 = k^2_1 + k^2_2. \end{gather}
Equation (2.1b) follows because the wave group has no propagation in the direction perpendicular to  $\theta _p$.
Schematic sketch (not to scale) providing an overview of the system being studied, along with some definitions.

The acoustic-gravity–Scholte wave system is constrained by boundary conditions at  $y = 0$ and $y = h$, and the radiation conditions at $x\rightarrow \pm \infty$. Here, the attention is on an acoustic-gravity–Scholte wave system propagating from left to right along the positive $x$ direction. Hence for $x \rightarrow -\infty$, the waves are incoming, while as $x\rightarrow \infty$, the radiation condition for outgoing waves applies. Viscous forces in water are neglected in this analysis (Kibblewhite Reference Kibblewhite1989), and the water column is thought to support only compression/extension waves but not shear waves (Webb Reference Webb1986; Kibblewhite Reference Kibblewhite1989). Energy dissipation over the seafloor is also neglected (but see Kibblewhite Reference Kibblewhite1989).
The vertical component of the particle velocity at  $y = 0$ must be equal across the boundary, so that water particles adjacent to the seafloor move with the same vertical velocity as the solid particles attached to the seafloor. In addition, the normal stresses on the seafloor on the water side and the seafloor side must be equal. The seafloor supports both extensional (dilatational) waves and shear (distortional) waves. Hence since the water column does not support shear waves, the shear stress in the solid at the seafloor must be zero. At the top of the water column, the pressure under quiescent conditions just equals the atmospheric pressure. Since the seafloor also feels this atmospheric pressure, it can be subtracted out of the normal stress on both $y= 0$ and $y=h$ surfaces. Compression waves through the water column and seafloor waves can exist even in the absence of excitation from below or above. These waves are referred to as free waves, and may owe their existence to impulsive forcing due to explosions or past surface-wave activity. Their properties are constrained by the properties of the two media, their frequencies and wavenumbers being related together by a dispersion relation. The immediate objective below is to derive the dispersion relation for the two-media system that is consistent with the interface boundary conditions.
The treatment below is based on Graff (Reference Graff1991, chapter 6). Compression wave motion in the water column is assumed to be irrotational and hence is described by a scalar displacement potential  $\phi (x,y;t)$. On the other hand, the motion in the solid is not purely irrotational and in general includes a rotational component because the solid can support shear deformation. Hence the solid medium requires a scalar potential $\phi '(x,y;t)$ and an additional vector potential ${\boldsymbol H}'(x,y,z;t)$. The purpose here is to study a wave system propagating in the $(x,y)$ plane, so ${\boldsymbol H}'$ is restricted to be ${\boldsymbol H}' = (0, 0, H'_z)$.
The displacement  ${\boldsymbol u}(x,y;t)$ as represented by components $(u,v)$ of the water particles is given by
 \begin{equation} {\boldsymbol u} = \boldsymbol{\nabla} \phi\quad \Rightarrow\quad u = \frac{\partial \phi}{\partial x}\ {\rm and}\ v = \frac{\partial \phi}{\partial y}. \end{equation}
The displacement  ${\boldsymbol u}'(x,y;t)$ in the solid is given by
 \begin{equation} {\boldsymbol u}' = \boldsymbol{\nabla} \phi' + {\boldsymbol \nabla}\times {\boldsymbol H}'. \end{equation}
The horizontal and vertical components of  ${\boldsymbol u}'$ are given by
 \begin{equation} u' = \frac{\partial \phi'}{\partial x} + \frac{\partial H_z}{\partial y}\quad {\rm and}\quad v' = \frac{\partial \phi'}{\partial y} - \frac{\partial H_z}{\partial x}. \end{equation}
The kinematic boundary condition at the seafloor is
 \begin{equation} v = v'\quad \Rightarrow\quad \frac{\partial \phi}{\partial y} = \frac{\partial \phi'}{\partial y} - \frac{\partial H_z}{\partial x},\quad {\rm at}\ y = 0. \end{equation}
The stress component due to the acoustic-gravity waves in the water that is normal to the seafloor is
 \begin{equation} \tau_{yy} = \lambda\left(\frac{\partial u}{\partial x} + \frac{\partial v}{\partial y}\right), \end{equation}
while the equal and opposing normal stress component in the solid is (cf. Eyov et al. Reference Eyov, Klar, Kadri and Stiassnie2013)
 \begin{equation} \tau'_{yy} = \lambda'\left(\frac{\partial u'}{\partial x} + \frac{\partial v'}{\partial y}\right) + 2\mu'\,\frac{\partial v'}{\partial y}. \end{equation}
Here,  $\lambda$ denotes the Lamé constant for water, and $\lambda '$ and $\mu '$ represent the Lamé constants for the seafloor; $\lambda$, $\lambda '$ and $\mu '$ may all be slowly varying spatially, consistent with the discussion in supplementary material § 1.1. The first of the kinetic boundary conditions at the seafloor is
 \begin{equation} \tau_{yy} = \tau'_{yy},\quad {\rm at}\ y = 0. \end{equation}
The shear stress component along the propagation direction in the  $y$-plane on the seafloor is given by
 \begin{equation} \tau'_{xy} = \mu'\left(\frac{\partial u'}{\partial y} + \frac{\partial v'}{\partial x}\right). \end{equation}
The second kinetic boundary condition on the seafloor is
 \begin{equation} \tau'_{yx} = \tau'_{xy} = \mu'\left(\frac{\partial u'}{\partial y} + \frac{\partial v'}{\partial x}\right) = 0,\quad {\rm at}\ y = 0. \end{equation}
A kinetic boundary condition can also be specified for the top of the water column,  $y = h$. For free-wave propagation, the pressure at $y= h$ is set to zero, with the static atmospheric pressure subtracted out. For free waves, in terms of the components $(u,v)$, this condition can be expressed as
 \begin{equation} \lambda \left(\frac{\partial u}{\partial x} + \frac{\partial v}{\partial y}\right) = 0,\quad y = h. \end{equation}
As mentioned, the free-surface-wave field causing the present acoustic-gravity–Scholte waves can be described as a stationary random process (Hasselmann Reference Hasselmann1963). With the acoustic-gravity–Scholte wave system also treated as a stationary random process, a Fourier–Stieltjes integral representation is used here to expand the potentials  $\phi$, $\phi '$ and ${\boldsymbol H}'$ (Phillips Reference Phillips1977, chapter 4). The acoustic-gravity wave field in the water column for rightward propagating waves can be expressed as
 \begin{equation} \phi(x,y;t) = \iint_{k,\omega}\bigl({\rm d}{C_1 \exp(}{{\rm i}}\alpha y) + {\rm d}C_2\exp({-{\rm i}\alpha y})\bigr)\exp({{\rm i} (k x - \omega t)}). \end{equation}
It is recalled that  $kx = {\boldsymbol k}\boldsymbol {\cdot }{\boldsymbol x}$. The acoustic-gravity waves travel along inclined paths, with $\textrm {d}C_1 = \textrm {d}C_1(\omega,{\boldsymbol k})$ and $\textrm {d}C_2 = \textrm {d}C_2(\omega, {\boldsymbol k})$ representing, respectively, the Fourier components of the potential defining the acoustic-gravity waves propagating towards the seafloor, and the Fourier components for the acoustic-gravity waves reflected from the seafloor. These waves propagate as pressure waves, and in a broad sense can be considered as guided waves. Here, $\omega$ is the frequency of the acoustic-gravity and Scholte waves. When these waves result from a second-order interaction of surface waves of frequencies $\sigma _1$ and $\sigma _2$, we have $\omega = \sigma _1 + \sigma _2$. Here, ${\boldsymbol k}$ denotes the horizontal wavenumber, and $\alpha$ is the vertical wavenumber, given by
 \begin{equation} \alpha = \sqrt{(\omega^2/c^2_1 - k^2)}, \end{equation}
where  $c_1$ represents the phase velocity of acoustic waves in the water column, and is taken to be a mildly varying function of the depth coordinate $y$. Supplementary material § 1.1 discusses the type of variations for which such an approximation would be admissible, and considers examples where the vertical distribution of acoustic speed in the ocean is described by the Munk profile (Munk Reference Munk1974).
The combined wave field (acoustic-gravity and Scholte) is free to propagate in the horizontal direction, and here the radiation conditions consistent with left-to-right propagation are used. In the water column, the acoustic-gravity wave field is trapped vertically between two boundaries,  $y= 0$ and $y = h$. Hence $\phi (x,y;t)$ can be represented alternatively as
 \begin{equation} \phi(x,y;t) = \iint_{k,\omega} ({\rm d}A_1 \cos\alpha y + {\rm d}A_2 \sin\alpha y)\exp({{\rm i} (k x - \omega t)}), \end{equation}
where  $\textrm {d}A_1 = (\textrm {d}C_1 + \textrm {d}C_2)$ and $\textrm {d}A_2 = \textrm {i}(\textrm {d}C_1 - \textrm {d}C_2)$. Both representations are used in this work.
In general, the wave field in the seafloor could be comprised of bulk waves and surface waves. Bulk-wave components possible in the present situation are one seismic pressure wave (P-wave) component with particle oscillation along the propagation direction, and one shear wave (SV-wave) component with particle oscillations perpendicular to the propagation direction but in the  $(x,y)$ plane (Graff Reference Graff1991). Since the seafloor layer extends to $y \rightarrow -\infty$, the Fourier–Stieltjes representations for the potentials $\phi '$ and $H'_z$ in the solid are
 \begin{equation} \phi'(x,y; t) = \iint_{k, \omega} {\rm d}A'_1 \exp({-{\rm i}\bar{\alpha} y}) \exp({{\rm i}(kx - \omega t)}) \end{equation}
and
 \begin{equation} H'_z(x,y; t) = \iint_{k, \omega} {\rm d}B'_1 \exp({-{\rm i}\bar{\beta}y})\exp({{\rm i}(kx - \omega t)}), \end{equation}
where  $\textrm {d}A'_1 = \textrm {d}A'_1(\omega,{\boldsymbol k})$ and $\textrm {d}B'_1 = \textrm {d}B'_1(\omega,{\boldsymbol k})$ are the Fourier coefficients representing the extensional (dilatational) or P-wave and distortional SV-wave potential components, respectively, through the seafloor (Graff Reference Graff1991, chapter 6). Thus
 \begin{equation} {\bar{\alpha}} = \sqrt{(\omega^2/c^2_p - k^2)}\quad {\rm and}\quad {\bar{\beta}} = \sqrt{(\omega^2/c^2_s - k^2)}, \end{equation}
where  $c_p$ and $c_s$ denote, respectively, the phase velocities of extensional and shear waves in the seafloor, and are taken to be mildly varying functions of the horizontal coordinate $x$ in the propagation direction. The criteria for variations in $c_p$ and $c_s$ that can be included under the mild non-uniformity approximation are discussed in supplementary material § 1.1.
Substitution of the expansions (2.12) and (2.14) into the interface (boundary) conditions of (2.5) (true for all  $x$ and $t$) leads to the relations (cf. Hasselmann Reference Hasselmann1963)
 \begin{gather} \left.\begin{gathered} -\lambda(k^2 + \alpha^2)({\rm d}A_1\cos\alpha h + {\rm d}A_2\sin\alpha h) = 0,\quad {\rm at}\ y = h, \\ \alpha\,{\rm d}A_2 +{\rm i}\bar{\alpha}\,{\rm d}A' + {\rm i} k\,{\rm d}B' = 0,\quad {\rm at}\ y = 0, \\ -\lambda (k^2 + {\alpha}^2)\,{\rm d}A_1 + [\lambda' (k^2 + \overline{\alpha}^2) + 2\mu'\overline{\alpha}^2]\,{\rm d}A'_1 + 2\mu' k \bar{\beta}\,{\rm d}B_1'= 0,\quad {\rm at}\ y = 0, \\ -2{\rm i} k \bar{\alpha}\,{\rm d}A' + (k^2 - \bar{\beta}^2)\,{\rm d}B'_1 = 0,\quad {\rm at}\ y = 0. \end{gathered}\right\} \end{gather}
In other words, a vector  ${\boldsymbol {\textrm {d}A}}$ comprised of the four Fourier coefficients in (2.18) would represent a free wave field when
 \begin{equation} \boldsymbol{\mathsf{D}}\,{\boldsymbol{{\rm d}A}} = \boldsymbol{0}, \end{equation}
where the matrix  $\boldsymbol{\mathsf{D}}$ contains terms in $k$,
$k$,  $\omega$, $h$ and the Lamé constants $\lambda$, $\lambda '$ and $\mu '$, and is given by
 \begin{equation} \boldsymbol{\mathsf{D}} = \begin{bmatrix} -\lambda \gamma^2\cos \alpha h & -\lambda \gamma^2\sin \alpha h & 0 & 0\\ 0 & \alpha & {\rm i}\bar{\alpha} & {\rm i}k\\ -\lambda \gamma^2 & 0 & \lambda'(k^2 +\overline{\alpha}^2)+ 2\mu'{\overline \alpha}^2 & 2\mu' k \bar{\beta}\\ 0 & 0 & -2k\bar{\alpha} & k^2-\bar{\beta}^2 \end{bmatrix}, \end{equation}
where
 \begin{equation} \gamma^2 = {\left(\frac{\omega}{c_1}\right)}^2 = k^2 + \alpha^2. \end{equation}
The condition for non-trivial solutions for the potentials,
 \begin{equation} \Vert \boldsymbol{\mathsf{D}}\Vert = 0, \end{equation}
leads to algebraic relations that can be used to obtain dispersion surfaces on which  $\omega$ and ${\boldsymbol k}$ for a particular propagation direction lie. Equation (2.22) has multiple roots, with each surface $(\omega _n, {\boldsymbol k}_n)$ defining the $n$th natural mode for the two-layer system under the present interface conditions.
Some special cases arise when  $k = 0$, such as would occur when the two interacting surface waves producing the acoustic-gravity wave have equal wavelengths and opposite directions (see § 5) – for instance, when surface-wave conditions are influenced by a highly reflective shoreline. The acoustic-gravity waves then travel only vertically and generate a disturbance into the seafloor. In this case, the matrix $\boldsymbol{\mathsf{D}}$ reduces to $\boldsymbol{\mathsf{D}}_v$, where
 \begin{equation} \boldsymbol{\mathsf{D}}_v = \begin{bmatrix} -\lambda \alpha^2\cos\alpha h & -\lambda \alpha^2\sin\alpha h & 0 & 0\\ 0 & \alpha & {\rm i}\bar{\alpha} & 0\\ -\lambda \alpha^2 & 0 & \lambda' \overline{\alpha}^2+2\mu'{\overline \alpha}^2 & 0\\ 0 & 0 & 0 & -\bar{\beta}^2 \end{bmatrix},\end{equation}
and  $\textrm {d}B_1' = 0$ would mean that there is no distortional particle oscillation component in this case. On the other hand, if the $3\times 3$ determinant multiplying the term $-{\overline \beta }^2$ is zero, that is,
 \begin{equation} \begin{vmatrix} -\lambda\alpha^2\cos\alpha h & -\lambda\alpha^2\sin\alpha h & 0\\ 0 & \alpha & {\rm i}\bar{\alpha} \\ -\lambda \alpha^2 & 0 & \lambda'\overline{\alpha}^2+2\mu'\overline{\alpha}^2 \end{vmatrix} = 0, \end{equation}
then recognizing that  $\lambda '+ 2\mu ' = C'_{11}$ and $\lambda = C_{11}$ represent the elastic moduli for the seafloor and water, respectively (cf. Graff Reference Graff1991, chapter 6), (2.24) would give a relation between $\alpha$, $h$ and $\bar {\alpha }$ that includes the elastic moduli for water and the solid:
 \begin{equation} \alpha \tan \alpha h ={-}{\rm i}\,\frac{C'_{11}}{C_{11}}\,\bar{\alpha}. \end{equation}
With appropriate changes in notation and substitutions, (2.25) is seen to match (5.81) in Jensen et al. (Reference Jensen, Kuperman, Porter and Schmidt2011) for the vertical part of their solution for the compression wave (specifically, with  $\bar {\alpha } \equiv k_{z,b}$, $\alpha \equiv k_z$ and $C_{11}'/C_{11} = \rho ' \alpha ^2/\rho \overline {\alpha }^2$), which admits dissipative leaky modes, thereby improving near-field accuracy of the underwater wave field (Jensen et al. Reference Jensen, Kuperman, Porter and Schmidt2011). The resulting improvement in near-field accuracy could be of consequence to ambient noise and energy conversion directly under regions where shoreward near-shore surface gravity waves interact with their reflections.
In general, the bulk waves and leaky modes may exist alongside seafloor surface-wave modes; here, the seafloor surface modes are studied further, given their closer relationship with microseisms. For seafloor surface waves, potential amplitudes decrease exponentially with depth below the seafloor surface (i.e.  $y<0$). Using the substitutions
 \begin{equation} \alpha' ={-}{\rm i}\bar{\alpha}\quad {\rm and}\quad \beta' ={-}{\rm i}\bar{\beta} \end{equation}
in (2.15), we have
 \begin{equation} \phi'(x,y; t) = \iint_{k, \omega} {\rm d}A'_1\,{\rm e}^{\alpha' y} \exp({{\rm i}(kx - \omega t)}) \end{equation}
and
 \begin{equation} H'_z(x,y; t) = \iint_{k, \omega} {\rm d}B'_1\,{\rm e}^{\beta' y}\exp({{\rm i}(kx - \omega t)}). \end{equation}
With these substitutions, the matrix in (2.20) becomes
 \begin{equation} \boldsymbol{\mathsf{D}} = \begin{bmatrix} -\lambda \gamma^2\cos \alpha h & -\lambda \gamma^2\sin \alpha h & 0 & 0\\ 0 & \alpha & -\alpha' & {\rm i}k\\ -\lambda \gamma^2 & 0 & \lambda'(k^2 -{\alpha'}^2)-2\mu'{\alpha'}^2 & 2{\rm i}\mu' k \beta'\\ 0 & 0 & -2{\rm i}k\alpha' & k^2+{\beta'}^2 \end{bmatrix}. \end{equation}
The dispersion relations resulting from (2.22) now can be expressed in terms of  $(\omega, {\boldsymbol k})$ with real-valued, positive $\alpha '$ and $\beta '$ related to $\omega$ and $k$ according to
 \begin{equation} \left.\begin{gathered} \alpha' = \sqrt{(k^2 - \omega^2/c^2_p)}, \\ \beta' = \sqrt{(k^2 - \omega^2/c^2_s)}. \end{gathered}\right\} \end{equation}
Returning to the case  $k = 0$, now
 \begin{equation} \alpha \tan \alpha h = \frac{\lambda' + 2\mu'}{\lambda}\,\alpha'. \end{equation}
It is noted that for  $k = 0$, $\alpha '$ is still real-valued and positive for $\alpha h > 0$, so the vertical oscillations within the seafloor still decay to zero exponentially. The vertical pressure oscillations on the seafloor in this case can still generate Rayleigh-type waves with the Earth acting as a single semi-infinite elastic medium that is excited over a region by vertical pressure oscillations within a heavy compressible medium (cf. Stoneley Reference Stoneley1926).
If the seafloor is assumed to be rigid, then  $\lambda ',\mu ' \rightarrow \infty$ in (2.31), which would imply that for a finite $\alpha$,
 \begin{equation} \tan\alpha h \rightarrow \infty,\quad {\rm or}\quad \cos\alpha h = 0. \end{equation}
Equation (2.32) leads to the vertical resonance modes given by (cf. Longuet-Higgins Reference Longuet-Higgins1950)
 \begin{equation} \cos \alpha_n h = 0\quad \Rightarrow\quad \frac{\omega_n h}{c_1} = (2n+1)\,\frac{\rm \pi}{2},\quad n = 0, 1, 2, \ldots. \end{equation}
The acoustic-gravity wave frequencies  $\omega _n$ are then
 \begin{equation} \omega_n = \left(n+\frac{1}{2}\right)\frac{{\rm \pi} c}{h},\quad n = 0, 1, 2, \ldots. \end{equation}
If the acoustic-gravity waves are created by a second-order interaction of like-frequency surface waves from opposite directions – so that with  $\sigma$ denoting the angular frequency of surface waves, $\omega _n = 2 \sigma _n$ – then
 \begin{equation} \sigma_n = \left(n+\frac{1}{2}\right)\frac{{\rm \pi} c}{2h},\quad n = 0, 1, 2, \ldots. \end{equation}
This conclusion is in agreement with the result derived by Longuet-Higgins (Reference Longuet-Higgins1950) for like-frequency waves from opposite directions over a rigid seafloor.
Returning to the original situation with a deformable seafloor, when  $\beta ' = 0$ and $\textrm {d}B'_1 \neq 0$ in (2.23), the distortional potential $H_z$ would reduce to
 \begin{equation} H'_z = \int_{\omega} {\rm d}B'_1\exp({-{\rm i}\omega t}), \end{equation}
representing a non-propagating shear-mode oscillation within the seafloor.
Another special case arises when  $\alpha = 0$. Referring back to (2.21), with $\alpha = 0$,
 \begin{equation} k = \frac{\omega}{c_1}, \end{equation}
and the compression waves travel only horizontally as plane waves, and span the entire water depth (cf. Kibblewhite & Wu Reference Kibblewhite and Wu1991). Since propagation then is in the horizontal direction only, the reflected component vanishes. In this case, the compression waves do not force the seafloor vertically. If they occur within canyons, then they may result in seiche modes in the water and seismic modes through the canyon walls, with the appropriate boundary conditions applied in the horizontal directions, though in the open ocean on a flat seafloor, if viscous effects are small, then they would not couple to seafloor waves.
When  $k > \omega /c1$, $\alpha$ becomes imaginary, the downward component decays exponentially with depth, and the compression waves travel horizontally, but are confined to a region close to the water surface. Moreover, for $k \geq \omega /c_1$, free waves in water and in solid can exist independently of each other. Explanatory diagrams showing the different cases of interactions between surface wavenumbers and resulting pressure-wave wavenumbers are discussed by Kibblewhite & Wu (Reference Kibblewhite and Wu1991).
Within the wavenumber range  $0 < k < \omega /c_1$, the compression wave paths are inclined, and their velocities have vertical and horizontal components. They undergo reflection at the seafloor, and some of their energy is transferred to the Scholte waves that they generate. However, the relations in (2.30) further restrict the wavenumber range for Scholte wave generation, since $\alpha '$ and $\beta '$ are real only if $\omega /c_p < k$ and $\omega /c_s < k$, respectively. Because $c_s \leq c_p$ typically, the admissible wavenumber range for the acoustic-gravity–Scholte wave system could be expressed as $\omega /c_s < k < \omega /c_1$, but more generally, it is needed that
 \begin{equation} \frac{\omega}{c_s}, \frac{\omega}{c_p} < k < \frac{\omega}{c_1}. \end{equation}
Over the  $(\omega, k)$ range defined by (2.38), the acoustic-gravity and Scholte waves travel horizontally along the $x$ axis as a group, with a vertical variation as expressed in (2.14) (and/or (2.12)).
3. Propagation in mildly non-uniform media
In the treatment below, the dispersion relations for the inclined acoustic-gravity–Scholte wave coupled systems that result from (2.22) are cast in a form that is used next to study propagation in media with mild spatial non-uniformity (see Whitham (Reference Whitham1973, chapter 11) and supplementary material § 1.1). In particular, acoustic speed  $c_1$ in water is taken to be a known function of the depth coordinate $y$, and the two propagation speeds $c_p$ and $c_s$ in the seafloor are assumed to change mildly with horizontal position ${\boldsymbol x}$. Water depth $h$ is still assumed to be uniform in this study. Free waves are considered first.
3.1. Free-wave propagation
From (2.22) and in terms of the pressure wave Fourier–Stieltjes coefficients,
 \begin{equation} {{\rm d}}A_2 = f_1\,{\rm d}A_1,\quad {\rm d}A'_1 = f_2\,{\rm d}A_1\quad {\rm and}\quad {\rm d}B'_1 = f_3\,{\rm d}A_1, \end{equation}
where
 \begin{equation} \left.\begin{gathered} f_1 ={-}\cot \alpha h, \\ f_2 ={-}\frac{\alpha}{\alpha' - {\rm i} k C/D}\,f_1, \\ f_3 ={-}\frac{C}{D}\,f_2. \end{gathered}\right\} \end{equation}
 It is noted that an alternative expression for  $f_1$ can be stated:
 \begin{equation} f_1 = \left(\frac{-\lambda \gamma^2}{A +BC/D}\right) \div \left(\frac{-\alpha}{\alpha' + {\rm i}kC/D}\right). \end{equation}
Essentially, setting the two expressions for  $f_1$ to be equal is equivalent to expanding the determinant $\Vert \boldsymbol{\mathsf{D}}\Vert = 0$. The quantities $A$,
$A$,  $B$,
$B$,  $C$ and $D$ are given by
 \begin{equation} \left.\begin{gathered} A = \lambda'(k^2 - {\alpha'}^2)-2\mu'{\alpha'}^2, \\ B = 2{\rm i}\mu'k\beta', \\ C ={-}2 {\rm i}k \alpha',\\ D = {\beta'}^2 + k^2. \end{gathered}\right\} \end{equation}
Now,  $\textrm {d}A_1$ represents one of the Fourier coefficients of the vertically trapped acoustic-gravity wave field in the water column. It is recalled that the acoustic speed in water is related to $\rho$, the density of seawater, and $\lambda$, the Lamé constant (elastic modulus) of seawater. The seafloor Lamé constants $\lambda '$ and $\mu '$,along with the material density $\rho '$, give the two velocities $c_p$ and $c_s$. Summarizing,
 \begin{equation} c^2_1 = \frac{\lambda}{\rho},\quad c^2_p = \frac{\lambda'+2\mu'}{\rho'}\quad {\rm and}\quad c^2_s = \frac{\mu'}{\rho'}, \end{equation}
where  $c_1$ and $(c_p, c_s)$ are taken to be mildly varying functions of $y$ and $x$, respectively (see supplementary material § 1.1). The wavenumber is now included as a vector ${\boldsymbol k} = (k_1, k_2)$ in order to bring out the propagation direction $\theta _p$. For the given media (seawater and seafloor), $\alpha$, $\alpha '$ and $\beta '$ are determined for any ( $\omega, k)$ on the dispersion surface for the given boundary conditions; $\alpha '$ and $\beta '$ represent solid particle motion that decays exponentially with depth beneath the seafloor. Specific wave groups can be tracked by following particular $(\omega, {\boldsymbol k})$ combinations on the dispersion surface. Individual wave groups travel at the group velocity $(C_{k_1}, C_{k_2})$, which remains constant for that group in uniform media, though it is a function of position in spatially non-uniform media. In spatially non-uniform media, $\omega$ and ${\boldsymbol k}$ for a particular group also change with position, whereas they would remain constant in uniform media. The dispersion surface in non-uniform media with mildly changing properties can be described using $\omega = W({\boldsymbol k}, {\boldsymbol x}, y)$ (Whitham Reference Whitham1973). Following the general discussion in (Whitham Reference Whitham1973, chapter 11), for propagation of the acoustic-gravity–Scholte wave system, if $\theta _{\pm } = ({\boldsymbol k}\boldsymbol {\cdot }{\boldsymbol x} \pm \alpha y- \omega t)$, then the consistency conditions resulting from $\theta _{tx} = \theta _{xt}$, $\theta _{x_1 x_2} = \theta _{x_2 x_1}$, $\theta _{ty} = \theta _{yt}$, and so on, yield
 \begin{equation} \left.\begin{gathered} \frac{\partial k_i}{\partial t} + \frac{\partial \omega}{\partial k_j}\, \frac{\partial k_i}{\partial x_j} \pm \frac{\partial \omega}{\partial \alpha}\, \frac{\partial k_i}{\partial y}+ \frac{\partial \omega}{\partial x_i} = 0,\quad i, j = 1, 2, \\ \frac{\partial \alpha}{\partial t} \pm \left(\frac{\partial \omega}{\partial k_j}\, \frac{\partial \alpha}{\partial x_j} + \frac{\partial \omega}{\partial \alpha}\, \frac{\partial \alpha}{\partial y} + \frac{\partial \omega}{\partial y}\right) = 0,\quad j = 1, 2, \\ \frac{\partial k_i}{\partial x_j} - \frac{\partial k_j}{\partial x_i} = 0,\quad \pm \frac{\partial \alpha}{\partial x_i} -\frac{\partial k_i}{\partial y} = 0,\quad i, j = 1, 2, i \neq j, \end{gathered}\right\} \end{equation}
with summation implied over the index  $j$ in the first two conditions of (3.6). The $+$ and $-$ signs indicate downward and upward propagation, respectively. The group velocity components are defined as
 \begin{equation} \frac{\partial \omega}{\partial k_i} = C_{k_i}, i = 1, 2,\quad {\rm and}\quad \frac{\partial \omega}{\partial \alpha} = C_{\alpha}. \end{equation}
Equation (3.6) then can be rewritten as
 \begin{equation} \left.\begin{gathered} \frac{\partial k_1}{\partial t} + C_{k_1}\, \frac{\partial k_1}{\partial x_1} + C_{k_2}\, \frac{\partial k_1}{\partial x_2} \pm C_\alpha\, \frac{\partial k_1}{\partial y}={-}\frac{\partial \omega}{\partial x_1}, \\ \frac{\partial k_2}{\partial t} + C_{k_1}\,\frac{\partial k_2}{\partial x_1} + C_{k_2}\, \frac{\partial k_2}{\partial x_2} \pm C_\alpha\,\frac{\partial k_2}{\partial y} ={-}\frac{\partial \omega}{\partial x_2}, \\ \frac{\partial \alpha}{\partial t} \pm \left(C_{k_1}\,\frac{\partial \alpha}{\partial x_1} + C_{k_2}\,\frac{\partial \alpha}{\partial x_2} + C_\alpha\,\frac{\partial \alpha}{\partial y}\right) ={\mp}\frac{\partial \omega}{\partial y}. \end{gathered}\right\} \end{equation}
The term on the right-hand side is non-zero in each equation because  $\omega$ has an explicit dependence on ${\boldsymbol x}$ and $y$ in the two non-uniform media here. The characteristic curves for this system can be described as (Whitham Reference Whitham1973; see also Hasselmann Reference Hasselmann1963)
 \begin{equation} \left.\begin{gathered} \frac{{\rm d}{\boldsymbol x}}{{\rm d} t} = \frac{\partial W}{\partial {\boldsymbol k}}, \\ \frac{{\rm d}{\boldsymbol k}}{{\rm d} t} ={-}\frac{\partial W}{\partial{\boldsymbol x}}, \\ {\rm with}\quad\omega = W({\boldsymbol k},\alpha, {\boldsymbol x}, y). \end{gathered}\right\} \end{equation}
Because of the non-uniformity in the media,  ${\boldsymbol k}$ and ${\omega }$ for a wave group vary with position as the group propagates, and the characteristics are not straight lines.
An ‘average variational principle’ of Whitham (Reference Whitham1973) could be used to study propagation in the  ${\boldsymbol k}$ direction. For the random wave fields being studied this work, an average variational principle is proposed that utilizes the Fourier coefficients directly. Since the later steps lead to the evolution of wavenumber–frequency spectra, such an approach seems reasonable. Thus
 \begin{equation} J = \iiint_{t,x_1,x_2}\iint_{{\boldsymbol k},\omega}{\rm d}{\mathcal{L}} (\omega, k_1, k_2, {\rm d}A_1)\exp({{\rm i}{\boldsymbol k}\boldsymbol{\cdot} {\boldsymbol x} - \omega t})\,{\rm d} t\,{\rm d} x_1\,{\rm d} x_2, \end{equation}
where the integrals over each variable are from  $-\infty$ to $\infty$. Here, $\textrm {d}{\mathcal {L}}$ is defined as
 \begin{equation} {{\rm d}}{\mathcal{L}} = G(\omega, {\boldsymbol k},
\alpha, \alpha', \beta', {\boldsymbol x},
y)\,{\rm d}A_1\,{\rm
d}A^\ast_1,
\end{equation}
\begin{equation} {{\rm d}}{\mathcal{L}} = G(\omega, {\boldsymbol k},
\alpha, \alpha', \beta', {\boldsymbol x},
y)\,{\rm d}A_1\,{\rm
d}A^\ast_1,
\end{equation}
and  $\omega$ itself is $\omega = W({\boldsymbol k}, \alpha, \alpha ', \beta ', {\boldsymbol x}, y)$. Since the non-uniformities are mild in the sense of supplementary material § 1.1, an expression for $G$ is proposed as
 \begin{align} G &= [(\omega^2 - c^2_1(y)\,\alpha^2 - c^2_1(y)\,\vert{\boldsymbol k}\vert^2) + (\omega^2 - c^2_1(y)\,\alpha^2 - c^2_1(y)\,\vert{\boldsymbol k}\vert^2)\,F_1(\alpha)] \nonumber\\ &\quad + [(\omega^2 - c^2_p({\boldsymbol x})\,\alpha'^2 - c^2_p({\boldsymbol x})\, \vert{\boldsymbol k}\vert^2)\,F_2({\boldsymbol k}, \alpha,\alpha',\beta') \nonumber\\ &\quad +(\omega^2 - c^2_s({\boldsymbol x})\,\beta'^2 - c^2_s({\boldsymbol x})\, \vert{\boldsymbol k}\vert^2)\,F_3({\boldsymbol k},\alpha,\alpha',\beta')]. \end{align}
Here, to stress that  $f_1$, $f_2$ and $f_3$ are not constants, the functions $F_1,F_2, F_3$ are introduced such that
 \begin{equation} \left.\begin{gathered} F_1(\alpha) = f_1 f^\ast_1, \\ F_2({\boldsymbol k},\alpha,\alpha',\beta') = f_2f^\ast_2, \\ F_3({\boldsymbol k},\alpha,\alpha',\beta') = f_3 f^\ast_3. \end{gathered}\right\} \end{equation}
 The goal of the variational approach here is to determine a function  $\textrm {d}A_1(\omega, {\boldsymbol k})$ that minimizes the action variable as the wave group propagates horizontally. For the proposed variational approach based on $\textrm {d}{\mathcal {L}}$, the necessary conditions for the minimum are
 \begin{equation} \left.\begin{gathered} \frac{\partial{({\rm d}{\mathcal{L}})}}{\partial ({\rm d}A_1)} = 0,\quad \frac{\partial{({\rm d}{\mathcal{L}})}}{\partial ({\rm d}A^\ast_1)} = 0, \\ \frac{\partial}{\partial t}\left(\frac{\partial({\rm d}{\mathcal{L}})}{\partial \omega}\right) - \frac{\partial}{\partial x_i}\left(\frac{\partial ({\rm d}{\mathcal{L}})}{\partial k_i}\right) - \frac{\partial}{\partial y}\left(\frac{\partial ({\rm d}{\mathcal{L}})}{\partial \alpha}\right) = 0, \end{gathered}\right\} \end{equation}
where the repeated index  $i$ indicates a summation over $i$. In addition, the solutions need to satisfy the present consistency conditions (3.6). For a non-trivial $\textrm {d}A_1$, the first of the necessary conditions (3.14) just gives
 \begin{equation} G(\omega,{\boldsymbol k},\alpha,\alpha',\beta',{\boldsymbol x},y) = 0, \end{equation}
noting that  $\omega = W({\boldsymbol k},\alpha,\alpha ',\beta ',x,y)$. Differentiation of (3.15) with respect to $k_i$ and $\alpha$ leads to
 \begin{equation} \left.\begin{gathered} G_{\omega}\,\frac{\partial \omega}{\partial k_i} + G_{ki} = 0\quad \Rightarrow\quad G_{k_i} ={-}C_{k_i} G_\omega, \\ G_\omega\,\frac{\partial \omega}{\partial \alpha} + G_\alpha = 0\quad \Rightarrow\quad G_\alpha ={-}C_\alpha G_\omega. \end{gathered}\right\} \end{equation}
The subscripts  $\omega$ and $k_i$ here indicate differentiation with the respective quantities. Similarly, differentiation with respect to $x_i$ ( $i = 1, 2$) and $y$ provides
 \begin{equation} \left.\begin{gathered} G_{\omega}\,\frac{\partial \omega}{\partial x_i} + G_{x_i} = 0\quad \Rightarrow\quad \frac{\partial \omega}{\partial x_i} ={-}\frac{G_{x_i}}{G_\omega},\quad i = 1, 2, \\ G_{\omega}\,\frac{\partial \omega}{\partial y} + G_y = 0\quad \Rightarrow\quad \frac{\partial \omega}{\partial y} ={-}\frac{G_\alpha}{G_\omega}. \end{gathered}\right\} \end{equation}
 For the function  $G$ in (3.12), $G_{x_i}$ and $G_y$ can be evaluated as
 \begin{equation} \left.\begin{gathered} G_{xi} = \frac{\partial G}{\partial c_p}\,\frac{\partial c_p}{\partial x_i} + \frac{\partial G}{\partial c_s}\,\frac{\partial c_s}{\partial x_i}, \\ G_y = \frac{\partial G}{\partial c_1}\,\frac{\partial c_1}{\partial y}. \end{gathered}\right\} \end{equation}
 Sound speed  $c_1$ in the ocean water column may in general vary with the latitude, longitude and depth below the surface. In this paper, only the dependence on the depth coordinate $y$ is accounted for.
Now,
 \begin{gather} \left.\begin{gathered} \frac{\partial ({\rm d}{\mathcal{L}})}{\partial \omega} = G_{\omega}\,{\rm d}A_1\,{\rm d}A^\ast_1 + G\,\frac{\partial}{\partial \omega}({\rm d}A_1\,{\rm d}A^\ast_1) = G_{\omega}\,{\rm d}A_1\,{\rm d}A^\ast_1, \\ \frac{\partial ({\rm d}{\mathcal{L}})}{\partial k_i} = G_{k_i}\,{\rm d}A_1\,{\rm d}A^\ast_1 + G\,\frac{\partial}{\partial k_i} ({\rm d}A_1\,{\rm d}A^\ast_1) = G_{k_i}\,{\rm d}A_1\,{\rm d}A^\ast_1={-}G_\omega (C_{k_i}\,{\rm d}A_1\,{\rm d}A^\ast_1), \end{gathered}\right\} \end{gather}
since  $G = 0$, by the necessary condition (3.15). The second of the necessary conditions (3.14) now can be expressed as
 \begin{equation} \frac{\partial}{\partial t}(G_\omega\,{\rm d}A_1\,{\rm d}A^\ast_1) + \frac{\partial}{\partial x_i}(G_\omega C_{k_i}\,{\rm d}A_1\,{\rm d}A^\ast_1) + \frac{\partial}{\partial y}(G_\omega C_\alpha\,{\rm d}A_1\,{\rm d}A^\ast_1) = 0. \end{equation}
The non-uniformity of the media is taken into account in the following steps. The first term in (3.20) can be expanded as
 \begin{align} & \frac{\partial}{\partial t}(G_\omega\,{\rm d}A_1\,{\rm d}A^\ast_1) = \frac{\partial G_\omega}{\partial t}\,{\rm d}A_1\,{\rm d}A^\ast_1 + G_\omega \left(\frac{\partial}{\partial t}\,{\rm d}A_1\,{\rm d}A^\ast_1\right) \nonumber\\ &\quad =\frac{\partial G_\omega}{\partial k_i}\,\frac{\partial k_i}{\partial t}\,{\rm d}A_1\,{\rm d}A^\ast_1+ \frac{\partial G_\omega}{\partial \alpha}\,\frac{\partial \alpha}{\partial t}\,{\rm d}A_1\,{\rm d}A^\ast_1 + G_\omega \left(\frac{\partial}{\partial t}\,{\rm d}A_1\,{\rm d}A^\ast_1\right). \end{align}
The second term in (3.20) implies, for each  $x_i$ in the summation,
 \begin{align} \frac{\partial}{\partial x_i}(G_\omega C_{k_i}\,{\rm d}A_1\,{\rm d}A^\ast_1) &= \frac{\partial G_\omega}{\partial k_i}\,\frac{\partial k_i}{\partial x_i}\,C_{ki}\,{\rm d}A_1\,{\rm d}A^\ast_1+ \frac{\partial G_\omega}{\partial \alpha}\,\frac{\partial \alpha}{\partial x_i}\,C_{k_i}\,{\rm d}A_1\,{\rm d}A^\ast_1 \nonumber\\ &\quad +\frac{\partial G_\omega}{\partial x_i}\,C_{k_i}\,{\rm d}A_1\,{\rm d}A^\ast_1 + G_\omega\,\frac{\partial}{\partial x_i}(C_{k_i}\,{\rm d}A_1\,{\rm d}A^\ast_1). \end{align}
The third term on the right-hand side of (3.22) arises because of the explicit dependence of  $G_\omega$ on ${\boldsymbol x}$. The third term in (3.20) becomes
 \begin{align} \frac{\partial}{\partial y}(G_\omega C_\alpha\,{\rm d}A_1\,{\rm d}A^\ast_1) &= \frac{\partial G_\omega}{\partial k_i}\,\frac{\partial k_i}{\partial y}\,C_\alpha\,{\rm d}A_1\,{\rm d}A^\ast_1 + \frac{\partial G_\omega}{\partial \alpha}\,\frac{\partial \alpha}{\partial y}\,C_\alpha\,{\rm d}A_1\,{\rm d}A^\ast_1 \nonumber\\ &\quad +\frac{\partial G_\omega}{\partial y}\,C_\alpha\,{\rm d}A_1\,{\rm d}A^\ast{+} G_\omega\, \frac{\partial}{\partial y}(C_\alpha\,{\rm d}A_1\,{\rm d}A^\ast_1). \end{align}
Now, combining the first term in the second line of (3.21) with the first terms on the right-hand side of (3.22) and (3.23), and utilizing the consistency conditions (3.8), we have
 \begin{align} & \frac{\partial G_\omega}{\partial k_i} \left(\frac{\partial k_i}{\partial t}\,{\rm d}A_1\,{\rm d}A^\ast_1+ C_{k_j}\, \frac{\partial k_i}{\partial x_j}\,{\rm d}A_1\,{\rm d}A^\ast_1 + \frac{\partial k_i}{\partial y}\,{\rm d}A_1\,{\rm d}A^\ast_1\right) \nonumber\\ &\qquad +\frac{\partial G_\omega}{\partial \alpha} \left(C_{k_j}\,\frac{\partial \alpha}{\partial x_j}\,{\rm d}A_1\,{\rm d}A^\ast_1 + \frac{\partial \alpha}{\partial t}\,{\rm d}A_1\,{\rm d}A^\ast_1+ \frac{\partial \alpha}{\partial y}\,C_\alpha\,{\rm d}A_1\,{\rm d}A^\ast\right) \nonumber\\ &\quad ={-}\frac{\partial G_\omega}{\partial k_i}\,\frac{\partial \omega}{\partial x_i} - \frac{\partial G_\omega}{\partial \alpha}\,\frac{\partial \omega}{\partial y}. \end{align}
The final form of the second of the necessary conditions (3.20) is, for a non-zero  $G_\omega$,
 \begin{align} & \frac{\partial}{\partial t}({\rm d}A_1\,{\rm d}A^\ast_1) + \frac{\partial}{\partial x_i}(C_{k_i}\,{\rm d}A_1\,{\rm d}A^\ast_1) + \frac{\partial}{\partial y}(C_\alpha\,{\rm d}A_1\,{\rm d}A^\ast_1) \nonumber\\ &\quad +\frac{1}{G_\omega}\left(-\frac{\partial G_\omega}{\partial k_i}\, \frac{\partial \omega}{\partial x_i}\,{\rm d}A_1\,{\rm d}A^\ast_1 + \frac{\partial G_\omega}{\partial x_i}\,C_{k_i}\,{\rm d}A_1\,{\rm d}A^\ast_1\right)\nonumber\\ &\quad +\frac{1}{G_\omega}\left(-\frac{\partial G_\omega}{\partial \alpha}\, \frac{\partial \omega}{\partial y}\,{\rm d}A_1\,{\rm d}A^\ast_1 + \frac{\partial G_\omega}{\partial y}\,C_\alpha\,{\rm d}A_1\,{\rm d}A^\ast_1\right) = 0. \end{align}
A wavenumber spectrum in terms of the propagating component  ${\boldsymbol k}$ can be written as (Hasselmann Reference Hasselmann1963; Phillips Reference Phillips1977, chapter 3)
 \begin{equation} S_A({\boldsymbol k},t) = \frac{{\rm d}A_1\,{\rm d}A^\ast_1}{{\rm d}{\boldsymbol k}},\quad {\rm d}{\boldsymbol k} = {\rm d}k_1\,{\rm d}k_2. \end{equation}
Hence, dividing both sides of (3.25) by  $\textrm {d}{\boldsymbol k}$, a relationship for the free-wave wavenumber spectrum for the acoustic-gravity waves propagating in the mildly non-uniform two-media system can be found:
 \begin{align} & \frac{\partial}{\partial t} S_A({\boldsymbol k},t) + \frac{\partial}{\partial x_i}(C_{k_i}\,S_A({\boldsymbol k},t)) + \frac{1}{G_\omega}\left(-\frac{\partial G_\omega}{\partial k_i}\, \frac{\partial \omega}{\partial x_i}\,S_A({\boldsymbol k},t) + \frac{\partial G_\omega}{\partial x_i}\,C_{k_i}\,S_A({\boldsymbol k},t)\right) \nonumber\\ &\quad + \frac{\partial}{\partial y}(C_\alpha\,S_A({\boldsymbol k},t)) + \frac{1}{G_\omega}\left(-\frac{\partial G_\omega}{\partial \alpha}\, \frac{\partial \omega}{\partial y}\,S_A({\boldsymbol k},t) + \frac{\partial G_\omega}{\partial y}\,C_\alpha\,S_A({\boldsymbol k},t)\right)= 0. \end{align}
Equation (3.27) describes how the wavenumber spectrum describing the potential  $\phi$ evolves for free waves. Here, $S_A$ is a measure of energy over a small ball around $(\omega,{\boldsymbol k})$, and although $S_A$ remains constant along a group line in the absence of dissipation, the energy spreads horizontally over time. Equation (3.27) thus also represents the energy conservation (balance) relation for the wave system. The terms within the large parentheses represent the effect of the non-uniformities in the media, through $G_\omega$ and its derivatives with respect to $x_i$ and $y$, as well as through the $x_i$ and $y$ derivatives of the frequency $\omega$. As the wave group $(\omega,{\boldsymbol k})$ propagates in the ${\boldsymbol k}$ direction, both $\omega$ and ${\boldsymbol k}$ change along the group line. The group velocity components $C_{k_i}$ also change along the group line. This contrasts with propagation in uniform media, for which $(\omega,{\boldsymbol k})$ and $C_{k_i}$ for a group remain unchanged along the group line. The changes in group velocity signify continuous refraction of the acoustic-gravity–Scholte wave system as it propagates through the two media.
Equation (3.27) can be developed further by arguing that the partial derivative with respect to time in the first term, together with the partial derivatives with respect to  $x_i$ and $y$, represents the material derivative of $S_A(\omega,{\boldsymbol k})$ along the group trajectory. In addition, $G_{\omega k_i} = G_{\omega \omega }({\partial \omega }{/\partial k_i})$, $\partial \omega /\partial k_i = C_{ki}$, and so on. Hence
 \begin{align} & \frac{{\rm d}
S_A({\boldsymbol k},t)}{{\rm d} t} + \frac{1}{G_{\omega}}
\left[{-}G_{\omega \omega}\,\frac{\partial \omega}{\partial
x_i} + \frac{\partial G_\omega}{\partial
x_i}\right]C_{ki}\,S_A({\boldsymbol k},t) \!+\!
\frac{1}{G_{\omega}}\left[{-}G_{\omega
\omega}\,\frac{\partial \omega}{\partial y} +
\frac{\partial G_\omega}{\partial
y}\right]C_\alpha\,S_A({\boldsymbol k},t) \nonumber\\
&\quad + S_A({\boldsymbol k},t)\left(\frac{\partial
C_{ki}}{\partial x_i} + \frac{\partial C_{\alpha}}{\partial
y}\right) = 0.
\end{align}
\begin{align} & \frac{{\rm d}
S_A({\boldsymbol k},t)}{{\rm d} t} + \frac{1}{G_{\omega}}
\left[{-}G_{\omega \omega}\,\frac{\partial \omega}{\partial
x_i} + \frac{\partial G_\omega}{\partial
x_i}\right]C_{ki}\,S_A({\boldsymbol k},t) \!+\!
\frac{1}{G_{\omega}}\left[{-}G_{\omega
\omega}\,\frac{\partial \omega}{\partial y} +
\frac{\partial G_\omega}{\partial
y}\right]C_\alpha\,S_A({\boldsymbol k},t) \nonumber\\
&\quad + S_A({\boldsymbol k},t)\left(\frac{\partial
C_{ki}}{\partial x_i} + \frac{\partial C_{\alpha}}{\partial
y}\right) = 0.
\end{align}
Now,  $G_\omega$, $G_{ki}$, $G_{\alpha }$, $C_{ki}$, $C_{\alpha }$, $G_{\omega \omega }$, $G_{xi}$, $G_y$, $\partial \omega /\partial x_i$ and $\partial \omega /\partial y$ can be expressed analytically (and evaluated in computer code) from (3.12), (3.16), (3.17), (3.18) and the assumed acoustic speed variations in (6.1). Further, for mildly non-uniform media (Whitham Reference Whitham1973),
 \begin{gather} C_{ki} = \frac{x_i}{t}, \end{gather}
 \begin{gather}\frac{\partial C_{ki}}{\partial x_i} = \frac{1}{t} + \frac{{\bar\partial} C_{ki}}{{\bar\partial} x_i}, \end{gather}
where  $\bar \partial$ defines rate of change in $C_{ki}$ along the $x_i$ direction due to non-uniformity in the media. Similarly,
 \begin{equation} \frac{\partial C_\alpha}{\partial y} = \frac{1}{t} + \frac{{\bar\partial} C_\alpha}{{\bar\partial} y}, \end{equation}
where the overbar defines rate of change in  $C_\alpha$ due to vertical non-uniformity. It is evident that for small $t$, the first term in (3.30) and (3.31) dominates other terms associated with non-uniformities, and $S_A$ varies as in uniform media. The effect of non-uniformities becomes more obvious as $t$ increases. Whereas in the horizontal plane the acoustic-gravity–Scholte waves can propagate to $x_i \rightarrow \infty$, the acoustic-gravity waves are confined within $0\leq y\leq h$ in the $y$ direction, undergoing a number of reflections off the two boundaries as the system propagates horizontally. Since some of the refraction effects during downward travel maybe undone during upward travel (the media properties are assumed to remain constant over time), an averaged quantity is used in the present calculations to represent the net effect of $C_\alpha$ dependence on $y$.
$y$.
The Fourier coefficients  $\textrm {d}A_1$ can be recovered from $S_A$ using the relation $\textrm {d}A_1 = \sqrt {S_A(\omega,{\boldsymbol k})\,\textrm {d}{\boldsymbol k}\,\textrm {d}\omega }$. The Fourier coefficients for acoustic-gravity pressure are related to $\textrm {d}A_1$ as
 \begin{equation} {\rm d}P_1 = \rho \omega^2\,{\rm d}A_1,\quad {\rm or}\quad {\rm d}P_1 = \lambda \gamma^2\,{\rm d}A_1, \end{equation}
where  $\gamma = \omega /c_1 = \sqrt {k^2 + \alpha ^2}$. From (3.32), the wavenumber spectrum $S_P({\boldsymbol k})$ for the pressure variation in the water column can be found as
 \begin{equation} S_P({\boldsymbol k},t) = \frac{{\rm d}P_1\,{\rm d}P^\ast_1}{{\rm d}{\boldsymbol k}} = (\lambda \gamma^2)^2\,S_A({\boldsymbol k},t). \end{equation}
The wavenumber spectra  $S_P$ can be used as estimates of low-frequency ambient noise spectra. The wavenumber spectrum (convertible to frequency spectrum) for the power density is then
 \begin{equation} S_W({\boldsymbol k},t) = \frac{S_P({\boldsymbol k},t)}{\rho c_1}. \end{equation}
The areal density of power  $\varPi (\omega,{\boldsymbol k})$ for the $(\omega,{\boldsymbol k})$ group on the dispersion surface can be evaluated as
 \begin{equation} \varPi({\boldsymbol k},t) = \sqrt{S_W({\boldsymbol k},t)\,{\rm d}{\boldsymbol k}}. \end{equation}
Here,  $\varPi$ is in units such as watts per square metre. Although the wavenumber–frequency spectra are used directly in calculations in this paper, the magnitude of the Fourier coefficient $\textrm {d}P$ gives an idea of second-order pressure amplitudes:
 \begin{equation} \vert {\rm d}P \vert = \sqrt{S_P({\boldsymbol k},t)\,{\rm d}{\boldsymbol k}},\quad {\rm d}{\boldsymbol k} = {\rm d}k_1\,{\rm d}k_2. \end{equation}
Next, the wavenumber–frequency spectrum for the Scholte waves forming part of this group can be found as,
 \begin{equation} \left.\begin{gathered} S_R({\boldsymbol k},t) = [\gamma^2_p\,F_2({\boldsymbol k},\alpha,\alpha',\beta) + \gamma^2_s\,F_3({\boldsymbol k},\alpha,\alpha',\beta')]\,\frac{{\rm d}A_1\,{\rm d}A^{{\ast}}_1}{{\rm d}{\boldsymbol k}} \\ = \omega^2\left[\frac{F_2({\boldsymbol k},\alpha,\alpha',\beta')}{c^2_p} + \frac{F_3({\boldsymbol k},\alpha,\alpha',\beta')}{c^2_s}\right]S_A({\boldsymbol k},t), \\ \vert {\rm d}R \vert = \sqrt{S_R({\boldsymbol k},t)\,{\rm d}{\boldsymbol k}}, \end{gathered}\right\} \end{equation}
where  $\textrm {d}R$ represents the Fourier coefficient for the Scholte wave displacement amplitudes. Here, the relations (3.1a–c), (3.2) and (3.13) have been used, with $\gamma _p = \sqrt {k^2 - \alpha '^2}$ and $\gamma _s = \sqrt {k^2 - \beta '^2}$. Also, $S_R(\omega,{\boldsymbol k})$ is the wavenumber–frequency spectrum for Scholte wave amplitudes, which can be evaluated using the solution for $S_A(\omega,{\boldsymbol k})$; and $S_R$ is derived from Fourier coefficients $\textrm {d}A'_1$ and $\textrm {d}B'_1$, which satisfy both the kinematic and kinetic boundary conditions on the seafloor, in which $\textrm {d}A_1$ and $\textrm {d}A_2$ also play a part (see (2.18)). It is noted that a single formulation leading to the solution to (3.27) here provides the wavenumber spectra for the pressure in the compression waves (also representing ambient acoustic noise) (3.33), the power density (3.35), and the wavenumber spectra for the seafloor Scholte waves (3.37), with the non-uniformities assumed to be mildly varying.
3.1.1. Alternative approach to deriving  $S_A$ and $S_R$


The wavenumber spectra for acoustic-gravity and Scholte wave amplitudes can be derived following a shorter pathway that albeit does not elucidate the effects of non-uniformity of the media as clearly as the more detailed approach above. Equation (3.20) can be expanded by treating the term  $G_\omega \,\textrm {d}A_1\,\textrm {d}A^\ast _1$ as a combined entity, so that
 \begin{align} & \frac{\partial}{\partial t}(G_\omega\,{\rm d}A_1\,{\rm d}A^\ast_1) + C_{k_i}\,\frac{\partial}{\partial x_i}(G_\omega\,{\rm d}A_1\,{\rm d}A^\ast_1) + C_\alpha\,\frac{\partial}{\partial y}(G_\omega\,{\rm d}A_1\,{\rm d}A^\ast_1) \nonumber\\ &\quad +\left(\frac{\partial C_{ki}}{\partial x_i} + \frac{\partial C_\alpha}{\partial y}\right)G_\omega\,{\rm d}A_1\,{\rm d}A^\ast_1 = 0. \end{align}
The repeated index  $i$ implies summation. Here, $G_\omega$ can be derived as
 \begin{equation} G_\omega = 2\omega[1 + F_1(\alpha) + F_2(\alpha, k, \alpha', \beta') + F_3(\alpha, k, \alpha', \beta')],\quad k = \vert{\boldsymbol k}\vert.\end{equation}
Hence it is seen that a multiplication by  $G_\omega$ allows the boundary conditions to be included directly in the following steps. Dividing (3.38) through by $\textrm {d}{\boldsymbol k}$, and introducing a wavenumber spectrum $S_{BC}({\boldsymbol k},t)$ such that
 \begin{equation} S_{BC}({\boldsymbol k},t) = \frac{G_\omega\,{\rm d}A_1\,{\rm d}A^\ast_1}{{\rm d}{\boldsymbol k}},\end{equation}
it is found that
 \begin{align} \frac{\partial}{\partial t}S_{BC}({\boldsymbol k},t) + C_{k_i}\, \frac{\partial}{\partial x_i} S_{BC}({\boldsymbol k},t) + C_{\alpha}\, \frac{\partial}{\partial y} S_{BC}({\boldsymbol k},t) + S_{BC}({\boldsymbol k},t) \left(\frac{\partial C_{ki}}{\partial x_i} + \frac{\partial C_\alpha}{\partial y}\right) = 0. \end{align}
The first three terms represent propagation of a ‘modified’ energy term and can be combined into a single material derivative as
 \begin{equation} \frac{{\rm d}}{{\rm d} t}S_{BC}({\boldsymbol k},t) + S_{BC}({\boldsymbol k},t) \left(\frac{\partial C_{ki}}{\partial x_i} + \frac{\partial C_\alpha}{\partial y}\right) = 0.\end{equation}
Partial derivatives of  $C_{ki}$ and $C_\alpha$ are found as expressed in (3.30) and (3.31). The other effects of non-uniformity are embedded in the multiplication by $G_\omega (\omega, {\boldsymbol k}, \alpha, \alpha ', \beta ')$. For particular wave groups, $S_A({\boldsymbol k},t)$ can be recovered from $S_{BC}({\boldsymbol k},t)$ using
 \begin{equation} S_A({\boldsymbol k},t) = \frac{S_{BC}({\boldsymbol k},t)}{G_\omega}. \end{equation}
Other spectra such as  $S_P$ and $S_R$, and quantities such as $\varPi$, can be found as outlined in (3.34), (3.37) and (3.35), and so on. The alternative approach could serve as a ‘check’ in calculations since there are fewer numerical operations involved in it.
3.2. Uniform media
The treatment above simplifies considerably when the two media are assumed to be uniform. In particular, the second and third terms of (3.27), the second terms of (3.30) and (3.31), and the third terms of (S21) and (S22) in supplementary material § 1.2, tend to zero. For propagation in the horizontal plane, (3.27) and (3.42) become
 \begin{equation} \left.\begin{gathered} \frac{{\rm d}}{{\rm d} t} S_A({\boldsymbol k},t) + \frac{S_A( {\boldsymbol k},t)}{t} = 0, \\ \frac{{\rm d}}{{\rm d} t}S_{BC}({\boldsymbol k},t) + \frac{S_{BC}( {\boldsymbol k},t)}{t} = 0. \end{gathered}\right\} \end{equation}
Here, in the absence of refraction, the propagation of acoustic-gravity waves can be accounted for in terms of cumulative distance travelled (multiples of  $h$ due to successive reflections). Equations (3.44) are used in the present calculations to provide a comparison for the more general case of mildly non-uniform media.
4. Forced wave response
As before, the origin of the coordinate system is at the seafloor, the  $x$ axis is along the propagation direction ${\boldsymbol k}$, and the $y$ axis points vertically upwards, water depth being assumed to be uniform. When the two-media system of §§ 2 and 3 is excited by a stationary random external pressure distribution at its top boundary $y = h$, the ensuing acoustic-gravity–Scholte wave field must be consistent with the boundary conditions at the top and bottom of the water column. These boundary conditions are effectively embedded in the relationships of (3.2), and forced wave wavenumber spectra for the compression and Scholte wave fields can be interrelated easily using the relations in (3.33) and (3.37). Impulsive forcing at the seafloor or stationary random pressure disturbances within or on the water column could be addressed by defining suitably the excitation term in the analysis that follows. However, other approaches, such as that of Renzi & Dias (Reference Renzi and Dias2014), could be better suited for direct time-domain solutions in the case of storm-generated hydroacoustic waves and surface waves, and the approach of Meza-Valle et al. (Reference Meza-Valle, Kadri and Ortega2023) may be preferred in the case when time-domain understanding of rogue waves is needed using their faster-propagating compression wave signatures.
Here, the displacement potential  $\phi _e$ for the acoustic-gravity waves can be related to the pressure excitation at $y=h$ with the help of the linear forced-wave equation as,
 \begin{equation} \frac{\partial^2\phi_e}{\partial t^2} - c^2_1 \nabla^2\phi_e = \frac{p(x,h;t)}{\rho};\quad c^2_1 = \lambda/\rho. \end{equation}
Here, as before,  $\rho$ is seawater density, and $\lambda$ is the Lamé constant for seawater. We consider $\rho$ and $\lambda$ (and hence $c_1$) to be mildly varying functions of the $y$ coordinate in the sense of supplementary material § 1.1, so that (4.1) still describes the response to first order. Here, $p(x,h;t)$ denotes the second-order pressure due to interacting surface waves or a sea–surface pressure disturbance due to an atmospheric phenomenon. Section 5 discusses an approach to determination of this pressure using the properties of interacting surface-wave properties, assuming the surface-wave fields to be stationary random. The pressure excitation can be expanded using the Fourier–Stieltjes integral as
 \begin{equation} p(x,h,t) = \iint_{k,\omega}{\rm d}P(\omega,k)\exp({{\rm i}({\boldsymbol k}\boldsymbol{\cdot} {\boldsymbol x}-\omega t)}), \end{equation}
where  $\textrm {d}P(\omega,k)$ denotes the Fourier coefficient for the pressure excitation ( $k = \vert {\boldsymbol k}\vert$). The forced wave potential $\phi _e(x,y;t)$ is next expanded as
 \begin{equation} \phi_e(x,y;t) = \iint_{k,\omega} {\rm d}B_e(y,\omega,k)\exp({{\rm i}({\boldsymbol k} \boldsymbol{\cdot}{\boldsymbol x}-\omega t)}). \end{equation}
An expansion for the vertical variation of  $\textrm {d}B(y,\omega,k)$ in terms of the vertical eigenfunctions $\psi _n(y)$ that satisfy the boundary conditions (2.18) is proposed:
 \begin{equation} {\rm d}B_e = \sum_{n=1}^{\infty} {\rm d}A_{1en}(\cos\alpha_n y + f_{1n}\sin\alpha_n y). \end{equation}
As indicated in § 2, the first orthogonal mode here is of most interest. Therefore letting  $\textrm {d}A_{1e}$ denote $\textrm {d}A_{1e1}$ for convenience,
 \begin{equation} {\rm d}B(y,\omega,k) \approx {\rm d}A_{1e}(\omega,k)(\cos\alpha y + f_1\sin\alpha y). \end{equation}
It follows that
 \begin{equation} \phi_e(x,y;t) = \iint_{k,\omega}({\rm d}A_{1e}\, (\cos\alpha y + f_1\sin\alpha y)\exp({{\rm i}({\boldsymbol k} \boldsymbol{\cdot}{\boldsymbol x}-\omega t)}).\end{equation}
Substitution of  $\phi _{e}$ into (4.1) leads to
 \begin{align} & \iint_{k,\omega} -\omega^2\,{\rm d}A_{1e}\,(\cos\alpha y + f_1\sin \alpha y) \exp({{\rm i}({\boldsymbol k}\boldsymbol{\cdot}{\boldsymbol x}-\omega t)}) \nonumber\\ &\qquad + c^2_1\iint_{k,\omega} \gamma^2\,{\rm d}A_{1e}\,(\cos\alpha y + f_1\sin \alpha y) \exp({{\rm i}({\boldsymbol k}\boldsymbol{\cdot}{\boldsymbol x}-\omega t)}) \nonumber\\ &\quad =\frac{1}{\rho}\iint_{k,\omega}{\rm d}P(\omega,k) \exp({{\rm i}({\boldsymbol k}\boldsymbol{\cdot}{\boldsymbol x}-\omega t)}), \end{align}
for all  $x$ and $t$ in the domain. Next, both sides are multiplied by $(\cos \alpha y + f_1\sin \alpha y)$. Integration from $0$ to $h$, and use of the orthogonality of the cosine and sine functions, helps to reduce the terms inside the double integral on the left-hand side to
 \begin{equation} -\omega^2(1+f_1)\,{\rm d}A_{1e}\,\frac{h}{2} + c^2_1(k^2 + \alpha^2)(1+f^2_1)\,{\rm d}A_{1e}\,\frac{h}{2}. \end{equation}
Since the exciting pressure distribution  $\textrm {d}P(\omega, k)$ acts on the surface $y=h$ and is not dependent on $y$, the right-hand side can be expressed as
 \begin{align} & \frac{1}{\rho}\int_{0}^{h}\iint_{k,\omega}{\rm d}P(\omega,k)\,(\cos \alpha y + f_1\sin \alpha y) \exp({{\rm i}({\boldsymbol k}\boldsymbol{\cdot}{\boldsymbol x}-\omega t)})\,{{\rm d}y} \nonumber\\ &\quad =\frac{1}{\rho}\iint_{k,\omega}{\rm d}P(\omega,k) \left(\frac{1}{\alpha}\,[\sin \alpha h + f_1(1-\cos\alpha h)]\right) \exp({{\rm i}({\boldsymbol k}\boldsymbol{\cdot}{\boldsymbol x}-\omega t)}), \end{align}
where  $k$ and $\alpha$ represent the first mode of the dispersion relation. Since
 \begin{equation} \frac{\lambda(k^2+\alpha^2)}{\rho} = \frac{\lambda}{\rho}\, \gamma^2_1 = c^2_1\gamma_1^2 = \omega^2_1, \end{equation}
the temporal dynamic condition describing the Fourier coefficients for the forced waves becomes
 \begin{equation} (-\omega^2 + \omega^2_1)(1+f^2_1)\,{\rm d}A_{1e}(\omega,k) = \frac{2\,{\rm d}P(\omega,k)\,[\sin \alpha h + f_1(1-\cos\alpha h)]}{\rho \alpha h}, \end{equation}
where  $\gamma _1$ and $\omega _1$ are, respectively, the quantities $\sqrt {k^2+\alpha ^2}$ and $\omega$ belonging to the dispersion surface for mode 1. The Fourier coefficient $\textrm {d}A_{1e}$ describing the acoustic-gravity component of the forced wave system thus is
 \begin{equation} {\rm d}A_{1e}(\omega,k) = \frac{2 [\sin \alpha h + f_1(1-\cos\alpha h)]}{\rho \alpha h(1+f^2_1)}\, \frac{{\rm d}P(\omega,k)}{-\omega^2 + \omega^2_1}. \end{equation}
It is evident that close to resonance, even small excitations can lead to significant amplitudes in the water column and on the seafloor. Hence it is worthwhile to study the response near resonance in more detail. The total wave field at a frequency  $\omega$ is a linear superposition of the free wave field at $\omega _1$ and the forced wave field at $\omega$:
 \begin{equation} {\rm d}A_{1}(t) = {\rm d}A_{1n}\exp({-{\rm i}\omega_1 t}) + \frac{D_1\,{\rm d}P\exp({-{\rm i}\omega t})}{-\omega^2 + \omega^2_1}, \end{equation}
where
 \begin{equation} D_1 = \frac{2 [\sin \alpha h + f_1(1-\cos\alpha h)]}{\rho \alpha h(1+f^2_1)}. \end{equation}
 The system in (4.13) is reminiscent of an undamped single-degree-of-freedom mechanical oscillator, for which the oscillation amplitude increases as  $t$ when the excitation frequency equals the natural frequency (e.g. see Rao Reference Rao2010, chapter 3). When excitation is random as in the present, acoustic-gravity wave case for which $\omega _1$ represents the first resonance mode, $\omega$ may approach $\rightarrow \omega _1$ for random lengths of time at random intervals, hence a steady increase in the amplitude of $\phi$ is not expected. Therefore, a relationship is sought instead between the wavenumber spectra for the excitation and for the response. In particular, the following representation is sought for the response,
 \begin{equation} \int_{k} {\rm d}A_1\,{\rm d}A^\ast_1\exp({{\rm i} {\boldsymbol k}\boldsymbol{\cdot}{\boldsymbol x}}), \end{equation}
while for the excitation side, the following form is used,
 \begin{equation} \iint_{k,\omega}
{\frac{D^2_1\,{\rm d}P\,{\rm
d}P^\ast}{(-\omega^2 + \omega^2_1)^2}}\,
({\rm e}^{-{\rm i}\omega t} -
{{\rm e}}^{-{\rm i}\omega_1 t}) ({\rm e}^{{\rm i}\omega t
} + {\rm e}^{{\rm i}\omega_1 t}) \exp({{\rm i} {\boldsymbol
k}\boldsymbol{\cdot}{\boldsymbol
x}})\,\delta(\omega-\omega_1),
\end{equation}
\begin{equation} \iint_{k,\omega}
{\frac{D^2_1\,{\rm d}P\,{\rm
d}P^\ast}{(-\omega^2 + \omega^2_1)^2}}\,
({\rm e}^{-{\rm i}\omega t} -
{{\rm e}}^{-{\rm i}\omega_1 t}) ({\rm e}^{{\rm i}\omega t
} + {\rm e}^{{\rm i}\omega_1 t}) \exp({{\rm i} {\boldsymbol
k}\boldsymbol{\cdot}{\boldsymbol
x}})\,\delta(\omega-\omega_1),
\end{equation}
as it leads to a real-valued expression for the acoustic-gravity spectrum and agrees with the result in Hasselmann (Reference Hasselmann1963). As  $\omega \rightarrow \omega _1$, the integrand on the right-hand side without the delta function approaches a $0/0$ indeterminacy. On application of L'Hospital's rule via
 \begin{equation} \lim_{\omega\rightarrow \omega_1} \frac{\dfrac{{\rm d}}{{\rm d}\omega}[D^2_1\,{\rm d}P\,{\rm d}P^\ast\, ({\rm e}^{-{\rm i}\omega t} - {\rm e}^{-{\rm i}\omega_1 t}) ({\rm e}^{{\rm i}\omega t} + {\rm e}^{{\rm i}\omega_1 t})]}{\dfrac{{\rm d}}{{\rm d}\omega} [(-\omega^2 + \omega^2_1)^2]}, \end{equation}
the integrand becomes
 \begin{equation} \frac{-2 {\rm i} t D^2_1\,{\rm d}P\,{\rm d}P^\ast}{(-\omega^2 + \omega^2_1) ({-}4\omega)}\exp({{\rm i}{\boldsymbol k}\boldsymbol{\cdot}{\boldsymbol x}}). \end{equation}
This integrand has poles at  $\omega = \pm \omega _1$ and at $\omega = 0$. Next, substituting (4.18) into the right-hand-side integral in (4.16) as
 \begin{equation} \iint_{k,\omega}\frac{-2 {\rm i} t D^2_1\,{\rm d}P\,{\rm d}P^\ast}{(-\omega^2 + \omega^2_1) ({-}4\omega)}\exp({{\rm i} {\boldsymbol k} \boldsymbol{\cdot}{\boldsymbol x}})\,\delta(\omega-\omega_1), \end{equation}
the limit as  $\omega \rightarrow \omega _1$ can be evaluated using contour integration, where it can be seen that the integral along the circular path with radius approaching infinity converges to zero. Then using just the residue at $\omega = \omega _1$, we have
 \begin{equation} \left.\begin{gathered} R_1 = \lim_{\omega\rightarrow \omega_1} \frac{-{\rm i}t D^2_1\,{\rm d}P\,{\rm d}P^\ast(k,\omega)}{2\omega (\omega+\omega_1)} = \frac{-{\rm i}t D^2_1\,{\rm d}P\,{\rm d}P^\ast({\boldsymbol k},\omega_1)}{4\omega^2_1}, \\ 2{\rm \pi} iR_1= \frac{{\rm \pi} t D^2_1\,{\rm d}P\,{\rm d}P^\ast({\boldsymbol k},\omega_1)}{2\omega^2_1}. \end{gathered}\right\} \end{equation}
The excitation side is then seen to be
 \begin{equation} \int_{\boldsymbol k} \frac{{\rm \pi} tD^2_1}{2\omega^2_1\,{\rm d}\omega}\,{\rm d}P\, {\rm d}P^\ast(\boldsymbol{k,}\omega_1)\exp({{\rm i} {\boldsymbol k}\boldsymbol{\cdot}{\boldsymbol x}}) = \int_{\boldsymbol k} \frac{{\rm \pi} tD^2_1}{2\omega^2_1}\, \frac{{\rm d}P\,{\rm d}P^\ast}{{\rm d}{\boldsymbol k}}\exp({{\rm i} {\boldsymbol k} \boldsymbol{\cdot}{\boldsymbol x}}){\rm d}{\boldsymbol k}. \end{equation}
The left-hand side of (4.15) can be expressed as
 \begin{equation} \int_{\boldsymbol k} \frac{{\rm d}A_1\,{\rm d}A^\ast_1}{{\rm d}{\boldsymbol k}} \exp({{\rm i} ({\boldsymbol k}\boldsymbol{\cdot}{\boldsymbol x})}){\rm d}{\boldsymbol k}, \end{equation}
noting that
 \begin{equation} \frac{{\rm d}A_1\,{\rm d}A^\ast_1}{{\rm d}{\boldsymbol k}} = S_A({\boldsymbol k},t), \end{equation}
where  $S_A$ is the wavenumber–frequency spectrum for the acoustic-gravity waves. It is interesting to observe how the wavenumber spectrum for the acoustic-gravity potential evolves in time. Because the wavenumber spectrum $S_E$ for the excitation pressure is related to $\textrm {d}P$ and $\textrm {d}P^\ast$ as
 \begin{equation} \frac{{\rm d}P\,{\rm d}P^\ast}{{\rm d}{{\boldsymbol k}}} = S_E(\omega_1, {\boldsymbol k}), \end{equation}
the acoustic-gravity wavenumber spectrum evolution in time can be related to the excitation side as
 \begin{equation} \int_{\boldsymbol k}S_A({\boldsymbol k},t) \exp({{\rm i} {\boldsymbol k}\boldsymbol{\cdot}{\boldsymbol x}})\,{\rm d}{\boldsymbol k} = \int_{{\boldsymbol k}} \frac{{\rm \pi} tD^2_1}{2\omega^2_1}\,S_E(\omega_1,{\boldsymbol k}) \exp({{\rm i} {\boldsymbol k}\boldsymbol{\cdot}{\boldsymbol x}})\,{\rm d}{\boldsymbol k}. \end{equation}
The spectrum  $S_A({\boldsymbol k},t)$ at resonance grows linearly with time as long as excitation $S_E(\omega _1,{\boldsymbol k})$ at the natural frequency $\omega _1$ is present. Thus
 \begin{equation} S_A({\boldsymbol k},t)|_{DS} = \frac{{\rm \pi} t D^2_1}{2\omega^2_1}\,S_E(\omega_1,{\boldsymbol k})|_{DS}. \end{equation}
The symbol  $|_{DS}$ indicates that $k = \vert {\boldsymbol k}\vert$ lies on the dispersion surface $({\boldsymbol k},\omega )$. Equation (4.26) shows the rate at which energy is being added to the acoustic-gravity waves (and by extension, also Scholte waves) excited when a pressure spectrum excites a particular $({\boldsymbol k}, \omega _1)$ that lies on the dispersion surface. Multiple $({\boldsymbol k}, \omega _1)$ combinations that lie on the dispersion surface can be accounted for using linear superposition. Of the multiple dispersion surfaces that satisfy (2.19) and (2.20), only the fundamental dispersion surface (dispersion mode 1) is considered here for the depth range $\sim$1000–3500 m.
Independently, (4.26) can be generalized to represent the cumulative effect of multiple generation areas that particular wave groups on the dispersion surface may encounter along their propagation paths. For the simpler case of propagation in uniform media, we have
 \begin{equation} S_A({\boldsymbol k},t) = \sum_{n=1}^{N_G} \frac{{\rm \pi} (t_{ne} - t_{ns}) D^2_1}{2\omega^2_1}\, S_E(\omega_1,{\boldsymbol k}) + \int_{t_{ne}}^t \frac{S_A({\boldsymbol k},\tau)}{\tau}\,{\rm d}\tau. \end{equation}
Here,  $t > t_{ne}$ denotes the present time, $t_{ns}$ is the time at which a group enters the $n$th generation area, $t_{ne}$ is the time when it leaves that area, $\tau$ is the time integration variable, and $N_G$ is the number of generation areas. Multiple generation areas along the propagation path could enable reinforcement of spectral amplitudes affected by (i) higher-order detuning effects (Kadri & Akylas Reference Kadri and Akylas2016), and (ii) changes in surface-wave spectral content due to nonlinearities (Komen & Hasselmann Reference Komen and Hasselmann1996). The duration under each generation area of projected length $L_n$ along the propagation direction can be estimated as
 \begin{equation} t _{ne}-t_{ns} = \frac{L_n}{C_k}, \end{equation}
where  $C_k$ is the horizontal group velocity of the wave group. The compression wave pressure wavenumber spectra (representing ambient noise), seafloor power densities and microseism amplitude wavenumber spectra under forcing $S_E$ can be evaluated using (3.33), (3.35) and (3.37), respectively, with the forced response wavenumber spectra $S_A$ evaluated using (4.27).
5. Excitation by interacting surface waves
To derive the wavenumber–frequency spectrum  $S_E$ that excites the acoustic-gravity–Scholte wave fields of § 4, the approach of Hasselmann (Reference Hasselmann1963) is adopted here. Although several alternatives estimating the surface-wave excited frequency spectra at the seafloor have been proposed since (e.g. Hughes Reference Hughes1976; Webb & Cox Reference Webb and Cox1986; Kibblewhite & Wu Reference Kibblewhite and Wu1991), the approach of Hasselmann (Reference Hasselmann1963) is the most general since it enables a full account of all wave periods and directions represented within available records of wave spectra. This is particularly important for multi-mode surface-wave spectra (e.g. Ochi Reference Ochi1998, chapter 7), and in wave conditions where swells and wind waves have overlapping periods and nearly opposing directions. Such wave fields may occur when waves from different parts of a storm's trajectory intersect. Figure 2 shows an overview of the action of interacting waves and acoustic-gravity and Scholte waves.
Schematic overview of the dynamics, with the interacting surface waves on the free surface, the acoustic-gravity waves and the Scholte waves. The cross-bars on the arrows provide a notional indication of the wavelengths of the surface waves and the acoustic-gravity and Scholte waves.

Following Hasselmann (Reference Hasselmann1963), the wave profile  $\zeta (x_1, x_2; t)$ is assumed to be a stationary random process. It may be expanded in terms of Fourier coefficients as
 \begin{equation} \zeta(x_1, x_2; t) = \iint_{{\boldsymbol \kappa}, \sigma} {\rm d} Z({\boldsymbol\kappa},\sigma) \exp({{\rm i}({\boldsymbol\kappa}\boldsymbol{\cdot}{\boldsymbol x} - \sigma t)}), \end{equation}
where  ${\boldsymbol \kappa }$ and $\sigma$ represent, respectively, the wavenumber vector and the angular frequency of the surface-wave system. The velocity potential $\varGamma (x_1, x_2, y; t)$ can be represented as
 \begin{equation} \varGamma(x_1, x_2, y; t) = \iint_{{\boldsymbol \kappa},\sigma} {\rm d}E({\boldsymbol \kappa}, \sigma)\exp({{\rm i}({\boldsymbol \kappa} \boldsymbol{\cdot}{\boldsymbol x} - \sigma t)})\,{\rm e}^{\kappa z},\quad z = y-h, \kappa = \vert{\boldsymbol \kappa}\vert. \end{equation}
Here,  $\zeta$ and $\varGamma$ are related by the kinematic and kinetic boundary conditions to be satisfied approximately at the undisturbed free surface (Hasselmann Reference Hasselmann1963). The second-order pressure due to the interaction of the wavenumbers ${\boldsymbol \kappa }$ at frequencies $\sigma$ contained within the wave field can be represented as
 \begin{equation} p({\boldsymbol x}; t) ={-}\rho ({\boldsymbol \nabla} \varGamma ({\boldsymbol x}, y; t))^2, \end{equation}
with
 \begin{equation} \frac{\partial \varGamma}{\partial t} ={-}g\zeta,\quad {\rm or}\quad -\frac{{\rm i}\sigma}{g}\,\varGamma = \zeta\quad \Rightarrow\quad \varGamma = \frac{ig\zeta}{\sigma}. \end{equation}
Hence representing
 \begin{align} p({\boldsymbol x}; t) ={-}\rho g^2\iint_{{\boldsymbol \kappa},\sigma} \iint_{{\boldsymbol \kappa}', \sigma'} {\rm d}Z\,{\rm d}Z'\,(\kappa \kappa' - {\boldsymbol \kappa}{\boldsymbol \kappa}')\exp[-{\rm i}(({\boldsymbol \kappa} + {\boldsymbol \kappa}')\boldsymbol{\cdot}{\boldsymbol x} - (\sigma + \sigma')t)]\,\frac{1}{\sigma \sigma'}, \end{align}
where the term  $(\kappa \kappa ' - {\boldsymbol \kappa }{\boldsymbol \kappa })$ arises from the $(\boldsymbol \nabla \varGamma )^2$ operation (the scalar term from differentiation in the vertical direction, the vector term from differentiation in the horizontal plane), with the integration over ${\boldsymbol \kappa }$ and ${\boldsymbol \kappa }'$ allowing interactions over the entire range of wavenumbers to be considered, the wavenumber–frequency spectrum for the second-order pressure in (5.5) can be found by multiplying the right-hand side by the complex conjugate of itself. Next, knowing that the surface-wave wavenumber–frequency spectra can be expressed as
 \begin{equation} S_\zeta({\boldsymbol \kappa},\sigma) = \frac{{\rm d}Z\,{\rm d}Z^\ast}{{\rm d}{\boldsymbol \kappa}\,{\rm d}\sigma}\quad {\rm and}\quad S_{\zeta'}({\boldsymbol \kappa}',\sigma') = \frac{{\rm d}Z'\,{\rm d}Z'^\ast}{{\rm d}{\boldsymbol \kappa}'\,{\rm d}\sigma'}, \end{equation}
the wavenumber–frequency spectrum for  $p({\boldsymbol x}; t)$, which forms the excitation spectrum $S_E({\boldsymbol k}, \omega )$ of § 4, is found to be
 \begin{align} S_E({\boldsymbol
k},\omega) &= \rho^2 g^4 \iint_{{\boldsymbol
\kappa},\sigma} \iint_{{\boldsymbol \kappa}', \sigma'}
S_\zeta({\boldsymbol \kappa},\sigma)\,
S_{\zeta}'({\boldsymbol \kappa}',\sigma')\,(\kappa \kappa'
- {\boldsymbol \kappa}{\boldsymbol \kappa}')^2 \nonumber\\
&\quad \times\frac{1}{(\sigma \sigma')^2}\,[\delta( {\boldsymbol k} - ({\boldsymbol \kappa} +
{\boldsymbol \kappa}'))][\delta(\omega - (\sigma +
\sigma'))]\,{\rm d}{\boldsymbol \kappa}\, {\rm d}{\boldsymbol \kappa}'\,{\rm
d}\sigma \,{\rm d}\sigma'.
\end{align}
\begin{align} S_E({\boldsymbol
k},\omega) &= \rho^2 g^4 \iint_{{\boldsymbol
\kappa},\sigma} \iint_{{\boldsymbol \kappa}', \sigma'}
S_\zeta({\boldsymbol \kappa},\sigma)\,
S_{\zeta}'({\boldsymbol \kappa}',\sigma')\,(\kappa \kappa'
- {\boldsymbol \kappa}{\boldsymbol \kappa}')^2 \nonumber\\
&\quad \times\frac{1}{(\sigma \sigma')^2}\,[\delta( {\boldsymbol k} - ({\boldsymbol \kappa} +
{\boldsymbol \kappa}'))][\delta(\omega - (\sigma +
\sigma'))]\,{\rm d}{\boldsymbol \kappa}\, {\rm d}{\boldsymbol \kappa}'\,{\rm
d}\sigma \,{\rm d}\sigma'.
\end{align} Since only three waves  ${\boldsymbol \kappa }$, ${\boldsymbol \kappa }'$ and ${\boldsymbol k}$ are involved in the interaction, the ${\boldsymbol k}$ wave must follow a dispersion relation different to that of the two surface waves ${\boldsymbol \kappa }$ and ${\boldsymbol \kappa }'$ for there to be meaningful energy transfer. This is possible when ${\boldsymbol k}$ is the horizontal wavenumber of an acoustic-gravity wave, which travels at a much greater phase velocity and follows a dispersion relation that allows such a three-wave interaction. In order to satisfy the acoustic-gravity dispersion relations, $k$ must therefore be much smaller than $\kappa$ and $\kappa '$, while $\omega$ is at least the same order of magnitude as $\sigma$. Therefore, it is mostly ${\boldsymbol \kappa }$ and ${\boldsymbol \kappa }'$ that are nearly opposed in directions that would dominate the integral in (5.7) (see schematic illustration in figure 3), in the process implying that the acoustic-gravity wave frequency would be nearly twice the surface-wave frequency. Although multiple combinations $({\boldsymbol \kappa }, {\boldsymbol \kappa }',\sigma, \sigma ')$ would be included within the integral in (5.7), an implicit further condition is that the relevant $({\boldsymbol \kappa },\sigma )$ combinations fall within the wavenumber and frequency ranges of practical surface-wave conditions. (See Phillips (Reference Phillips1960, Reference Phillips1977, chapter 3) for a discussion of the surface-wave dispersion relation precluding three-waveinteractions among three surface waves but allowing four-wave surface-wave interactions.)
Schematic concept diagram illustrating the interaction between two surface waves with wavenumbers  ${\boldsymbol \kappa }$ and ${\boldsymbol \kappa }'$ at frequencies $\sigma _1$ and $\sigma _2$. When two surface waves are nearly parallel, their interaction would lead to a horizontal wavenumber ${\boldsymbol k}$ that may be too large to lie on the dispersion surface for the acoustic-gravity–Scholte wave system (a), though with nearly opposing surface waves, the resulting horizontal wavenumber is small enough to lie on the dispersion surface (b), so resonant energy transfer can occur. The contribution of wave components like (b) will therefore dominate the integral in (5.7).

Here, as captured by the delta functions in (5.7), the wavenumbers and frequencies of the interacting three-wave system are related according to e.g. Hasselmann (Reference Hasselmann1966) and Ardhuin (Reference Ardhuin2018) as
 \begin{equation} {\boldsymbol \kappa} + {\boldsymbol \kappa}' = {\boldsymbol k}\quad {\rm and}\quad \sigma + \sigma' = \omega. \end{equation}
 It has been observed that the dominant surface-wave frequencies over long time periods are  $\sim$0.1–0.11 Hz (or $\sigma,\sigma ' \sim 0.628$ rad s $^{-1}$), corresponding to swells of periods 9–10 s that travel long distances over the ocean surface after being generated by one or more storms (Webb Reference Webb1986). Therefore, it is plausible that the dominant acoustic-gravity–Scholte wave frequencies would be in the range 0.2–0.22 Hz (or $\omega \sim 1.26$ rad s $^{-1}$). Consequently, when two 10 s swells of wavenumbers $\kappa \sim 0.0162$ rad m $^{-1}$ interact in a depth of 2800 m for which the acoustic-gravity–Scholte wave dispersion relationship gives $k = 5.78 \times 10^{-4}$ rad m $^{-1}$ for a soft rock type seafloor, there is only a small range of swell directions, and the resulting acoustic-gravity–Scholte wave group direction for which the relationship ${\boldsymbol \kappa } + {\boldsymbol \kappa }' = {\boldsymbol k}$ will be satisfied, giving $\sigma + \sigma ' = \omega = 1.256$ rad s $^{-1}$. The $k$ value from the dispersion relation just implies resonant energy transfer. Hence when the surface-wave directional spectra are available, it is relatively straightforward to estimate, using a formal version of the diagram in figure 3, the direction in which bulk of the energy from the second-order interaction of the surface waves will travel as acoustic-gravity–Scholte waves.
These considerations are important for siting seafloor energy converter arrays in given geographic locations in the ocean, or when determining the angular ranges for the seafloor or coastal seismometers that would record particular storm activity at a particular time. As mentioned, a multi-directional wave field with overlapping wind-wave and swell conditions could be generated by a single storm if it travels over a curved trajectory.
Assuming that a multi-directional wave field is translating over the ocean surface at a velocity  ${\boldsymbol U}$, which may be changing as the storm propagates (see, for instance, Marshall & Plumb Reference Marshall and Plumb2008, chapter 6), we have
 \begin{equation} \left(\frac{{\rm d}{\boldsymbol U}}{{\rm d} t}\right)_O = \left(\frac{{\rm d}{\boldsymbol U}}{{\rm d} t}\right)_o + \boldsymbol{\varOmega}\times {\boldsymbol U}, \end{equation}
where  $O$ is the origin of an Earth-fixed reference frame, while $o$ is the origin of a reference frame travelling with the storm. Here, $\boldsymbol {\varOmega } = (0, 0, f_3)$, with $f_3 = f_e\cos L_t$ representing the Earth's angular velocity component at the latitude $L_t$ at which the storm-centred coordinate system origin $o$ is placed. The translation of the present acoustic-gravity–Scholte wave system is thus referenced to the storm-centred coordinate system $o- x_1 x_2 y$. The frequencies as expressed in $o- x_1 x_2 y$ therefore need to be adjusted according to the velocity ${\boldsymbol U}$ at which the surface-wave system is travelling (Phillips Reference Phillips1977, chapter 3) as expressed relative to the Earth-fixed reference frame at $O$.
$O$.
For instance, if a single storm causes the two interacting surface waves of frequency  $\sigma = 0.628$ rad s $^{-1}$ ( $f = 0.1$ Hz), but currently the storm is moving at ${\boldsymbol U} = 10$ km h $^{-1}$ at an angle $\theta _u$, then the two interaction equations (5.8a,b) in the moving reference frame need to be amended as
 \begin{equation} \left.\begin{gathered} {\boldsymbol \kappa} + {\boldsymbol \kappa}' = {\boldsymbol k}, \\ \sigma + \sigma' = \omega', \\ \omega = \omega' + {\boldsymbol k}\boldsymbol{\cdot}{\boldsymbol U}. \end{gathered}\right\} \end{equation}
The frequency recorded by a seafloor-fixed sensor will be  $\omega$, while $\omega ' = 1.256$ rad s $^{-1}$. Since ${\boldsymbol k}\boldsymbol {\cdot }{\boldsymbol U} = 1.6\times 10^{-3}\cos (\theta _p-\theta _u)$, we have $\omega \in [1.2544, 1.2576]$ rad s $^{-1}$, as $(\theta _p-\theta _u) \in [0, {\rm \pi}]$. Greater differences may be observed for fast-moving storms.
6. Results
Two sets of result are presented here: (1) results obtained to gain insight into group propagation in the coupled two-media system and the effect of non-uniformity on the wavenumber spectra; and (2) results examining how successfully the theory can be applied to explain seafloor sensor observations. Results illustrating the spread of acoustic-gravity energy with propagation distance, and the corresponding decrease in the amplitude of acoustic-gravity waves at long distances from the generation area, are obtained for both sets. Both sets of results are computed for locations in the Atlantic Ocean, 36 $^\circ$N, 34 $^\circ$W and 36.5 $^\circ$N, 32.5 $^\circ$W. The former approximately represents the centre of an array of sensor stations deployed during April 2013 as part a larger study of the ‘Rainbow’ hydrothermal field close to the Mid-Atlantic Ridge (Canales et al. Reference Canales, Dunn and Sohn2013; Dunn et al. Reference Dunn, Arai, Eason, Canales and Sohn2017).
Sensor data were accessed through the IRIS interface (IRIS 2022) supported by the US National Science Foundation. Figure 4 shows the sensor locations and the bathymetry around the area. Surface-wave data at these coordinates were available as hindcasts based on the Wave Watch III (WW3) model (Tolman Reference Tolman2002), and made available through the ERDDAP data repository (ERDDAP 2022). The hindcast results for both locations (36 $^\circ$, 34 $^\circ$W and 36.5 $^\circ$N, 32.5 $^\circ$W) for the period 23–30 April 2013 were supplied to a Python code for the pressure evaluations according to the full procedure outlined in § 5.
Approximate bathymetry plot showing the location of the sensor array deployed during April 2013 as part of a wider study on the Rainbow hydrothermal field (Canales et al. Reference Canales, Dunn and Sohn2013; Dunn et al. Reference Dunn, Arai, Eason, Canales and Sohn2017). The array is comprised of 46 sensor stations spanning an area  $80\,\textrm {km} \times 32\,\textrm {km}$, with average inter-sensor spacing 7 km (Dunn et al. Reference Dunn, Arai, Eason, Canales and Sohn2017). Data from sensor station rows 2 and 3 are used further in this work, including pressure–frequency variations for the sensors marked with circles around them. This figure was generated by Joey Stanley, Johns Hopkins University.

Pressure data from rows 2 and 3 indicated in figure 4 as accessed from ERDDAP (2022) are used here, as they appear to align with the acoustic-gravity–Scholte wave group propagation directions for swell–wind–sea interactions during the day/time under study. Although both pressure transducer data and seismometer data are available from (IRIS 2022), it was learned that the seismometer data are band-pass filtered to a pass-band 5–20 Hz to highlight the seafloor response to airgun pulses (Dunn et al. Reference Dunn, Arai, Eason, Canales and Sohn2017). Since the pass-band excludes the frequency band of interest to this study ( $\sim$0.1–1.0 Hz), only the pressure gauge data are used here. Raw sensor measurement time series are Fourier transformed numerically, after which the frequency-dependent calibration functions are applied to convert the raw measurements into Pascal units. Summary results showing locations of plausible generation areas and the observed pressure amplitudes for two wave groups are shown alongside the station location in figure 15, and are discussed further in § 7. Representative Fourier transforms of sensor measurements are shown in figure 14.
There is a range of depths represented within the area occupied by the sensor stations in figure 4. Two wave groups are selected for further study due to their prominence in the frequency distributions of the pressure measurements at various stations during the chosen time window, namely, 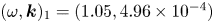 $(\omega, {\boldsymbol k})_1 = (1.05, 4.96\times 10^{-4})$ and $(\omega,{\boldsymbol k})_2 = (1.2, 5.787\times 10^{-4})$, although other groups are also represented strongly in the frequency distributions. Surface-wave conditions at a point north-east of the station array (36.5 $^\circ$N, 32.5 $^\circ$W) and at the point approximately above the array centre (36 $^\circ$N, 34 $^\circ$W), are shown in tables 1 and 2.
Hindcast data (ERDDAP 2022) at 36.5 $^\circ$N, 32.5 $^\circ$W, north-east of the sensor array location (Canales et al. Reference Canales, Dunn and Sohn2013). Data from hour 00:00 to 01:00 UTC on 27 April 2013 (highlighted) are used to provide conditions at generation area 1.

Here, SD means swell direction, SP means swell period, SH means swell height, WD means wind-wave direction, WP means wind-wave period, and WH means wind-wave height.
Hindcast data (ERDDAP 2022) at 36 $^\circ$N, 34 $^\circ$W (Canales et al. Reference Canales, Dunn and Sohn2013). This is the nominal location of the array. These data provide the conditions for generation areas 2–5. Data from hour 00:00 to 01:00 UTC on 27 April 2013 (highlighted) are used.

Here, SD means swell direction, SP means swell period, SH means swell height, WD means wind-wave direction, WP means wind-wave period, and WH means wind-wave height.
For the set 1 results with a single generation area shown in figure 10, the highlighted conditions in table 2 are used. Multiple generation areas along the propagation path are proposed for set 2 results shown in figures 16 and 17. For these results, table 1 conditions are used for generation area 1, which is approximately 25 km north-east of the array. Table 2 conditions are used for the generation areas spanning the array, because the hindcast data are available only at resolution  $0.5^\circ \times 0.5^\circ$, and changes over the extent of the array are expected to be small.
The seafloor parameter values assumed in the calculations are approximately based on known data from the literature (e.g. Dunn et al. Reference Dunn, Arai, Eason, Canales and Sohn2017). The seafloor density is taken to be  $2.5\times 10^{3}$ kg m $^{-3}$, assuming a soft-rock structure. For the uniform media calculations, the dilatational and shear wave velocities are assumed to be $c_p = 5.2 \times 10^3$ m s $^{-1}$, and $c_s = 3.0\times 10^3$ m s $^{-1}$, respectively, while the seawater acoustic speed is taken to be $1.5\times 10^3$ m s $^{-1}$. For the non-uniform media calculations, the following variations are assumed:
 \begin{equation} \left.\begin{gathered} c_p(x) = c_{pa} + \frac{{\rm \Delta} c_p}{\vert X\vert}\,x,\quad {\rm \Delta} c_p = c_{pb} - c_{pa},\\ c_{p1}(x) = c_p(x)\cos \theta_s,\quad c_{p2}(x) = c_p(x)\sin\theta_s, \\ c_{s}(x) = c_{sa} + \frac{{\rm \Delta} c_p}{\vert X\vert}\,x,\quad {\rm \Delta} c_s = c_{sb} - c_{sa}, \\ c_{s1}(x) = c_s(x)\cos\theta_s,\quad c_{s2}(x) = c_s(x)\sin\theta_s, \\ c_1(y) = c_{1o}(1 + \epsilon\,f(y)), \\ f(y) = \left(\frac{-2(y+1300)}{1300} - 1 + \exp\left(-\frac{2(y + 1300)}{1300}\right)\right),\quad \epsilon = 7.37\times 10^{{-}3}. \end{gathered}\right\} \end{equation}
 The horizontal plane speed variation is assumed to occur over a line defined by the angle  $\theta _s$, and in general, $\theta _s \neq \theta _p$, the group propagation direction. Here, $\vert X\vert$ is the distance over which the changes ${\rm \Delta} c_p$ and ${\rm \Delta} c_s$ occur. The vertical variation of the phase speed is approximated using the profile derived by Munk (Reference Munk1974). The values $c_{1o} = 1.5\times 10^3$ m s $^{-1}$, $c_{pa} = 5.2\times 10^3$ m s $^{-1}$, $c_{pb} = 2.2\times 10^3$ m s $^{-1}$, $c_{sa} = 3.0\times 10^3$ m s $^{-1}$ and $c_{sb} = 1.2\times 10^3$ m s $^{-1}$ are used. For the angle $\theta _s$, a value $\theta _s = 20^\circ$ is used. The $c_p$ and $c_s$ variations of (6.1) are shown in figure 5(a), while the speed variation in the vertical direction is shown in figure 5(b).
Phase velocity variations used in the seafloor half-space and in the water column. Graphs plot the relations outlined in (6.1). (a) Seafloor phase velocities. (b) In-water phase velocity.

7. Discussion of results
Figure 6 plots the dispersion relation for the first three modes for uniform media, following the normalization of Hasselmann (Reference Hasselmann1963) for  $h = 2800$ m. Uniform media are assumed for this figure, with $c_p = 5.2\times 10^{3}$ m s $^{-1}$, $c_s = 3.0\times 10^{3}$ m s $^{-1}$ and $c_1 = 1.5\times 10^{3}$ m s $^{-1}$. The first three dispersion curves along the propagation direction are shown, with the abscissa showing the ratio $\omega h/2{\rm \pi} c_1$, while the ordinate is $c_R/c_1$, the ratio of the Scholte wave phase speed $c_R = \omega /k$ and $c_1$, with $k = \vert {\boldsymbol k}\vert$. Also shown is the phase velocity of a Rayleigh wave travelling on land with air as the upper medium, approximated here as $0.9194c_s$ for a Poisson ratio ( $\nu _r = 0.251$) (Graff Reference Graff1991). The three modes here were detected with a numerical search procedure followed by outlier replacement with linearly interpolated values and rejection of spurious roots. For all three modes, for a given depth $h$, the phase speed of the seafloor wave increases as frequency $\omega$ decreases, approaching a constant value as $\omega$ increases. The plots are seen to match qualitatively those of Hasselmann (Reference Hasselmann1963, figure 2) and Eyov et al. (Reference Eyov, Klar, Kadri and Stiassnie2013, figure 2). A further match is noted with the Eyov et al. (Reference Eyov, Klar, Kadri and Stiassnie2013) result for mode 1, for which as the abscissa decreases towards zero, the ratio $c_R/c_1$ is seen to approach that for the Rayleigh wave on land. This behaviour suggests that as $(\omega h/2{\rm \pi} c_1) \rightarrow 0$ for mode 1, the Scholte wave velocity approaches that of a Rayleigh wave on land. For a given frequency $\omega$, this represents the situation when depth $h \rightarrow 0$ and a propagating Scholte wave of frequency $\omega$ loses the water layer above and turns into a Rayleigh wave, as also observed by Eyov et al. (Reference Eyov, Klar, Kadri and Stiassnie2013).
Dispersion curves for the first three modes of the acoustic-gravity–Scholte wave system, as represented in terms of the normalized frequency  $\omega$ and the ratio of the phase speeds of the seafloor Scholte wave and the water-column acoustic-gravity wave. Solutions for the three modes as detected by numerical search were plotted after rejecting spurious roots and replacing clear outliers with linearly interpolated values.

Since for figure 6 the media are assumed to be uniform,  $\omega _n = W({\boldsymbol k}_n)$ for a propagation direction defined by ${\boldsymbol k} = (k_1, k_2)$, with $n$ denoting the $n$th eigenmode of the acoustic-gravity–Scholte wave coupled system. The frequency $\omega$ and wavenumber ${\boldsymbol k}$ of the acoustic-gravity–Scholte wave coupled system are determined by the interacting surface waves as discussed in § 5. Energy transfer to mode $n=1$ will be greatest when this $(\omega, k)$ pair lies on the dispersion surface for mode 1. In addition, the amount of energy that is available for this transfer is determined by the energy in, and the directions of, ${\boldsymbol \kappa }$ and ${\boldsymbol \kappa }'$, and the length of time or spatial area over which the interacting wave field remains statistically stationary. It is noted that $c_R/c_1$ changes rapidly in the range $0 \leq \omega h/2{\rm \pi} c_1 \leq 1$, which, for a practically relevant surface-wave frequency range $f \leq 0.5$ Hz, implies a water depth $h \sim 3000$ m for dominant energy transfer to mode 1 (which defines the fundamental dispersion surface).
Figure 7 shows the pressure variation with frequency, over an hour-long period from UTC 00:00 to 01:00 on 27 April for 36 $^\circ$N, 34 $^\circ$W. A peak is observed near $\omega = 1.2$ rad s $^{-1}$ ( ${\omega }/{2{\rm \pi} } = 0.2$ Hz), corresponding to the average frequency ${(\sigma _1+\sigma _2)}/{2} = 0.1$ Hz for the interacting surface waves. For well-developed wave spectra, this pressure peak could indicate interacting swells from the directions of different storm systems. However, the present conditions are noted for a passing storm for which considerable period overlap is recorded between the swell and wind–sea components, with the two components approaching each other obliquely from directions separated by over 100 $^\circ$. Note that these pressures at $y = h$ are the driver for the acoustic-gravity–Scholte wave system. The pressure magnitudes over the band 1.0–1.7 rad s $^{-1}$ are large enough for energy transfer to any wavenumbers that satisfy the dispersion relationship together with that frequency.
Second-order pressure evaluated at the surface with the method of § 5.

The corresponding group velocities are shown in figures 8(a,b), which compare the group velocity variations for the two wave groups  $(\omega, {\boldsymbol k})_1 = (1.05, 4.96\times 10^{-4})$ and $(\omega,{\boldsymbol k})_2 = (1.2, 5.787\times 10^{-4})$. The group velocities with non-uniform media are found to be different from those for a uniform medium for both wave groups. The horizontal and vertical group velocity components are seen to be smaller than the phase velocities. Differences in the horizontal group velocity components along $x_1$ and $x_2$ emerge as propagation distance increases. Appreciable bending of the group velocity components along the horizontal directions is noticed, though for the vertical component, the change in group velocity with depth is more pronounced.
Group velocity variation in the horizontal plane and in the vertical direction with mild non-uniformity in the media. Group velocities without non-uniformities are shown for comparison. (a) Horizontal  $(x_1, x_2)$ plane. (b) Vertical direction $y$.
$y$.

Figure 9 plots the different non-uniformity related terms in (3.27) for a comparison of their relative magnitudes. All are seen to be small compared with  $1/t$ (see (3.30) and (3.31)) until $t$ becomes large enough. Thus the farther the wave system travels, the more effect the non-uniformity in the media has on its propagation, as one would expect.
Comparison of terms arising from non-uniformity in the media in (3.27), relative to  $1/t$. The effect of non-uniformity builds over time and eventually will exceed $1/t$. Distance travelled by a group is group velocity $\times$ time.

Figures 10(a–d) show the spatial variation of the wavenumber spectra with and without non-uniformity accounted for (a logarithmic scale is used in order to bring out small differences). The difference between the wavenumber spectra for acoustic-gravity wave amplitudes with and without the non-uniformity accounted for is seen to be two orders of magnitude smaller over the spatial range considered here (see figure 11). The wavenumber spectra  $S_A$ increase linearly over the generation area, with a slope proportional to the excitation spectrum due to the interacting surface waves. Given the present focus on investigating the dominant presence of resonant modes and seafloor surface modes for the present depth range (1000–3000 m), not much attention has been given here to estimation of the leaky modes noted by Jensen et al. (Reference Jensen, Kuperman, Porter and Schmidt2011) in the presence of a depth-dependent density non-uniformity. However, since bulk waves and leaky modes may occur alongside the surface-wave modes, it should be noted that their dissipative effects over propagation distances exceeding 100 km could be significant for larger depths where higher modes of the dispersion relations would play a greater role. As in Hasselmann (Reference Hasselmann1963), it is argued that the effect of leaky modes may be less significant for mode 1 than for the higher modes of the water-column compression wave–seafloor wave dispersion relations.
Wavenumber spectra for seafloor pressure and Scholte wave displacements for the two wave groups with and without non-uniformity, as found based on § 3: (a)  $S_a({\boldsymbol k})$ over $x_1$, (b) $S_{a}({\boldsymbol k})$ over $x_2$, (c) $S_r({\boldsymbol k})$ over $x_1$, (d) $S_{r}({\boldsymbol k})$ over $x_2$.

(a) Relative errors due to the uniformity assumption relative to the mild-uniformity results. The differences are seen to be small. (b) Relative difference between the wavenumber spectra predicted by the two techniques discussed in the text (§§ 3 and 3.1.1). The difference is smallest at the edge of the generation area.

Of particular interest are the power variations for the acoustic-gravity waves. Figure 12 shows plots for the power and Scholte wave amplitudes along with the acoustic-gravity and Scholte wave potential amplitudes. At distances  ${\sim }40$ km, the power is seen to have dropped to less than less than 10 % of the value at the edge of the hypothesized generation area. The fact that the power results suffer a $1/\vert X\vert ^2$ spreading as opposed to the $1/\vert X\vert$ spreading for Scholte and acoustic-gravity wave amplitudes has implications for the utilization potential of these waves for power conversion and storm tracking, respectively. The power amounts would be greater when the generation area is larger and when favourable surface-wave conditions last longer. It should be noted also that the location of the generation area and the frequency–wavenumber combinations may be shifting with time as the surface-wave conditions change and/or the higher-orderdetuning effect grows. Hence it is necessary to generate power data over at least a year in order to be able to provide a fair assessment of particular sites. Furthermore, the actual power densities available at a point are to be integrated over the range of wave groups represented in the frequency–pressure plots such as figures 7 and 14, whereas only two wave groups are shown here. Nevertheless, an insight into the spreading rate as gathered from figures 12 and 13 is useful in assessing the overall power density potential of acoustic-gravity waves.
Variation of the power and Scholte wave amplitudes with distance from a single generation area north-east of the array for two wave groups.

Fourier coefficients for pressure and Scholte wave amplitudes with distance from a single generation area north-east of the array for two wave groups.

As indicated in the observational data of figure 14, pressure amplitudes peak at approximately 1.05 and 1.2 rad s $^{-1}$, both of which correspond to plausible wavenumbers (in light of figure 3) that lie on the fundamental dispersion surface. It is noted further that generation areas over depth 3200 m lead to a peak response at 1.05 rad s $^{-1}$ at a wavenumber $4.96\times 10^{-4}$ m $^{-1}$ that lies on the fundamental dispersion surface, while the peak 1.2 rad s $^{-1}$ at a wavenumber $5.787\times 10^{-4}$ m $^{-1}$ (on the fundamental dispersion surface for this depth) is more pronounced for generation areas over a depth ${\sim }2900$ m.
Representative observational data: measurements during the same hour at selected stations.

Figure 15 indicates that sensors at OBS15, OBS16, OBS18, OBS27 and OBS26 show peaks at 1.0 rad s $^{-1}$ together with large amplitudes at 1.2 rad s $^{-1}$, while sensors at OBS12, OBS34, OBS33, OBS31, OBS30, OBS29 and OBS28 show peaks at 1.2 rad s $^{-1}$ with large amplitudes at 1.0 rad s $^{-1}$. The pattern of pressure amplitudes in figure 15 suggests the presence of multiple areas along the propagation direction shown (which is consistent with interacting swell and wind–sea components in the surface-wave spectra) that contribute energy to the two wave groups. Thus relatively large amplitudes are followed by decreasing amplitudes for some distance, after which larger peaks are noted again. Typically, the peaks become large close to deeper regions ( ${\sim }2900$ m or ${\sim }3200$ m), suggesting that more energy is added to the one or both of the groups near the deeper regions. Presumably, this effect is due to smaller generation areas where surface-wave conditions are favourable (cf. figure 3). A total of four generation areas can be identified with water depths consistent with the observed frequency peaks, besides the area north-east of the array. The north-east location is chosen based on its bathymetry ( ${\sim }2900$ m– ${\sim }3200$ m) and its alignment with the propagation direction along rows 2 and 3. The chosen locations of the five generation areas are consistent with the depths shown in the bathymetry chart, and their sizes are determined so as to be consistent with the recorded pressure peak amplitudes in Pa (see figure 16).
Sensor measurements during UTC 00:00 to 01:00 on 27 April 2013, showing the recorded values in Pa for groups 1 and 2. Also shown are approximate locations of plausible generation areas and the propagation direction of the wave groups.

Pressure variation with multiple generation areas with areas and interaction times along with sensor measurements in two rows in the array. (a) Sensor-recorded pressure amplitudes for the group 1 plot are for  $\omega = 1.04$ rad s $^{-1}$. (b) Sensor amplitudes for the group 2 plot are at $\omega = 1.2$ rad s $^{-1}$.

Scholte wave amplitude variation with multiple generation areas with areas and interaction times: (a) group 1, (b) group 2.

7.1. Implications for seafloor energy availability
This work considers wave groups propagating as acoustic-gravity–Scholte wave systems that are excited by interacting surface waves. The frequency and wavenumber vector of a particular wave group are determined by the frequencies and wavenumber vectors of the interacting waves. When the resulting acoustic-gravity–Scholte wave frequency and wavenumber lie on a dispersion surface (representing the free wave or natural modes) at a given depth for given material properties of the two media, resonant energy transfer occurs from the interacting surface waves to the second-order acoustic-gravity–Scholte wave system, with its propagation direction being determined by the vector sum in (5.10). The interaction time and the size of the generation area depend on the speed at which the surface-wave system (such as generated by a storm) propagates, or in other words, by the length of time over which higher-order detuning effects remain small, and a wave field with favourable interactions remains statistically stationary given changes in wind patterns. Greater generation areas lead to greater energy in the acoustic-gravity–Scholte wave system. Power transfer is maximum in the direction of propagation as determined by the resonant wavenumber vector.
With dissipation effects ignored, energy remains constant over the group line as the group propagates. However, as group components spread over a longer distance, the power density decreases with the square of the distance from the generation area for a group travelling in a particular propagation direction (Whitham Reference Whitham1973). The results discussed above are for two of the multiple wave groups that satisfy the fundamental dispersion relation over different depths, and the total power density would be obtained by integration over all available wave groups.
It is interesting to note the role a non-uniform bathymetry plays in the presence of multiple small generation areas giving rise to broader-band distributions for power and pressure, though uniform bathymetry would allow larger generation areas and therefore more energy to be concentrated in a band around a single wave group. The present formulation needs to be extended to incorporate depth non-uniformities more smoothly.
For seafloor power conversion applications, locating a wide rectangular or circular array of seafloor devices close to frequently observed storm tracks would be advantageous. For utilization of ordinary wave conditions, it may be worth locating arrays of seafloor devices in areas where swells from different storm systems have been observed to meet frequently. Alternatively, areas where wind seas and frequently changing wind directions are more common may also be good candidate locations. With year-long wave period, height and direction statistics together with nearby bathymetry and seafloor properties in hand, the method investigated above can be applied to quantify daily and monthly seafloor power availability statistics at a given location. In all cases, widely spread arrays of converters would be advantageous as the groups with resonant frequency–wavenumber combinations may arrive from a range of directions as determined by the periods, directions and water depths over interaction areas around a site. Power conversion from purely vertically travelling acoustic-gravity waves may be practical when the interacting wave fields contain like frequency waves from opposite directions over a duration of time. Such conditions are more likely in near-shore regions where reflections from vertical walls, cliffs or other bathymetric features are common. In this situation, the resonant frequency will be determined by the local depth, and available power amounts could be appreciable during periods of high surface-wave energy.
7.2. Implications for storm tracking
In contrast to the seafloor energy conversion application (loosely dependent on the square of the acoustic-gravity wave amplitude), storm tracking with seafloor seismometers depends on the seafloor amplitudes themselves, which diminish less rapidly (than acoustic-gravity power) with distance from the generation area unless multiple generation areas are encountered along the propagation path (see figure 17).
The computed Scholte wave amplitudes for group 1 seem somewhat larger than those for group 2, while the opposite is true for pressure amplitudes (figure 13). This difference stems from the parameters appearing in the boundary conditions, and could be used to advantage in storm tracking or long-term observation of ocean properties (such as depth-wise density distribution) when both pressure and seismometer data are available at a given location. Even though measurable displacement amplitudes may be available at great distances from the storm centre, the propagation direction is still dependent on the periods and directions of the interacting surface waves, and could change over different time periods as the constituents of (5.10) change over time. For this reason, it appears that access to several geographically spread out pressure transducers and seismometers would be helpful for efficient storm tracking. For historically recorded storms, when hindcast wave data are available, a knowledge of the vector  ${\boldsymbol k}$ (particularly its direction) as inferred from the interacting ${\boldsymbol \kappa }$ and ${\boldsymbol \kappa }'$ could help to determine candidate seismometer locations to study, at least over regions where a relatively flat seafloor over a large spatial scale can be assumed. When attempting to track an unknown storm, three-dimensional seismometer measurements on the seafloor could be used to infer the magnitude and direction of ${\boldsymbol k}$, when the approximate depth and seafloor material properties in the neighbourhood are known.
7.3. Implications for ambient noise and microseism activity
It is noted that the acoustic-gravity and Scholte wave components have the same frequency and wavenumber. The present results suggest that they travel in groups at a speed smaller than the phase velocity of either component. The predicted wavenumber spectra for the acoustic-gravity and Scholte wave components decrease at the same rate with distance along the group line. Variations in seafloor material properties and water depths may cause the Scholte wave components to scatter and spread over a band about the group propagation direction. Explicit incorporation of depth non-uniformities in the solution would likely lead to a more precise understanding of this effect. Inclusion of additional layers in the seafloor model and separation of the water column into two layers (mixed layer and deep layer) also could lead to further enhancements in accuracy. This work represents a step towards a more complete description.
A potentially interesting observation from an ocean acoustics standpoint could be that low-frequency ocean ambient noise may exist in packets of high and low pressures that propagate both horizontally and vertically. Moreover, their energy propagates at the group velocity of the compression–Scholte wave groups. The Fourier coefficients  $\textrm {d}P$ for the compression-wave pressure determine the contribution to each frequency of the compression–Scholte wave field, with ${\boldsymbol k}$ determining the wavelength. Since the energy in a group propagates at the group velocity, the coupling between compression waves and Scholte waves could become important when tracing the source of a large underwater disturbance (such as an explosion).
8. Conclusion
The main goal of this paper was to gain insights into the propagation of acoustic-gravity and Scholte waves generated by second-order interactions among multi-directional surface waves. A mathematical model was investigated analytically, guided by the approach of Hasselmann (Reference Hasselmann1963). That approach was extended here to study propagation of water-column compression waves and Scholte waves travelling as a group through a non-uniform two-media system comprised of the ocean water column with depth-dependent density, and a non-uniform and anisotropic deformable seafloor half-space. To simplify analytical solution, the non-uniformity in the media was assumed to be mild. Further, because the treatment utilized the group behaviour of the water-column compression and seafloor waves, a single formulation now allowed calculation of water-column pressures (leading to ambient acoustic noise estimates), seafloor power densities (for potential energy conversion) and seafloor surface-wave amplitudes (leading to estimations of microseisms). The kinematic and kinetic interface/boundary conditions were specified using acoustic speeds in the two media, material densities and water depth. For application at mid-ocean depths, although acoustic speeds in water and in the solid were assumed to be mildly varying spatially, the water depth was assumed to be constant. Water depths were assumed to be between 1000 m and 3500 m so that energy transfer over the mode 1 (or fundamental) dispersion surface would be dominant. For stationary random wave fields of acoustic-gravity and Scholte waves, wavenumber spectra for free-wave groups were derived based on the variational principle of Whitham (Reference Whitham1973). The free-wave solution could be used in a study of compression–Scholte wave systems generated impulsively, for instance, by explosions in the water column or by rapid seafloor movements. A forced wave solution accounting for multiple generation areas was also derived, with a focus on resonant excitation of any wave groups represented on the dispersion surface. The wavenumber–frequencyspectra for the excitation pressure due to second-order interaction of multi-directional waves were found following the formulation of Hasselmann (Reference Hasselmann1963).
The forced wave solutions were compared with observational data, using surface-wave hindcasts (ERDDAP 2022; to derive surface-wave conditions for a chosen time period) and observational data for a site in the Atlantic Ocean (36 $^\circ$N, 34 $^\circ$W; to obtain seafloor pressures over that time period). Acoustic-gravity pressure data (obtained with low-frequency differential pressure gauges) at 22 sensor stations were used for this purpose (IRIS 2022). Surface-wave conditions were found to be suitable for resonant forcing of a few modes on the fundamental dispersion surface. Propagation of two groups was studied. Predicted results were found to be consistent with the observational results for both groups. Due to the local seafloor features, potential uncertainties in the assumed seafloor properties, and the assumption of loss-free or zero-dissipation propagation, a precise match was not expected. It was found, however, that a combination of generation areas and their locations could be devised approximately to reconstruct sensor measurements over a finite area, and these results could be utilized to derive approximate estimates at down-wave points along the propagation paths.
Available acoustic-gravity power densities at the seafloor were estimated for two wave groups. Power density for particular groups was found to decrease rapidly with propagation distance, though the actual power densities will be derived by integration over individual wave groups propagating in the same direction that are consistent with the dispersion relations over the propagation paths. The effect of media non-uniformity was found to be small, albeit growing with propagation distance as the wave group underwent effects of cumulative refraction. Principal implications of these findings for seafloor energy conversion and for storm tracking were summarized in § 7. It was also found that a combined use of pressure and seismometer measurements could enhance storm tracking methods, while characterization of ambient noise could also benefit from accounting for the group behaviour of acoustic-gravity and Scholte waves. Further work needed includes extension of the present method to non-uniform water depths. A multi-layer seafloor model to account for different types of sediment layers and inclusion of dissipation in sediment layers could enhance the applicability of the present method.
Supplementary material
Supplementary material is available at https://doi.org/10.1017/jfm.2024.682.
Acknowledgements
I am grateful to the US Office of Naval Research (ONR) for supporting this research and to Dr S. Coombe of ONR for his advice and ideas. Much appreciation also goes to J. Stanley of Johns Hopkins University for his assistance, and to M. McBeth of the Naval Information Warfare Center–Atlantic and M. Wardlaw of the ONR for many discussions on related subjects. I am grateful also for the additional support of the ONR and the National Science Foundation towards other related research efforts. It is a pleasure to thank Dr S. Elgar of the Wood Hole Oceanographic Institution for his deep insights into wave phenomena and suggestions on presentation of results and on the entire manuscript, and Dr T. Haine of Johns Hopkins University for his insights into ocean science and helpful suggestions on the manuscript. Much appreciation is due also to the referees of this paper for their insightful comments and suggestions for improvement.
Declaration of interests
The author reports no conflict of interest.


 Open access