

The emergence of the current obesity pandemic has been accompanied by a concomitant increase in related morbidities, especially metabolic syndrome and diabetes mellitus(1). This has made it increasingly important to discover and develop foods, or functional food ingredients, that suppress food intake (FI) and improve metabolic regulation. Foods, or food ingredients, that suppress appetite and FI have the potential to correct the chronic energy imbalance that leads to obesity, thus offering an inexpensive and safe alternative to other obesity treatments such as pharmaceuticals or surgery.
Pulses, the edible seeds of pod-bearing leguminous plants including chickpeas, lentils, beans and yellow peas, have a low glycaemic index and are very high in protein and dietary fibre which are more satiating than other macronutrients(Reference Anderson and Li2–Reference Anderson, Aziz and Abou Samra4). Epidemiological studies have consistently shown an association between consumption of pulses and reduced risk of obesity, diabetes mellitus and components of metabolic syndrome(Reference Sichieri5–Reference Cunha, de Almeida and Sichieri7).
Pulses are also reported to have significant short-term physiological benefits. When consumed alone or as part of a mixed-macronutrient meal, pulses suppress appetite and blood glucose (BG) not only to the meal, but also following a subsequent meal served up to 4 h later(Reference Wong, Mollard and Zafar8) (R. C. Mollard et al., unpublished results). Although the health benefits associated with pulse consumption are well documented, the component, or components, responsible for their effects has not been investigated. This led us to investigate the isolated fibre and protein fractions of yellow peas to determine if these components are responsible for the observed beneficial effects on the glycaemic response and weight management of whole pulses. Yellow peas (Pisum sativum) were chosen because despite being among the least expensive and most abundant non-oilseed pulses, their consumption in the countries with the highest rates of overweight and obesity (mostly North American and European markets) is extremely low(Reference Schneider9). Yellow peas are also safe and inexpensive; and high-quality, food-grade fibre and protein fractions are commercially available and approved for human consumption.
The hypothesis of the present study was that the suppression of short-term FI, appetite and BG after consumption of whole yellow peas is due, at least in part, to their protein and fibre fractions. Therefore, the objective of the present study was to investigate the effects of isolated yellow pea protein and fibre, given individually, on short-term FI 30 and 120 min later as well as subjective appetite, and glycaemic response in young, healthy men. Furthermore, this study provides an insight into the efficacy of yellow pea fractions as value-added ingredients aimed at suppressing FI and controlling BG response.
Experimental methods
Subjects
Healthy male participants 20–30 years of age with a BMI of 20·0–24·9 kg/m2 were recruited via advertisements placed about the University of Toronto, Saint George campus, in local newspaper classifieds and on student websites. Females, smokers, breakfast skippers and those on medication, with metabolic disorders or scoring greater than or equal to 11 on an Eating Habits Questionnaire(Reference Velangi, Fernandes and Wolever10) were excluded from the study. This study was conducted according to the guidelines laid down in the Declaration of Helsinki and all procedures involving human subjects/patients were approved by the University of Toronto Health Sciences Research Ethics Board. Written informed consent was obtained from all subjects.
Experimental design
Two experiments were conducted in which FI was measured at 30 min (Expt 1) and at 120 min (Expt 2) after consumption of the treatments. Both experiments were single-blind, randomised, repeated-measures designs in which subjects received one treatment per week, 1 week apart.
Treatments
The same five treatments were used in both Expt 1 and 2 and were as follows: tomato soup (control) with either 10 g (F10) or 20 g (F20) yellow pea fibre or 10 g (P10) or 20 g (P20) of yellow pea protein added. Commercially available yellow pea protein and fibre, by the trade names Propulse (82 % protein dry weight) and Centara5 (94 % fibre dry weight from yellow pea hulls), respectively, were provided by Nutri-Pea Limited. The protein fraction is isolated from the cotyledon, whereas the fibre is made from yellow pea hulls and contains approximately 85 % insoluble and 15 % soluble fibre (Nutri-Pea Limited, Personal communication). The F10 and F20 treatments contained 10·6 and 21·3 g of the pea fibre isolate, respectively, to yield 10 and 20 g of net fibre. Similarly, the P10 and P20 treatments contained 12·2 and 24·4 g of pea protein isolate, respectively, to yield 10 or 20 g of pea protein. The control was a tomato soup with no added fractions. All treatments were isovolumetric (300 ml) and contained the following ingredients: tomato paste (55 g), pepper (0·6 ml, Verona), garlic herbs (2·5 ml, McCormick Garlic and Herb Seasoning), Worcestershire sauce (2·5 ml, Lea & Perrins), dried basil (0·6 ml, McCormick Canada, Inc.), Tabasco sauce (0·25 ml, McIlhenny Company) and lemon juice (1·2 ml, Canada Dry Mott's). The Na content of a meal has been linked to altered postprandial satiety and glycaemia(Reference Thorburn, Brand and Truswell11, Reference Driver12). Na content, determined using a modified version of AOAC International method 985·01, was highest in the P20 treatment (294 mg) and thus 570·8, 454·9, 338·0 and 285·4 mg of salt (Sifto Table Salt, Sifto Canada Corp., Mississauga, Ontario, Canada) was added to the control, F10, F20 and P10 treatments, respectively, to equalise their Na content and eliminate any confounded effects of Na. The treatments were prepared 20 min before the scheduled arrival of the subjects and 85°C water was added upon their arrival to make up a total treatment volume of 300 ml. All treatments were served with 100 ml of bottled water as palate cleansers. The order of treatments was determined via random number generator for each subject. The nutritional composition of the five treatments is given in Table 1.
Nutritional composition of tomato soup treatments
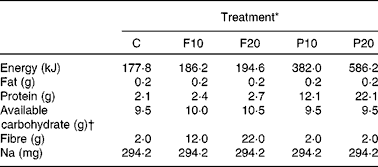
C, control; F10, 10 g fibre; F20, 20 g fibre; P10, 10 g protein; P20, 20 g protein.
* Energy content and composition of common ingredients provided by the manufacturer. Composition of yellow pea fractions determined using the following methods: fat, AOAC 983·23; protein, AOAC 992·15; fibre, AOAC 43-A14; Na, AOAC 985·01. Amounts given are per 300 ml serving.
† Calculated as (total carbohydrate − fibre).
Protocol
As described previously(Reference Anderson, Catherine and Woodend13, Reference Anderson, Tecimer and Shah14), subjects were asked to pick a time between 10.00 and 13.00 hours and a day of the week when they wished to begin each of their sessions. Before each session, subjects fasted for 10–12 h overnight, after which they consumed a standardised breakfast consisting of 26 g of Honey Nut Cheerios cereal (General Mills), 250 ml of Beatrice 2 % milk (Parmalat Canada) and 250 ml Tropicana orange juice (Tropicana Products, Inc.). A 500 ml bottle of water was also provided to be consumed between breakfast and 2 h before the start of their session, after which no food or drink was to be consumed. Subjects were asked to abstain from caffeine and alcohol the night before their sessions and to maintain their normal routine of FI and physical activity.
Upon arrival in the lab for each session, subjects completed a Sleep Habits and Stress Factors questionnaire and a Food Intake and Activity Questionnaire in order to assess their compliance with fasting and physical activity instructions. Sessions were rescheduled if any irregularities were found that might have altered the subject's appetite or metabolism. Subjects then completed the baseline (0 min) visual analogue scales (VAS) to measure motivation to eat (to quantify subjective appetite), thirst, physical comfort, and energy and fatigue. VAS consist of a 100 mm printed line anchored to opposing statements on either side. Subjects were informed to place an ‘X’ on the line at a location that reflects their level of agreement with the two statements. The VAS were scored by measuring the distance, in mm, from the leftmost statement to the intersection of the marked ‘X’. This allowed for the accurate measurement of variables on a continuum instead of discrete categories to which the subjects' feelings may not correspond. The utility of VAS for measuring subjective appetite has previously been validated in children as well as adults(Reference Flint, Raben and Blundell15, Reference Bellissimo, Thomas and Pencharz16).
A baseline BG measurement was then taken via finger prick using a Monojector lancet (Sherwood Medical) and capillary BG measured and converted to plasma glucose equivalent using an Accu-check Compact-Plus glucose monitor (Roche Diagnostics Canada). A baseline measurement of greater than 5·5 mmol/l suggested non-compliance with the fasting instructions and subjects were rescheduled accordingly. As per the manufacturer's instructions, the first drop of blood was wiped away and the second drop placed on the testing strip. Subjects were assigned specific glucose monitors and testing strip batch codes for the duration of the study. Quality control measurements using two concentrations (6·3 and 10·0 mmol/l) of Assayed Human Multi-Sera (Randox Laboratories Limited) were performed before each session to ensure that glucose monitors and test strips were within an acceptable range of accuracy.
Following the completion of the baseline measurements, subjects were given 5 min to consume their treatment, along with 100 ml of bottled water to cleanse their palate. VAS measuring treatment palatability were then filled out to ensure that appetite and FI were not affected by the subject's dislike of a treatment. The palatability VAS consisted of three questions assessing the pleasantness, taste and texture of the treatments. In Expt 1, BG (via finger prick), subjective appetite, physical comfort and energy fatigue (via VAS) were measured at 15 and 30 (pre-meal) as well as at 50, 65, 80, 95, 110, 140 and 170 min (post-meal) after consumption of the treatment. In Expt 2, the same outcomes were measured at 15, 30, 45, 60, 90 and 120 min (pre-meal) as well as 140, 155, 170, 185 and 200 min (post-meal) after consumption of the treatments.
FI was measured at 30 (Expt 1) or 120 min (Expt 2) after consumption of the treatments. Subjects were instructed to eat until ‘comfortably full’ and given 20 min during which time they were served an ad libitum pizza meal consisting of McCain Deep ‘N Delicious (McCain Foods Canada) pizzas, prepared, as suggested by the manufacturer, by baking for 8 min in a 221°C oven, along with ad libitum bottled water. Pepperoni, Three cheese and Deluxe pizzas were served, four at a time, with two pizzas of their first choice as determined during screening, and one each of the others. A fresh batch of four pizzas was served every 7 min and water was given as needed. FI and water intake (WI) was measured by weighing the cooked pizza and bottled water before and after the meal without the subjects’ knowledge. The manufacturers' nutritional information was used to calculate energy intake in kJ. The three varieties of pizza averaged 10·0 g of protein, 7·6 g of fat, 26·6 g of carbohydrate and 945·6 kJ/100 g. Following the pizza meal, subjects filled out a VAS measuring the palatability of the pizza meal.
Data analysis
Average subjective appetite was calculated as the average of the four questions on the Motivation to Eat VAS as follows: Average appetite score = (desire to eat+hunger+(100 − fullness)+prospective consumption)/4. Average treatment palatability was calculated as the average of the three questions on the treatment palatability VAS as follows: (pleasantness+taste+texture)/3.
All statistical analyses were conducted using the SAS version 9.2 (Statistical Analysis Systems; SAS Institute, Inc.) software suite. In the study, two-way repeated-measures ANOVA tests were used to test for treatment, time and treatment-by-time interaction effects on glycaemic response, subjective appetite, physical comfort, and energy and fatigue. For variables with a significant treatment and/or interaction effect (P < 0·05), one-way repeated-measures ANOVA and Tukey–Kramer's post hoc test were used to determine between-treatment differences at individual time points. Treatment effects on the following variables were tested via one-way repeated-measures ANOVA: food and WI; and treatment and pizza palatability.
Correlation analyses among treatments and outcome measures were performed using the Pearson's Correlation Coefficient. All results are presented as means with their standard errors of the mean. Statistical significance was concluded with the P-value less than 0·05.
Results
Subject characteristics
In Expt 1, nineteen subjects were recruited with a mean age of 23·2 (sem 0·5) years and BMI of 22·5 (sem 0·3) kg/m2. In Expt 2, twenty subjects were recruited with a mean age of 22·3 (sem 0·5) years and BMI of 21·8 (sem 0·3) kg/m2.
Food and water intake
In Expt 1, there was a significant effect of treatment on FI at 30 min (P = 0·0008). FI following P20 was lower compared to all other treatments (P < 0·05). No other differences between the treatments were found (Table 2). Cumulative FI (CFI), the sum of energy consumed at the treatment and at the pizza meal, was also significantly affected by treatment (P = 0·03). CFI was suppressed by P20 compared to F10 (P = 0·03); all other treatments led to intermediate CFI. WI was not affected by treatment (P = 0·92).
(Mean values with their standard errors, n 19 in Expt 1, n 20 in Expt 2)
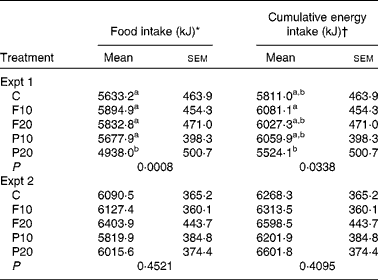
C, control; F10, 10 g fibre; F20, 20 g fibre; P10, 10 g protein; P20, 20 g protein.
a,b Mean values within a column with unlike superscript letters were significantly different from each other (P < 0·05, one-way ANOVA, Tukey–Kramer post hoc test).
* Energy consumption in a test meal was measured at 30 min in Expt 1 and 120 min in Expt 2 following treatments.
† Energy from treatment+energy from test meal.
In Expt 2, there was no effect of treatment on FI (P = 0·45), CFI (P = 0·41) or WI (P = 0·40) at 120 min (Table 2).
Blood glucose
In Expt 1, pre-meal mean BG (0, 15 and 30 min) was significantly affected by time (P < 0·0001) and treatment (P = 0·02), but not by their interaction (P = 0·28). Over the entire pre-meal period, BG was lower following both protein treatments compared to control (P < 0·05; Table 3). BG was lowest upon arrival at the lab and gradually increased following the treatment until 30 min. BG at 15 min was lower following P10 compared to control (P = 0·03; Fig. 1(A)). Post-meal (50, 65, 80, 95, 110, 140 and 170 min) BG was significantly affected by time (P < 0·0001), treatment (P = 0·001) and their interaction (P < 0·0001); the latter of which is explained by variable treatment effects over time. Overall post-meal BG was suppressed following P20 compared to control and F10 (P < 0·05; Table 3). BG was highest at 65 min (15 min following completion of the meal) and gradually declined until the end of the study period. BG immediately following the pizza meal (50 min) was lower following both doses of protein compared to that after the control and F10 (P < 0·0001) (Fig. 1(A)). BG at 50 min following P20 was also lower than after F20 (P < 0·0001). At 65 min, BG was lower following P20 compared to that after the control and both fibre treatments (P < 0·0001), while P10 resulted in intermediate BG.
(Mean values with their standard errors, n 19 in Expt 1, n 20 in Expt 2)
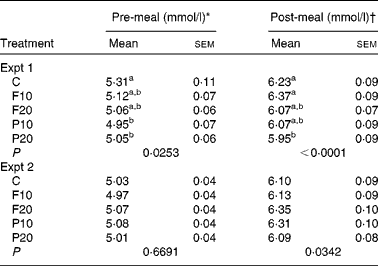
C, control; F10, 10 g fibre; F20, 20 g fibre; P10, 10 g protein; P20, 20 g protein.
a,b Mean values within a column with unlike superscript letters were significantly different from each other for the same experiment (P < 0·05, two-way ANOVA, Tukey–Kramer post hoc test).
* Pre-meal values are means of all observations before the test meal: 0, 15 and 30 min in Expt 1 and 0, 15, 30, 45, 60, 90 and 120 min in Expt 2.
† Post-meal values are means of all observations after the test meal: 50, 65, 80, 95, 110, 140 and 170 min in Expt 1 and 140, 155, 170, 185 and 200 min in Expt 2.
Effect of treatments on blood glucose concentrations over time. (A) Expt 1. (B) Expt 2. Treatments were served in a tomato soup with 10 (![]() ) or 20 g (
) or 20 g (![]() ) of yellow pea fibre, 10 (
) of yellow pea fibre, 10 (![]() ) or 20 g (
) or 20 g (![]() ) of yellow pea protein, or a control (
) of yellow pea protein, or a control (![]() ) with no added fractions. Values are means, with their standard errors represented by vertical bars (n 19 in Expt 1; n 20 in Expt 2). a,b Mean values with unlike letters were significantly different at each measured time (P < 0·05, one-way ANOVA, Tukey–Kramer post hoc test).
) with no added fractions. Values are means, with their standard errors represented by vertical bars (n 19 in Expt 1; n 20 in Expt 2). a,b Mean values with unlike letters were significantly different at each measured time (P < 0·05, one-way ANOVA, Tukey–Kramer post hoc test).

In Expt 2, mean pre-meal BG over time (0, 15, 30, 45, 60, 90 and 120 min) was significantly affected by time (P < 0·0001), but not treatment (P = 0·67) or treatment-by-time interaction (P = 0·16) (Table 3). Pre-meal BG was lowest at baseline, increased slightly to 30 min and then returned to baseline before 120 min. There was an effect of time (P < 0·0001) and treatment (P = 0·03), but no effect of treatment-by-time interaction (P = 0·17) on post-meal (140, 155, 170, 185 and 200 min) BG (Fig. 1(B)). BG peaked at 155 min, regardless of treatment and declined steadily until 200 min, without reaching baseline. Although there was a significant treatment effect, Tukey–Kramer's post hoc test did not declare any differences between treatments at any time point (Fig. 1(B)).
Subjective appetite
In Expt 1, the average of pre-meal appetites was significantly affected by time (P < 0·0001), but not treatment (P = 0·42) or treatment-by-time interaction (P = 0·58) (Table 4). Pre-meal appetite was highest at baseline and dropped slightly after the treatment (Fig. 2(A)). Post-meal appetite was significantly affected by time (P < 0·0001), but not treatment (P = 0·17) or their interaction (P = 0·54). Post-meal appetite dropped immediately post-meal and slowly rose until the end of the study period. There were no differences between any of the treatments at any time point pre- or post-meal (Fig. 2(A)).
(Mean values with their standard errors)
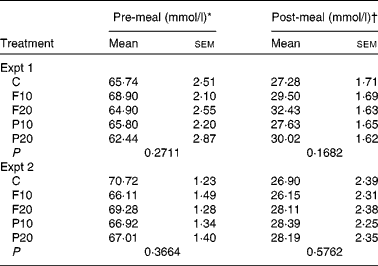
C, control; F10, 10 g fibre; F20, 20 g fibre; P10, 10 g protein; P20, 20 g protein.
a,b Mean values within a column with unlike superscript letters were significantly different from each other for the same experiment (P < 0·05, two-way ANOVA, Tukey–Kramer post hoc test).
* Pre-meal values are means of all observations before the test meal: 0, 15 and 30 min in Expt 1 and 0, 15, 30, 45, 60, 90 and 120 min in Expt 2.
† Post-meal values are means of all observations after the test meal: 50, 65, 80, 95, 110, 140 and 170 min in Expt 1 and 140, 155, 170, 185 and 200 min in Expt 2.
Effect of treatments on average appetite over time. (A) Expt 1. (B) Expt 2. Treatments were served in a tomato soup with 10 (![]() ) or 20 g (
) or 20 g (![]() ) of yellow pea fibre, 10 (
) of yellow pea fibre, 10 (![]() ) or 20 g (
) or 20 g (![]() ) of yellow pea protein, or a control (
) of yellow pea protein, or a control (![]() ) with no added fractions. Values are means, with their standard errors represented by vertical bars (n 19 in Expt 1; n 20 in Expt 2). Mean values with unlike letters were significantly different at each measured time (P < 0·05, one-way ANOVA, Tukey–Kramer post hoc test).
) with no added fractions. Values are means, with their standard errors represented by vertical bars (n 19 in Expt 1; n 20 in Expt 2). Mean values with unlike letters were significantly different at each measured time (P < 0·05, one-way ANOVA, Tukey–Kramer post hoc test).

In Expt 2, there was a significant effect of time (P < 0·0001), but not of treatment (P = 0·37) or treatment-by-time interaction (P = 0·81) on pre-meal appetite (Table 4). Pre-meal appetite was high at baseline, dropped slightly after the treatment, followed by a slow rise to above baseline at 120 min (Fig. 2(B)). Post-meal subjective appetite was also affected by time (P < 0·0001), but not by treatment (P = 0·58) or time-by-treatment interaction (P = 0·21). Post-meal subjective appetite was lowest immediately following the meal and gradually rose until 200 min. There were no differences between any of the treatments at any time point pre- or post-meal (Fig. 2(B)).
Palatability
Average palatability ((pleasantness+taste+texture)/3) of treatments varied in both experiments, with the ratings for the F20 treatment being significantly lower compared to control in both experiments (P < 0·05). The average palatability of the F10 and P20 treatments was also lower than the control in Expt 2 (P < 0·05), but not Expt 1. Average palatability ratings for the control, F10, F20, P10 and P20 treatments, respectively, were 60·0 (sem 5·0), 53·7 (sem 5·7), 43·3 (sem 5·8), 61·1 (sem 4·9) and 51·8 (sem 5·8) mm in Expt 1, and 68·4 (sem 4·2), 53·6 (sem 4·4), 50·4 (sem 4·8), 59·8 (sem 5·4) and 49·2 (sem 4·9) mm in Expt 2. However, Pearson correlation analysis showed no relationship between treatment palatability and FI at the test meal (Expt 1: r 0·16, P = 0·13; Expt 2: r − 0·13, P = 0·26). Average palatability of the pizza meal was high (74·2 (sem 1·6) mm in Expt 1; 80·9 (sem 1·4) mm in Expt 2) in both experiments and was not affected by the treatments (data not shown).
Discussion
The results of these studies support a role for yellow pea protein in regulating short-term FI and satiety and glycaemic responses to a second meal. Although the protein preloads did not affect subjective appetite, they led to suppression of FI at 30 min, and reduced the glycaemic response to the treatment as well as the response to the second meal at 30 min, but not at 120 min. Furthermore, yellow pea protein's effects on the pre-meal glycaemic response were independent of dose; whereas its effects on the glycaemic response to a second meal and FI at the meal were dose-dependent. These results support the hypothesis that the protein and not the fibre fraction of whole yellow peas is responsible for the physiological effects up to 30 min after their consumption. However, the effects of the protein fractions are transient and thus the benefits of whole yellow peas beyond 30 min cannot be explained by their fibre or protein content alone.
The effect of pea protein at 30 min but not at 120 min may be explained by the observation that it is both readily digested (plasma amino acid concentrations peak approximately 30 min after consumption) and high in branched-chain amino acids, thus eliciting similar short-term physiological benefits on BG and FI as known for whey(Reference Calbet and MacLean17, Reference Nilsson, Holst and Bjorck18). The suppression of FI by yellow pea protein at 30 min corresponds with the peak in plasma amino acids following its consumption as well as other proteins with similar digestion kinetics. Whey, a characteristic fast-digesting protein, peaks plasma amino acid concentrations as well as levels of the anorexigenic hormones, insulin and Glucagon-like peptide-1 (GLP-1), between 20 and 40 min after consumption(Reference Nilsson, Holst and Bjorck18). Calbet & MacLean(Reference Calbet and MacLean17) found yellow pea protein to affect plasma amino acid and hormone levels in a similar manner as whey. However, plasma amino acid and anorexigenic hormone levels return to baseline well before 120 min after ingestion of either whey or pea protein(Reference Calbet and MacLean17, Reference Nilsson, Holst and Bjorck18), which may explain the transient nature of pea protein's appetite suppression effects. However, it has been suggested that proteins that are digested quickly and peak plasma amino acids shortly after consumption have synergistic effects on plasma insulin levels when consumed with available carbohydrates(Reference Calbet and MacLean17). Thus, it is possible that the effects of the pea protein may persist past 30 min if consumed with carbohydrate. Indeed, Manders et al. (Reference Manders, Wagenmakers and Koopman19) found that the insulinaemic response to a glucose drink was 3-fold higher when consumed with a protein hydrolysate mixture(Reference Manders, Wagenmakers and Koopman19). In the present study, pea protein was served with very low amounts of available carbohydrates and unfortunately, plasma insulin levels were not measured and thus these hypotheses cannot be assessed, but warrant further investigation.
It is surprising that no effects were detected following the fibre treatments. There are several possible explanations for this. First, the fibre used in the present study was isolated from the hulls of yellow peas. Legume hulls are a byproduct of most processing techniques and contain very high amounts of fibre(Reference Arrigoni, Caprez and Amadò20); therefore, the majority of pulse-derived fibre fractions for commercial use are from the hull. However, not only are the hulls much higher in total fibre, but they have very different soluble:insoluble fibre ratios and functional properties(Reference Arrigoni, Caprez and Amadò20, Reference Wang, Hatcher and Gawalko21). Dehulling peas reduces the insoluble fibre content of whole peas by 45·8 % and the soluble fibre content by just 21·0 %(Reference Wang, Hatcher and Gawalko21). Yellow peas are most commonly consumed dehulled and thus the fibre treatments in the present study may not be representative of the effects of consuming fibre from whole yellow peas. Similar studies are needed to investigate the possible benefits of pea fibre derived from the cotyledon.
Second, our studies to only 120 min may not be of sufficient duration to see the benefits associated with fibre consumption. Many fibres are fermented by bacteria in the large intestine, especially in the caecum and proximal portions of the colon, with beneficial outcomes probably mediated by the production of SCFA(Reference Wong, de Souza and Kendall22, Reference Nilsson, Ostman and Holst23). Indeed, there have been several studies showing short-term metabolic benefits of fermentable fibres. An evening meal including fermentable fibres led to suppressed appetite, FI and BG response to a standardised breakfast the following morning (10·5 h after the evening meal) compared to similar low-fibre meals(Reference Nilsson, Ostman and Holst23). Furthermore, breath hydrogen, a marker of fermentation, was inversely related to BG response to the morning meal, as well as to GLP-1, indicating that the effects of fibre may have been mediated through changes in the gut microflora and fermentation that require longer than 2 h to occur.
Lastly, it may be that the amount of yellow pea fibre was not sufficient to exert short-term effects. A study by Samra & Anderson(Reference Samra and Anderson24) showed that a high amount of insoluble fibre served in a breakfast cereal reduced glycaemic response to a meal 75 min later. This discrepancy with the present study could be due to the different doses of fibre used (20 g v. 33 g), and because those results were in comparison to high-glycaemic index cereal and white bread treatments. A maximum fibre dose of 20 g was chosen because this is the maximum amount of fibre an individual would normally consume if they ate approximately two servings of whole pulses. Despite the null results of fibre in the present study, further research into the effects of pea fibre is warranted before it can be ruled out as being at least partially responsible for the physiological benefits of whole yellow peas. Studies investigating the cotyledon fibre, larger amounts of fibre and/or a fixed energy test-meal in order to reduce the confounding effects of FI and isolate the effect of fibre on satiety and glycaemic response are needed.
A weakness of the present study was the absence of a treatment containing whole yellow peas. Thus, it is unclear how much of the benefits of whole peas are due to the components. Although protein improved BG and suppressed BG in Expt 1, neither of the yellow pea fractions alone in this study replicated the effects of whole yellow peas on short-term FI, appetite or BG(Reference Wong, Mollard and Zafar8, Reference Marinangeli, Kassis and Jones25, Reference Marinangeli and Jones26). This means that not enough of the fractions were used, or perhaps the short-term benefits of whole yellow peas are due to the synergistic effects of these and other components. Yellow peas are also high in resistant starch, which has been associated with improved glycaemic response and suppression of FI(Reference Mikulíková, Masár and Kraic27–Reference Bodinham, Frost and Robertson30). Further studies investigating the effects of the starch fraction, as well as with different pea fractions in combination, are required to further understand the mechanism of action of whole pulses.
Nevertheless, this research provides evidence for the efficacy of yellow pea protein as a value-added ingredient in functional foods aimed at suppressing short-term energy intake and BG. More research on the functional properties of yellow pea fractions, as well as on fibre and other fractions, is warranted.
Conclusion
In conclusion, protein and not fibre, is the primary component of yellow peas responsible for the suppression of FI and glycaemic response at a meal served at 30 min after the consumption of whole yellow peas. However, the effects of the protein fraction are transient and thus the benefits of whole yellow peas beyond 30 min cannot be explained by their fibre or protein content alone.
Acknowledgements
All the authors contributed to the conceptualisation and design of the present study as well as the writing and review of the paper. C. E. S. conducted the research and analyses. G. H. A. had primary responsibility for the final content. The authors declare no conflict of interest. This work was supported by Agriculture and Agri-Food Canada under the Pulse Research Network (PURENet).


