


Introduction
A 2017 report on the Global Burden of Disease estimated that collectively, hearing and vision loss were the largest contributors to years lived with disability (YLD) among adults 65 years or age and older, the second largest contributors among adults 50–64 years of age, and the third largest contributor among adults 45–49 years of age (Vos et al., Reference Vos, Abajobir, Abate, Abbafati, Abbas and Abd-Allah2017). The prevalence of both impairments has increased rapidly over the past few decades because of population growth and aging. Their rise in disease burden rank reflects the more general epidemiological shift from communicable to non-communicable diseases. Importantly, recent research has drawn attention to the negative effects of age-related hearing and vision loss on interpersonal communication, psycho-social wellbeing, quality of life, economic opportunity, and independence (Kotby, Tawfik, Aziz, & Taha, Reference Kotby, Tawfik, Aziz and Taha2008; Mick, Kawachi, & Lin, Reference Mick, Kawachi and Lin2014; Shield, Reference Shield2006), which are key domains that must be addressed to enable seniors to age well (Holt-Lundstad, Reference Holt-Lundstad2017; Holt-Lundstad, Smith, Baker, Harris, & Stephenson, Reference Holt-Lundstad, Smith, Baker, Harris and Stephenson2015). Furthermore, associations between age-related sensory loss and difficult-to-treat, widespread health problems including dementia, falls, and depression have been reported consistently in the recent literature (Albers et al., Reference Albers, Gilmore, Kaye, Murphy, Wingfield and Bennett2015; Lin & Ferrucci, Reference Lin and Ferrucci2012; Livingston & Frankish, Reference Livingston and Frankish2015; Mener, Joshua, Genther, David, & Lin, Reference Mener, Joshua, Genther, David and Lin2013). These findings raise the possibility that better treatment of sensory problems might prevent or delay such conditions, or mitigate the difficulties that they impose on individuals, caregivers, and families. Yet, the problem of age-related sensory loss has been overlooked by aging individuals, health care workers, and policy makers (Lin, Reference Lin2012; Olusanya, Neumann, & Saunders, Reference Olusanya, Neumann and Saunders2014) because of perceptions that other health issues are more acute or pressing, that age-related sensory loss is normal or inconsequential, or that effective treatments are not available. Fortunately, it seems that such attitudes are changing in favour of a more proactive approach to sensory aging in the broader context of healthy aging (Davis et al., Reference Davis, McMahon, Fuller, Russ, Lin, Olusanya and Tremblay2016; Lancet, Reference Lancet2016).
More than 90 per cent of hearing loss (HL) in older age is classified as presbycusis (or age-relatesd HL) (Vos et al., Reference Vos, Allen, Arora, Barber, Bhutta and Brown2016), which is a syndrome caused by the contributions of a lifetime of multifactorial insults to the auditory system (Gates & Mills, Reference Gates and Mills2005). In contrast, vision loss in older age is more likely to be caused by specific eye diseases such as glaucoma, age-related macular degeneration, diabetic retinopathy, corneal opacity, cataracts, or uncorrected refractive error (Flaxman et al., Reference Flaxman, Bourne, Resnikoff, Ackland, Braithwaite and Cicinelli2017). Flaxman et al. (Reference Flaxman, Bourne, Resnikoff, Ackland, Braithwaite and Cicinelli2017) estimated that in 2015, only 16.3 per cent of moderate or severe vision impairment was caused by “other” causes in high-income North American countries.
Setting national and international public health priorities requires a clear understanding of burden of disease and health care needs. Population-level estimates of morbidity (e.g., years lived with disability) are calculated by multiplying prevalence by an estimate of the severity of disease or illness. Other countries have conducted national health surveys that included non-subjective measures of hearing (i.e., audiometry) and vision (i.e., visual acuity). However, only very recently have these data been collected in Canada (Aljied, Aubin, Buhrmann, Sabeti, & Freeman, Reference Aljied, Aubin, Buhrmann, Sabeti and Freeman2018b; Feder, Michaud, Ramage-Morin, McNamee, & Beauregard, Reference Feder, Michaud, Ramage-Morin, McNamee and Beauregard2015) such that for the first time, prevalence can be measured accurately.
The present study utilized data from the first wave of the comprehensive cohort of the Canadian Longitudinal Study on Aging (CLSA). It offers a unique opportunity to generate national-level estimates of hearing and vision loss, because audiometry and visual acuity testing is included in the core battery of measures. The large sample size provides the opportunity for subgroup analysis (e.g., according to 5-year age categories, sex, and severity of impairment). The national representativeness of the results is strengthened by having a population-based, cross-country sample from multiple test sites. Notably, this analysis is the first to examine the prevalence of HL and the combined prevalence of hearing and vision loss (dual sensory loss) using CLSA data. A previous report authored by Aljied et al. described the prevalence of vision loss using a single vision loss threshold (>20/40, or 0.3 logarithm of the minimum angle of resolution [logMAR]) (Aljied et al., Reference Aljied, Aubin, Buhrmann, Sabeti and Freeman2018b), using data from the first wave of the CLSA. In contrast to our analysis, its results were not stratified by age/sex groups or severity of impairment. Aljied et al. found that 5.7 per cent of Canadians 45–85 years of age had visual acuity worse than 0.3 logMAR, and that older age, lower income, smoking status, type 2 diabetes, memory problems, and province of residence influenced the risk.
Hearing and vision care may be addressed using primary, secondary, and tertiary prevention strategies (World Health Organization, 2018c). In Canada, few hearing or vision health services are provided by the publicly funded universal health care system. Most individuals with HL do not use hearing devices (e.g., hearing aids or cochlear implants) even if they might be beneficial, and such devices are not equitably distributed (Chien & Lin, Reference Chien and Lin2012; Stevens et al., Reference Stevens, Flaxman, Brunskill, Mascarenhas, Mathers and Finucane2013). Uptake depends on individual- and national-level factors including age, income, self-efficacy, readiness for change, perceived disability, availability of services, and subsidies (Laplante-Lévesque, Hickson, & Worrall, Reference Laplante-Lévesque, Hickson and Worrall2012). National population-based studies examining hearing aid uptake have not been conducted in Canada. Recently, Aljied, Aubin, Buhrmann, Sabeti, and Freeman (Reference Aljied, Aubin, Buhrmann, Sabeti and Freeman2018a) reported that 57 per cent of participants in the CLSA self-reported visiting an optometrist or ophthalmologist in the past year (Aljied et al., Reference Aljied, Aubin, Buhrmann, Sabeti and Freeman2018a), a rate that likely depends on socio-economic status (Jin & Trope, Reference Jin and Trope2011). Refractive error (i.e., the inability to properly focus light on the retina) can usually be corrected with lenses and/or surgery and may be a proxy measure of accessibility and quality of vision health care in the population. Previous studies in Canada suggest that 64–80 per cent of individuals with vision loss > 20/40 may have impairment that is correctable with refraction (Aljied et al., Reference Aljied, Aubin, Buhrmann, Sabeti and Freeman2018b; Robinson et al., Reference Robinson, Feng, Woods, Fonn, Gold and Gordon2013). Refractive error prevalence stratified by sex and severity has yet to be estimated at the national level.
Our objectives were to determine the proportion of Canadian males and females 45–85 years of age in 2012–2015 who had varying degrees of hearing and/or vision loss. We also aimed to estimate the numbers of individuals with hearing and/or vision loss in 2011 and 2016, and the change in the count over that 5-year interval. Another goal was to describe the proportion of Canadians with specific eye diseases and degrees of refractive error. Finally, we sought to describe hearing aid use according to hearing ability. Sex differences were determined by performing sex-stratified analyses and by calculating directly age-standardized estimates to account for differences in age distributions between males and females.
Methods
Study Sample
Data from the CLSA Baseline Comprehensive Dataset version 3.2 were used in the analysis. The CLSA is a 20-year longitudinal closed cohort study consisting of approximately 50,000 Canadians who were 45–85 years of age at the time of baseline analysis (Raina et al., Reference Raina, Wolfson, Kirkland, Griffith, Oremus and Patterson2009). It consists of two sub-cohorts, the “Comprehensive” and “Tracking” cohorts. There are approximately 20,000 individuals in the Tracking cohort who respond to health surveys via telephone. Participants in the Tracking cohort were excluded from the present study because they did not undergo audiometry or visual acuity testing. Our analysis was restricted to the approximately 30,000 members of the Comprehensive cohort whose information was obtained through in-person interviews and physical assessments (including audiometry and visual acuity testing) performed at one of 11 data collection sites across Canada.
Recruitment for the Comprehensive cohort began in 2012. The baseline or first wave of data was collected between 2012 and 2015 and released to researchers in 2017. At the time our analysis was conducted, follow-up data were not available and hence the study is a cross-sectional analysis of the first wave of the CLSA Comprehensive cohort data.
Sampling Frames of the Comprehensive Cohort of the CLSA
Comprehensive cohort participants were recruited by mail using Provincial Healthcare Registration Databases (14%) and by random digit dialing telephone sampling (86%). The CLSA excluded certain types of individuals from the two sampling frames. Sampling was restricted to individuals living within 25 km of the nearest data collection site (except for data collection site locations with lower population densities, where the radius was 50 km). Persons living in the three northern Canadian territories, persons living on First Nations reserves and other First Nations settlements in the provinces, full-time members of the Canadian Armed Forces, and persons living in institutions (e.g., long-term nursing homes, hospitals, and penitentiaries) were also excluded from the sampling frames (Canadian Longitudinal Study on Aging, 2017a). Individuals perceived to have cognitive impairment (i.e., individuals who CLSA interviewers judged to be unable to understand the purpose of the study and/or provide reliable data), were excluded, as were individuals who could not respond to questions in English or French. Persons living in census tracts with high proportions of persons with lower levels of education were over-sampled (Raina, Wolfson, & Kirkland, n.d.).
The overall response rate (i.e., percentage of individuals who were successfully contacted by CLSA staff and agreed to participate) was 10 per cent. Single-stage sampling was performed (i.e., there was no geographical clustering).
Inclusion/Exclusion Criteria for this Analysis
We excluded participants from our study if they were missing data for audiometry or visual acuity.
Hearing Measures
Hearing detection thresholds were determined using a digital screening audiometer in the automatic test mode and Audiocup headphones (Tremetrics RA300+) (Tremetrics RA300 and RA300+ Operations Manual, 2011). Each test was administered in a quiet room by a CLSA technician. Hearing aids were not worn during audiometric testing. Biological calibration listening checks were performed daily on the machines. Pulsed stimuli (3 tone bursts over 1 second) at 500, 1,000, 2,000, 3,000, 4,000, 6,000, and 8,000 Hz were presented in 5 dB increments from 0 to 100 dB HL using a modified Hughson–Westlake method (Margolis et al., Reference Margolis, Wilson, Popelka, Eikelboom, Swanepoel and Saly2015). Further details of the automated testing procedure can be found in the operations manual of the audiometer (Tremetrics RA300 and RA300+ Operations Manual, 2011). “No responses” (recorded by the audiometer as error code “EE”) were recoded as 105 dB HL for the purpose of our analyses. According to CLSA protocols (Canadian Longitudinal Study on Aging, 2014), individuals were not tested if they used devices (e.g. Lyric and bone-anchored hearing aids) that could not be removed during testing.
The primary measure of hearing in our study was the 500, 1,000, 2,000, and 4,000 Hz pure-tone average in the better ear; therefore, people with HL in only one ear are classified as having normal hearing according to this definition.
The pure-tone average can be classified according to various criteria. We report HL severity using World Health Organization (WHO) criteria (i.e., mild 25.1–40 dB HL, moderate 40.1–59.9 dB HL, and severe ≥ 60 dB HL) (World Health Organization, 2018d) which are also commonly used in clinical practice and epidemiology studies (e.g., Lin, Metter, et al., Reference Lin, Metter, O’Brien, Resnick, Zonderman and Ferrucci2011). In Supplementary Tables 1–3, we also report prevalence using the categories applied in the Global Burden of Disease (GBD) studies (20–34.9 dB HL, 35–49.9 dB HL, 50–64.9 dB HL, 65–79.9 dB HL, 80–94.5 dB HL, and ≥ 95 dB HL) (Salomon et al., Reference Salomon, Haagsma, Davis, de Noordhout, Polinder and Havelaar2015) so that the data might be used in future GBD iterations.
Vision Measures
Visual acuity was measured using a standard retro-illuminated Early Treatment Diabetic Retinopathy Study (ETDRS) chart placed 2 m from the participants’ eyes. Participants were instructed to wear their regular glasses or contact lenses for the test (in contrast to the hearing test, during which hearing aids were removed). Monocular habitually corrected tests of visual acuity were performed first, followed by tests of monocular pinhole-corrected visual acuity, and then binocular habitually-corrected visual acuity. For each monocular condition, the right eye was tested before the left eye (Canadian Longitudinal Study on Aging, 2017b).
The primary measure of vision in our study was binocular visual acuity using habitual correction. Participants were scored on the logMAR scale (range: -0.3 to 1.0, equivalent 20/10 to 20/200 using the imperial system, or 6/3 to 6/60 using the metric system) according to the smallest line of letters on the chart for which they correctly identified all of the letters. Individuals who reported being unable to read any of the lines on the chart were excluded from the analysis. Refractive error was estimated by subtracting the pinhole-corrected from the habitually corrected visual acuity in the eye with the better pinhole-corrected visual acuity.
For vision, we used WHO/International Classification of Diseases version 10 (ICD-10) criteria to classify moderate vision loss (worse than 0.48 logMAR [i.e., 20/60 or 6/18] and equal to or better than 1.0 logMAR [i.e., 20/200 or 6/60]). Because we excluded individuals who reported being unable to read the top line of the ETDRS chart (n = 9), no one was classified as having severe vision loss (i.e., visual acuity worse than 1.0 logMAR [i.e., 20/200 or 6/60]) (Dandona & Dandona, Reference Dandona and Dandona2006; World Health Organization, 2012, 2018b). We classified individuals with visual acuity equal to or worse than 0.2 logMAR and equal to or better than 0.48 logMAR as having mild vision loss, based on similar definitions in the literature (Colenbrander, Reference Colenbrander2002, Reference Colenbrander2003; Leat, Legge, & Bullimore, Reference Leat, Legge and Bullimore1999). An acuity of 0.2 (6/10, 20/32) corresponds to only moderate fluency in reading newsprint at 33 cm (Colenbrander, Reference Colenbrander2003; Leat et al., Reference Leat, Legge and Bullimore1999). We also reported the prevalence of vision loss worse than 0.3 logMAR (i.e., 20/40 or 6/12), which is the definition of “mild” vision loss adopted by the WHO (World Health Organization, 2018a) and is a common cut-off in epidemiological studies (Aljied et al., Reference Aljied, Aubin, Buhrmann, Sabeti and Freeman2018b; Dandona & Dandona, Reference Dandona and Dandona2006) and in clinical practice in North America. Aljied et al., in their analysis of the prevalence and risk factors for visual impairment among CLSA participants, used a threshold of > 0.3 logMAR to define visual impairment (Aljied et al., Reference Aljied, Aubin, Buhrmann, Sabeti and Freeman2018b).
Dual Sensory Measures
It is important to note that we did not report dual sensory loss using the WHO moderate thresholds for both hearing (> 40 dB HL) and vision loss (> 0.48 logMAR) because only 89 of 29,002 (0.3%) members of the cohort fit these criteria, precluding age- or sex-stratified analyses. Instead, we defined the following three categories: > 25 dB HL and ≥ 0.2 logMAR, > 25 dB HL and > 0.3 logMAR, and >40 dB HL and > 0.3 logMAR.
Other Participant Characteristics
Information about participant characteristics were ascertained through questionnaires administered by trained interviewers. Age and sex information was collected at interviews at each participant’s home. Data about eye diseases (self-reported recall about diagnostic information on glaucoma, macular degeneration, cataracts) and hearing aid use were collected during interviews at the data collection site.
Statistical Analysis
Comparisons of included and excluded participants
Differences in characteristics between individuals with complete data (who were included in the subsequent analyses) and those with incomplete data (who were excluded from subsequent analyses) were determined using two-tailed χ2 tests for categorical variables, and two-tailed Student’s t test for continuous variables.
Prevalence measures
Prevalence of sensory loss was calculated either as a percentage (“prevalence proportion”), or as a population estimate (“prevalence count”). Prevalence counts were calculated by multiplying the prevalence proportion by the national population in both 2011 and 2016, using census data from those years (Statistics Canada, 2011, 2016). We used both the 2011 and 2016 censuses to calculate count estimates, because data collection for the first wave of the CLSA occurred in the intervening period (May 2012 through May 2015), and so we could generate estimates of change in prevalence between 2011 and 2016. Canadian national censuses are performed every 5 years; there were no censuses performed between 2011 and 2016 that could be used instead. Estimates were stratified by 5-year age-sex categories (i.e., 45–49 years old, 50–54 years old, …, 80–85 years old). Estimates of prevalence count for the entire age range (45–85 years old) were calculated by summating the 5-year estimates for each sex. The estimates of change were based on population increase and population aging but not on changes in prevalence proportion, which was only estimated for one time period (2012–2015).
Locally weighted regression of prevalence on age was used to generate smoothed curves to demonstrate age-specific prevalence trends.
Sex differences
To assess sex differences in prevalence proportion, directly age-standardized prevalence (for the entire age range) was calculated using the combined male and female population of adults 45–85 years of age in the 2016 Canadian census as the standard population (Statistics Canada, 2016). One-year age groupings were used to generate the age-standardized proportions used in the calculations. Sex differences were considered significant if 95 per cent confidence intervals (CI) for males and females did not overlap. Age-standardized prevalence values are not reflective of real-world prevalence; rather, they reflect what the prevalence for males and females would be if the age distribution for each sex were equivalent to the standard population.
Inverse probability sampling weights were used in all of the analyses to improve the national representativeness of prevalence estimates. CLSA statisticians assigned each participant a sample weight that was inversely proportional to the probability of inclusion in the study according to their sex, age, and province of residence. In other words, individuals from age/sex/province groups that were under-represented relative to the national population were assigned higher weights, and individuals from age/sex/province groups that were over-represented were assigned lower weights. The strata variable specified in the complex survey software was the geographic strata variable for the Comprehensive cohort (WGHTS_GEOSTRAT_COM) as recommended by the CLSA. (Canadian Longitudinal Study on Aging, 2017a) The Taylor series linearization method (Krewski & Rao, Reference Krewski and Rao1981) was used for estimating standard errors that accounted for the survey weights.
Statistical significance was assumed for p values that were less than 0.05 or for 95 per cent CI that did not overlap. All analyses were conducted using Stata version 14.2 for Mac.
Results
Of the 30,097 members of the CLSA Comprehensive cohort who completed the baseline assessment, 29,007 (96.4%) had complete audiometry and visual acuity data and were included in our analysis (1,090, or 3.6% had missing data and were excluded). Excluded participants were more likely to be older, have lower income and education, poorer self-rated health, and worse hearing and vision than participants with complete data (Table 1).
Characteristics of individuals with complete and missing data

Note. p value reflects the difference in each characteristic between the groups with complete and missing data. The Student t test was used for continuous variables, and the χ2 test was used for categorical variables.
SD = standard deviation; HL = hearing loss; MAR = minimum angle of resolution.
Prevalence of Degrees of Sensory Loss by Age and Sex
Table 2 breaks down the full cohort (i.e., all participants, 45–85 years of age) according to mild, moderate, and severe hearing and vision loss categories. Among males, 66.8 per cent had no impairment, 17.3 per cent had HL, and 22.2 per cent had vision loss. Among females, 65.7 per cent had no impairment, 12.8 per cent had HL, and 26.5 per cent had vision loss. The majority of individuals with hearing and/or vision loss had mild impairment. For example, 13.4 per cent of males had mild HL, 3.7 per cent had moderate HL, and 0.4 per cent had severe HL (compared with 11.3%, 2.3%, and 0.2% of females, respectively). For vision, 19.8 per cent of males had mild impairment and 2.4 per cent had moderate impairment (compared with 23.9% and 2.6% of females, respectively). Similarly, most individuals with dual sensory loss had mild HL and mild vision loss. Out of the total population, 6.4 per cent of males had dual sensory loss, with 4.1 per cent having both mild HL and mild vision loss. The remainder (2.3%) had at least moderate impairment in one or both senses. Similarly, 6.0 per cent of females had dual sensory loss with 4.3 per cent having mild losses in both senses and 1.8 per cent having moderate impairment in one or both senses.
Prevalence (proportion) of Canadians 45–85 years old with varying degrees of hearing and vision loss

Note. n refers to number of study participants (unweighted). % refers to the estimated percentage of the Canadian population 45–85 years of age in the specified hearing and vision category (weighted estimate). 95% CI refers to 95% confidence interval for % (weighted estimate). Shaded area indicates dual sensory loss. There were no procedures in place to confirm “severe” vision loss in the Canadian Longitudinal Study on Aging (CLSA) (i.e., VA worse than 1.0). Individuals who could not read the Early Treatment Diabetic Retinopathy Study (ETDRS) chart (n = 9) were excluded from analysis.
MAR = minimum angle of resolution.
Sex Differences
Males were more likely than females to have HL and dual sensory loss. The age-standardized prevalence of HL (pure tone average [PTA] > 25 dB HL) for males was 20.7 per cent (95% CI: 20.1–21.4) versus 15.3% (95% CI: 14.7–15.9) for females. The age-standardized prevalence of dual sensory loss (> 25 dB HL and ≥ 0.2 logMAR) for males was 8.1 per cent (95% CI: 7.7–8.5) versus 6.8% (95% CI: 6.4–7.2) for females. Females were more likely than males to have mild vision loss ≥ 0.2 logMAR but not vision loss > 0.48 logMAR, for which there was no difference between sexes. The age-standardized prevalence of vision loss ≥ 0.2 logMAR was 27.9 per cent (95% CI: 27.1–28.7) for females and 24.6 per cent (95% CI: 23.8–25.4) for males.
HL
Prevalence proportion and count
Table 3 (and Supplementary Figure 1) demonstrate that the proportion of individuals with HL increases exponentially with age. For many age groups, the percentage of males with HL appeared to be higher than the percentage of females, but despite this trend, among 80–85-year- olds, there were more females with HL (> 25 dB HL) because of the higher survival rate among females.
Hearing loss (HL) prevalence among Canadians 45–85 years old based on pure-tone threshold average (PTA) of 500, 1000, 2000, and 4000 Hz in the better ear
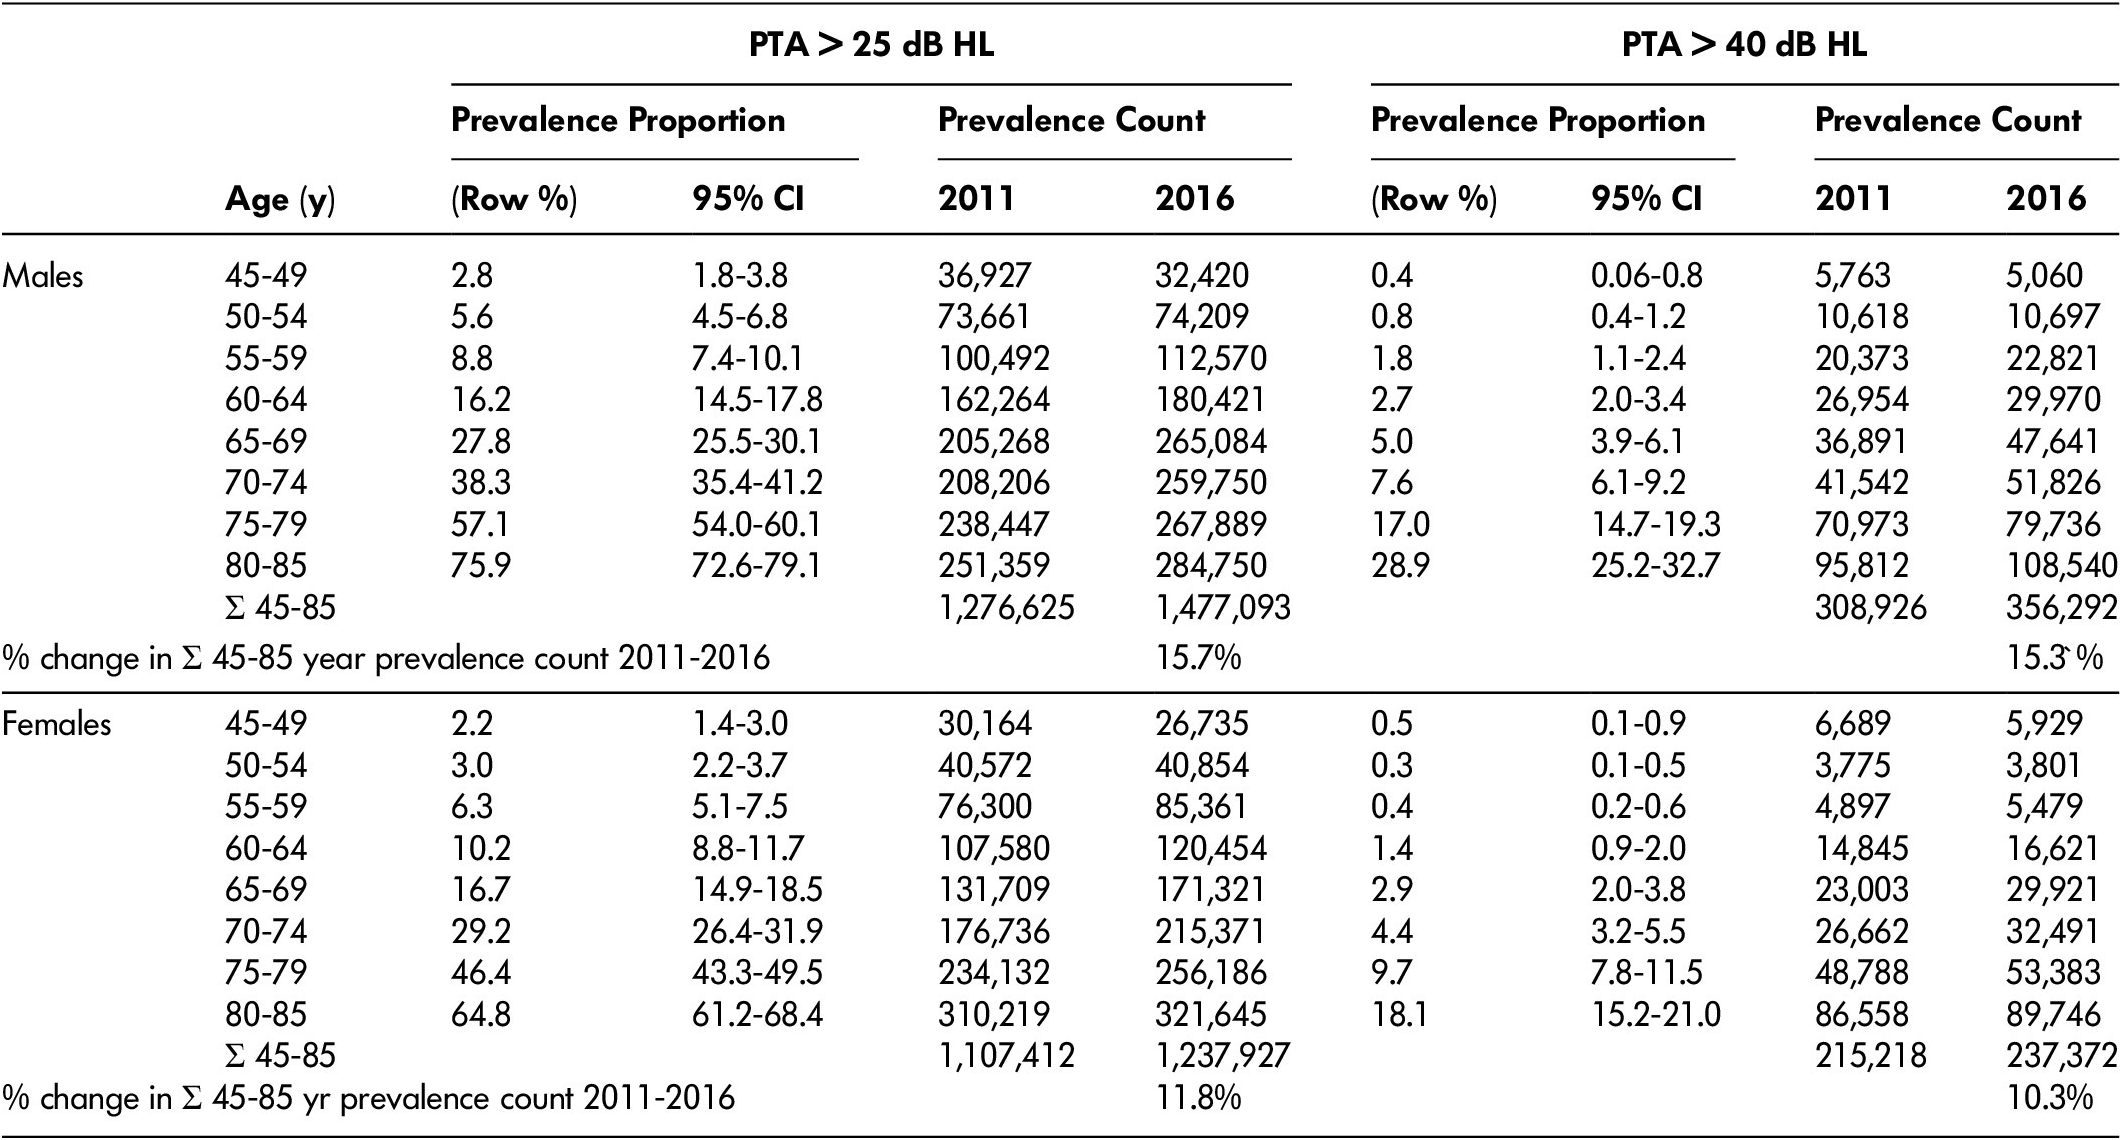
Note. Prevalence counts were calculated by multiplying the displayed prevalence proportion (which was based on data collected between 2012 and 2015) by the population of Canadians in each age category using data from the 2011 census and the 2016 census. Row % refers to the percentage of males or females within each age group who had hearing worse than the thresholds listed. Prevalence counts were calculated by multiplying the prevalence proportion by the number of Canadians in the same age-sex category in 2011 and 2016 censuses. For reference, between 2011 and 2016 in Canada, the total population of males 45–85 years of age increased 8.0% and the total population of females 45–85 years of age increased 7.6%. CI = confidence interval.
Between 2011 and 2016, the number of males 45–85 years of age with HL (> 25 dB HL) increased from 1,280,000 to 1,480,000 (15.7% increase), whereas the number with HL (> 40 dB HL) increased from 309,000 to 356,000 (15.3% increase). The number of females 45–85 years with HL (> 25 dB HL) increased from 1,110,000 to 1,240,000 (11.8% increase), whereas the number with HL (> 40 dB HL) increased from 215,000 to 237,000 (10.3% increase).
Prevalence of HL as defined by the GBD study
Similar prevalence results were obtained using the GBD classification of hearing; details are presented in Supplementary Tables 1–3.
Cumulative distributions according to pure-tone average
Figure 1 (upper panel) describes the reverse cumulative prevalence of HL according to pure-tone average, stratified by age group. Cumulative prevalence declines with increasing severity of loss following an inverse sigmoid curve. The lines (each denoting a 5-year age group) become increasingly spread apart with advancing age, again demonstrating the exponential increase in prevalence proportion with advancing age. This figure also shows that although various categories are used to classify impairment, in reality, abilities exist in a continuum across the population.
Reverse cumulative prevalence curves for hearing loss (HL) (upper panel) and vision loss (VL) (lower panel). The value on the y-axis indicates the percentage of individuals with hearing or vision equal to or worse than the threshold on the x-axis

Use of hearing devices as a function of hearing ability
Table 4 shows the prevalence of hearing device use (hearing aid, amplification device, or cochlear implant) according to PTA. Hearing device use was significantly more common among males than females. Devices were used by 20.1 per cent (95% CI: 18.6–21.6) of males and 15.5 per cent (95% CI: 14.1–17.0) of females with a PTA > 25 dB HL; they were used by 31.6 per cent (95% CI: 28.5–34.7) of males and 24.7 per cent of females (95% CI: 21.6–27.9) with a PTA > 40 dB HL. As expected, the likelihood of using a hearing device sharply increases with severity of hearing loss, ranging from 0.3 per cent (PTA ≤ 25 dB HL) to 65.8 per cent (PTA of 55–60 dB HL) in females, and from 0.9 per cent (PTA ≤ 25 dB HL) to 73.0 per cent (PTA of 55–60 dB HL) in males. In contrast, the absolute numbers of hearing device users were more evenly distributed across the PTA spectrum; note that 56.2 per cent of female and 57.0 per cent of male hearing device users had a PTA ≤ 40 dB HL. The discrepancy is explained by the much higher population of individuals with normal hearing or mild hearing loss compared with moderate-severe hearing loss. Glasses or contact lens use was nearly ubiquitous (84.2% of males [95% CI 83.3–85.0]; 88.4% of females [95% CI 87.8–89.1]) and therefore a detailed analysis of their use was not performed. Aljied et al. (Reference Aljied, Aubin, Buhrmann, Sabeti and Freeman2018b) have previously examined the frequency and predictors of visiting an eye care professional in Canada using data from the first wave of the CLSA.
Prevalence of hearing device use (hearing aid, amplifier or cochlear implant)

Note: Row % refers to the percentage of females or males within each PTA group who use a hearing device. Col % refers to the percentage of female or male hearing device users who belong to each PTA group.
CI = confidence interval.
Vision Loss
Prevalence proportion and count
Table 5 (and Supplementary Figure 2) displays vision loss prevalence. The proportion of individuals with vision loss increases steadily with age, but the increase is more gradual than for HL. As a reminder, visual acuity in this study is measured with binocular habitual correction unless stated otherwise.
Vision loss prevalence among Canadians aged 45–85 years of age
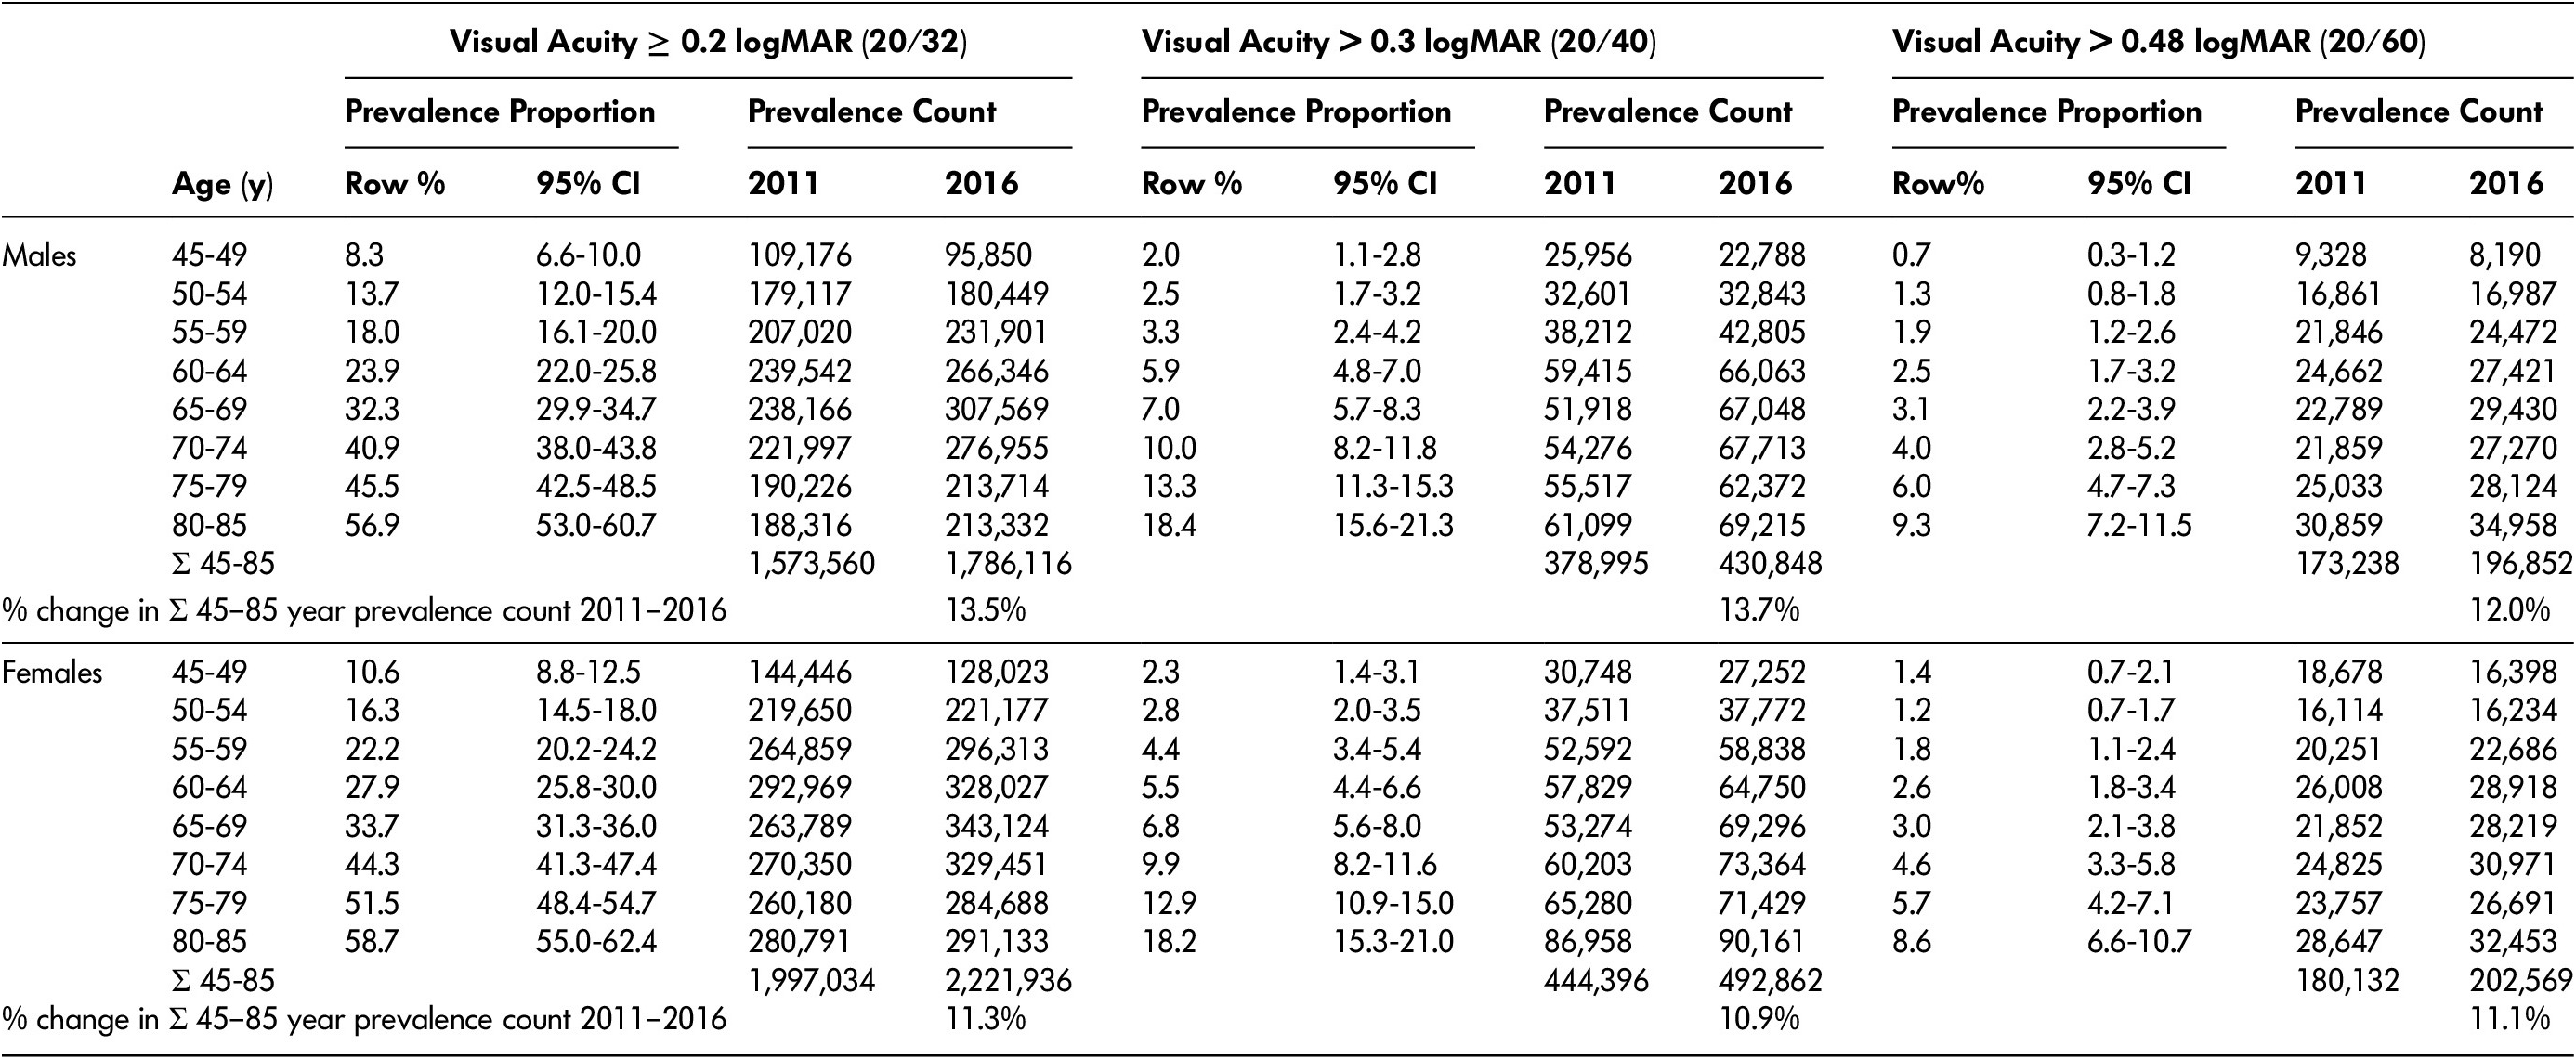
Note. Prevalence counts were calculated by multiplying the displayed prevalence proportion (which was based on data collected between 2012 and 2015) by the population of Canadians in each age category using data from the 2011 census and the 2016 censuses. Visual acuity was measured with binocular habitual correction. Row % refers to the percentage of males or females within each age group who have visual acuity worse than the thresholds listed. Prevalence counts were calculated by multiplying the row% value by the number of Canadians in the same age-sex category in the 2011 and 2016 censuses. For reference, between 2011 and 2016 in Canada, the total population of males 45–85 years of age increased 8.0% and the total population of females 45–85 years of age increased 7.6%.
MAR = minimum angle of resolution; CI = confidence interval.
The prevalence count for visual acuity ≥ 0.2 logMAR increased in both males and females to a maximum among people 65–69 years before slightly diminishing at older ages. The population of males with vision loss ≥ 0.2 logMAR increased from 1,570,000 to 1,790,000 (13.5% increase) between 2011 and 2016; the population with vision loss > 0.3 logMAR increased from 379,000 to 431,000 (13.7% increase). For females, the population with vision loss ≥ 0.2 logMAR increased from 2,000,000 to 2,220,000 (11.3% increase) and the population with vision loss > 0.3 logMAR increased from 444,000 to 493,000 (10.9% increase) during the same time frame.
Cumulative distributions as a function of visual acuity
Figure 1 (lower panel) describes the reverse cumulative prevalence of vision loss according to visual acuity, stratified by age group. As for hearing, cumulative prevalence declines with increasing severity of impairment following an inverse sigmoid curve. In contrast to hearing, however, the separation between the age-specific lines is relatively uniform, demonstrating the more linear increase in prevalence proportion with age.
Prevalence of causes of vision loss
Table 6 displays the national crude- and age-standardized prevalence of the eye diseases reported in the CLSA (also reported by Aljied et al. [Reference Aljied, Aubin, Buhrmann, Sabeti and Freeman2018a], but in our article stratified by sex), and the degree of refractive error among individuals with vision loss (binocular habitually corrected visual acuity ≥ 0.2 logMAR). The prevalence of self-reported macular degeneration, cataracts, or glaucoma was relatively low (range: 2.7–6.3%). When comparing crude values, macular degeneration was significantly more common among females than among males; however, the difference was not significant after adjustment for age. Cataracts (both previously corrected and current) were more common among females than males when comparing both crude and age-standardized prevalence values. In contrast, refractive error (among the population with binocular habitually corrected visual acuity ≥ 0.2 logMAR) was more prevalent among males than among females, even after adjusting for age differences. The prevalence of refractive error decreased exponentially with severity of refractive error.
Prevalence of eye diseases among the entire sample, and refractive error among individuals with vision loss (i.e., binocular habitually corrected visual acuity ≥ 0.2 logMAR)
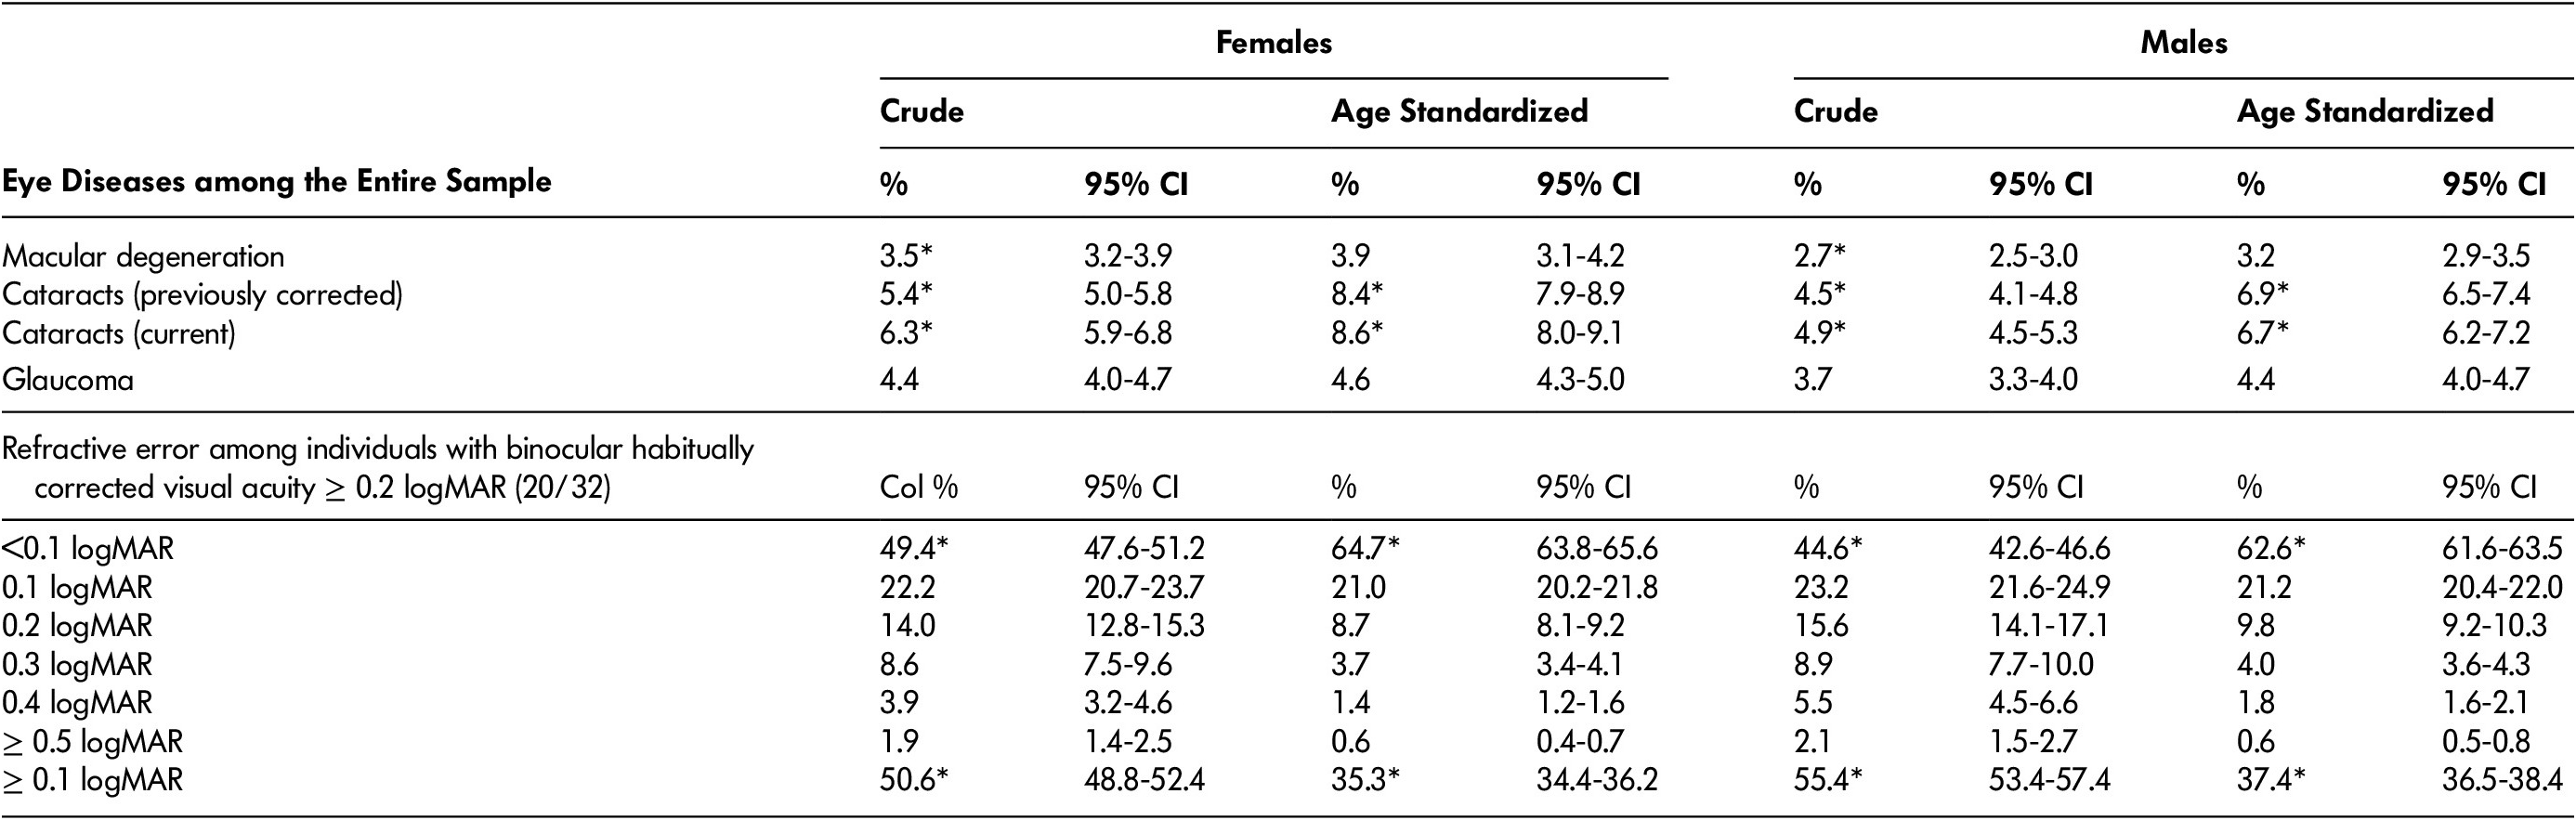
Note. *Significant difference (non-overlapping confidence intervals) between males and females. n refers to number of study participants (unweighted). “Crude” prevalence adjusts for survey weights. Age-standardized prevalence adjusts for differences in age distributions between males and females, and also adjusts for survey weights (see Methods). % refers to the percentage of Canadian females or males 45–85 years of age with the condition listed in the left-hand column. 95% CI refers to 95% confidence interval for the percentage. Refractive error was measured as the difference between habitual- and pinhole-corrected visual acuity in the eye with better pinhole-corrected visual acuity.
MAR = minimum angle of resolution.
Dual Sensory Loss
Prevalence proportion and count
Table 7 and Supplementary Figure 3 show dual sensory loss prevalence. The prevalence proportion of dual sensory loss increased exponentially with age for both males and females, whereas the count increased monotonically. Below the age of 75 years, there were more males than females with dual sensory loss (> 25 dB HL and ≥ 0.2 logMAR), but the situation was reversed in older age groups. Across all age groups, there were more males than females with dual sensory loss when the stricter thresholds (> 40 dB HL and > 0.3 logMAR) were used. The population of males with dual sensory loss (> 25 dB HL and ≥ 0.2 logMAR) increased from 487,000 to 569,000 (16.8% increase) between 2011 and 2016, whereas the population with more severe dual sensory loss (> 40 dB HL and > 0.3 logMAR) increased from 39,000 to 45,000 (15.4% increase). The population of females with dual sensory loss (> 25 dB HL and ≥ 0.2 logMAR) increased from 500,000 to 555,000 (10.9% increase) between 2011 and 2016, whereas the population with more severe dual sensory loss (> 40 dB HL and ≥ 0.4 logMAR) increased from 26,000 to 29,000 (8.8% increase).
Dual sensory loss prevalence among Canadians 45–85 years of age

Note. Prevalence counts were calculated by multiplying the displayed prevalence proportion (which was based on data collected between 2012 and 2015) by the population of Canadians in each age category using data from the 2011 census and the 2016 censuses. Row % refers to the percentage of males or females within each age group who have dual sensory loss defined by the thresholds listed. Prevalence counts were calculated by multiplying the row% value by the number of Canadians in the same age-sex category in 2011 and 2016 censuses. For reference, between 2011 and 2016 in Canada, the -population of males 45–85 years of age increased 8.0% and the total population of females 45–85 years of age increased 7.6%. Dual sensory loss using World Health Organization (WHO) moderate categories for hearing loss (HL) (>40 dB HL) and vision loss (>0.48 logMAR) are not displayed because only 89/29,002 (0.3%) of Canadian Longitudinal Study on Aging(CLSA) participants had dual sensory loss (DSL) according to these criteria. MAR = minimum angle of resolution.
Discussion
The prevalence of hearing and vision loss among Canadians 45–85 years of age is high, and the proportion with sensory loss increases rapidly with age. In 2016, we estimated that approximately 2,700,000 Canadians 45–85 years of age had at least mild HL (PTA > 25 dB HL), 4,000,000 had at least mild vision loss (logMAR ≥ 0.2) and 1,100,000 had at least mild impairments in both senses.
When considering the results, it is important to remember that most cases of impairment were mild, and that the functional impact of mild impairment varies considerably between individuals. For some, the effect may be negligible, whereas for others it may lead to considerable activity limitations and participation restrictions (Colenbrander, Reference Colenbrander2003; Timmer, Hickson, & Launer, Reference Timmer, Hickson and Launer2015). Mild vision impairment has been associated with increased risk of hip fractures in women (Coleman et al., Reference Coleman, Cummings, Ensrud, Yu, Gutierrez and Stone2009), and mild HL is associated with lower cognition, social isolation (Mick & Pichora-Fuller, Reference Mick and Pichora-Fuller2016), and dementia (Lin, Niparko, & Ferrucci, Reference Lin, Niparko and Ferrucci2011). It should be noted that half of the hearing aid users in our sample only had mild HL, indicating that a mild impairment is sufficient to warrant seeking and obtaining treatment for many people. The definition of “mild” impairment varies in the literature for both hearing (Timmer et al., Reference Timmer, Hickson and Launer2015) and vision (World Health Organization, 2018a). The lower limit for the definition of vision loss (0.2 logMAR) used in this study is based on classification schemes used previously and evidence of functional impairment (Colenbrander, Reference Colenbrander2002, 2003; Leat et al., Reference Leat, Legge and Bullimore1999), but is not universally accepted. Other authors report prevalence using more stringent cutoffs (e.g., 0.3 or 0.4 logMAR). Our results using the 0.2 logMAR threshold will overestimate prevalence when compared against studies using higher cut-offs. To better enable comparisons, our tables display prevalence using a variety of definitions.
The high prevalence of hearing and vision loss among Canadian adults is generally in line with results from the Global Burden of Disease Studies. In the 2015 iteration of the GBD (Vos et al., Reference Vos, Allen, Arora, Barber, Bhutta and Brown2016), for all ages, sensory impairment was the second highest cause of YLDs globally and in high income countries. Between 2005 and 2015, the proportion of the global population with “disabling” hearing loss (PTA ≥ 35 dB HL) increased by 12.0 per cent (from 5.73% to 6.42% of the total population) so that in 2015, 473,000,000 people had disabling hearing loss (vs. 1.3 billion with hearing loss ≥ 20 dB HL). In 2015, 940,000,000 had vision impairment, including 34,300,000 who were blind, 24,300,000 with severe impairment, 214,000,000 with moderate impairment, and 663,000,000 with near-vision impairment. The largest identified cause was uncorrected refractive error. Between 1990 and 2015, the number of people who were blind increased by 17.9 per cent, whereas the number of people with moderate and severe vision impairment increased by 35.5 per cent, changes attributable to population growth, aging, and decreases in age-specific prevalence. The GBD numbers apply to all sexes and ages, preventing direct comparisons with our results, but the vast majority of individuals with hearing and vision loss in Canada and around the world are older adults (Vos et al., Reference Vos, Allen, Arora, Barber, Bhutta and Brown2016).
HL prevalence estimates reported in this manuscript are generally better than those reported previously for Canada (2012/2013 Canadian Health Measures Survey Cycle 3) (Feder et al., Reference Feder, Michaud, Ramage-Morin, McNamee and Beauregard2015), the United Kingdom (Cardiff, Glasgow, Nottingham and Southampton, 1980s) (Davis, Reference Davis1989), Australia (Blue Mountains Study, 1997-2000) (Gopinath et al., Reference Gopinath, Rochtchina, Wang, Schneider, Leeder and Mitchell2009) and the United States (National Health and Nutrition Examination Surveys, 1999–2004 and 2005–2006) (Agrawal, Platz, & Niparko, Reference Agrawal, Platz and Niparko2008; Lin, Niparko, et al., Reference Lin, Niparko and Ferrucci2011). The prevalence of vision loss reported in our study is similar to that reported in Australia (Tay, Wang, Rochtchina, & Mitchell, Reference Tay, Wang, Rochtchina and Mitchell2005) and the United States (Lee, Gómez-Marín, Lam, Zheng, & Jané, Reference Lee, Gómez-Marín, Lam, Zheng and Jané2004). The prevalence of dual sensory loss was generally lower than in previous reports from Australia (Blue Mountains Study, 1997–2004) (Chia et al., Reference Chia, Mitchell, Rochtchina, Foran, Golding and Wang2006; Schneider et al., Reference Schneider, Gopinath, McMahon, Teber, Leeder and Wang2012), but similar to data from the United States (National Health and Nutrition Examination Survey, 1999–2006) (Swenor, Ramulu, Willis, Friedman, & Lin, Reference Swenor, Ramulu, Willis, Friedman and Lin2013).
Observed patterns in prevalence proportion were consistent with previous reports. As expected, we found a close association between prevalence proportion and age. For HL, prevalence proportion increased exponentially with age, whereas for vision loss, the increase was more gradual. This difference resulted in a monotonic increase in the population with HL between the ages of 45 and 85 years, but a peak in the 60–65-year-old age group for vision loss (≥ 0.2 logMAR). Males were at higher risk of HL and dual sensory loss, but in the oldest age groups, more females had these impairments because of their higher rates of survival. Females were at higher risk of vision loss in general and cataracts specifically. At all ages, prevalence decreased exponentially as the severity of sensory loss increased. Whereas vision loss was very common, relatively few individuals had diagnoses of macular degeneration, cataracts, or glaucoma (range: 3.2–8.6% of the population).
There are several possible reasons for the sex differences. In regard to HL, it has been reported that females have shorter cochlear ducts and greater stiffness in the basilar membrane, which may contribute to earlier latencies relative to males in speech-auditory brainstem responses (Krizman, Skoe, & Kraus, Reference Krizman, Skoe and Kraus2012). Hormonal differences may impact auditory function with aldosterone, vasopressin, estrogen, and melatonin having protective effects, and testosterone, progesterone, and stress hormones playing a role in auditory pathology.(Al-Mana, Ceranic, Djahanbakhch, & Luxon, Reference Al-Mana, Ceranic, Djahanbakhch and Luxon2008; Frisina, Reference Frisina2012) Gender-related risk factors for HL that are more prevalent in males include lower education level, smoking, and industrial noise exposure. (Statistics Canada, 2018a) In contrast, males are also more likely to consume alcohol, which when ingested in moderate amounts may be protective (Kim et al., Reference Kim, Lim, Kim, Park, Jarng and Lee2010; Statistics Canada, 2018a).
Unlike HL, vision loss appeared to be slightly more prevalent in females than males. In analyses that adjusted for differences in age distributions (i.e., age-standardized analyses), females were more likely to have cataracts than males, but there were no sex differences in rates of macular degeneration or glaucoma. Information on diabetic retinopathy was not available in the CLSA. Our findings are consistent with a higher global prevalence of cataracts among females than males, possibly because of harmful estrogen withdrawal effects after menopause (estrogen may reduce cataract formation because of anti-oxidative properties) and differences in access to cataract surgery (Zetterberg, Reference Zetterberg2016). Aljied et al, in their study of the CLSA Comprehensive cohort, reported that more females than males access eye care, but prevalence of cataract surgery was not reported, because the information is not collected in the CLSA (Aljied et al., Reference Aljied, Aubin, Buhrmann, Sabeti and Freeman2018a). In our study, we found that males with vision loss (visual acuity ≥ 0.2 logMAR) were more likely to have refractive error ≥ 0.1 logMAR, which is consistent with the lower uptake of vision care among older males in Canada reported by Aljied et al. Receiving eye care services would increase the likelihood of being fitted with lenses that better correct refractive error. In other countries, especially developing countries, the opposite appears to be true; that is, access to optometry or ophthalmology services is more prevalent among males than females with vision loss (Doyal & Das-Bhaumik, Reference Doyal and Das-Bhaumik2018; Olusanya, Ashaye, Owoaje, Baiyeroju, & Ajayi, Reference Olusanya, Ashaye, Owoaje, Baiyeroju and Ajayi2016). Previous studies show that diabetic retinopathy may be more common in males (Zetterberg, Reference Zetterberg2016). In Canada, more males than females have diabetes (Statistics Canada, 2018b), and studies from the United States have shown that among people with diabetes, retinopathy is more likely among males than females. Females appear to be at greater risk for angle closure glaucoma because of anatomic factors, but there is no clear sex association for open angle glaucoma, which is much more common (Vajaranant, Nayak, Wilensky, & Joslin, Reference Vajaranant, Nayak, Wilensky and Joslin2010).
The difference in prevalence between males and females was larger for HL than for vision loss; this probably explains the male predominance for dual sensory loss.
Our estimates for change in prevalence count between 2011 and 2016 reflect population increases, with the population of males 45–85 years of age growing 8.0 per cent, and the population of females 45–85 years of age growing 7.6 per cent (Statistics Canada, 2011, 2016) and with aging of the population pyramid. The estimates do not take into account any changes in the age-specific risk of sensory loss that may have occurred over this time frame, but we have no reason to assume that such changes significantly influence our results, because the prevalence proportions used were calculated from data collected in between the two censuses (i.e., during 2012–2015). The age-specific prevalence of HL and vision loss does, however, appear to be decreasing, perhaps in response to reduced lifetime exposure to risk factors in later generations of seniors (Cruickshanks et al., Reference Cruickshanks, Nondahl, Johnson, Dalton, Fisher and Huang2017; Hoffman, Dobie, Losonczy, Themann, & Flamme, Reference Hoffman, Dobie, Losonczy, Themann and Flamme2017; Zhan et al., Reference Zhan, Cruickshanks, Klein, Klein, Huang and Pankow2010). Therefore, our estimates of change over time may be slightly overestimated, and future increases may be lower than predicted based solely on changes in population size and age distribution. Barring dramatic reductions in the incidence of age-related sensory loss, prevalence count should continue to rise rapidly until at least 2030, when the youngest baby boomers will reach the age of 65 years, and the projected proportion of seniors in the population will have increased to 22.8 per cent from 15.3 per cent in 2013 (Statistics Canada, 2014).
The CLSA cohort analyzed in this study was healthier, wealthier, and better educated than the general population of Canada, and participants in the 2012/13 Canadian Health Measures Survey (CHMS). These differences may limit generalizability of the results and explain why hearing and dual sensory loss prevalence were lower than in estimates from the CHMS and studies from other parts of the world (Raina, Wolfson, Kirkland, & Griffith, n.d.). In 2011, 9.3 per cent of those in the country 45–85 years of age versus 5.2 per cent of CLSA participants had annual household incomes less than $20,000. In the general population, 54.2 per cent of adults 45–65 years of age report having post-secondary education, versus 72.6 per cent of CLSA participants. Furthermore, hearing and vision ability was worse among the 3.6 per cent of participants who were excluded from our analysis because of missing data than among those with complete data. Because worse health, lower income, and less education are independently associated with worse hearing and vision (Fisher et al., Reference Fisher, Li, Chiu, Themann, Petersen and Jónasson2014; Lin, Niparko, et al., Reference Lin, Niparko and Ferrucci2011; Tielsch, Sommer, Katz, Quigley, & Ezrine, Reference Tielsch, Sommer, Katz, Quigley and Ezrine1991), these factors suggest that our estimates may underestimate the true national prevalence. Furthermore, it is likely that the bias is especially large for the older age groups within the sample, because a larger proportion of them were likely to have been excluded from the CLSA, for example because of age-related impairments that may have prevented them from participating, or institutionalization in long-term care homes.
Visible minorities were also under-represented among CLSA participants. Ninety-four percent reported having a white cultural background, which is significantly higher than for the general population (Turcotte & Schellenberg, Reference Turcotte and Schellenberg2007). It is unclear if visible minority status affects the risk of sensory loss in Canada, although there is circumstantial evidence that being a visible minority could have a beneficial effect on hearing. Nearly two thirds of visible minorities in Canada are immigrants, who are generally healthier (as measured by age-standardized mortality rates) than native-born Canadians, and better health is associated with improved hearing and vision (Fisher et al., Reference Fisher, Li, Chiu, Themann, Petersen and Jónasson2014). The so-called “healthy immigrant effect” varies in magnitude but is still present for all regions of origin. It diminishes with time lived in Canada, but is still detectable 20 years after immigration (Ng, Reference Ng2015). In the United States, race/ethnicity other than non-Hispanic white is associated with equal or better hearing in multivariable analyses (Hoffman et al., Reference Hoffman, Dobie, Losonczy, Themann and Flamme2017; Lin et al., Reference Lin2012). For vision, the prevalence of age-related macular degeneration and cataract surgery was higher in non-Hispanic whites, but diabetic retinopathy and glaucoma were higher in non-Hispanic blacks, relative to other groups in the United States. Visible minority groups differ in country of origin and socio-economic status between the United States and Canada, where the largest groups in descending order are South Asian, Chinese, Black, Filipino, and Latin American. Further studies are needed to estimate sensory loss prevalence among Canadian visible minority groups. Separate studies are also needed to determine the occurrence of hearing and vision loss among older Indigenous Canadians, who were excluded from the CLSA if they lived on reserves or in the Northern Territories, and who in general have more risk factors for hearing and vision loss than the general population (Harris, Bhattacharyya, Dyck, Hayward Naqshbandi, & Toth, Reference Harris, Bhattacharyya, Dyck, Hayward Naqshbandi and Toth2013; Langan, Sockalingam, Caissie, & Corsten, Reference Langan, Sockalingam, Caissie and Corsten2007).
Pure-tone thresholds and visual acuity are frequently used measures of hearing and vision, respectively, and therefore allow comparisons with other studies in the literature. These measures do not rely on self-reported ratings, thereby providing more accurate assessments of biological functioning of the auditory and visual systems. The continuous scales allow estimation of severity of impairment, and provide statistical power. Despite these benefits, these measures only partially describe hearing and vision ability, and incompletely predict restrictions in activity, participation, and well-being in everyday life (World Health Organization, 2001) resulting from hearing and/or vision loss. Weinstein and Ventry reported that audiometric thresholds account for less than 50 per cent of the variance in reported hearing handicap (Weinstein & Ventry, Reference Weinstein and Ventry1983). Compared with pure-tone audiometry, tests of how well listeners can understand speech are better suited to assess the integrity of higher-level auditory processing and may be more reflective of real-world functioning (Pichora-Fuller, Reference Pichora-Fuller2003). Future waves of the CLSA will include the Canadian Digit Triplet Test in French and English versions (Ellaham, Giguère, Lagacé, & Pichora-Fuller, Reference Ellaham, Giguère, Lagacé and Pichora-Fuller2016) based on a protocol in which participants are asked to repeat randomly presented digits against a noisy background. This type of speech-in-noise testing has been used in other countries (e.g., Jansen, Luts, Wagener, Frachet, & Wouters, Reference Jansen, Luts, Wagener, Frachet and Wouters2010) and in other population studies such as the UK Biobank (Dawes et al., Reference Dawes, Fortnum, Moore, Emsley, Norman and Cruickshanks2014). Compared with visual acuity testing, contrast sensitivity tests may be more representative of functional limitations associated with age-related vision loss (Lord, Clark, & Webster, Reference Lord, Clark and Webster1991; Rubin, Roche, Prasada-Rao, & Fried, Reference Rubin, Roche, Prasada-Rao and Fried1994). A person’s ability to compensate for sensory impairments may be just as important as behavioural measures of hearing and vision, in terms of how sensory loss affects their lives. Such contextual factors (i.e., as described in the International Classification of Functioning, Disability, and Health) (World Health Organization, 2001) are not reflected in our prevalence estimates. We are currently investigating factors in addition to pure-tone average and visual acuity scores that predict subjective ratings of hearing and vision loss (Hämäläinen, Pichora‐Fuller, Wittich, Phillips, & Mick, Reference Hämäläinen, Pichora‐Fuller, Wittich, Phillips and Mick2019). Determining who is most at risk for the negative consequences of sensory loss is an important research goal, so that given limited budgets, health care resources can be distributed equitably.
We found that a relatively low proportion of individuals with HL used hearing amplification devices. As expected, use increased with severity of impairment. The findings are on par with figures from the 1999–2006 National Health and Examination Surveys (NHANES) in the United States (Chien & Lin, Reference Chien and Lin2012). Hearing aid use among CLSA participants was lower than among participants of the 1997–2003 Australian Blue Mountains study, who were on average older than CLSA participants (Hartley, Rochtchina, Newall, Golding, & Mitchell, Reference Hartley, Rochtchina, Newall, Golding and Mitchell2010). Pure-tone average is only one of many factors (including socio-economic status, self-rated hearing ability, age, and activity limitations) that may affect hearing aid use (Hartley et al., Reference Hartley, Rochtchina, Newall, Golding and Mitchell2010; Helvik, Krokstad, & Tambs, Reference Helvik, Krokstad and Tambs2016; Meyer & Hickson, Reference Meyer and Hickson2012). In the CLSA, hearing device use was more common in males than in females. Some studies have shown an effect of sex on hearing device use (Staehelin et al., Reference Staehelin, Bertoli, Probst, Schindler, Dratva and Stutz2011), whereas others have not (McKee et al., Reference McKee, Choi, Wilson, DeJonckheere, Zazove and Levy2018; Popelka et al., Reference Popelka, Cruickshanks, Wiley, Tweed, Klein and Klein2015). Multivariable analyses using CLSA data are required to determine if the differences seen in our study may be explained by sex- or gender-related factors such as age distribution, hearing loss severity, self-perceived disability, socio-economic status, and/or audiogram configuration.
More than 50 per cent of males and females with vision loss had refractive error ≥ 0.1 logMAR, and approximately 30 per cent had refractive error ≥ 0.2 logMAR. Therefore, a large number of Canadians with vision loss would likely benefit from better correction of their refractive error. Further research is needed to understand the reasons why so many individuals had refractive error, which is unexpected considering that 84–88 per cent of participants wore glasses or contact lenses, and previous research showed that 57 per cent of CLSA participants visited an optometrist or ophthalmologist in the past year (Aljied et al., Reference Aljied, Aubin, Buhrmann, Sabeti and Freeman2018a).
In contrast to many studies in the literature, we compiled results for HL, vision loss, and dual sensory impairment in a single article. Individuals with an impairment in one modality usually rely on their other sense to help them communicate and navigate, and therefore the functional disability resulting from a dual sensory loss may be synergistic rather than additive. Treatment strategies may differ for individuals with dual sensory loss than for those with a single impairment. Therefore, we feel it is important to focus on individuals with both impairments, especially given the high prevalence of both hearing and vision loss in older age. Notably, 25 per cent of adults 70–75 years of age and 40 per cent of adults 80–85 years of age had dual sensory loss (>25 dB HL and ≥ 0.2 logMAR) and its prevalence has increased from 2011 to 2016 at a rate comparable to the prevalence of vision or HL alone. Other researchers should similarly consider addressing hearing and vision simultaneously, which may require collaborations beyond traditional professional silos.
Limitations
The study results are specific to Canada in the early 2010s and may not be applicable to other places and times. Furthermore, as elaborated previously, the CLSA is in general healthier, wealthier, and better educated than the general population and, therefore, the study results may underestimate the true national prevalence of HL, vision loss, and dual sensory loss. This was a population-based study and results therefore do not reflect the clinical population. Most participants were recruited by telephone and therefore individuals with severe HL may have been excluded because of difficulties with telephone communication. Previous validation studies have shown that self-reported questionnaires have poor sensitivity for ophthalmologic disease when compared against more objective measures, and therefore our estimates of eye diseases may also underestimate the true prevalence (Foreman et al., Reference Foreman, Xie, Keel, van Wijngaarden, Taylor and Dirani2017; Patty et al., Reference Patty, Wu, Torres, Azen and Varma2012). There was no information about why individuals were classified as unable to read the ETDRS chart, but because only nine were excluded for this reason, the results would unlikely have changed significantly if they had been classified as blind. There was no information at all about etiologies of HL, and a lack of bone-conduction audiometry prevents classification of HL as conductive or sensorineural. The self-reported hearing aid question provides no details about meaningful clinical use (e.g., hours per day worn, benefit, satisfaction) and therefore provides only a rough estimate of hearing health care utilization. Questions about other types of hearing health care (e.g., auditory rehabilitation, surgery) were not asked by the CLSA. There were no questions asked about tinnitus and other aspects of HL that contribute to quality of life. The limitations of audiometry and visual acuity as the sole measures of hearing and vision loss, respectively, have been discussed. Briefly, they only reflect specific domains of sensory function. In specific individuals, sensory functioning may be better reflected by other measures (e.g., speech in noise testing or contrast sensitivity testing), or may be affected by contextual factors (e.g., a person’s physical and social environments, co-morbidities, or access to health care).
Conclusions
To conclude, our study provides the first national estimates of HL and dual sensory loss prevalence among older Canadians using data from the CLSA. Aljied et al (Reference Aljied, Aubin, Buhrmann, Sabeti and Freeman2018b) have previously reported the prevalence of vision loss using the 0.3 logMAR threshold. The current study adds to their work by reporting vision loss prevalence using different levels of severity, and stratifying all results by sex. Consistent with studies from other parts of the world, the prevalence of sensory loss is high, varies according to sex, and is increasing rapidly because of population growth and aging. This information will be useful to health policy planners, clinicians, consumer groups, individuals, and industry partners. The results of the study will act as a baseline against which future estimates of prevalence generated from the aging CLSA cohort may be compared. Although the CLSA is national in scope, certain important groups were excluded from or under-represented in the survey; therefore the estimations may not be entirely representative of the national population and likely underestimate true prevalence. Future population-based studies of sensory loss prevalence in Canada should focus on Indigenous Canadians, visible minority groups, people with low levels education and/or income, people living in rural areas, culturally deaf sign-language users, people with cognitive problems, individuals living in institutions, and members of the armed forces. Research is also needed to identify individual factors that predict health and social problems that arise from sensory loss in order to facilitate the equitable delivery of new health care resources for sensory loss. This information could be used to develop a plan that incorporates primary, secondary, and tertiary prevention strategies for sensory loss into broader efforts to improve seniors’ health (Sinha et al., Reference Sinha, Griffin, Ringer, Reppas-Rindlisbacher, Stewart and Wong2016; World Health Organization, 2007).
Supplementary Materials
To view supplementary material for this article, please visit http://dx.doi.org/10.1017/S0714980820000070.


