





Introduction
Palmer amaranth (Amaranthus palmeri S. Watson) is one of the most competitive and economically damaging weeds in U.S. row-crop systems. Native to the southwestern United States and northern Mexico, it expanded rapidly across the 20th century as modern agricultural practices created favorable conditions for establishment and spread (Roberts and Florentine Reference Roberts and Florentine2021; Sauer Reference Sauer1957; Ward et al. Reference Ward, Webster and Steckel2013). Early reports outside its native range include Virginia in 1915, Oklahoma in 1926, and South Carolina in 1957 (Ehleringer Reference Ehleringer1983; Dowler, Reference Dowler1992; Sauer Reference Sauer1957). Since then, A. palmeri has continued to spread well beyond its original range and is now reported across much of North and South America, Europe, East Asia, and the Mediterranean region (Cao et al. Reference Cao, Wu, Wan, Guo and Wang2022; Dominguez-Valenzuela et al., Reference Dominguez-Valenzuela, Gherekhloo, Fernández-Moreno, Cruz-Hipolito, Alcántara-de la Cruz, Sánchez-González and De Prado2017; Gaines et al., Reference Gaines, Slavov, Hughes, Hughes, Küpper, Sparks, Oliva, Vila-Aiub, Alejandro Garcia, Merotto and Neve2021; Manicardi et al., Reference Manicardi, Milani, Scarabel, Mora, Recasens, Llenes, Montull and Torra2025a, Reference Manicardi, Mora, Araujo, Gaines, Lozano-Juste and Torra2025b; Matzrafi et al. Reference Matzrafi, Scarabel, Milani, Iamonico, Torra, Recasens, Montull, Llenes, Gazoulis, Tataridas, Rubin, Pardo, Cirujeda, Marí, Mennan, Kanatas, Dogan, Beffa and Travlo2023; Milani et al. Reference Milani, Panozzo, Farinati, Iamonico, Sattin, Loddo and Scarabel2021; Torra et al. Reference Torra, Royo-Esnal, Romano, Osuna, León and Recasens2020).
Among dioecious Amaranthus species, A. palmeri is exceptionally invasive and adaptable to new habitats and climates (Ehleringer Reference Ehleringer1983; Sauer Reference Sauer1957; Ward et al. Reference Ward, Webster and Steckel2013). It emerged as the most problematic weed in cotton (Gossypium hirsutum L.) in the Carolinas by the mid-1990s (Dowler, Reference Dowler1992), and by 2009 it was ranked the most difficult cotton weed across 9 of 10 southern U.S. states. It is also among the most troublesome weeds in corn (Zea mays L.) and soybean [Glycine max (L.) Merr.] systems (Webster and Nichols Reference Webster and Nichols2012c). Yield losses attributed to A. palmeri are substantial across crops, reaching up to 28% in peanut (Arachis hypogaea L.) (Burke et al. Reference Burke, Schroeder, Thomas and Wilcut2007) and ranging from 11% to 91% in corn as densities increase from 0.5 to 8 plants m⁻2 (Massinga et al. Reference Massinga, Currie, Horak and Boyer2001). In cotton, the presence of only one A. palmeri plant every 3 m of row can reduce yield by approximately 28% (Smith et al. Reference Smith, Baker and Steele2000).
Competitiveness is pronounced even at low densities, where individual plants grow vigorously and capture resources efficiently. Consequently, yield loss scales strongly with density, and even 99% control may not reduce populations below economic thresholds (Klingaman and Oliver Reference Klingaman and Oliver1994). When emergence occurs early, seed production is extraordinary: the first cohort in cotton produced approximately 446,000 seeds per plant, declining with delayed emergence or crop competition (Webster and Grey Reference Webster and Grey2015).
The first confirmed glyphosate-resistant A. palmeri populations were reported in Georgia, where effective control required six to eight times the recommended herbicide dose (Culpepper et al. Reference Culpepper, Grey, Vencill, Kichler, Webster, Brown, York, Davis and Hanna2006). By 2008, resistance had been confirmed across Arkansas, Georgia, North and South Carolina, and Tennessee (Price et al. Reference Price, Balkcom, Culpepper, Kelton, Nichols and Schomberg2011). As glyphosate resistance increased, growers shifted toward paraquat and glufosinate and reduced sequential glyphosate use, aided by extension programs emphasizing A. palmeri–free fields at planting to protect yield (Sosnoskie and Culpepper Reference Sosnoskie and Culpepper2014).
Despite substantial progress, important gaps remain in understanding the physiological basis of glyphosate resistance in field populations. Two complementary assays are particularly informative. Radiolabeled [14C]glyphosate enables quantitative assessment of absorption, translocation, and tissue distribution, helping identify non–target site resistance processes such as reduced translocation, altered compartmentalization, or vacuolar sequestration (Ge et al. 2010; Nandula et al. Reference Nandula, Ray, Ribeiro, Pan and Reddy2013). In parallel, shikimic acid accumulation provides a functional readout of inhibition of 5-enolpyruvylshikimate-3-phosphate synthase (EPSPS), the target enzyme of glyphosate in the shikimate pathway. In susceptible plants, glyphosate application results in a substantial buildup of shikimic acid due to pathway disruption (Dayan et al. Reference Dayan, Owens and Duke2012; Shaner et al. Reference Shaner, Lindenmeyer and Ostlie2011). Resistant biotypes often show attenuated shikimate responses, which have been associated with mechanisms such as EPSPS gene amplification, altered target sensitivity, or reduced delivery of glyphosate to the enzyme (Gaines et al., Reference Gaines, Zhang, Wang, Bukun, Chisholm, Shaner, Nissen, Patzoldt, Tranel, Culpepper, Grey, Webster, Vencill, Sammons and Jiang2010, Reference Gaines, Shaner, Ward, Leach, Preston and Westra2011; Steckel et al. Reference Steckel, Main, Ellis and Mueller2008).
Although multiple herbicide resistance in A. palmeri has been widely reported (Butler-Jones et al. Reference Butler-Jones, Maloney, McClements, Kramer, Morran, Gaines, Besançon and Sosnoskie2024; Manicardi et al., Reference Manicardi, Mora, Araujo, Gaines, Lozano-Juste and Torra2025b; Trebol-Aizpurua et al. Reference Trebol-Aizpurua, Eceiza, Jimenez-Martinez, Marí, Mercedes Royuela, Ana Zabalza and Gil-Monreal2025), resistance evolution does not necessarily occur uniformly across herbicide modes of action. In some field populations, selection pressure has resulted in glyphosate resistance, while susceptibility to other herbicides, including protoporphyrinogen oxidase (PPO)-, acetolactate synthase (ALS)-, or photosystem II (PSII)-inhibiting compounds, has been retained. Framing resistance evolution in this context is essential to distinguish glyphosate-specific resistance from broader resistance syndromes.
While both assays have been used independently, few studies have compared them across populations collected from the same locations over time, which is essential to interpret the physiological basis of evolving resistance. Therefore, this study evaluated four A. palmeri biotypes collected from two Georgia locations 15 yr apart (2008 and 2023) to compare dose–response (ED50), shikimic acid accumulation, and [14C]glyphosate absorption and translocation. The hypothesis was that there has been a temporal increase in glyphosate ED50 from 2008 to 2023 due to continued glyphosate use and continued selection pressure for increased glyphosate resistance. Increased glyphosate ED50 could be viewed in altered physiological responses, including lower shikimic acid accumulation and differences in glyphosate uptake or translocation, compared with populations collected from the same locations in 2008, consistent with the presence of glyphosate resistance in the more recent collections.
Materials and Methods
Plant Material and Growing Conditions
Greenhouse experiments were conducted in 2024 at the University of Georgia campus in Tifton, USA (coordinates: 31.476735°N, 83.528125°W). Two A. palmeri biotypes collected in 2008 and 2023 from the Jones and Little Jones long-term USDA experimental fields in Tift County, Georgia, USA, were selected for this study. These fields have a history of row-crop production, primarily peanut and corn, with repeated applications of glyphosate for postemergence weed control. Seeds were collected from A. palmeri plants at physiological maturity, corresponding to BBCH growth stage 89 (Meier Reference Meier2001). Inflorescences were collected from multiple mature plants within each field once seed heads were fully developed and beginning to dry and were bulked to create a composite seed lot for each biotype. Entire seed heads were clipped and air-dried for 5 to 7 d. After drying, seeds were manually threshed and cleaned using a series of sieves to remove plant debris. Cleaned seeds were stored in plastic vials at 4 C until use (Ward et al. Reference Ward, Webster and Steckel2013). The biotypes were designated as Jones 2008 (J08), Jones 2023 (J23), Little Jones 2008 (LJ08), and Little Jones 2023 (LJ23).
Plants were grown in a greenhouse at 32 ± 5 C, with a 16-h photoperiod provided by metal-halide lamps (600 µE m−2 s−1) and relative humidity ranging between 30% and 70%. Seeds were sown in trays filled with ProMix substrate (BX, Quebec, Canada), and seedlings received fertigation with Miracle-Gro® fertilizer (24-8-16, Scotts Miracle-Gro, Marysville, OH, USA). To ensure uniform plant size, seedlings were thinned to one plant per cell and grown for 3 wk before being transplanted into 500 ml pots containing the same substrate. Upon transplanting, the substrate in each pot was amended with a slow-release 18-5-12 fertilizer (ICL® Specialty Fertilizers, Tel Aviv, Israel) at a rate of 4.5 g per pot. Once plants reached a height of 8 to 12 cm or developed 8 to 10 leaves, as recommended on the herbicide label, herbicide treatments were applied. Throughout the experiment, the substrate was kept moist through periodic watering and received weekly fertigation.
Dose Response
Herbicides were selected to represent active ingredients commonly used in Georgia corn and peanut production systems, although not all products are registered for postemergence application in both crops. Separate preemergence and postemergence herbicide trials were conducted, with the postemergence trial conducted first. The preemergence trial included only flumioxazin (Zaltus™ SX, Atticus, Cary, NC, USA; Group 14). Postemergence treatments included glyphosate (Roundup PowerMax®, Bayer, MO, USA; Group 9), atrazine (Atrazine 4L, Drexel, Memphis, TN, USA; Group 5), imazapic (Cadre®, BASF, Florham Park, NJ, USA; Group 2), and flumioxazin (Zaltus SX) (HRAC 2024).
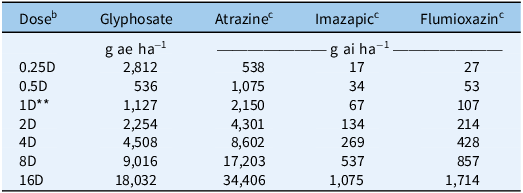
Each herbicide was evaluated at eight rates, including 0 as the untreated control, 0.25D, 0.5D, 1D, 2D, 4D, 8D, and 16D, where D represents the recommended field dose for each herbicide and the remaining rates represent proportional multiples of that dose (Table 1). Herbicides were applied using a hand sprayer pressurized with CO2 and equipped with an XR TeeJet® 11002VS nozzle (TeeJet Technologies, Springfield, IL, USA), operating at 275 kPa and delivering a spray volume of 179 L ha−1, in accordance with label recommendations. A foliar fertilizer, Miracle-Gro® (24-8-26, Scotts Miracle-Gro), was applied weekly through irrigation. At 21 d after application, plants were harvested at the soil surface, placed in paper bags, and oven-dried at 60 C until a constant dry weight was reached.
Herbicides and corresponding doses used in the postemergence dose–response study with four Amaranthus palmeri biotypes (J08, J23, LJ08, and LJ23) collected from Tift County, GA, USA. a

Table 1 Long description
A table comparing herbicide doses and their effects on Amaranthus palmeri biotypes. The table has 8 rows and 5 columns. The columns are labeled Dose, Glyphosate, Atrazine, Imazapic, and Flumioxazin. The rows are labeled with different doses: 0.25D, 0.5D, 1D, 2D, 4D, 8D, and 16D. The values in the columns represent the amount of each herbicide applied in grams or grams per hectare. Row 1: 0.25D, 2812, 538, 17, 27. Row 2: 0.5D, 536, 1075, 34, 53. Row 3: 1D, 1127, 2150, 67, 107. Row 4: 2D, 2254, 4301, 134, 214. Row 5: 4D, 4508, 8602, 269, 428. Row 6: 8D, 9016, 17203, 537, 857. Row 7: 16D, 18032, 34406, 1075, 1714.
a J, Jones field; LJ, Little Jones field. Biotypes were collected in 2008 (J08, LJ08) and 2023 (J23, LJ23).
c Herbicide applied with 0.25% v/v non-ionic surfactant.
b D = recommended label dose; fractions and multiples indicate proportional reductions or increases of this dose.
The experiment followed a completely randomized design with 32 herbicide treatments (4 herbicides × 8 doses) applied to 4 A. palmeri biotypes, with 6 replicates per treatment. The experiment was conducted twice.
Shikimic Acid Accumulation
Seedlings from each population at the 8- to 12-leaf growth stage were used as tissue sources for the shikimic acid assay and were maintained in a growth chamber under the same conditions described previously, with LED lamps providing 800 µmol m⁻2 s−1, a 16/8-h (day/night) photoperiod, temperatures of 35/25C (day/night), and relative humidity maintained between 50% and 75%. The upper range of this growth stage was selected to ensure sufficient leaf area for collection of the required number of leaf disks. The experiment followed a completely randomized design with four biotypes and eight glyphosate concentrations, including a nontreated control at 0 mM and treatment doses of 5, 25, 75, 180, 300, 700, and 1,000 mM, with three replicates per treatment. The experiment was conducted twice.
The shikimate assay was conducted using 7-ml scintillation vials, following modified protocols from Shaner et al. (Reference Shaner, Nadler-Hassar, Henry and Koger2005) and Hoagland et al. (Reference Hoagland, Jordan and Teaster2013). Ten 4-mm-diameter leaf disks from each biotype were excised using a cork borer and placed in each well of a 96-well microplate (Corning™ UV-Transparent, Corning, NY, USA). Control wells received 10 mM ammonium phosphate and 0.1% (v/v) Tween 80 (bioWORLD, Dublin, OH, USA). Glyphosate-treated (Roundup PowerMax®, Bayer) wells received 100 µl of a solution containing 10 mM ammonium phosphate (pH 4.4), 0.1% (v/v) Tween 80, and glyphosate concentrations ranging from 5 mM to 1000 mM. Plates were covered, sealed with Parafilm®, and wrapped in plastic to minimize evaporation.
Plates were incubated under fluorescent light (150 µmol m−2 s−1) at 26 C for 16 to 23 h (except in incubation time trials). After incubation, plates were frozen at −20 C, then thawed at room temperature. Next, 25 µl of 1.25 N HCl (GFS Chemicals, Powell, OH, USA) was added to each well, resulting in a final concentration of 0.25 N HCl. Plates were incubated at 60 C for 15 min, after which disks displayed a uniform gray-green color, indicating complete acid penetration.
Shikimic acid content was determined spectrophotometrically following Cromartie and Polge (Reference Cromartie and Polge2000). A 25-µl aliquot from each well was transferred to a new plate, and 100 µl of a solution containing 0.25 g per 100 ml of periodic acid (Sigma-Aldrich, St Louis, MO, USA) and 0.25 g per 100 ml of) m-periodate (GFS Chemicals) was added. After 90 min at 25 C, 100 µl of 0.6 N NaOH (LabChem, Zelienople, PA, USA) and 0.22 M Na2SO3 (Sigma-Aldrich) were added.
Absorbance at 380 nm was measured within 30 min using a microplate reader. Background absorbance was measured from control wells and subtracted from glyphosate-treated wells. A shikimic acid standard curve was created using known concentrations added to control leaf disks, and results were expressed as µg ml−1 of HCl solution.
Absorption and Translocation of [14C]glyphosate
Plants were grown in the greenhouse until they reached a height of 8 to 12 cm or developed 8 to 10 leaves, as specified on the product label, and were then transferred to a growth chamber before initiation of the experiment to allow for acclimation. The growth chamber was equipped with LED lamps providing 800 µmol m−2 s−1, operated under a 16/8-h (day/night) photoperiod, with temperatures set at 35/25 C (day/night), and relative humidity maintained between 50% and 75%. The experiment followed a completely randomized design with 20 treatments, consisting of four biotypes and five harvest times after treatment, with three replicates per treatment. The study was conducted twice.
Following Grey and Shilling’s (Reference Grey and Shilling2018) method, the second fully expanded leaf was covered with polyethylene film (Cling’n Seal™, Glad®, Oakland, CA, USA). Glyphosate was applied at the labeled rate of 1,127 g ae ha−1 using deionized water and uniformly sprayed over the entire plant. After drying, the film was removed and [14C]glyphosate was applied using a microapplicator (Burkhard, Hertfordshire, UK).
The radiolabeled solution was prepared by mixing 0.5 ml of the spray solution with [14C]glyphosate (American Radiolabeled Chemicals, St Louis, MO, USA) at a 100:1 (v/v) ratio. The specific activity of the [14C]glyphosate was 2 kBq mg−1 with 99% radiochemical purity. Ten 1-µl droplets were applied to the adaxial surface of the leaf, about 2 mm from the midrib. Each plant received approximately 2 kBq of radioactivity.
Plants were returned to the growth chamber and harvested at 1, 6, 12, 24, and 48 h after treatment (HAT). At harvest, each plant was divided into: (1) treated leaf, (2) above treated leaf, (3) below treated leaf (cut at soil level), and (4) roots. Roots were carefully washed over a mesh screen to recover all tissue. Treated leaves were rinsed twice for 15 s with a methanol:deionized water (1:1) solution to remove unabsorbed glyphosate. A 1-ml aliquot of the rinse was combined with 10 ml of scintillation cocktail (Ready Safe®, Beckman Instruments, Fullerton, CA, USA) and measured by liquid scintillation counting (LS6500, Beckman Instruments).
Plant tissues were oven-dried for 48 h at 45 C and weighed. Samples were combusted using a biological oxidizer (OX 500, R.J. Harvey Instrument, Hillsdale, NJ, USA) to convert [14C]glyphosate to CO2, which was captured using a carbon cocktail (Carbon-14 Cocktail, R.J. Harvey Instrument). Radioactivity was quantified via liquid scintillation counting.
Herbicide absorption was calculated as the total radioactivity recovered from all plant parts and expressed as a percentage of the applied [14C]glyphosate. Translocation was calculated as the percentage of absorbed [14C]glyphosate recovered in each plant part on a dry weight basis.
Data Analysis
Dose–response data from repeated experimental runs were initially evaluated for effects of experimental run and then combined for analysis using nonlinear regression with a three-parameter log-logistic model implemented in the drc package (Ritz et al. Reference Ritz, Baty, Streibig and Gerhard2015), with the lower limit constrained to zero:
 \begin{equation} = {d \over {1 + {\rm{exp}}\left\{ {b\left[ {\log \left( x \right) - \log \left( e \right)} \right]} \right\}}} \end{equation}
where $d\;$
is the upper asymptote,
$d\;$
is the upper asymptote, $b\;$
is the slope, and
$b\;$
is the slope, and $e\;$
is the inflection point (ED50). Model selection was based on the Akaike information criterion (AIC).
$e\;$
is the inflection point (ED50). Model selection was based on the Akaike information criterion (AIC).
Data from repeated shikimic acid accumulation and [14C]glyphosate absorption and translocation experiments were initially evaluated for effects of experimental run. Because no significant run effects or run by treatment interactions were detected, data from repeated runs were combined for final analysis. Transformations and model structures were selected based on the distribution and scale of each response variable. Shikimic acid accumulation data were analyzed using linear mixed-effects models (Hothorn et al., Reference Hothorn, Bretz and Westfall2008; Bates et al., Reference Bates, Mächler, Bolker and Walker2015) with glyphosate dose as the predictor and were not transformed before analysis. Biotype and glyphosate concentration (mM) were included as fixed effects, with replication treated as a random effect.
Percentage data from the [14C]glyphosate absorption and translocation experiments were analyzed using generalized linear mixed models assuming a gamma error distribution with a log link, which appropriately accounts for positive, right-skewed data without requiring an explicit transformation. For these analyses, biotype and hours after treatment were included as fixed effects, and replication was included as a random effect (Kuznetsova et al., Reference Kuznetsova, Brockhoff and Christensen2017; Lenth et al., Reference Lenth, Singmann, Love, Buerkner and Herve2018).
To further characterize differences in absorption kinetics among biotypes, the time required to reach 95% of maximum glyphosate absorption (A 95) was estimated for each population using time-course absorption data. Absorption kinetics were modeled separately for each biotype using a nonlinear asymptotic exponential model of the form:
 \begin{equation} A\left( t \right) = {A_{{\rm{max}}}}\left[ {1 - ex{p^{\left( { - kt} \right)]}}} \right] \end{equation}
where $A\left( t \right)$
is percent absorption at time
$A\left( t \right)$
is percent absorption at time $t$
,
$t$
, ${A_{{\rm{max}}}}$
is the asymptotic maximum absorption, and
${A_{{\rm{max}}}}$
is the asymptotic maximum absorption, and $k\;$
is the absorption rate constant. Models were fit using nonlinear least-squares with bounded parameters. For biotypes in which nonlinear model convergence was not achieved due to limited curvature in the absorption time course, A
95 was estimated by linear interpolation of mean absorption values to 95% of the observed maximum, following the approach described by Kniss et al. (Reference Kniss, Vassios, Nissen and Ritz2011).
$k\;$
is the absorption rate constant. Models were fit using nonlinear least-squares with bounded parameters. For biotypes in which nonlinear model convergence was not achieved due to limited curvature in the absorption time course, A
95 was estimated by linear interpolation of mean absorption values to 95% of the observed maximum, following the approach described by Kniss et al. (Reference Kniss, Vassios, Nissen and Ritz2011).
Model assumptions were assessed by graphical evaluation of residuals to confirm normality and homoscedasticity, supplemented by Shapiro-Wilk and Levene’s tests at α = 0.05 when applicable. Estimated marginal means and pairwise comparisons were obtained on the response scale. Significant interactions were further examined using Tukey’s pairwise comparisons, and when interactions were not significant but main effects were detected, mean separation was performed using Tukey’s honest significant difference (HSD) at α = 0.05.
Results and Discussion
Dose Response
Among the postemergence herbicides evaluated, only glyphosate showed reduced efficacy in controlling A. palmeri biotypes. Previous studies have reported resistance to PPO-inhibiting herbicides such as fomesafen, lactofen, acifluorfen, and trifludimoxazin in populations from Georgia (Randell-Singleton et al. Reference Randell-Singleton, Hand, Vance, Wright-Smith and Culpepper2024), and resistance to the ALS inhibitor imazapic has also been documented (Wise et al. Reference Wise, Grey, Prostko, Vencill and Webster2009).
In the present study, postemergence applications of flumioxazin, imazapic, and atrazine resulted in greater than 90% control of all biotypes at the recommended rate, and flumioxazin was also effective when applied preemergence. Consequently, dose–response analysis was conducted only for glyphosate.
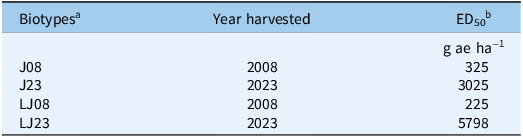
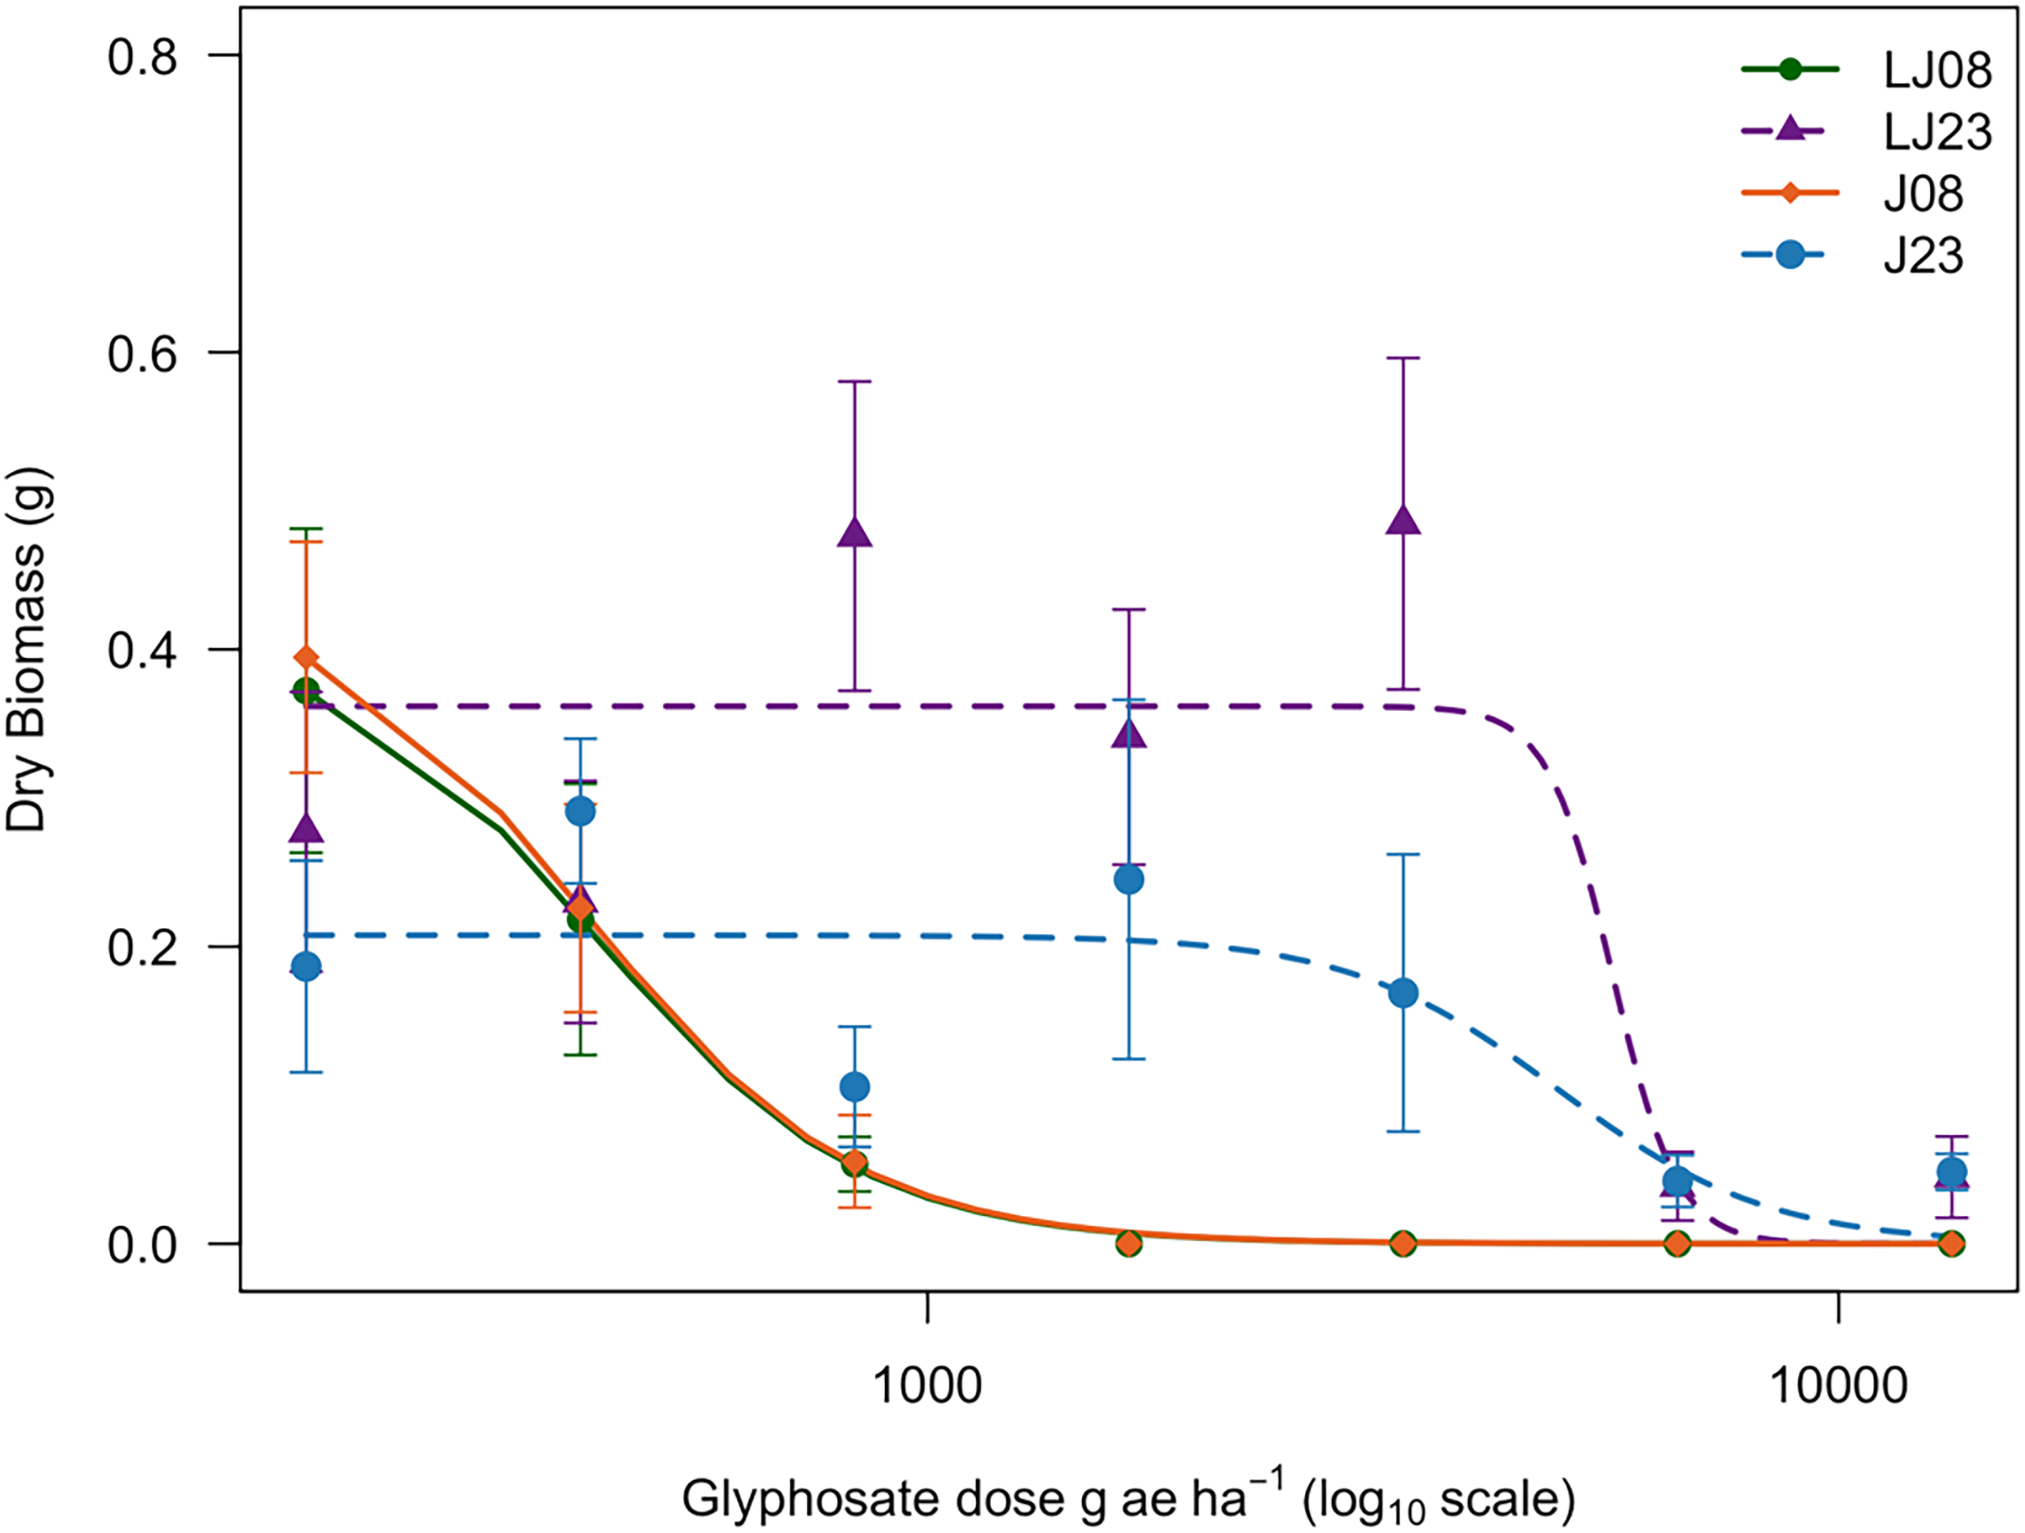
Using a log-logistic model, the ED50, defined as the glyphosate dose required to reduce aboveground dry biomass by 50%, was estimated for the four biotypes J08, J23, LJ08, and LJ23 (Table 2). Relative to the 2008 biotypes, J23 required approximately a 9.3-fold higher glyphosate dose to achieve a 50% biomass reduction compared with J08, whereas LJ23 required approximately a 25.8-fold higher dose than LJ08. Dose–response curves based on dry biomass are shown in Figure 1. Based on ED50 values, J08 and LJ08 were classified as susceptible, while J23 and LJ23 were classified as glyphosate-resistant biotypes.
ED50 values of glyphosate (g ae ha−1) required to reduce dry biomass in Amaranthus palmeri biotypes J08, J23, LJ08, and LJ23 collected in Tift County, GA, USAa
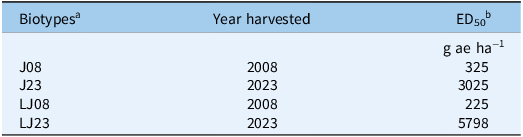
Table 2 Long description
A table with four rows and three columns. The columns are labeled Biotypes, Year harvested, and ED50. The rows are labeled with biotypes J08, J23, LJ08, and LJ23. The ED50 values are given in grams of acid equivalent per hectare (g ae ha-1). Row 1: J08, 2008, 325. Row 2: J23, 2023, 3025. Row 3: LJ08, 2008, 225. Row 4: LJ23, 2023, 5798.
a J, Jones field; LJ, Little Jones field. Biotypes were collected in 2008 (J08, LJ08) and 2023 (J23, LJ23).
b ED50, the estimated dose required to reduce biomass by 50%. Values calculated from a log-logistic model.
Dose–response curves showing mean dry biomass (g) at 21 d after application (DAA) for Amaranthus palmeri biotypes collected in 2008 and 2023 in Tift County, GA, USA. Biotypes from the Jones field (J08 and J23) and the Little Jones field (LJ08 and LJ23) are shown. Dry biomass is presented as a function of glyphosate dose. Dose–response data were analyzed using nonlinear regression with a three-parameter log-logistic model, with the lower limit fixed at zero:
 $$ = {d \over {1 + {\rm{exp}}\left\{ {b\left[ {\log \left( x \right) - \log \left( e \right)} \right]} \right\}}}$$
where d is the upper asymptote, b is the slope, and e is the inflection point (ED50).
$$ = {d \over {1 + {\rm{exp}}\left\{ {b\left[ {\log \left( x \right) - \log \left( e \right)} \right]} \right\}}}$$
where d is the upper asymptote, b is the slope, and e is the inflection point (ED50).

Log-logistic models fit for each biotype tested are shown below:
 \begin{equation} {\rm{J}}08{:}\;\;\;y = {{{0.56}}\over{{1 + {\rm{exp}}(2.13\left( {\log \left( x \right) - \log \left( {325} \right)} \right)}}} \end{equation}
 \begin{equation} {\rm{J}}23{:}\;\;\;y = {{{0.27}}\over{{1 + {\rm{exp}}(0.88\left( {\log \left( x \right) - \log \left( {3,\!025} \right)} \right)}}} \end{equation}
 \begin{equation} {\rm{LJ}}08{:}\;\;\;y = {{{0.72}}\over{{1 + {\rm{exp}}(1.69\left( {\log \left( x \right) - \log \left( {225} \right)} \right)}}} \end{equation}
 \begin{equation} {\rm{LJ}}23{:}\;\;\;y = {{{0.37}}\over{{1 + {\rm{exp}}(15.5\left( {\log \left( x \right) - \log \left( {5,\!798} \right)} \right)}}} \end{equation}
In this study, achieving effective biomass reduction of the 2023 biotypes required glyphosate doses 11 to 12 times greater than the recommended field rate, indicating a higher level of resistance relative to the 2008 collections from the same locations. Comparable levels of biomass suppression in glyphosate-resistant A. palmeri have been reported in Georgia, where rates up to 7.6 kg ha−1 were required under specific experimental conditions (Culpepper et al. Reference Culpepper, Grey, Vencill, Kichler, Webster, Brown, York, Davis and Hanna2006). Higher resistance factors have also been documented in other studies, although reported magnitudes vary widely depending on population, environment, and methodology, with resistant populations requiring 18 to 115 times more glyphosate than susceptible references (Gaines et al. 2011; Jha et al. Reference Jha, Norsworthy, Bridges and Riley2008; Whitaker et al. Reference Whitaker, Burton, York, Jordan and Chandi2013).
Shikimic Acid Accumulation
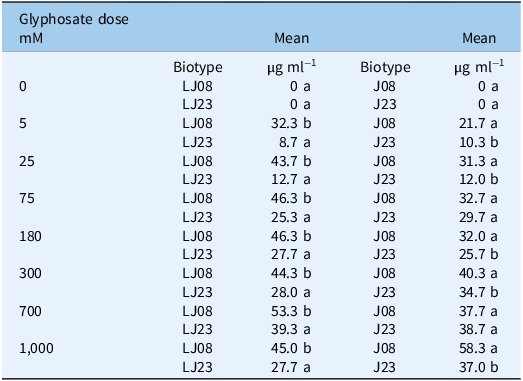
Shikimic acid accumulation responded strongly to both biotype and glyphosate dose, with a highly significant interaction (P < 0.001) (Table 3). All biotypes exhibited increased shikimate accumulation with increasing glyphosate concentration, confirming EPSPS inhibition. However, susceptible biotypes (J08 and LJ08) consistently accumulated two to four times more shikimate than resistant ones at low to intermediate doses (Table 4).
ANOVA results for shikimic acid accumulation in Amaranthus palmeri biotypes J08, J23, LJ08, and LJ23 collected in Tift County, GA, USA, after glyphosate treatment a

Table 3 Long description
A table with two columns and four rows. The first column is labeled Treatment factors and the second column is labeled Shikimic acid accumulation. Row 1: Biotypes, <0.0001***. Row 2: Doses, <0.0001***. Row 3: Biotypes*Doses, <0.0001***. The table indicates the P-values for the effect of different treatment factors on shikimic acid accumulation, with all factors showing highly significant effects.
a J, Jones field; LJ, Little Jones field. Biotypes were collected in 2008 (J08, LJ08) and 2023 (J23, LJ23).
Signif. code: ‘***’ 0.001.
Comparison of mean shikimic acid accumulation (µg ml−1 of HCl solution) in Amaranthus palmeri biotypes (LJ08/LJ23 and J08/J23) collected in Tift County, GA, USA a
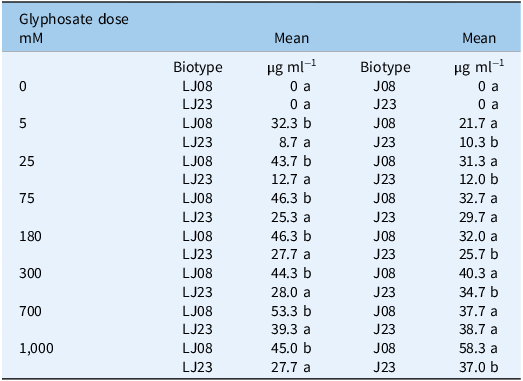
Table 4 Long description
A table with 8 rows and 4 columns. The columns are labeled Glyphosate dose mM, Biotype, Mean g ml1, and Mean g ml1. The rows list different glyphosate doses (0, 5, 25, 75, 180, 300, 700, 1000 mM) and corresponding mean shikimic acid accumulation for two biotypes (LJ08 and LJ23) in the first Mean column and two biotypes (J08 and J23) in the second Mean column. Each row provides specific values for shikimic acid accumulation in micrograms per milliliter for each biotype at the given glyphosate dose.
a J, Jones field; LJ, Little Jones field. Biotypes were collected in 2008 (J08, LJ08) and 2023 (J23, LJ23). Means followed by the same letter within each glyphosate dose (mM) column are not significantly different from each other, according to Tukey’s honest significant difference (HSD) test at α = 0.05.
Shikimic acid concentration increased proportionally with glyphosate dose across all evaluated biotypes, with significantly higher accumulation observed in the susceptible biotypes (J08 and LJ08). These findings support previous observations by Whitaker et al. (Reference Whitaker, Burton, York, Jordan and Chandi2013) and Palma-Bautista et al. (Reference Palma-Bautista, Torra, Garcia, Bracamonte, Rojano-Delgado, La Cruz and De Prado2019), who demonstrated that shikimic acid accumulation can serve as a physiological marker for inhibition of the shikimate pathway, showing stronger responses in nonresistant plants.
This attenuated shikimate response in resistant biotypes is consistent with known glyphosate-resistance mechanisms such as EPSPS gene amplification (Gaines et al., Reference Gaines, Zhang, Wang, Bukun, Chisholm, Shaner, Nissen, Patzoldt, Tranel, Culpepper, Grey, Webster, Vencill, Sammons and Jiang2010, Reference Gaines, Shaner, Ward, Leach, Preston and Westra2011), which increases enzyme abundance relative to herbicide concentration. Non–target site processes, including sequestration and enhanced detoxification, may also contribute (Sammons and Gaines Reference Sammons and Gaines2014; Zulet-González et al. Reference Zulet-Gonzalez, Gorzolka, Döll, Gil-Monreal, Royuela and Zabalza2023).
In contrast to early reports in which highly resistant A. palmeri biotypes exhibited little to no shikimic acid accumulation following glyphosate treatment (Culpepper et al. Reference Culpepper, Grey, Vencill, Kichler, Webster, Brown, York, Davis and Hanna2006), the resistant biotypes evaluated here showed an attenuated, but detectable, shikimate response. This pattern is consistent with variability in resistance mechanisms and resistance intensity among field populations, where partial shikimate accumulation may occur under intermediate levels of EPSPS overexpression or when non–target site resistance mechanisms contribute to the resistant phenotype.
Absorption and Translocation of [14C]Glyphosate
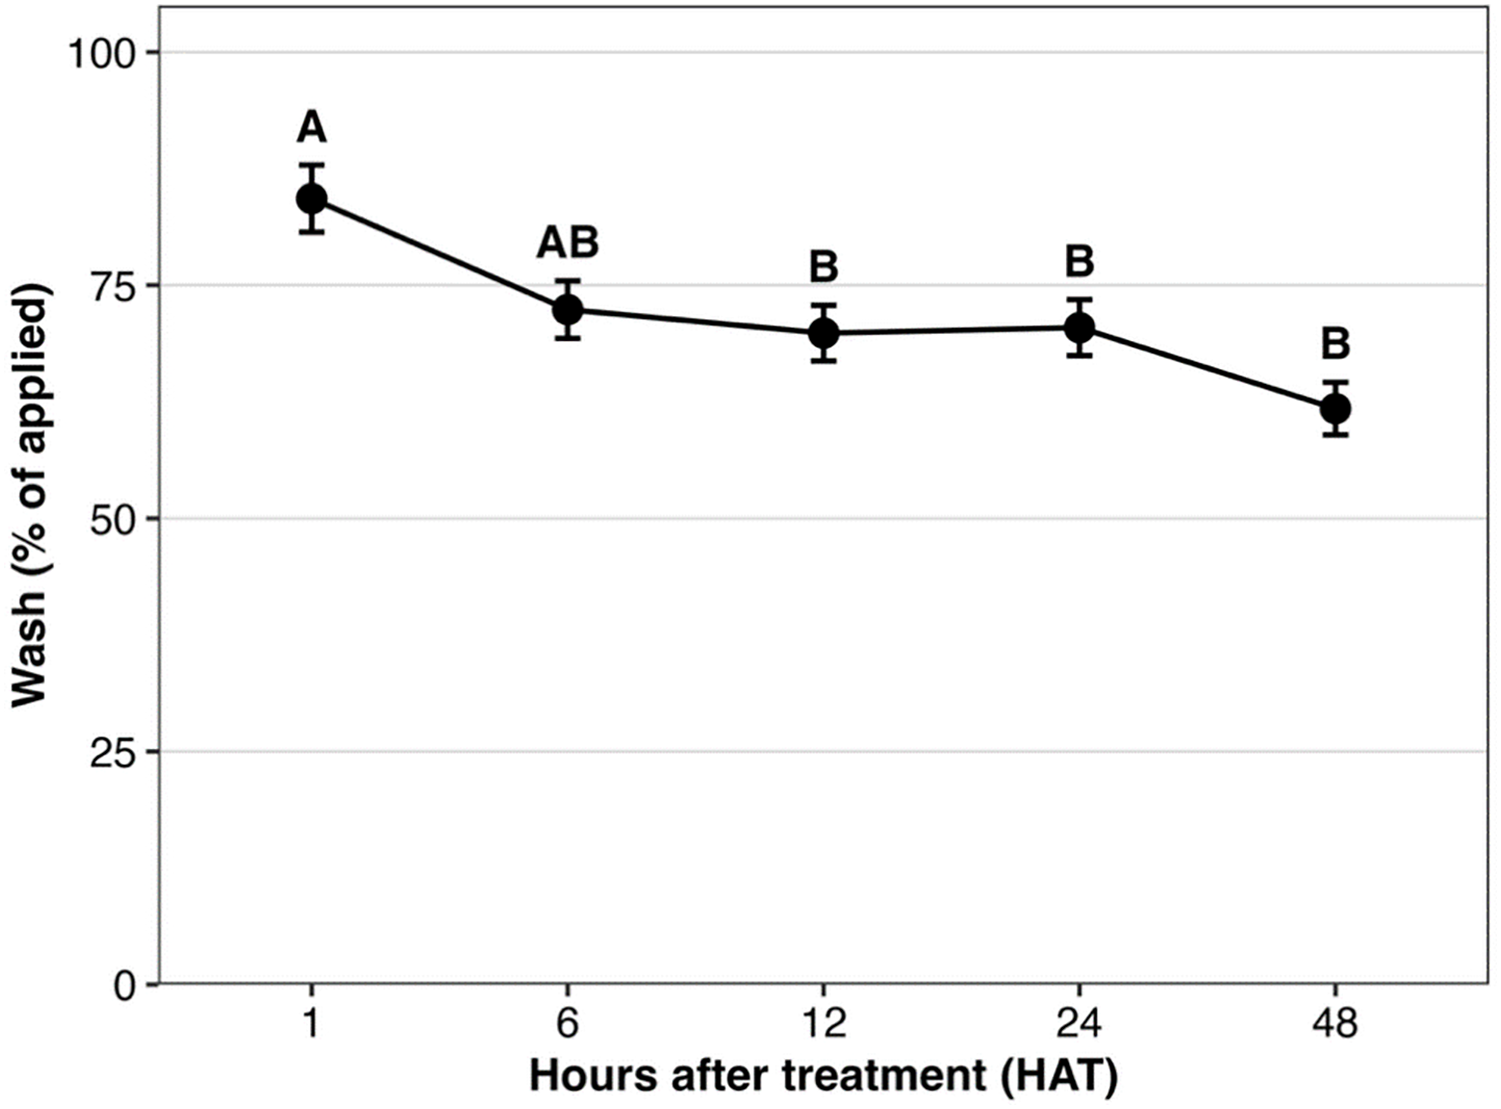
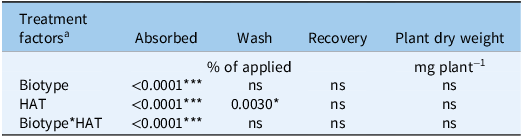
Glyphosate absorption was significantly affected by biotype, harvest time, and their interaction (P < 0.001) (Table 5). The fraction of glyphosate recovered in the leaf wash declined over time (P = 0.003), whereas total recovery and plant biomass were not affected.
ANOVA results for Amaranthus palmeri biotypes collected in Tift County, GA, USA, and their response to [14C]glyphosate treatment, measured in terms of absorption, wash, total radioactivity recovery, and plant dry weight (mg plant−1)
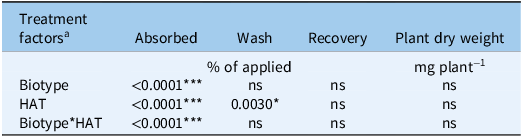
Table 5 Long description
A table with four rows and four columns comparing the effects of treatment factors on glyphosate absorption, wash, recovery, and plant dry weight in Amaranthus palmeri biotypes. The columns are labeled Treatment factors, Absorbed, Wash, Recovery, and Plant dry weight. The row labels are Biotype, HAT, and Biotype*HAT. Row 1: Biotype, less than 0.0001, ns, ns, ns. Row 2: HAT, less than 0.0001, 0.0030, ns, ns. Row 3: Biotype*HAT, less than 0.0001, ns, ns, ns.
a HAT, hours after treatment.
Signif. codes: ‘***’ 0.001; ‘*’ 0.05; ns: not significant at α = 0.05.
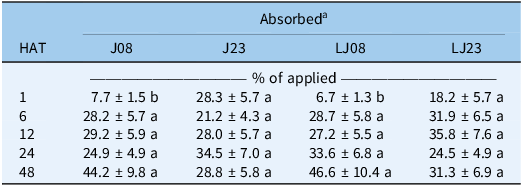
The biotype by hours after treatment (HAT) interaction significantly influenced [14C]glyphosate absorption expressed as percent of applied (P < 0.0001), and mean comparisons are presented in Table 6. At 1 HAT, resistant biotypes J23 and LJ23 absorbed more glyphosate (28.3% and 18.2%, respectively) than susceptible biotypes J08 and LJ08 (7.7% and 6.7%). By 6 HAT, absorption values converged among biotypes (21% to 32%) and continued to increase through 48 HAT, reaching 28% to 47% of applied glyphosate (Table 6).
Means (± SE) of [14C]glyphosate absorbed (% of applied) in Amaranthus palmeri biotypes collected in Tift County, GA, USA, harvested at 1, 6, 12, 24, and 48 h after treatment (HAT)
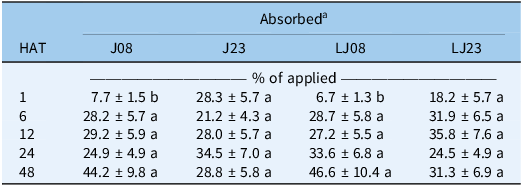
Table 6 Long description
A table with five rows and five columns showing the percentage of glyphosate absorbed by different biotypes of Amaranthus palmeri at various hours after treatment (HAT). The columns are labeled with HAT values: 1, 6, 12, 24, and 48. The rows are labeled with biotype codes: J08, J23, LJ08, and LJ23. Each cell contains the mean percentage of glyphosate absorbed along with the standard error. Row 1: J08, 7.7 ± 1.5; J23, 28.3 ± 5.7; LJ08, 6.7 ± 1.3; LJ23, 18.2 ± 5.7. Row 2: J08, 28.2 ± 5.7; J23, 21.2 ± 4.3; LJ08, 28.7 ± 5.8; LJ23, 31.9 ± 6.5. Row 3: J08, 29.2 ± 5.9; J23, 28.0 ± 5.7; LJ08, 27.2 ± 5.5; LJ23, 35.8 ± 7.6. Row 4: J08, 24.9 ± 4.9; J23, 34.5 ± 7.0; LJ08, 33.6 ± 6.8; LJ23, 24.5 ± 4.9. Row 5: J08, 44.2 ± 9.8; J23, 28.8 ± 5.8; LJ08, 46.6 ± 10.4; LJ23, 31.3 ± 6.9.
a J, Jones field; LJ, Little Jones field. Biotypes were collected in 2008 (J08, LJ08) and 2023 (J23, LJ23). Means followed by the same letter within each harvest time (row) do not differ significantly according to Tukey’s honest significant difference (HSD) test at α = 0.05.
To quantify differences in absorption kinetics among biotypes, the time required to reach 95% of maximum absorption (A 95) was estimated from nonlinear time-course models. A 95 values differed markedly among populations and between collection years. Biotypes collected in 2008 required more time to approach near maximum absorption, with estimated A 95 values of 10.7 h for J08 and 20.1 h for LJ08. In contrast, biotypes collected in 2023 reached near maximum absorption much earlier, with estimated A 95 values of 0.30 h for J23 and 3.3 h for LJ23. Although absorption levels at later evaluation times were broadly similar among biotypes, A 95 indicated that recently collected populations achieved near maximum uptake substantially earlier than older populations.
Overall, absorption increased throughout the sampling period, and no clear plateau was observed within 48 HAT. These results suggest that temporal differences in uptake kinetics, rather than differences in total absorption measured at later time points, may contribute to variation in glyphosate response among biotypes. Similar patterns have been reported in previous studies in which differences in absorption were most apparent early after treatment and diminished at later time points. Early uptake has been shown to vary among species, formulations, and biotypes within the first few hours after application, even when total absorption converged at later sampling times (Belles et al. Reference Belles, Shaner, Westra and Brunk2006; Kniss et al. Reference Kniss, Vassios, Nissen and Ritz2011; Riar et al. Reference Riar, Norsworthy, Johnson, Scott and Bagavathiannan2011; Whitaker et al. Reference Whitaker, Burton, York, Jordan and Chandi2013). Rapid initial uptake has also been associated with greater delivery of glyphosate to active sinks and increased biological activity, emphasizing the importance of uptake rate when interpreting glyphosate efficacy and resistance. Monquero et al. (Reference Monquero, Christoffoleti and Osuna2004) reported that more than 90% of applied glyphosate was absorbed within 72 h in smooth pigweed (Amaranthus hybridus L.) with approximately 25% translocated. Grey and Shilling (Reference Grey and Shilling2018) also observed increased glyphosate absorption over time in both resistant and susceptible A. palmeri biotypes, with differences most evident at earlier evaluation times. In barnyardgrass [Echinochloa crus-galli (L.) P. Beauv.], absorption occurred primarily within the first 2 d after treatment before reaching a plateau, with substantial translocation to growing tissues by 72 h (Kirkwood et al. Reference Kirkwood, Hetherington, Reynolds and Marshall2000). Together, these findings support the relevance of absorption kinetics when interpreting differences in glyphosate susceptibility among weed biotypes.
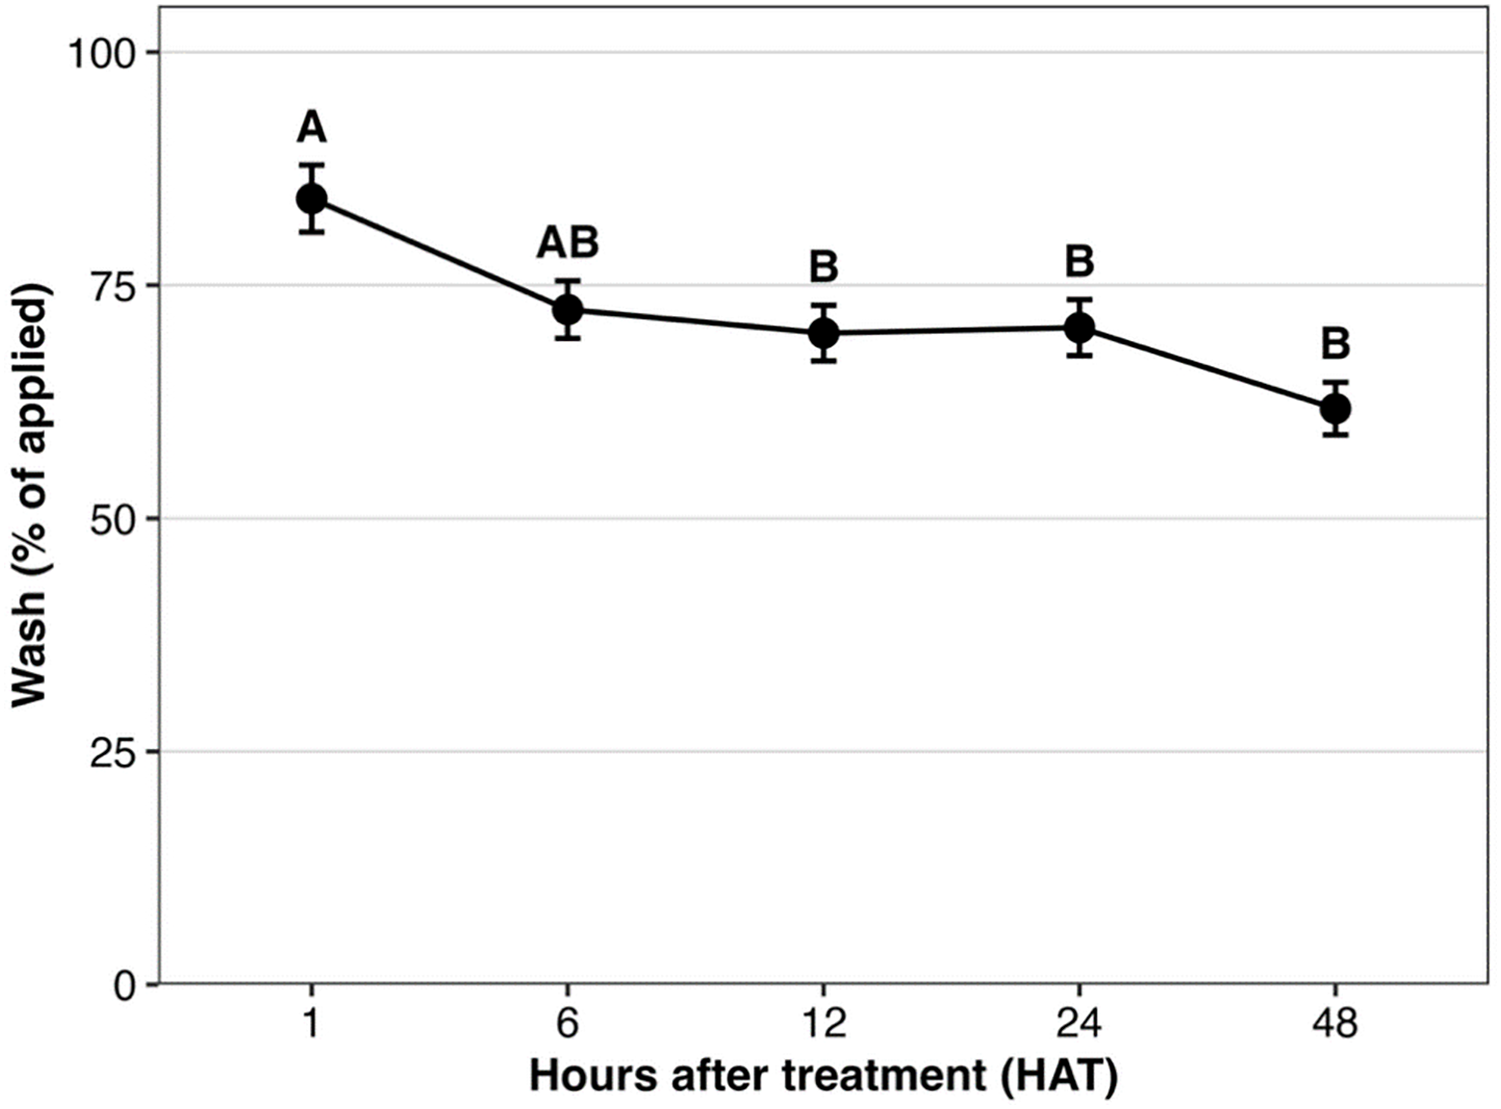
The decline in glyphosate recovered in the leaf wash over time (Table 5; Figure 2) further supports progressive absorption following application. At 1 HAT, the highest wash recovery indicated that a large portion of glyphosate remained unabsorbed and could be removed. Wash recovery decreased markedly thereafter, consistent with increasing uptake. From 12 HAT onward, wash recovery tended to stabilize, suggesting that most glyphosate had been absorbed or that the remaining fraction was not readily removable. These results reinforce the importance of the first few hours after application for effective uptake, and they indicate that rainfall during this period could reduce efficacy by removing a substantial portion of herbicide before absorption.
Mean values ± SEs over hours after treatment (HAT) for the wash fraction (% of applied [14C]glyphosate) in Amaranthus palmeri biotypes collected in Tift County, GA, USA. Means followed by the same letter are not significantly different from each other, according to Tukey’s honest significant difference (HSD) test at α = 0.05.
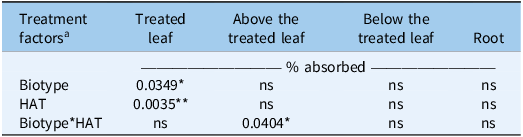
For retention in the treated leaf, both biotype (P = 0.0349) and HAT (P = 0.0035) had significant main effects (Table 7), indicating that retention differed among biotypes and changed over time. For the tissue above the treated leaf, only the biotype by HAT interaction was significant (P = 0.0404), suggesting that translocation to this region differed among biotypes at specific harvest times. No significant effects were detected for distribution below the treated leaf or in the roots.
ANOVA results for the distribution of absorbed [14C]glyphosate (% absorbed) in the treated leaf, above the treated leaf, below the treated leaf, and roots of Amaranthus palmeri biotypes collected in Tift County, GA, USA
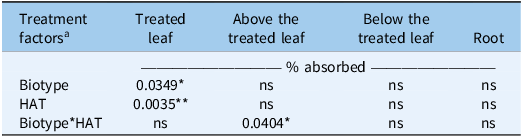
Table 7 Long description
A table comparing the distribution of absorbed glyphosate in different parts of Amaranthus palmeri biotypes. The table has four rows and five columns. The columns are labeled Treatment factors, Treated leaf, Above the treated leaf, Below the treated leaf, and Root. The rows are labeled Biotype, HAT, and Biotype*HAT. Row 1: Biotype, 0.0349*, ns, ns, ns. Row 2: HAT, 0.0035**, ns, ns, ns. Row 3: Biotype*HAT, ns, 0.0404*, ns, ns.
a HAT, hours after treatment.
Signif. codes: ‘**’ 0.01; ‘*’ 0.05; ns: not significant at α = 0.05.
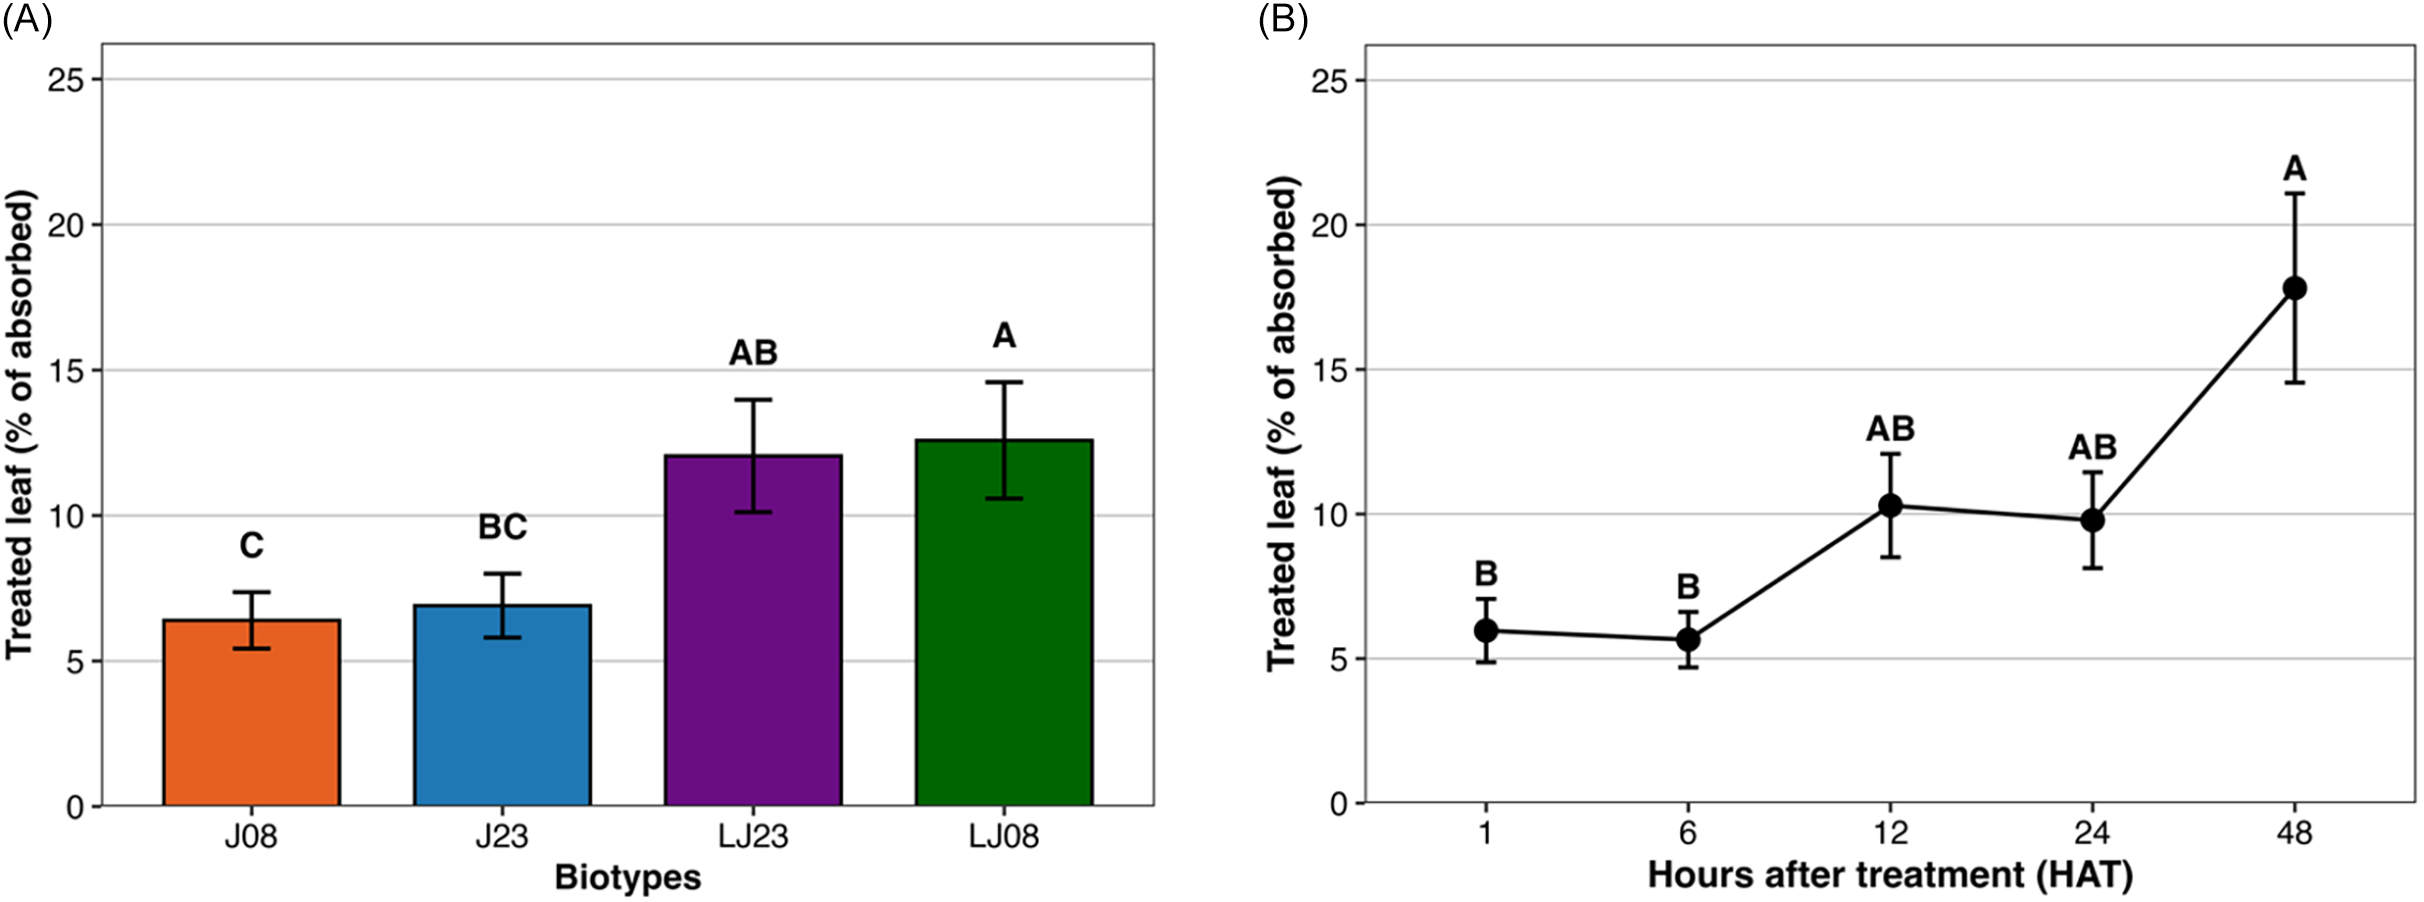
When summarized across harvest times, LJ08 retained the greatest proportion of absorbed glyphosate in the treated leaf, approximately 13% to 14%, which was greater than retention in J08 and J23 (P < 0.05) (Figure 3A). LJ23 was intermediate at approximately 10% to 11% and did not differ from LJ08 or J23. J08 and J23 retained the lowest percentages in the treated leaf, approximately 5% to 7%, and did not differ from each other.
Mean effects of biotype and harvest time on [14C]glyphosate absorption in Amaranthus palmeri collected in Tift County, GA, USA. (A) The proportion of absorbed [14C]glyphosate retained in the treated leaf (% of absorbed), averaged across harvest times, for biotypes collected from the Jones field in 2008 (J08) and 2023 (J23) and the Little Jones field in 2008 (LJ08) and 2023 (LJ23). (B) The proportion of absorbed [14C]glyphosate retained in the treated leaf as a function of hours after treatment (HAT). Plants were destructively sampled at each harvest time. Means followed by the same letter do not differ significantly according to Tukey’s honest significant difference (HSD) test at α = 0.05.
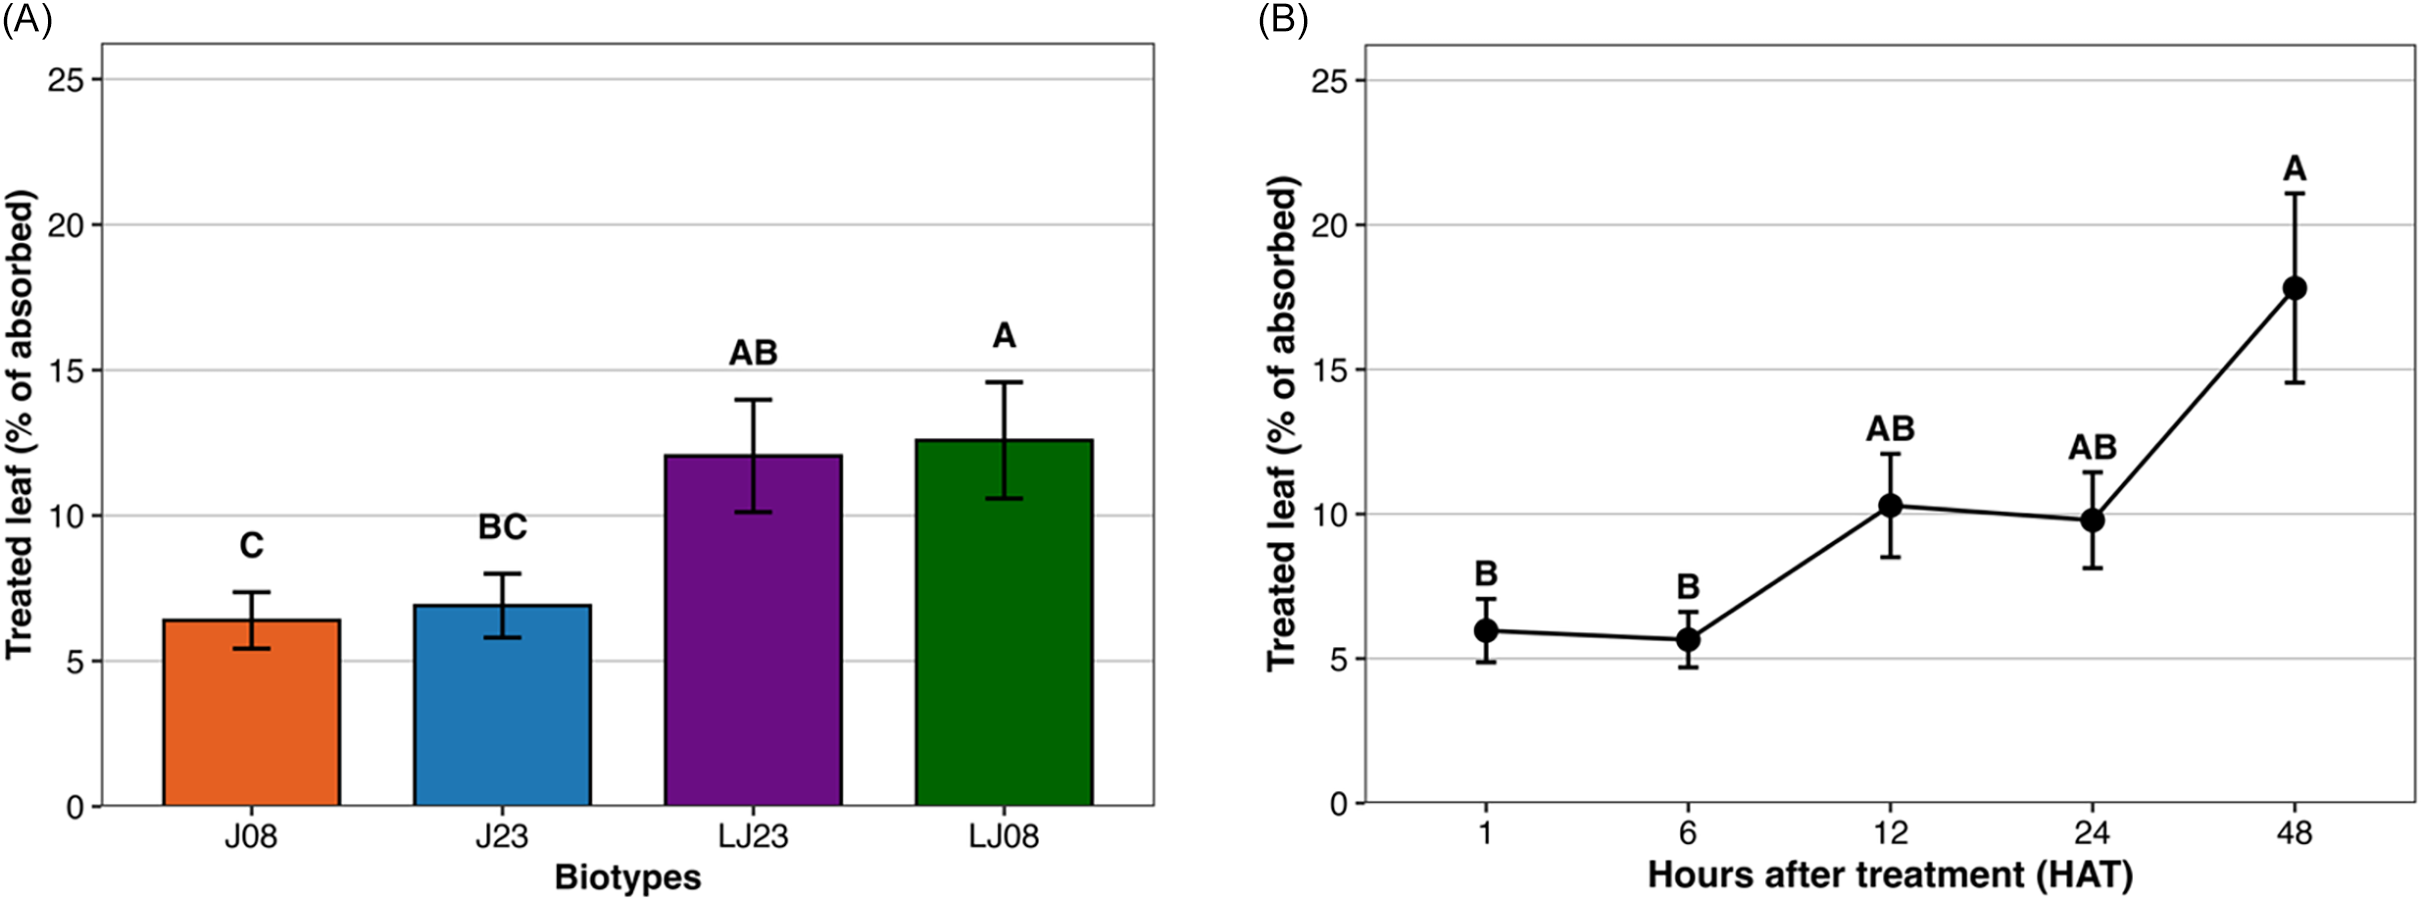
Absorption expressed as percent of absorbed herbicide increased over time (Figure 3B). At 1 and 6 HAT, values were low at approximately 5% to 6%. Absorption increased to approximately 9% to 11% by 12 and 24 HAT, and was greatest at 48 HAT at approximately 18% to 20% (P < 0.05). These results indicate that absorption progressed gradually and increased most strongly after 6 HAT, suggesting that glyphosate efficacy may be influenced by uptake rate over time as well as biotype-specific variation.
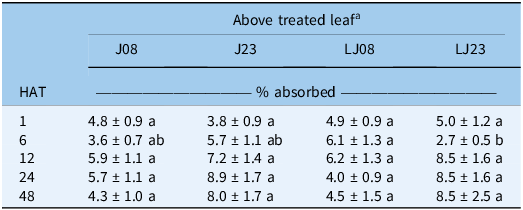
Translocation above the treated leaf was low at 1 HAT, ranging from 3.8% to 5.0% of absorbed glyphosate, with no differences among biotypes (Table 8). At 6 HAT, LJ08 exhibited greater translocation to tissue above the treated leaf than LJ23, with values of 6.1% and 2.7%, respectively (P = 0.0404). No differences were detected at 12 HAT or later. Thus, translocation differences were limited to an early harvest time and were not sustained across the evaluation period. Grey and Shilling (Reference Grey and Shilling2018) reported greater translocation to tissue above the treated leaf at 48 HAT in a resistant biotype compared with a susceptible biotype, whereas differences in the present study were restricted to 6 HAT. Overall, most radioactivity was recovered in the wash, and the absorbed fraction was subsequently distributed within the plant.
Means (±SE) of [14C]glyphosate translocated above the treated leaf (% of absorbed) in Amaranthus palmeri biotypes, collected in Tift County, GA, USA, harvested at 1, 6, 12, 24, and 48 h after treatment (HAT)
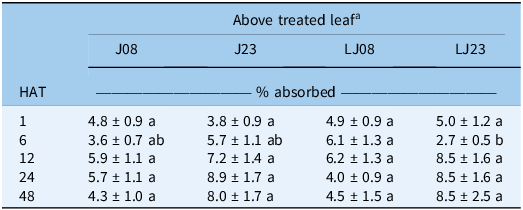
Table 8 Long description
The table presents the percentage of absorbed glyphosate translocated above the treated leaf in different biotypes of Amaranthus palmeri at various times after treatment. The table has 5 rows and 5 columns. The columns are labeled as J08, J23, LJ08, and LJ23. The rows are labeled as 1, 6, 12, 24, and 48 HAT. The values in the table are as follows: Row 1: J08 4.8 ± 0.9 a, J23 3.8 ± 0.9 a, LJ08 4.9 ± 0.9 a, LJ23 5.0 ± 1.2 a. Row 2: J08 3.6 ± 0.7 ab, J23 5.7 ± 1.1 ab, LJ08 6.1 ± 1.3 a, LJ23 2.7 ± 0.5 b. Row 3: J08 5.9 ± 1.1 a, J23 7.2 ± 1.4 a, LJ08 6.2 ± 1.3 a, LJ23 8.5 ± 1.6 a. Row 4: J08 5.7 ± 1.1 a, J23 8.9 ± 1.7 a, LJ08 4.0 ± 0.9 a, LJ23 8.5 ± 1.6 a. Row 5: J08 4.3 ± 1.0 a, J23 8.0 ± 1.7 a, LJ08 4.5 ± 1.5 a, LJ23 8.5 ± 2.5 a.
a J, Jones field; LJ, Little Jones field. Biotypes were collected in 2008 (J08, LJ08) and 2023 (J23, LJ23). Means followed by the same letter within each harvest time do not differ significantly according to Tukey’s honest significant difference (HSD) test at α = 0.05.
This comparison of A. palmeri biotypes collected 15 yr apart from two Georgia fields managed under similar production practices indicates a temporal shift in glyphosate response across both locations. Populations collected in 2023 exhibited higher ED50 values and reduced shikimic acid accumulation compared with populations collected in 2008, indicating decreased sensitivity to glyphosate over time. Although differences in total [14C]glyphosate absorption at later evaluation times were limited and translocation patterns were largely similar, populations collected in 2023 exhibited substantially faster uptake kinetics, as reflected by shorter A 95 values. Together, these results indicate that changes in glyphosate response between collection periods are associated with altered dose requirements and physiological response to EPSPS inhibition, along with shifts in the timing of herbicide uptake. Continued evaluation of glyphosate response dynamics in Georgia A. palmeri populations remains important.
Acknowledgements
We thank the late Ted Webster (in memoriam) and Lynn Sosnoskie for their previous work in collecting and preserving the Amaranthus palmeri seed samples used in this study. We also gratefully acknowledge Sidney Cromer and Haigen Walker for their invaluable assistance in conducting the experiments.
Funding statement
This research received no specific grant from any funding agency or the commercial or not-for-profit sectors.
Competing interests
The authors declare no conflicts of interest.
 =d1+exp{b[log(x)−log(e)]}

 Open access

