


1. Introduction
Flow-induced vibrations (FIV) of cylindrical structures have been investigated over the past decades on account of scientific and engineering significance. Applications are ubiquitous in engineering and nature, such as heat exchanger tubes, marine risers, offshore platforms, skyscrapers, chemical reaction towers, crops and trees under wind or current. The circular cross-sectional structures are the most commonly encountered and, thus, draw the attention of academicians, researchers and engineers. Owing to the rotational symmetry of a circular cylinder, vortex-induced vibration (VIV) turns into the only possible response. A large number of fundamental studies on the VIV of a circular cylinder have provided a comprehensive understanding of this crucial fluid–structure interaction (FSI) problem. Readers can refer to reviews by Sarpkaya (Reference Sarpkaya2004), Williamson & Govardhan (Reference Williamson and Govardhan2004), Bearman (Reference Bearman1984, Reference Bearman2011), Wu, Ge & Hong (Reference Wu, Ge and Hong2012) and Ali et al. (Reference Ali, Islam, Janajreh, Fatt and Alam2021). Nonetheless, based on Derakhshandeh & Alam's (Reference Derakhshandeh and Alam2019) classification of the cross-section shapes, in addition to the continuous and finite curvature shape (e.g. circular cylinder), there are two other shapes. One is the sharp-edged shape of infinitely large curvature, such as a triangular or square prism, where the flow separation is stationary, and the other is a combination of the continuous and finite curvature and the infinitely large curvature, such as a D-section prism, where the flow separation is fixed or moving along a segment of the curved surface (Alam, Zhou & Wang Reference Alam, Zhou and Wang2011; Alam, Abdelhamid & Sohankar Reference Alam, Abdelhamid and Sohankar2020; Abdelhamid, Alam & Islam Reference Abdelhamid, Alam and Islam2021; Alam Reference Alam2022a). A brief review of FIV of an elastically mounted prism, especially cross-flow vibration differences caused by the streamwise freedom, is given to provide preliminary knowledge.
Vortex-induced vibration of a circular cylinder is a mass-damping-dependent response (Williamson & Govardhan Reference Williamson and Govardhan2004; Alam Reference Alam2021). Depending on mass-damping values, the VIV response can be two- (i.e. initial and lower branches) or three-branched (i.e. initial, upper and lower branches) (Williamson & Govardhan Reference Williamson and Govardhan2004). In the initial branch the vibration amplitude increases sharply with increasing reduced velocity ( $U^*$ = $U_\infty /f_nD$, where $U_\infty$ is the incoming flow velocity, $f_n$ is the natural frequency of the cylinder or prism and $D$ is the cylinder diameter or prism width). In the upper branch the amplitude is largest and the vortex shedding frequency is close to $f_n$, especially when the mass ratio $m^*$ (= $m/m_f$) is large, where $m$ and $m_f$ are the cylinder mass and displaced fluid mass, respectively. However, in the lower branch the amplitude is significantly dependent on the mass-damping value (Khalak & Williamson Reference Khalak and Williamson1997). At a high mass-damping value, the amplitude rapidly decreases with increasing $U^*$ while at low mass-damping it maintains a constant value for a short $U^*$ range before a drop (Feng Reference Feng1968; Khalak & Williamson Reference Khalak and Williamson1997). The wake features a 2S mode in the initial branch and a 2P mode in the upper and lower branches (Brika & Laneville Reference Brika and Laneville1993; Khalak & Williamson Reference Khalak and Williamson1999; Govardhan & Williamson Reference Govardhan and Williamson2000, Reference Govardhan and Williamson2006). Here, S and P denote single vortex and paired vortex, respectively. For a circular cylinder, the degree of freedom of the vibrations in the streamwise direction has an insignificant influence on cross-flow vibrations, especially at high $m^*$ values (Moe & Wu Reference Moe and Wu1990; Sarpkaya Reference Sarpkaya1995). Jauvtis & Williamson (Reference Jauvtis and Williamson2003, Reference Jauvtis and Williamson2004) carried out a series of water tunnel experiments with the same natural frequency in two directions and noticed evident influences only when $m^*<$ 6.0. A new branch, named ‘super-upper’ branch, is observed for the first time, where the transverse amplitude reaches 1.5 $D$. The wake changes into a 2T mode, with T denoting triple vortices.
For a non-circular prism, symmetry breaking of the cross-section and stationary separation points may radically alter the FIV response. Nemes et al. (Reference Nemes, Zhao, Lo Jacono and Sheridan2012) at  ${Re} = 2.5\times 10^3\unicode{x2013}1.25\times 10^4$, $m^* = 2.2$ and $\zeta = 2.95\times 10^{-3}$ found that as the angle of attack ( $\alpha$) increases, a transversely oscillating square prism undergoes galloping ( $\alpha = 0^{\circ }\unicode{x2013}7.5^{\circ }$), a mixed mode ( $\alpha = 10^{\circ }\unicode{x2013}22.5^{\circ }$) and VIV ( $\alpha = 25^{\circ }\unicode{x2013}45^{\circ }$) successively. Here, $\alpha = 0^{\circ }$ represents the configuration that one side of the square prism is perpendicular to the incoming flow. Cui et al. (Reference Cui, Zhao, Teng and Cheng2015) at ${Re} = 2.2\times 10^4$ and $m^* = 2.4$ studied the transverse response of a rectangular prism with aspect ratios of 0.5 and 1.0 (square). They found that for the aspect ratio of 1.0, galloping and VIV occur at $\alpha = 0^{\circ }$ and $22.5^{\circ }\unicode{x2013}45^{\circ }$, respectively. On the other hand, for the aspect ratio of 0.5, a combined VIV and galloping response develops at $\alpha = 0^{\circ }$, and pure galloping emerges at $\alpha = 90^{\circ }$. Carlson, Currier & Modarres-Sadeghi (Reference Carlson, Currier and Modarres-Sadeghi2021) at ${Re} = 10^3\unicode{x2013}4.3\times 10^3$ and $m^* = 4.52$ experimentally studied the two-degrees-of-freedom (2DOF) FIV of a square prism with a streamwise-to-transverse natural frequency ratio of 2. Three different responses are recognized: VIV at $\alpha = 20^{\circ }\unicode{x2013}45^{\circ }$ where the lock-in narrows as $\alpha$ decreases; galloping at $\alpha = 0^{\circ }\unicode{x2013}5^{\circ }$ where the transverse amplitude increases gradually with increasing $U^*$ and the streamwise amplitude is relatively small, albeit increasing with $U^*$; and a transition response at $\alpha = 10^{\circ }\unicode{x2013}15^{\circ }$ where both VIV and galloping responses occur with or without a gap lying between them. Zhao, Cheng & Zhou (Reference Zhao, Cheng and Zhou2013) numerically studied 2DOF vibrations of a square prism at ${Re} = 100$ and $m^* = 3.0$. As a result of low ${Re}$ and $m^*$, only the VIV response is detected for all $\alpha$ ( $= 0^{\circ }\unicode{x2013}45^{\circ }$) values (Joly, Etienne & Pelletier Reference Joly, Etienne and Pelletier2012; Sen & Mittal Reference Sen and Mittal2011, Reference Sen and Mittal2015; Mao et al. Reference Mao, Zhang, Zou and Ding2018; Sourav & Sen Reference Sourav and Sen2019, Reference Sourav and Sen2020; Tang & Zhou Reference Tang and Zhou2020). At a higher ${Re}$ or $m^*$, combined VIV and galloping responses were reported by He, Zhou & Bao (Reference He, Zhou and Bao2012), Bhatt & Alam (Reference Bhatt and Alam2018) and Li et al. (Reference Li, Lyu, Kou and Zhang2019), irrespective of degree of freedom (DOF). Zhao (Reference Zhao2015) at ${Re} = 200$ and $m^*$ = 10 observed that both VIV and galloping responses can appear in 2DOF vibrations of a rectangular prism with aspect ratios of $0.3\unicode{x2013}1.25$.
Seyed-Aghazadeh, Carlson & Modarres-Sadeghi (Reference Seyed-Aghazadeh, Carlson and Modarres-Sadeghi2017) experimentally studied transverse vibrations of an equilateral triangular prism at  ${Re} = 490\unicode{x2013}2700$. Three distinct responses, i.e. no vibration at $\alpha < 25^{\circ }$, combined VIV and galloping at $\alpha = 30^{\circ }\unicode{x2013}35^{\circ }$ and galloping at $\alpha > 35^{\circ }$ are identified. At ${Re} = 200$, Chen et al. (Reference Chen, Ji, Xu, Zhang and Wei2020a) numerically observed three similar responses, i.e. VIV at $\alpha = 0^{\circ }\unicode{x2013}25^{\circ }$, combined VIV and galloping at $\alpha = 30^{\circ }\unicode{x2013}40^{\circ }$ and galloping at $\alpha = 45^{\circ }\unicode{x2013}60^{\circ }$. Furthermore, they compared the responses in the one-degree-of-freedom (1DOF) (only the transverse direction) and 2DOF cases and noted that the streamwise freedom has a significant influence on the vibration competition in the combined regime.
Studies on the FIV of a D-section prism are scarce. Based on the investigation methods employed in the literature, we may divide the studies into three clusters. In the first cluster, wind tunnel experiments were done with large  $m^*$ values, of the order of $10^2$ (Lanchester Reference Lanchester1907; Brooks Reference Brooks1960; Parkinson Reference Parkinson1963; Feng Reference Feng1968; Novak & Tanaka Reference Novak and Tanaka1974; Weaver & Veljkovic Reference Weaver and Veljkovic2005; Sirohi & Mahadik 2012). These studies focused on configurations of $\alpha = 0^{\circ }$ (reversed D-section) and $180^{\circ }$ (D-section). However, as a result of the higher $m^*$, no vibration is observed for a reversed D-section prism while narrow-ranged VIV or galloping occurs for a D-section prism if initial disturbances are added. In the second cluster, water tunnel experiments were performed with small $m^*$ values, of the order of 1 or 10 (Zhao, Hourigan & Thompson Reference Zhao, Hourigan and Thompson2018; Chen et al. Reference Chen, Zhao, Ji, Srinil and Song2021). Zhao et al. (Reference Zhao, Hourigan and Thompson2018) experimentally investigated the transverse vibrations of a D-section prism in a water flume at $m^* = 6.0$ and ${Re} = 1080\unicode{x2013}9000$. They found that at $\alpha = 180^{\circ }$, galloping occurs without initial disturbances, while VIV dominates at $\alpha = 0^{\circ }$, comprising the upper and lower branches, similarly to a circular cylinder case. Recently, Chen et al. (Reference Chen, Zhao, Ji, Srinil and Song2021) experimentally studied the transverse responses of a D-section prism at $m^*= 11.35$ and $\alpha = 0^{\circ }\unicode{x2013}180^{\circ }$. Seven types of responses are reported: typical VIV, first transition, small-amplitude VIV, combined VIV and galloping, second transition and pure galloping. In the third cluster, direct numerical simulations were used (Kumar et al. Reference Kumar, Garg, Sharma and Bhardwaj2020; Chen et al. Reference Chen, Ji, Alam, Xu, An and Tong2022b; Sharma, Garg & Bhardwaj Reference Sharma, Garg and Bhardwaj2022). Kumar et al. (Reference Kumar, Garg, Sharma and Bhardwaj2020) and Sharma et al. (Reference Sharma, Garg and Bhardwaj2022) examined vibrations of a D-section prism with $m^* = 5.0\unicode{x2013}12.7$ and ${Re} = 100$ at $\alpha = 0^{\circ }$ and $180^{\circ }$. They observed VIV and galloping at $\alpha = 0^{\circ }$ and $180^{\circ }$, respectively. Chen et al. (Reference Chen, Ji, Alam, Xu, An and Tong2022b) investigated the transverse response of a D-section prism with $\alpha = 0^{\circ }\unicode{x2013}180^{\circ }$. After a careful examination, they identified six different types of responses, including typical VIV, extended VIV, combined VIV and galloping, narrowed VIV, transition response and galloping. These studies showed that a D-section prism undergoes several response patterns because of the prism's symmetry breaking and combinations of stationary and non-stationary separation points.
The above review confirms the disparities in cross-flow vibrations owing to the addition of streamwise freedom. Along with meticulous numerical simulations of a D-section prism with 2DOF, the impacts of adding the streamwise freedom are discussed in the present study. Following the work of Chen et al. (Reference Chen, Ji, Alam, Xu, An and Tong2022b), we home in on three critical issues: (1) possible types of responses, (2) spectral contents of each response and (3) flow physics of several critical response behaviours, which offer a comprehensive understanding of 2DOF FIV of a D-section prism. Furthermore, we provide a summary of possible FIV responses at different parameter combinations and explain the roles of the shear layer reattachment and separation point on identified responses. The remainder of this paper is structured as follows. In § 2 the adopted numerical methodology and validation cases are presented. In § 3 the vibration and spectral details of each response are provided. In § 4 the wake modes in the  $U^*\unicode{x2013}\alpha$ plane and flow physics for special behaviours are given. In § 5 statistics and spectral features of the fluid forces and phase lags between the lift and transverse displacement are displayed. In § 6 classifications of possible FIV responses of a D-section prism at various conditions and explanations of how the identified responses occur under the impacts of shear layer reattachment and separation point movement are discussed. In § 7 the main findings of this paper are summarized.
2. Numerical methodology and validations
2.1. Numerical methodology
The FSI is simulated using the immersed boundary (IB) method that was first introduced by Peskin (Reference Peskin1972) to simulate the blood flow around the flexible leaflet of a human heart. In the framework of the IB method, the flow governing equations are discretized on a fixed Cartesian grid, which generally does not conform to the geometry of moving solids. As a result, the boundary conditions on the fluid–cylinder interface, manifesting the interaction between the fluid and the structure, cannot be imposed directly. Instead, an extra body force is added to the momentum equation using interpolation and distribution functions to take such interaction into account. Compared with conventional numerical methods, the IB method has significant advantages, particularly in FSI simulations with topological changes. Another merit of the IB method lies in its parameterized and fast implementation for a large number of simulations with different geometric configurations compared with conventional methods using body-conformal grids.
The dynamics of the elastically supported D-section prism is simplified as a mass-damper-spring system. In this study the prism is free to oscillate in both the streamwise and transverse directions and the governing equations of prism motion are
 \begin{gather} \ddot{X}+4 {\rm \pi}F_n \zeta \dot{X}+(2 {\rm \pi}F_n)^2 X=\frac{4 C_D}{{\rm \pi} m^*}, \end{gather}
 \begin{gather} \ddot{Y}+4 {\rm \pi}F_n \zeta \dot{Y}+(2 {\rm \pi}F_n)^2 Y=\frac{4 C_L}{{\rm \pi} m^*}, \end{gather}
where  $m^*$ ( $= 8m/{\rm \pi} \rho D^2$, $m$ is the prism mass per unit length, $\rho$ is the fluid density and $D$ is the prism diameter) is the mass ratio, $\zeta$ is the structural damping ratio, $F_n$ (= $f_nD$/ $U_\infty$, $f_n$ is the natural frequency of the prism and $U_\infty$ is the incoming flow velocity) is the normalized natural frequency of the prism, $X$ (= $x/D$, $x$ is the streamwise displacement) and $Y$ (= $y/D$, $y$ is the transverse displacement) are the normalized streamwise and transverse displacements, and $C_D$ ( $= 2F_D/\rho U_\infty ^2 D$, $F_D$ is the drag force) and $C_L$ ( $= 2F_L/\rho U_\infty ^2 D$, $F_L$ is the lift force) are the dimensionless drag and lift coefficients, respectively. The governing equations of prism motion are based on Newton's second law and solved by applying the standard Newmark- $\beta$ method – a method of numerical integration used to solve differential equations, which is widely used in numerical evaluations of structural responses. More details of the present methodology can be found in our previous works (Ji, Munjiza & Williams Reference Ji, Munjiza and Williams2012; Chen et al. Reference Chen, Ji, Xu, Liu and Campbell2015, Reference Chen, Ji, Xu and Williams2019, Reference Chen, Ji, Alam, Xu, An and Tong2022b).
The streamwise and transverse lengths of the computational domain are 100 $D$, as shown in figure 1(a). The prism is placed at the centre of the computational domain. The domain is discretized by a non-uniform Cartesian grid with the largest resolution of $2304\times 1536$. To improve the accuracy of numerical results, a rectangular region of $30D\times 20D$, enclosing the prism, is meshed uniformly, with a non-dimensional grid spacing of 1/64 in both directions. A stretched mesh is adopted out of the region to keep the total grid number within an affordable range. The same mesh configuration was adopted in our previous simulations (Chen et al. Reference Chen, Ji, Xu, Liu and Campbell2015; Chen et al. 2018; Chen et al. Reference Chen, Ji, Alam, Williams and Xu2020b, Reference Chen, Ji, Alam, Xu, An and Tong2022b). A Dirichlet-type boundary and a Neumann-type boundary are adopted at the inflow and outflow, respectively. The top and bottom boundaries are set as free-slip boundaries. The number of IB points for the prism is selected as 506 to ensure at least one IB point in each grid cell.
(a) Computation domain for the 2DOF FIV of a D-section prism and (b) a sketch for the angle of attack ( $\alpha$).

The angle of attack ( $\alpha$) is varied from $0^{\circ }$ to $180^{\circ }$, where $\alpha = 0^{\circ }$ and $180^{\circ }$ correspond to the configurations with the flat surface pointing downstream and upstream, respectively (figure 1b). The reduced velocity $U^*$ is varied from 2.0 to 20.0, with $m^* = 2.0$ and $\zeta = 0$. To keep the effective Reynolds number constant for $\alpha = 0^{\circ }\unicode{x2013}180^{\circ }$, we define the Reynolds number as ${Re} = U_\infty D_e/\nu = 100$, where effective diameter $D_e=0.5(1+|\cos \alpha |) D$ and $\nu$ is the fluid kinematic viscosity. The intervals of $\alpha$ and $U^*$ are as small as $\Delta \alpha =5^{\circ }$ and $\Delta U^{*}=0.1$, which lead to more than 1000 simulation cases.
The  $\bar {C}_{D}$ or $\bar {C}_{L}$ and $C_{D}^{\prime }$ or $C_{L}^{\prime }$ are the time-mean and root-mean-square (r.m.s.) values of the corresponding forces, respectively. The non-dimensional streamwise and transverse amplitudes are defined as $A_x^{*}=\sqrt {2} y_{rms} / D$ and $A_y^{*} =\sqrt {2} y_{rms} / D$, where $x_{rms}$ and $y_{rms}$ are the r.m.s. values of the streamwise and transverse displacements, respectively. The lift, drag and vibration frequencies are obtained through the fast Fourier transform, and the phase lag between the lift and displacement is obtained through the Hilbert transform.
2.2. Convergence analysis and validation cases
Both the convergence analysis and validation cases for the present numerical methodology have been presented in Chen et al. (Reference Chen, Ji, Alam, Xu, An and Tong2022b) for the FIV of a D-section prism. For the sake of conciseness, in this paper we check only the non-dimensional time step ( $\Delta t U_{\infty }/ D$) for the 2DOF FIV of a D-section prism. As shown in table 1, the variations in the fluid forces, vibration amplitudes and frequencies are insignificant when the non-dimensional time step $\Delta t U_{\infty }/ D$ is reduced from 0.004 to 0.002. It suggests that $\Delta t U_{\infty }/ D$ = 0.004 is enough for the present simulations.
Comparison of the results of 2DOF FIV of a D-section prism at different non-dimensional time steps. Here,  $F_{x}$ ( $= f_{x} D/U_{\infty }$) and $F_{y}$ ( $= f_{y} D/U_{\infty }$) are the normalized vibration frequencies in the streamwise and transverse directions, respectively.

3. Structural responses
The vibration responses of a D-section prism oscillating in streamwise and transverse directions are presented for  $\alpha = 0^{\circ }\unicode{x2013}180^{\circ }$ and $U^* = 2\unicode{x2013}20$. Based on the characteristics of $A_x^{*}$, $A_y^{*}$, $f_x^{*} (=f_x/f_n)$ and $f_y^{*}(=f_y/f_n)$, vibration responses are classified into nine regimes: i, typical VIV at $\alpha = 0^{\circ }\unicode{x2013}30^{\circ }$; ii, hysteretic VIV at $\alpha = 35^{\circ }\unicode{x2013}45^{\circ }$; iii, extended VIV at $\alpha = 50^{\circ }\unicode{x2013}55^{\circ }$; iv, first transition from extended VIV to dual galloping at $\alpha = 60^{\circ }\unicode{x2013}65^{\circ }$; v, dual galloping at $\alpha = 70^{\circ }$; vi, combined VIV and dual galloping at $\alpha = 75^{\circ }\unicode{x2013}80^{\circ }$; vii, narrowed VIV at $\alpha = 85^{\circ }\unicode{x2013}145^{\circ }$; viii, second transition from narrowed VIV to transverse-only galloping at $\alpha = 150^{\circ }\unicode{x2013}160^{\circ }$ and ix, transverse-only galloping at $\alpha = 165^{\circ }\unicode{x2013}180^{\circ }$. The vibration and frequency responses for each regime are presented in figure 2. According to the underlying physics, we classify these regimes into three groups: the first is VIV, including regimes i–iii and vii, which is excited by the lock-in (or synchronization) of the prism vibration and vortex shedding (Williamson & Govardhan Reference Williamson and Govardhan2004); the second is galloping (or combined galloping), including regimes v, vi and ix, which is a quasi-steady phenomenon and driven by the mean fluid forces (Païdoussis, Price & De Langre Reference Païdoussis, Price and De Langre2010); and the third is the galloping-like response (or large-amplitude vibration), including regimes iv and viii, in which the synchronization between the prism large-amplitude low-frequency oscillation and the vortex shedding formation becomes loose (Stansby & Rainey Reference Stansby and Rainey2001; Yogeswaran & Mittal Reference Yogeswaran and Mittal2011), caused by multiple vortices shedding in one vibration period. The borders of galloping-like and galloping responses are further confirmed through the quasi-steady analysis and intrinsic features of the two responses. The quasi-steady approach assumes that the instantaneous driving force on a moving body is nearly equal to the static force obtained at the instantaneous angle of flow incidence, which has been demonstrated to be a useful method to predict the transverse galloping instability (Naudascher & Rockwell Reference Naudascher and Rockwell2005; Païdoussis et al. Reference Païdoussis, Price and De Langre2010). According to the quasi-steady analysis of the D-section prism in Chen et al. (Reference Chen, Ji, Alam, Xu, An and Tong2022b), the galloping occurs at $70^{\circ } \leq \alpha \leq 85^{\circ }$ and $160^{\circ }< \alpha \leq 180^{\circ }$, which suggests that the response at $\alpha = 60^{\circ }\unicode{x2013}65^{\circ }$ and $150^{\circ }\unicode{x2013}160^{\circ }$ is not a galloping type. We further investigate the large-amplitude vibrations at $\alpha = 60^{\circ }$ and $160^{\circ }$ (not shown here). The vortex shedding frequency is two or three times the vibration frequency and the synchronization of the prism motion and fluid fluctuations disappears. Therefore, these vibrations belong to galloping-like responses. Lock-in is sometimes defined as when the vibration frequency equals the natural frequency of the prism, i.e. $f_y^{*}$ = 1.0 (Blevins Reference Blevins1990; Zhang et al. Reference Zhang, Li, Ye and Jiang2015). However, depending on the magnitude of the prism density (or mass ratio), the constant $f_y^{*}$ may be smaller or greater than 1.0 (Khalak & Williamson Reference Khalak and Williamson1997; Sarpkaya Reference Sarpkaya2004; Williamson & Govardhan Reference Williamson and Govardhan2004; Prasanth, Premchandran & Mittal Reference Prasanth, Premchandran and Mittal2011; Alam Reference Alam2022b,Reference Alamc).
Non-dimensional vibration amplitudes  $A_x^{*}$ (a) and $A_y^{*}$ (b) and vibration frequencies $f_x^{*}$ (c) and $f_y^{*}$ (d) versus reduced velocity $U^*\ (= 2{-}20)$ and angle of attack $\alpha$ ( $= 0^{\circ }\unicode{x2013}180^{\circ }$). Regimes i–ix denote typical VIV, hysteretic VIV, extended VIV, first transition, dual galloping, combined VIV and galloping, narrowed VIV, second transition and transverse-only galloping, respectively. The border between two consecutive regimes is identified with the midpoint between two adjacent simulated $\alpha$ where one regime transitions to another.

The characteristics of the responses of the three groups are discussed in the following subsections.
3.1. Group 1: VIV
In the typical VIV regime, both  $A_x^{*}$ and $A_y^{*}$ exhibit a similar behaviour to the VIV of a circular cylinder (Singh & Mittal Reference Singh and Mittal2005; Leontini, Thompson & Hourigan Reference Leontini, Thompson and Hourigan2006b; Prasanth & Mittal Reference Prasanth and Mittal2008). They first increase and then decrease mildly with increasing $U^*$ (figure 3a). Similar to that in the 2DOF VIV of a circular cylinder, $A_x^{*}$ is much smaller than $A_y^{*}$ (Jauvtis & Williamson Reference Jauvtis and Williamson2004; Bourguet Reference Bourguet2020). The maximum $A_y^{*}$ is obtained at $U^*$ = 5.0, regardless of $\alpha$. Compared with the 2DOF VIV of a circular cylinder, $A_y^{*}$ of the D-section prism is comparable for $U^* \le 7.5$ but significantly higher for $U^*> 7.5$. On the contrary, $A_x^{*}$ for $\alpha = 15^{\circ }$ and $30^{\circ }$ is relatively higher for $U^*< 8.5$, but comparable to that of a circular cylinder for $U^* \ge 8.5$. This suggests that the symmetry breaking ( $\alpha \neq 0^{\circ }$) of the D-section prism exerts distinct impacts, i.e. significantly promoting $A_x^{*}$ in the large $A_y^{*}$ region and enlarging $A_y^{*}$ for $U^*> 7.5$. The hysteretic VIV regime is characterized by the appearance of a hysteresis loop as $U^*$ increases and decreases. As shown in figure 3(c), $A_x^{*}$ and $A_y^{*}$ rapidly increase up to $U^* = 5.0\unicode{x2013}6.0$ and then slowly decrease before plunging to smaller values at $U^* = 8.0\unicode{x2013}10.0$. After the plunge, $A_x^{*}$ becomes very small and $A_y^{*}$ keeps declining slowly, being smaller at a higher $\alpha$. Before the plunge, $A_x^{*}$ and $A_y^{*}$ are higher at larger $\alpha$ but independent of $\alpha$ for $U^*\le 4.5$. In the extended VIV regime the prism vibration starts at the smallest $U^*$ examined, and the amplitudes become small after a critical $U^*$, i.e. $U^* = 13.0$ at $\alpha = 50^{\circ }$ and $U^* = 13.5$ at $\alpha = 55^{\circ }$ (figure 3e). Compared with the typical VIV, the large-amplitude vibration appears in a wider range of $U^*$. In the narrowed VIV regime, $A_x^{*}$ and $A_y^{*}$ first increase and then decrease slowly with increasing $U^*$, with significant growth as $\alpha$ increases (figure 3g). The large-amplitude vibration exists in a narrow range of $U^*$.
Dependence of non-dimensional vibration amplitudes ( $A_x^{*}$ and $A_y^{*}$) and frequencies ( $f_x^{*}$ and $f_y^{*}$) on reduced velocity $U^*$ and angle of attack $\alpha$. (a,b) Typical VIV, (c,d) hysteretic VIV, (e, f) extended VIV and (g,h) narrowed VIV. The results of the 2DOF VIV of a circular cylinder at ${Re} = 100$ are superimposed in (a,b). The open circles denote the results of the 1DOF case. The inclined dashed lines in (b,d, f,h) with the same colour as that of the streamwise amplitude represent the vortex shedding frequency ( $St$) of the corresponding stationary D-section prism. Same for figures 7 and 11.

The spectral results provide further insights into the characteristics of these VIV regimes. In the typical VIV, three different branches are recognized based on the features of  $f_x^{*}$ and $f_y^{*}$ (Khalak & Williamson Reference Khalak and Williamson1996), as shown in figure 3(b). At $2.0 \le U^*< 3.5$, $A_x^{*}$ and $A_y^{*}$ are marginal, and $f_y^{*}$ closely follows the vortex shedding frequency ( $St$) of the stationary D-section prism, indicating a desynchronization region. At $3.5 \le U^* \le 5.0$, $A_y^{*}$ increases sharply and $f_y^{*}$ remains at 0.8, signifying the initial branch. This constant $f_y^{*}$ below the $St$ line in the initial branch, known as soft lock-in, has been reported in Mittal & Kumar (Reference Mittal and Kumar1999), Singh & Mittal (Reference Singh and Mittal2005) and Prasanth et al. (Reference Prasanth, Behara, Singh, Kumar and Mittal2006). After $U^*> 5.0$, $A_x^{*}$ and $A_y^{*}$ decrease gradually, and the lower branch appears. However, unlike the circular cylinder counterpart, $f_y^{*}$ for the D-section prism linearly increases with increasing $U^*$ due to the fixed shear layer separation at the prism corners (Chen et al. Reference Chen, Ji, Alam, Xu, An and Tong2022b). Owing to the asymmetric vortex shedding (especially at larger $\alpha$), $f_x^{*}/f_y^{*}$ changes from 2 to 1 (Chen et al. Reference Chen, Ji, Alam, Xu and Zhang2022a,Reference Chen, Ji, Xu and Zhangc). In the hysteretic VIV regime the response exhibits four branches (figure 3d). At $2.0 \le U^*< 3.0$, $A_x^{*}$ and $A_y^{*}$ are relatively small, and $f_x^{*}$ and $f_y^{*}$ closely follow the $St$ line. It is, therefore, a desynchronization region. However, at $3.0 \le U^* \le 3.5$, $A_x^{*}$ and $A_y^{*}$ rapidly increase, and $f_x^{*}$ and $f_y^{*}$ remain constant around 0.6, deviating from the $St$ line. This corresponds to the initial branch. In the third region, i.e. $3.5 < U^* \le U_{p}^*$, the amplitudes are large, and $f_x^{*}$ and $f_y^{*}$ increase slowly with increasing $U^*$, deviating from the $St$ line. Here, $U_{p}^*$ is defined as the reduced velocity at which the amplitude plunges, which strongly depends on $\alpha$. Similar to that in the VIV of a circular cylinder (Prasanth & Mittal Reference Prasanth and Mittal2008; Zhang et al. Reference Zhang, Li, Ye and Jiang2015; Navrose & Mittal Reference Navrose and Mittal2016), lock-in occurs and the lower branch takes place. After $U^*> U_{p}^*$, $f_x^{*}$ and $f_y^{*}$ increase linearly, approximately following the $St$ line, which leads to the desynchronization region. Similarly, in the extended VIV regime, three different branches are recognized based on the characteristics of $f_x^{*}$ and $f_y^{*}$ (figure 3f). At small $U^*$ ( $2.0 \le U^*< 3.5$), $A_x^{*}$ and $A_y^{*}$ rapidly increase, and $f_x^{*}$ and $f_y^{*}$ closely follow the $St$ line, indicating a desynchronization region. At $3.5 \le U^*< 13.5$ for $\alpha = 50^{\circ }$ and $3.5 \le U^*< 13.0$ for $\alpha = 55^{\circ }$, $A_x^{*}$ and $A_y^{*}$ are relatively large, and $f_x^{*}$ and $f_y^{*}$ increase slowly from a value smaller than 1.0 to higher than 1.0, deviating significantly from the $St$ line. It is the lock-in region. At $U^*> 13.0\unicode{x2013}13.5$, $A_x^{*}$ and $A_y^{*}$ are small and invariant, while $f_x^{*}$ and $f_y^{*}$ increase linearly, being slightly smaller than $St$. It is thus a desynchronization region. In the narrowed VIV regime, $f_x^{*}$ and $f_y^{*}$ are identical (figure 3h). With increasing $U^*$, $f_x^{*}$ and $f_y^{*}$ linearly increase, approximately following the $St$ line, which is related to the fixed shear layer separation point on the upper side of the prism.
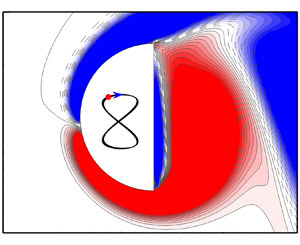
The power spectral density (PSD) functions of the displacements in these VIV regimes are shown in figure 4. In the typical and hysteretic VIV, only one frequency is observed in the transverse vibration, while both the fundamental and harmonic frequencies emerge in the streamwise vibration, with the former having a comparable amplitude to that of the latter, especially at higher  $U^*$ (figure 4a – d). As shown in figure 5(a), at $\alpha = 0^{\circ }$, the symmetric vortex shedding from the prism is maintained and a figure-‘8’ trajectory dominates the entire simulated $U^*$ range. However, at $\alpha = 15^{\circ }\unicode{x2013}30^{\circ }$, the displacement trajectories change from figure-‘8’ to figure-‘o’ as $U^*$ increases, due to the augmentation of the second harmonic component. In the hysteretic VIV, although $f_x^{*}$ and $f_y^{*}$ are identical, the trajectories of the displacements change from figure-‘o’ ( $U^* = 2.0\unicode{x2013}5.5$) to figure-‘8’ ( $U^* = 6.0\unicode{x2013}7.0$), then to figure-‘o’ ( $U^*$ = 7.5–8.0) and figure-‘8’ ( $U^*>$ 8.0) as a result of the variation in the amplitude at the second harmonic frequency (figure 5b). In the extended VIV regime the second harmonic frequency is apparent only in the lock-in region with large amplitudes (figure 4e, f). Additionally, the third harmonic frequency in the streamwise vibration becomes visible in the range of $6.5 < U^*< 13.5$. As shown in figure 5(c), the trajectories of the displacements are figure-‘o’ shaped for most $U^*$ cases, which is consistent with the identical $f_x^{*}$ and $f_y^{*}$. However, due to the augmented component of the second harmonic frequency, the figure-‘8’ shaped trajectory is observed in the range of $U^* = 6.0\unicode{x2013}7.5$. In the narrowed VIV regime the dominant frequencies linearly increase with increasing $U^*$ (figure 4g,h). The second harmonic frequency is noticeable only in the streamwise displacement as a result of the shear layer reattachment on the flat part of the prism. As shown in figure 5(d), except at $\alpha = 105^{\circ }$, the trajectories are mostly figure-‘o’ shaped. Because of the intensified amplitude of the second harmonic frequency, the figure-‘8’ trajectory is dominant at $\alpha = 105^{\circ }$ and several small $U^*$ cases at $\alpha = 120^{\circ }\unicode{x2013}135^{\circ }$.
Power spectral density (PSD) of the displacements in the streamwise and transverse directions at  $U^* = 2\unicode{x2013}20$ and selected $\alpha$ cases. For each $U^*$, the PSD is normalized by its maxima. (a,b) Typical VIV at $\alpha = 15^{\circ }$, (c,d) hysteretic VIV at $\alpha = 40^{\circ }$, (e, f) extended VIV at $\alpha = 50^{\circ }$ and (g,h) narrowed VIV at $\alpha = 105^{\circ }$. In each plot the inclined dashed line represents the $St$ of the stationary D-section prism. Same for figures 8 and 12.

The trajectories of the streamwise and transverse displacements versus reduced velocity  $U^*$ and angle of attack $\alpha$. (a) Typical VIV, (b) hysteretic VIV, (c) extended VIV and (d) narrowed VIV. The displacements are of a figure-‘8’ (blue), irregular (grey), quasi-periodic (olive) or raindrop (red) shaped trajectory. The lilac region represents the prism moving downstream at the extremes of the transverse oscillation (CW) while the light green region represents the prism moving upstream at the extremes of the transverse oscillation (CCW). Same for figures 9 and 13.

As shown in figure 6(b–d), the prism vibrations in the typical VIV are usually periodic. However, an exception is observed at  $U^* = 3.5$ where the prism vibration is quasi-periodic, involving a beat-like phenomenon (figure 6a). At this $U^*$, two incommensurate frequencies are identified in the displacements, one corresponding to the vibration frequency while the other corresponding to the natural frequency of the prism, and they have comparable amplitudes (Navrose et al. Reference Navrose, Yogeswaran, Sen and Mittal2014; Kumar, Singh & Sen Reference Kumar, Singh and Sen2018; Chen et al. Reference Chen, Ji, Alam, Xu, An and Tong2022b). Cheng et al. (Reference Cheng, Lien, Yee and Zhang2022) observed that with this trait, the two frequencies compete with each other in a balanced way. In other three VIV regimes, the prism vibrations are periodic (figure 6e–l). Within the hysteresis loop, the vibrations in the increasing and decreasing cases are significantly different (figure 6e, f).
Time histories of the streamwise and transverse displacements at different  $U^*$ and $\alpha$ values. (a–d) Typical VIV, (e–g) hysteretic VIV, (h–j) extended VIV and (k,l) narrowed VIV.

3.2. Group 2: galloping or combined galloping
At  $\alpha = 70^{\circ }$, both $A_x^{*}$ and $A_y^{*}$ increase synchronously with increasing $U^*$, and there is no sign of amplitude convergence (figure 7a). As shown later, both $f_x^{*}$ and $f_y^{*}$ show galloping characters, i.e. constant values. Accordingly, the vibrations in both directions display a galloping behaviour, which is referred to as dual galloping. The ‘dual’ is derived from Dahl et al. (Reference Dahl, Hover, Triantafyllou, Dong and Karniadakis2007, Reference Dahl, Hover, Triantafyllou and Oakley2010) who first introduced the concept of ‘dual resonance’ in the 2DOF VIV of a circular cylinder, where the circular cylinder is resonant simultaneously in both streamwise and transverse directions. However, unlike Dahl et al. (Reference Dahl, Hover, Triantafyllou, Dong and Karniadakis2007) where the ratio ( $f_{xn}/f_{yn}$) of the natural frequencies in the streamwise and transverse directions is $2:1$, it is $1:1$ in the present study. This is the first observation of dual galloping in the 2DOF FIV of a non-circular prism. In the response there are several kinks, e.g. at $U^* = 18.0$, resulting from the lock-in of higher harmonic frequencies (Bearman et al. Reference Bearman, Gartshore, Maull and Parkinson1987; Nemes et al. Reference Nemes, Zhao, Lo Jacono and Sheridan2012; Zhao et al. Reference Zhao, Leontini, Lo Jacono and Sheridan2014; Chen et al. Reference Chen, Ji, Alam, Xu, An and Tong2022b). At $\alpha = 165^{\circ }\unicode{x2013}180^{\circ }$, $A_y^{*}$ generally increases with increasing $U^*$, indicating the transverse galloping (figure 7c). However, as $U^*$ increases, $A_x^{*}$ initially augments before being constant, no galloping in the streamwise direction. Thus, this response is named transverse-only galloping. The $A_x^{*}$ at $\alpha = 165^{\circ }\unicode{x2013}170^{\circ }$ is slightly larger than that at $\alpha = 175^{\circ }\unicode{x2013}180^{\circ }$, while $A_y^{*}$ is smaller at $\alpha = 165^{\circ }\unicode{x2013}170^{\circ }$ than at $\alpha = 175^{\circ }\unicode{x2013}180^{\circ }$ for $U^*>$ 7.0. Hysteresis prevails and its corresponding $U^*$ range varies significantly with $\alpha$. The hysteresis loop exists at $17.2 < U^*< 19.2$ and $18.7 < U^*< 19.5$ for $\alpha = 165^{\circ }$ and $170^{\circ }$, respectively, while at $13.2 < U^*< 14.5$ and $12.7 < U^*< 15.0$ for $\alpha = 175^{\circ }$ and $180^{\circ }$, respectively. As shown in figure 7(e), at $\alpha = 75^{\circ }\unicode{x2013}80^{\circ }$, the response can be divided into two regions: VIV and galloping (Sen & Mittal Reference Sen and Mittal2011; Cui et al. Reference Cui, Zhao, Teng and Cheng2015; Bhatt & Alam Reference Bhatt and Alam2018). In the VIV region, $A_x^{*}$ and $A_y^{*}$ are very small, while in the galloping region they monotonically increase for $\alpha = 80^{\circ }$ but non-monotonically for $\alpha = 75^{\circ }$ where $A_x^{*}$ and $A_y^{*}$ locally peak at the same $U^*$.
Dependence of non-dimensional vibration amplitudes ( $A_x^{*}$ and $A_y^{*}$) and frequencies ( $f_x^{*}$ and $f_y^{*}$) on reduced velocity $U^*$ and angle of attack $\alpha$. (a,b) Dual galloping, (c,d) transverse-only galloping and (e, f) combined VIV and galloping.

In the dual galloping regime,  $f_x^{*}$ and $f_y^{*}$ are identical (figure 7b). At small $U^*$, i.e. $2.0 \le U^*< 3.0$, $f_x^{*}$ and $f_y^{*}$ closely follow the $St$ line, indicating desynchronized vibration. For $U^* \ge 3.0$, $f_x^{*}$ and $f_y^{*}$ are constant at $\approx$0.75, which is a characteristic feature of galloping (Nemes et al. Reference Nemes, Zhao, Lo Jacono and Sheridan2012; Zhao et al. Reference Zhao, Leontini, Lo Jacono and Sheridan2014; Chen et al. Reference Chen, Ji, Alam, Xu, An and Tong2022b). In the transverse-only galloping regime, $f_y^{*}$ initially linearly increases, closely following the $St$ line, before reaching a constant value of approximately 1.0, regardless of $\alpha$ (figure 7d). In the hysteresis region there is a small discrepancy in $f_y^{*}$ between the increasing and decreasing cases due to the modification of vortex dynamics. At $\alpha = 165^{\circ }\unicode{x2013}170^{\circ }$, except at $U^* = 8.0$ and $\alpha = 165^{\circ }$, $f_x^{*}$ is identical to $f_y^{*}$. However, owing to the symmetry recovery of the cross-section to the incoming flow, $f_x^{*}$ is twice $f_y^{*}$ for some $U^*$ cases at $\alpha = 175^{\circ }$ while for all examined $U^*$ at $\alpha = 180^{\circ }$. In the combined VIV and galloping regime, $f_x^{*}$ and $f_y^{*}$ closely follow the $St$ line in the VIV region, thus, no lock-in, while in the galloping they are constant at around 0.65 for $\alpha = 75^{\circ }$ and 0.5 for $\alpha = 80^{\circ }$ (figure 7f).
The PSD results of the displacements shown in figure 8 provide additional information. In the dual galloping regime, in addition to the fundamental frequency, the second and third harmonic frequencies become noticeable as  $U^*$ increases (figure 8a,b). The appearance of higher harmonic frequencies is related to the increased nonlinearity of the force at higher amplitude and relative motion of shed vortices with respect to the body motion. The trajectories in the dual galloping regime are mostly figure-‘o’ shaped, indicating relatively lower amplitudes of higher harmonic frequencies compared with the fundamental frequency (figure 9a). At $U^* = 19.0$ and 20.0, multiple frequencies appear in both streamwise and transverse displacements, resulting in chaotic trajectories. Similarly, in the transverse-only galloping regime, higher harmonic frequencies appear, especially in the streamwise displacement, as $U^*$ increases (figure 8c,d). Incommensurate frequencies identified at $U^* = 6.0$ and 13.0 lead to chaotic responses. As the symmetry of the cross-section with respect to the incoming flow recovers, the trajectories are of figure-‘8’ for most $U^*$ cases, while figure-‘o’ shaped trajectory only exists at $U^* = 4.0\unicode{x2013}4.5$ (figure 9b). However, at $\alpha = 165^{\circ }$, although the cross-section remains asymmetric, figure-‘8’ shaped trajectory becomes dominant, particularly at large $U^*$. In the combined VIV and galloping regime, the PSD features differ between the VIV and galloping regions (figure 8e, f). In the VIV region the dominant frequency has a much higher amplitude, while the other frequencies are trivial. In the galloping region the fundamental frequency is accompanied by the second and third harmonic frequencies in both directions. In the combined regime the trajectories of the displacements indicate figure-‘o’ shaped responses (figure 9a), indicating identical frequencies in both directions. The influences of higher harmonic frequencies are noticed only at $U^* = 4.0$.
The PSD of the displacements in the streamwise and transverse directions at  $U^* = 2\unicode{x2013}20$ and selected $\alpha$ cases. (a,b) Dual galloping at $\alpha = 70^{\circ }$, (c,d) transverse-only galloping at $\alpha = 180^{\circ }$ and (e, f) combined VIV and galloping at $\alpha = 80^{\circ }$.

The trajectories of the streamwise and transverse displacements versus reduced velocity  $U^*$ and angle of attack $\alpha$. (a) Dual galloping and combined response and (b) transverse-only galloping.

The displacements in the dual galloping regime deviate from a sinusoidal shape due to the appearance of harmonic frequencies, although they remain periodic (figure 10a,b). In the transverse-only galloping regime the displacements can be irregular, quasi-periodic or periodic (figure 10c–f). At  $U^* = 6.0$, the response shows intermittent behaviour where the vibration alternates between periodic and irregular (figure 10c,d). In the hysteretic region the prism vibrations are relatively regular in both increasing and decreasing cases (figure 10e, f). In the combined regime the prism vibrations are rather regular (figure 10g,h), but the presence of higher harmonic frequencies makes the vibrations in the galloping region deviate from a pure sinusoidal shape.
Time histories of the streamwise and transverse displacements at different  $U^*$ and $\alpha$ values. (a,b) Dual galloping, (c–f) transverse-only galloping and (g,h) combined VIV and galloping.
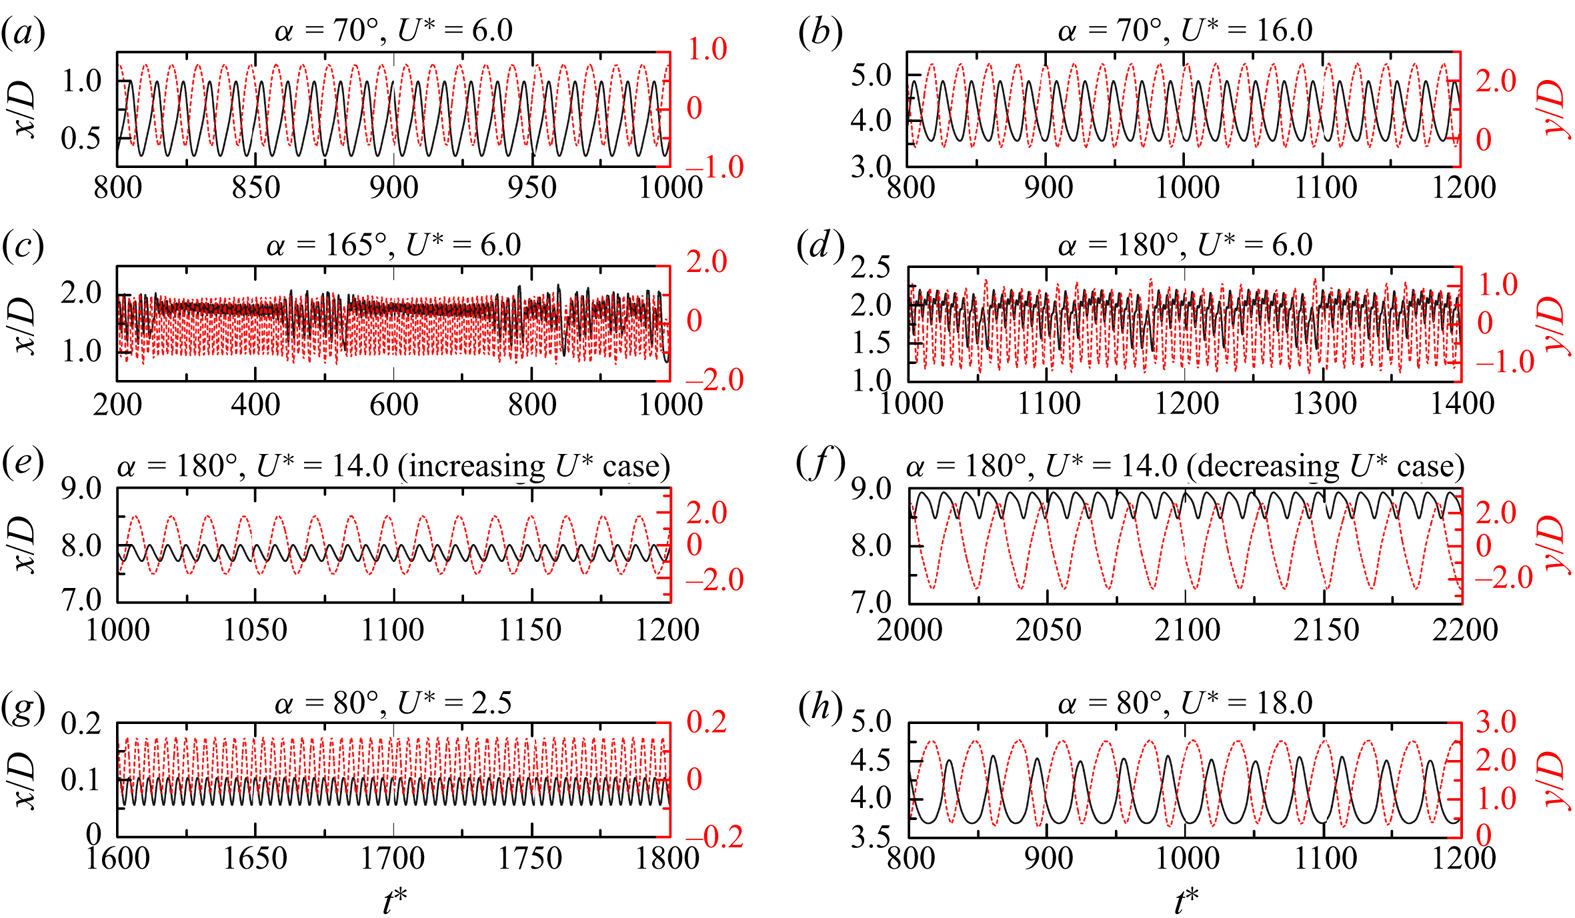
3.3. Group 3: galloping-like response
At  $\alpha = 60^{\circ }\unicode{x2013}65^{\circ }$, the response exhibits a galloping-like behaviour, but with complicated dependence on $U^*$ (figure 11a). At $\alpha = 60^{\circ }$, the response can be divided into three branches. In the first region ( $2.0 \le U^* \le 11.5$ for the increasing case or $2.0 \le U^* \le 11.3$ for the decreasing case), $A_x^{*}$ and $A_y^{*}$ initially increase with increasing $U^*$ and then gradually decrease. However, this behaviour does not persist at higher $U^*$. In the second region ( $11.5 < U^*< 16.0$ for the increasing case or $11.3 < U^*< 14.2$ for the decreasing case), $A_x^{*}$ and $A_y^{*}$ jump and decrease gradually with increasing $U^*$. In the third region ( $16.0 \le U^* \le 20.0$ for the increasing case or $14.2 \le U^* \le 20.0$ for the decreasing case), $A_x^{*}$ and $A_y^{*}$ are very small. The transitions between adjacent regions are hysteretic, with the hysteresis loop between the second and third regions being wider than the other. At $\alpha = 65^{\circ }$, the variation in amplitudes with increasing $U^*$ is similar to that at $\alpha = 60^{\circ }$, but the first region extends to a higher $U^*$, resulting in only two regions in the examined $U^*$ range. Hysteresis is observed between the two regions. Based on $f_x^{*}$ and $f_y^{*}$, the first region can be divided into desynchronization and lock-in regions (figure 11b). For both $\alpha$ cases, $f_x^{*}$ and $f_y^{*}$ at $U^*<$ 3.5 closely follow the $St$ line, i.e. desynchronization region. In the remaining $U^*$ range of the first region, $f_x^{*}$ and $f_y^{*}$ are approximately constant but lower than 1.0, i.e. lock-in region. The extension of the first region is a result of the widening lock-in as $\alpha$ increases from $60^{\circ }$ to $65^{\circ }$. This response can be considered as a transition from extended VIV to dual galloping. Furthermore, at $\alpha = 60^{\circ }$ and $U^* = 12.5\unicode{x2013}15.5$, the vortex shedding frequency is two or three times the vibration frequency, suggesting the absence of synchronization between the prism vibration and vortex formation. Therefore, this transition response belongs to the galloping-like response (Stansby & Rainey Reference Stansby and Rainey2001; Yogeswaran & Mittal Reference Yogeswaran and Mittal2011). At $\alpha = 150^{\circ }\unicode{x2013}160^{\circ }$, $A_x^{*}$ and $A_y^{*}$ are highly contingent on $U^*$ (figure 11c). Depending on $\alpha$, the response can be divided into three or four regions. At $\alpha = 150^{\circ }$, three regions are identified. In the first region, i.e. $2.0 \le U^* \le 5.4$ (the increasing case) or $2.0 \le U^* \le 4.4$ (the decreasing case), $A_x^{*}$ and $A_y^{*}$ gradually increase. In the second region, i.e. $5.4 < U^* \le 6.6$ (the increasing case) or $4.4< U^* \le 6.6$ (the decreasing case), $A_x^{*}$ and $A_y^{*}$ are almost constant. For $U^*>$ 6.6, the third region is characterized by small amplitudes. The variation of $f_x^{*}$ and $f_y^{*}$ shown in figure 11(d) provides additional information. In the first region, demarcated by $U^* = 3.0$, the vibration can be either desynchronized or lock-in, while that is lock-in in the second region and becomes desynchronized again in the third region. At $\alpha = 160^{\circ }$, the response is also divided into three regions. However, in the third region, i.e. $16.0 < U^* \le 20.0$ (the increasing case) or $15.0 < U^* \le 20.0$ (the decreasing case), $A_x^{*}$ and $A_y^{*}$ are significantly large, and $f_x^{*}$ and $f_y^{*}$ are approximately constant, indicating the lock-in. At $\alpha = 155^{\circ }$, the response is classified into four regions. The features of the former two regions are similar to those at $\alpha = 150^{\circ }$, except for $U^* = 8.3\unicode{x2013}8.6$, where the amplitudes are significantly large. As shown later, the wake mode in this region is the 3S+2S mode while the 2S mode is in the near region. In the third region, i.e. $10.4 < U^*< 14.5$ (the increasing case) or $9.8 < U^*< 14.5$ (the decreasing case), $A_x^{*}$ and $A_y^{*}$ are large again, and $f_x^{*}$ and $f_y^{*}$ are approximately constant at 1.0. Thus, lock-in occurs. Hysteresis loops are observed between some adjacent regions. In the fourth region, i.e. $U^* \ge 14.5$, $A_x^{*}$ and $A_y^{*}$ are much smaller, and $f_x^{*}$ and $f_y^{*}$ follow the $St$ line again. Overall, the response at $\alpha = 150^{\circ }\unicode{x2013}160^{\circ }$ behaves like a transition from narrowed VIV to transverse-only galloping. Similar to the first transition, the vortex shedding frequency is also several times the vibration frequency in the region of $U^* \ge 9.5$ for $\alpha = 160^{\circ }$, and the synchronization between the prism vibration and vortex formation loses. Therefore, this transition also belongs to the galloping-like response.
Dependence of non-dimensional vibration amplitudes ( $A_x^{*}$ and $A_y^{*}$) and frequencies ( $f_x^{*}$ and $f_y^{*}$) on reduced velocity $U^*$ and angle of attack $\alpha$. (a,b) First transition and (c,d) second transition.
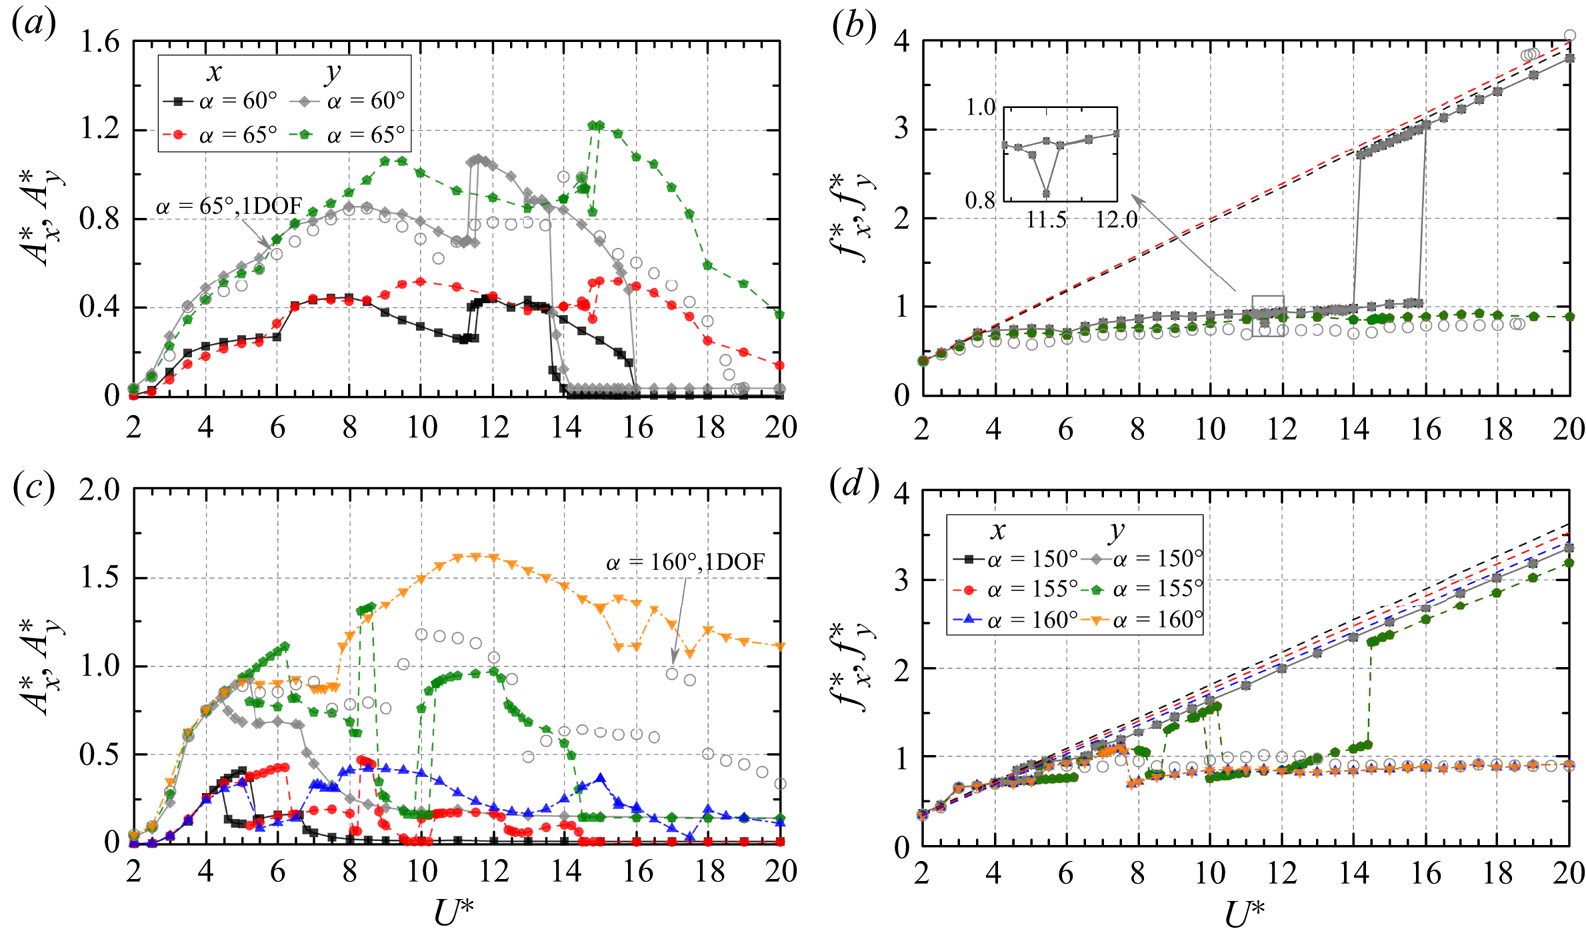
The PSD results of the displacements for the galloping-like response are shown in figure 12. In the first transition the fundamental frequency is accompanied by the second harmonic frequency in the lock-in region. At  $12.0 < U^*< 15.0$, other frequencies are observed in the displacements in both directions, suggesting complex interactions between the prism vibration and vortex shedding. The trajectories of the displacements are mostly figure-‘o’ shapes (figure 13a), primarily caused by significantly asymmetric vortex shedding. Incommensurate frequencies in the displacements lead to chaotic trajectories at $U^* = 13.0$ and 14.0. At $U^* = 7.5\unicode{x2013}9.0$, the trajectories are figure-‘8’ or figure-‘8’ like, which may be caused by the increasing streamwise amplitude at the second harmonic frequency. In the second transition several frequencies are observed in the displacements, including the dominant frequency and its higher harmonics (figure 12c,d). However, for some $U^*$ cases, such as $U^*$ = 9.0, incommensurate frequencies are observed, resulting in a chaotic response. The trajectories of the displacements at $\alpha = 155^{\circ }$ exhibit all three types of vibrations: periodic, quasi-periodic and chaotic (figure 13b). At $U^*< 6.5$, the trajectories are figure-‘o’ shaped, with some cases showing slight irregularity. At $U^* = 7.0\unicode{x2013}10.0$, except $U^*= 8.5$ where the trajectory is periodic figure-‘8’ shaped, the trajectories become chaotic due to the emergence of incommensurate frequencies, as indicated in figure 12(c,d). When $U^*> 10.0$, the trajectories change into the figure-‘8’ shape.
The PSD of the displacements in the streamwise and transverse directions at  $U^* = 2\unicode{x2013}20$ and selected $\alpha$ cases. (a,b) First transition at $\alpha = 60^{\circ }$ and (c,d) second transition at $\alpha = 155^{\circ }$.
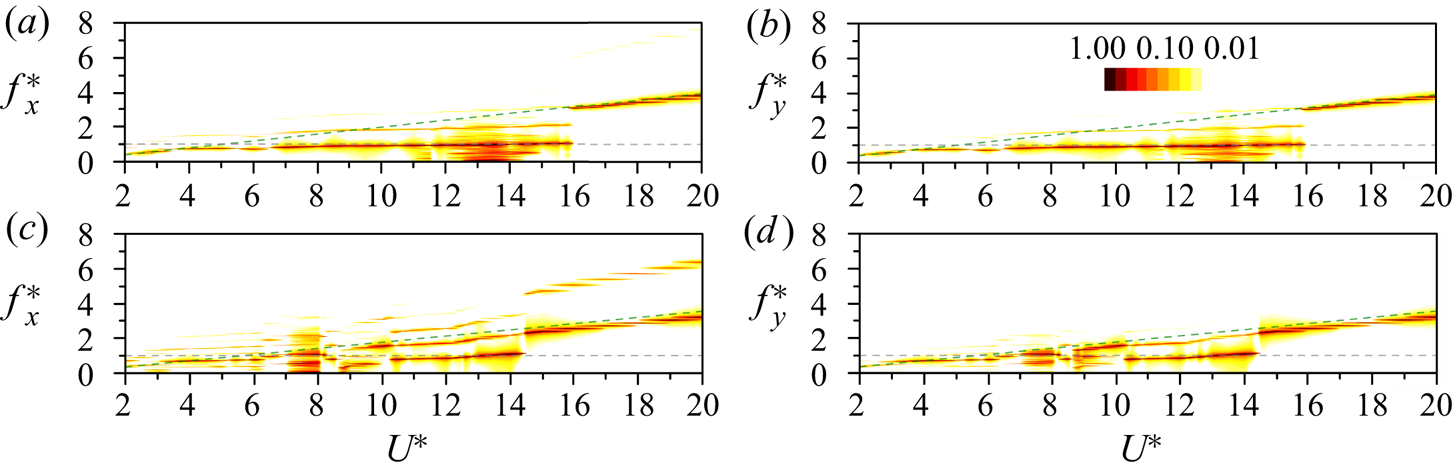
The trajectories of the streamwise and transverse displacements versus reduced velocity  $U^*$ and angle of attack $\alpha$. (a) First transition and (b) second transition.
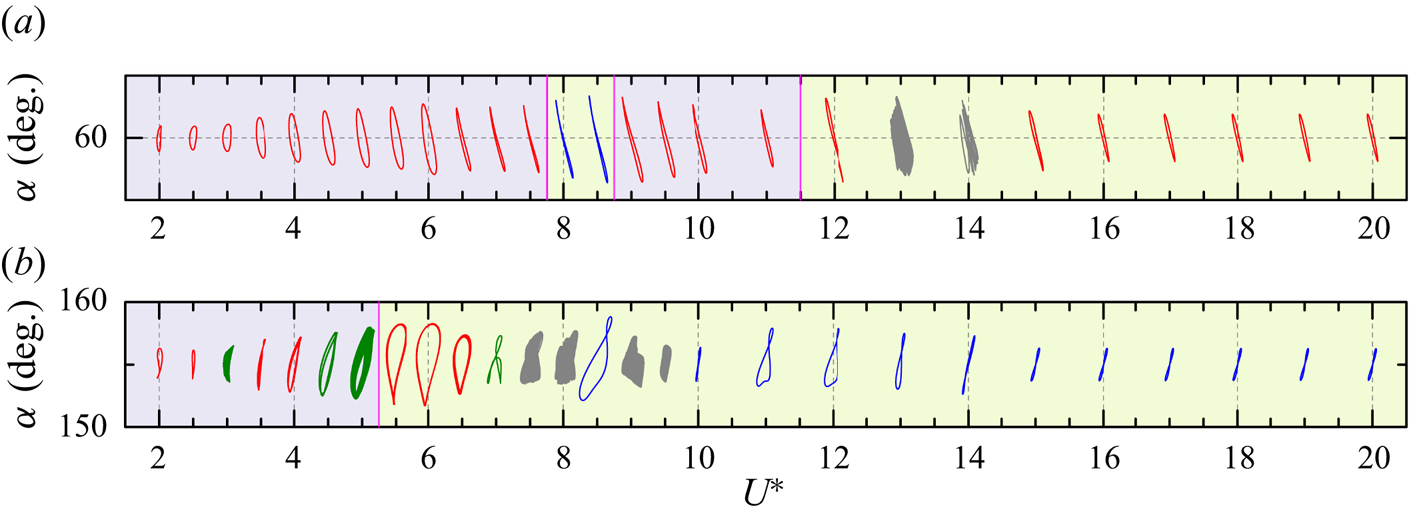
As shown in figure 14(b–e), the prism vibrations within the hysteresis loop are relatively regular. Out of the hysteresis, the vibrations in the first transition are periodic (figure 14a), but not periodic in the second transition, as indicated in figure 14( f–h).
Time histories of the streamwise and transverse displacements at different  $U^*$ and $\alpha$ values. (a–c) First transition and (d–h) second transition.
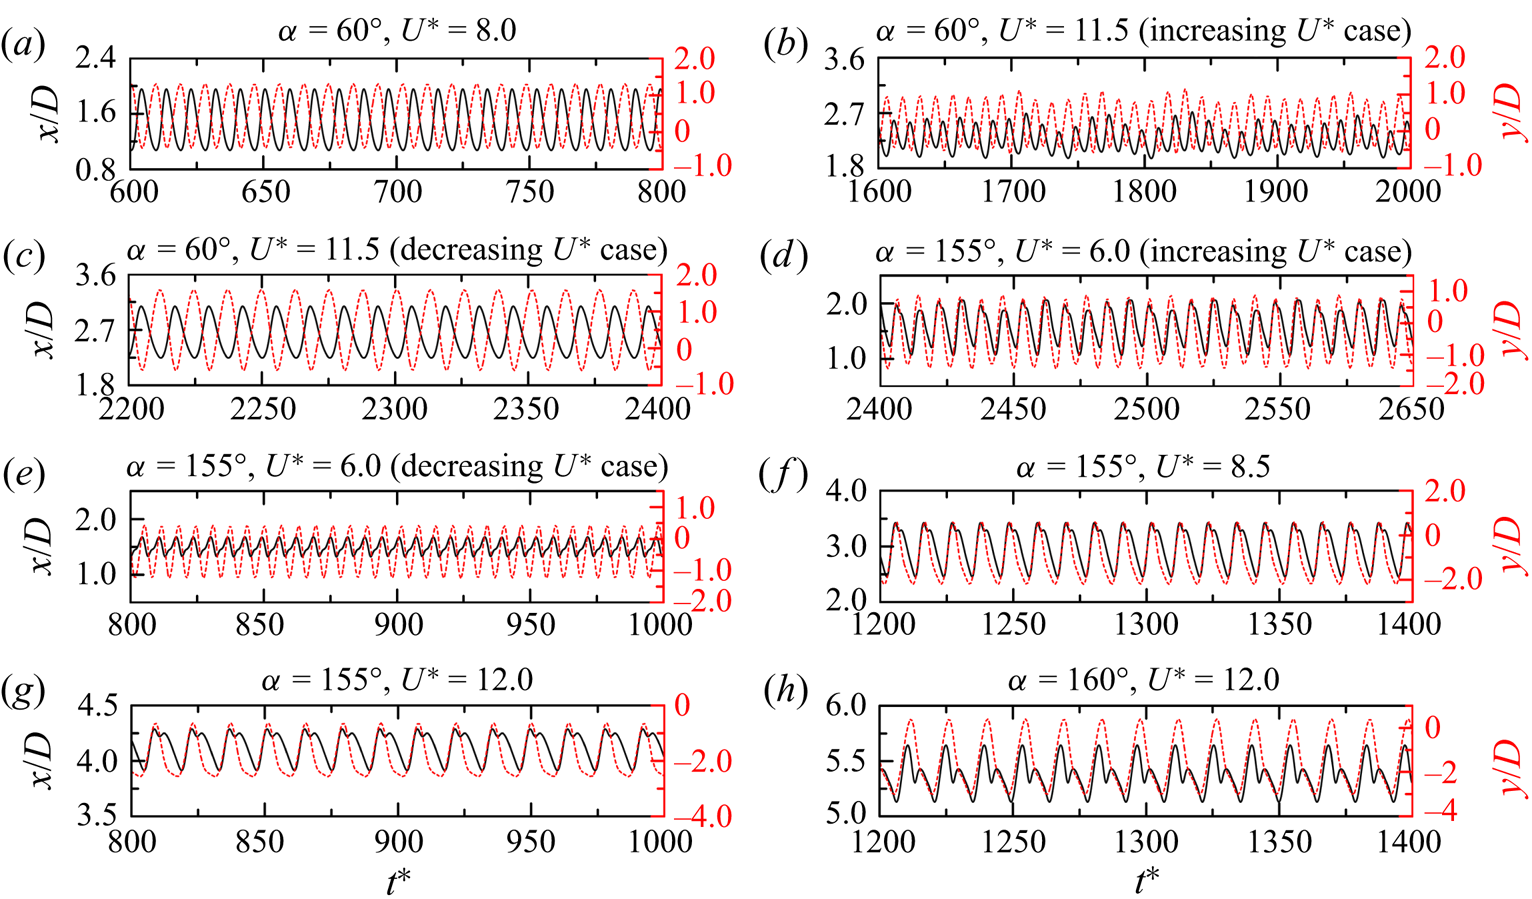
4. Flow physics
4.1. Overview of wake modes
To some extent, the vortex dynamics behind the prism can be understood from the wake modes. It is worth investigating the connection between wake modes and vibration responses. Over the past decades, several different wake modes were recognized in the VIV of a circular cylinder, such as the 2S mode, P+S mode, 2P mode and 2T mode (Williamson & Roshko Reference Williamson and Roshko1988). These wake modes are linked to vibration and frequency responses (Williamson & Roshko Reference Williamson and Roshko1988; Govardhan & Williamson Reference Govardhan and Williamson2000; Leontini et al. Reference Leontini, Stewart, Thompson and Hourigan2006a). However, because of the changing asymmetry of the cross-section with  $\alpha$, distinct responses from the classical VIV are observed and, hence, may be accompanied by distinct wake modes. Figure 15 shows how the wake modes are dependent on $U^*(= 2{-}20)$ and $\alpha$ ( $= 0^{\circ }\unicode{x2013}180^{\circ }$). The wakes are categorized into a number of types; some of them are noticed in the VIV of a circular cylinder. Galloping responses involve more vortices shed from the D-section prism, especially when the amplitude is large. A special mode, i.e. $m$S+
$m$S+ $n$S mode ( $m$ and $n$ are positive integers; $m \ge 3$, $n \ge 2$), is introduced for the large-amplitude response (Seyed-Aghazadeh et al. Reference Seyed-Aghazadeh, Carlson and Modarres-Sadeghi2017; Chen et al. Reference Chen, Ji, Xu, Zhang and Wei2020a, Reference Chen, Ji, Alam, Xu, An and Tong2022b). Also following Williamson & Roshko (Reference Williamson and Roshko1988), $m$ and $n$ are the numbers of vortices shed from each side of the prism in one vibration period. In general, the 2S mode dominates a major part of the examined parametric plane, linked to the typical, hysteretic and narrowed VIV regimes and some other regimes with small amplitude and small $U^*$. However, owing to the asymmetric cross-section ( $\alpha \neq 0^{\circ }, 180^{\circ }$), the arrangement of two vortices in the 2S mode is significantly different. As shown in figure 16(a), when the transverse distance between the separation points at two sides is large, vortices are arranged in two parallel rows alternately, generating the parallel vortex street at $x/D \leq 12.0$. The parallel vortex street transmutes into the secondary vortex street (Cimbala, Nagib & Roshko Reference Cimbala, Nagib and Roshko1988; Inoue & Yamazaki Reference Inoue and Yamazaki1999; Kumar & Mittal Reference Kumar and Mittal2012; Thompson et al. Reference Thompson, Radi, Rao, Sheridan and Hourigan2014; Zafar & Alam Reference Zafar and Alam2018; Jiang & Cheng Reference Jiang and Cheng2019; Zheng & Alam Reference Zheng and Alam2019; Shi, Alam & Bai Reference Shi, Alam and Bai2020; Jiang Reference Jiang2021). As shown in figure 16(b), at a higher $\alpha$, the transverse distance between the separation points on the two sides becomes small, as does the lateral distance between the two rows of the vortices in the wake. For a further larger $\alpha$ and large amplitude, although vortex shedding occurs in the 2S mode, streamwise distances between two successive counter-rotating vortices are unequal in the near wake and tend to be equal downstream (figure 16c). The arrangement of vortices looks symmetric in the near wake but asymmetric in the far wake. The mutation from the symmetric to asymmetric arises from the difference in the convective velocities in the upper- and lower-row vortices, given that the lower-row vortices, lying on the wake centreline, have smaller convective velocity than the upper-row vortices.
Wake modes in the  $(U^*, \alpha )$ parameter plane for the 2DOF FIV of a D-section prism at ${Re} = 100$ and $m^* = 2.0$. Two regions marked by inclined lines represent the zones where the $m$S+
$m$S+ $n$S mode appears and the region marked by straight lines denotes the intermittency response.
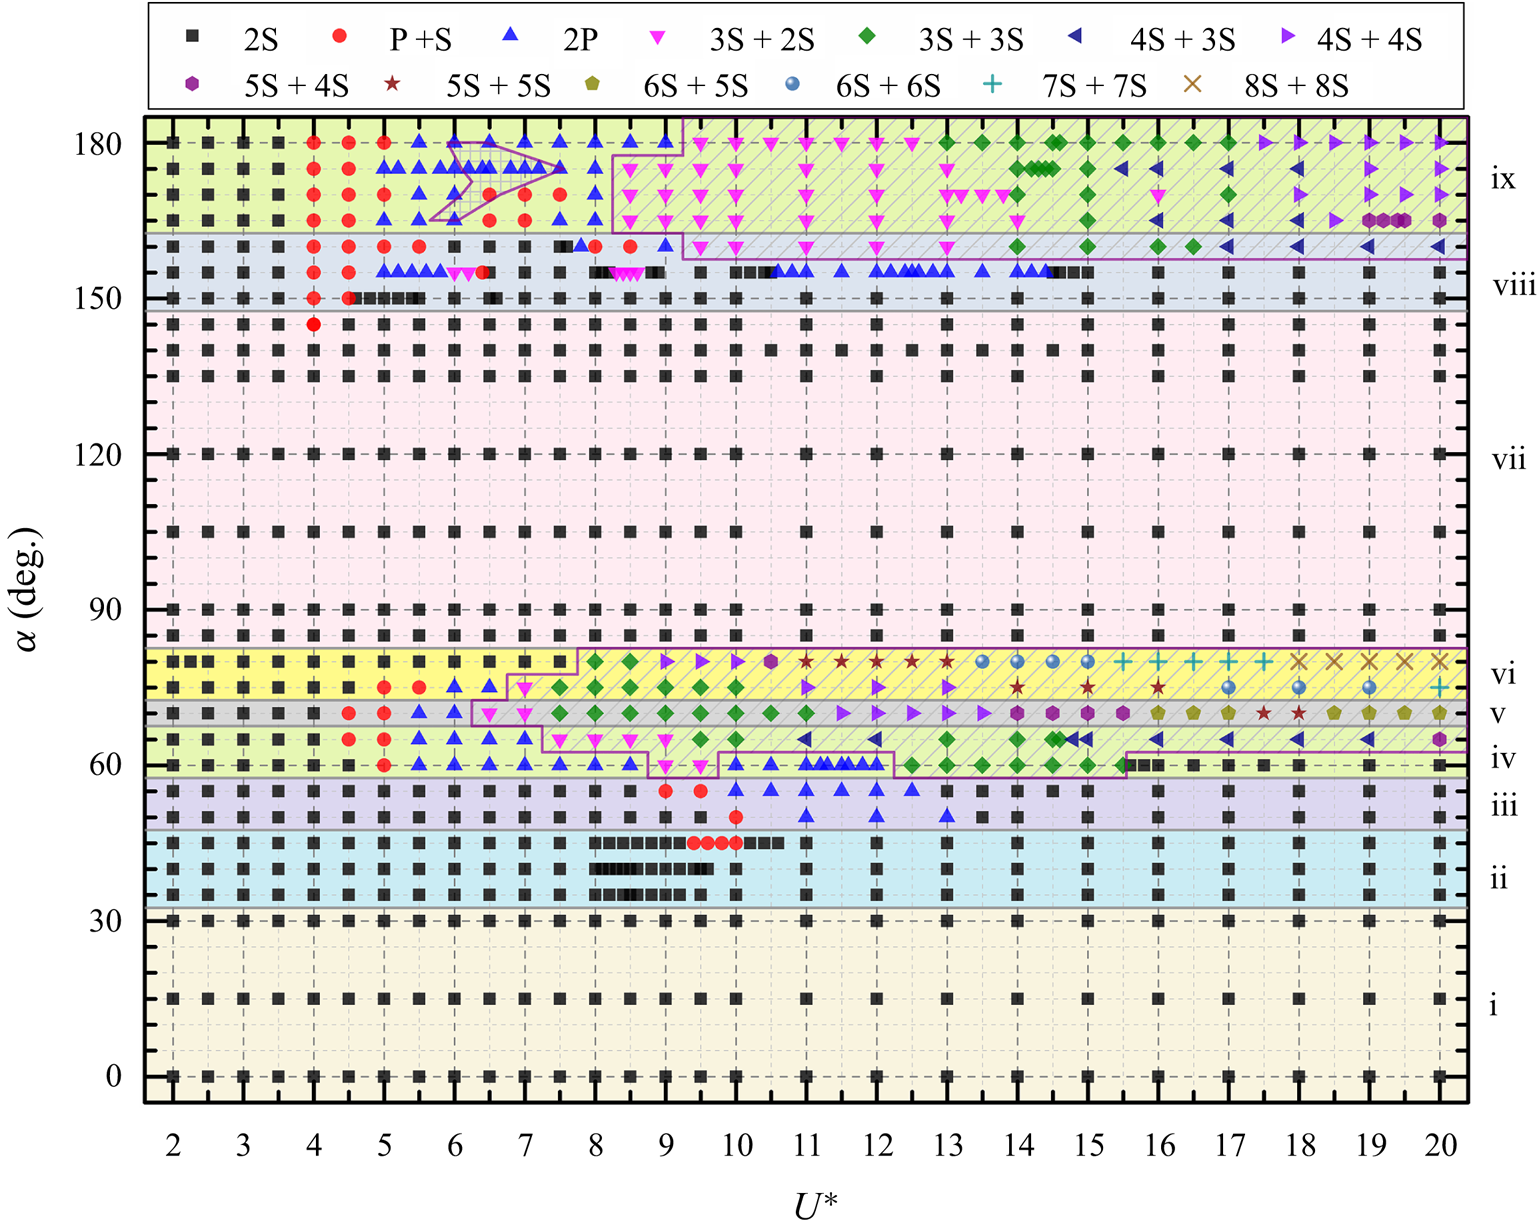
Selected vorticity contours for the wake modes shown in figure 15. (a) The 2S mode at  $\alpha = 15^{\circ }$ and $U^* = 5.0$, (b) the 2S mode at $\alpha = 40^{\circ }$ and $U^* = 17.0$, (c) the 2S mode at $\alpha = 50^{\circ }$ and $U^*$ = 6.0, (d) the P+S mode at $\alpha = 160^{\circ }$ and $U^* = 4.5$, (e) the 2P mode at $\alpha = 155^{\circ }$ and $U^* = 5.0$, ( f) the 4S+4S mode at $\alpha = 180^{\circ }$ and $U^* = 19.0$ and (g,h) the P+S/2P mode at $\alpha = 165^{\circ }$ and $U^* = 5.5$. In ( f), ‘top’ and ‘bottom’ denote that the prism is at the top and bottom, respectively.

Compared with the 2S mode, the P+S mode usually appears in the region with higher amplitudes. The P+S mode in the hysteretic and extended VIV regimes occurs at relatively large  $U^* (= 9.0{-}10.0)$ and in the transition, combined and pure galloping regimes, at small $U^* (= 4.0{-}5.5)$. That is, the P+S mode requires a stronger oscillation to make sure a shear layer rolls into two or more times in one oscillation cycle (Leontini et al. Reference Leontini, Stewart, Thompson and Hourigan2006a; Govardhan & Williamson Reference Govardhan and Williamson2000). As shown in figure 16(d), when the prism is at the bottom, one positive vortex shed from the lower side pairs with the negative vortex shed from the upper side of the prism, which generates a vortex pair P. The positive vortex in the pair is small and weak, while pushed toward the free-stream side by the strong rotation of the large negative vortices. The small positive vortex thus decays rapidly and loses its identity downstream. When the prism is at the top position, only one positive vortex is shed from the lower side of the prism. The vortex shedding thus occurs in the P+S mode. During the downstream evolution of the vortices, the two negative vortices coalesce and the single vortex grows in size, which in turn generates symmetric vortices.
The 2P mode prevails only in the transition, combined and galloping regimes. The  $U^*$ for the 2P mode is generally higher than that for the P+S mode, which is consistent with the requirement of a higher amplitude to make sure more vortices shed from the prism (Govardhan & Williamson Reference Govardhan and Williamson2000). As shown in figure 16(e), in the 2P mode two vortices are shed from each side of the prism in one vibration period in a similar fashion to the paired vortex described above. The weak vortex of each pair rapidly dissipates while other vortices rearrange themselves downstream.
The multi-vortex mode, namely  $m$S+
$m$S+ $n$S mode, is observed in the transition and galloping (including galloping region of the combined regime) regimes. In the transition regime the $m$S+
$m$S+ $n$S mode occurs around the peak amplitude, while in the galloping region the number of vortices increases with increasing amplitude. As shown in figure 16( f), when the prism moves from the bottom to the top, four vortices, i.e. two positive (vortices 1 and 2) and two negative (vortices 1’ and 2’) vortices, shed from the prism. Similarly, another four vortices shed during the other half-cycle of the oscillation (vortices 3, 3’, 4 and 4’). It leads to the 4S+4S mode. However, it should be pointed out here that the galloping instability is related to specifics of what is happening to the shear layer, not to vortex shedding modes. The dominant frequency has no relationship with the number of vortices being shed in the wake. If one is to define an axis pointing the prism forward motion, the wake would just appear to be a slowly wavering 2S mode, as described in Li et al. (Reference Li, Lyu, Kou and Zhang2019), Yao & Jaiman (Reference Yao and Jaiman2017) and Nemes et al. (Reference Nemes, Zhao, Lo Jacono and Sheridan2012).
Besides the abovementioned wake modes, there is another intermittent mode where different wake modes appear alternately at some combinations of  $\alpha$ and $U^*$. The occurrence of this special mode is a result of the significant fluctuations of the displacement. As shown in figure 16(g,h), within different periods, the number of vortices shed from the prism can be three or four, signifying a P+S or 2P mode. This intermittent wake mode has also been noticed in the transverse-only FIV of a D-section prism in Chen et al. (Reference Chen, Ji, Alam, Xu, An and Tong2022b). However, to positively identify the $(U^*,\alpha )$ range for this wake mode in the examined parametric plane, a large number of consecutive snapshots are required, which is outside the scope of this paper. Therefore, the intermittent mode is not marked in figure 15.
4.2. Mechanisms for the identified responses
The physical mechanisms for some responses have been thoroughly explained in Chen et al. (Reference Chen, Ji, Alam, Xu, An and Tong2022b) for a D-section prism allowed to vibrate in the transverse direction only. The freedom to move in the streamwise direction shows no intrinsic modification of the mechanisms. In this section the focus is given to the mechanisms of several crucial phenomena identified exclusively in the 2DOF FIV responses, which will deepen our understanding of this FSI problem.
4.2.1. Mechanisms for the sustenance of hysteresis
Bistability is a well-known phenomenon in dynamic systems, characterized by the coexistence between two stable states. The hysteresis with one loop is a mode of bistable states that are mutually connected (Guidi & Goldbeter Reference Guidi and Goldbeter1997). The solution states are different when the control parameter ( $U^*$ in the present study) is continously increased and decreased. As shown in figures 3, 7 and 11, when $U^*$ is increased, the system jumps from one branch of the steady states to another branch after a limit point. However, when $U^*$ is then decreased, the system jumps back at a different point. Depending on the initial conditions, i.e. increasing or decreasing $U^*$, the prism responses may be significantly different. For a vibration system without structural damping, the prism energy extracted from the fluid equals the energy dissipation caused by the viscosity in one vibration period. Therefore, the net energy input is zero. Intrinsically, hysteresis can be thought of as a system that can sustain at two different stable states by extracting different amounts of energy. Take the hysteresis at $\alpha = 40^{\circ }$ for example. In the increasing case, the prism's initial energy equals the dynamic energy of the prism at the lower $U^*$. However, in the decreasing case the initial energy equals the dynamic energy of the prism at the higher $U^*$, which is significantly smaller than that in the increasing case. Table 2 shows the observed hysteresis and factors for its sustenance in different responses. It can be divided into two: hysteresis at $\alpha < 90^{\circ }$ associated with shear layer reattachment and separation point movement while that at $\alpha > 90^{\circ }$ only relates to shear layer reattachment. To elucidate the associated flow physics, we select two cases: (1) $\alpha = 40^{\circ }$ and $U^* = 8.0$ and (2) $\alpha = 180^{\circ }$ and $U^* = 14.0$, representing hysteresis with different factors.
A summary of hysteresis observed in the 2DOF vibrations of a D-section prism at  ${Re} = 100$ and $m^* = 2.0$.

The work done by the fluid is an indicator of how the prism oscillation is sustained (Qin, Alam & Zhou Reference Qin, Alam and Zhou2017, Reference Qin, Alam and Zhou2019). As the transverse vibration of the prism is sustained by the lift force, our attention is paid to the lift coefficient in phase with the prism velocity. Note that the time-averaged lift ( $\bar {C}_{L}$) and transverse position ( $\bar {Y}$) are not zero in the asymmetric case ( $\alpha \neq 0^{\circ }, 180^{\circ }$). Therefore, the prism oscillation with respect to the mean position, i.e. $Y^{\prime }$ (= $Y-\bar {Y}$), depends on the energy exchange between the prism and fluid. Following the definition in Bourguet & Lo Jacono (Reference Bourguet and Lo Jacono2014), the energy transfer is valued by the lift coefficient in phase with the prism velocity, which is defined as $C_{L,V}={\sqrt {2}\tilde {C}_LV}/{\sqrt {\overline {V^{2}}}}$, with $\tilde {C}_L = C_L-\bar {C}_L$ and $V=\dot {Y}$. Positive and negative $C_{L,V}$ indicate the fluid exciting and damping the oscillation, respectively. Consequently, physical mechanisms for the excitation and inhibition caused by the fluid can be analysed through the variations of vorticity fields and the lift coefficient in phase with the prism velocity.
As shown in figure 17(a,c), in the increasing and decreasing cases, the vibration amplitudes and frequencies at  $\alpha = 40^{\circ }$ and $U^* = 8.0$ are different. The same is observed for the streamwise vibration. More evidence regarding the differences is displayed in figures 3(c,d) and 6(e, f). As shown in figure 17(a), when the prism moves from the top to the bottom, $C_{L,V}$ is first positive and then negative. On the other hand, when the prism moves back from the bottom, $C_{L,V}$ changes twice, i.e. positive $\rightarrow$ negative $\rightarrow$ positive $\rightarrow$ negative, which suggests significantly different vortex dynamics. Additionally, the magnitude of $C_{L,V}$ in the second half-period is much smaller than that in the first half-period. Especially, when the prism velocity grows (instant i), the lower shear layer remains attached to the curved surface and rolls over the flat surface while the upper shear layer separating from the upper corner rolls away from the prism. The pressure on the lower side is thus lower than that on the upper side, making positive $C_{L,V}$. After the prism passes through the mean position, the prism velocity decreases gradually. At instant ii, the upper shear layer is attached on both curved and flat surfaces while the lower shear layer rolls behind, which yields negative $C_{L,V}$. At instants iii and iv, the prism moves towards the mean position with growing velocity magnitude. The upper shear layer closely follows the upper curved and flat surfaces and the stagnation point shifts toward the upper corner. The lift force thus changes from positive to negative between instants iii and iv, resulting in positive and negative $C_{L,V}$, respectively.
Time histories of the fluctuating lift coefficient ( $\tilde {C}_L$, dashed line), lift coefficient in phase with the velocity ( $C_{L,V}$, solid line), displacement ( $y/D$ and $y^{\prime }/D$) and vorticity contours at marked instants at $\alpha = 40^{\circ }$ and $U^* = 8.0$. (a,b) For the increasing $U^*$ case and (c,d) for the decreasing $U^*$ case. The grey vertical lines in (a,c) denote the borders of the half-period.
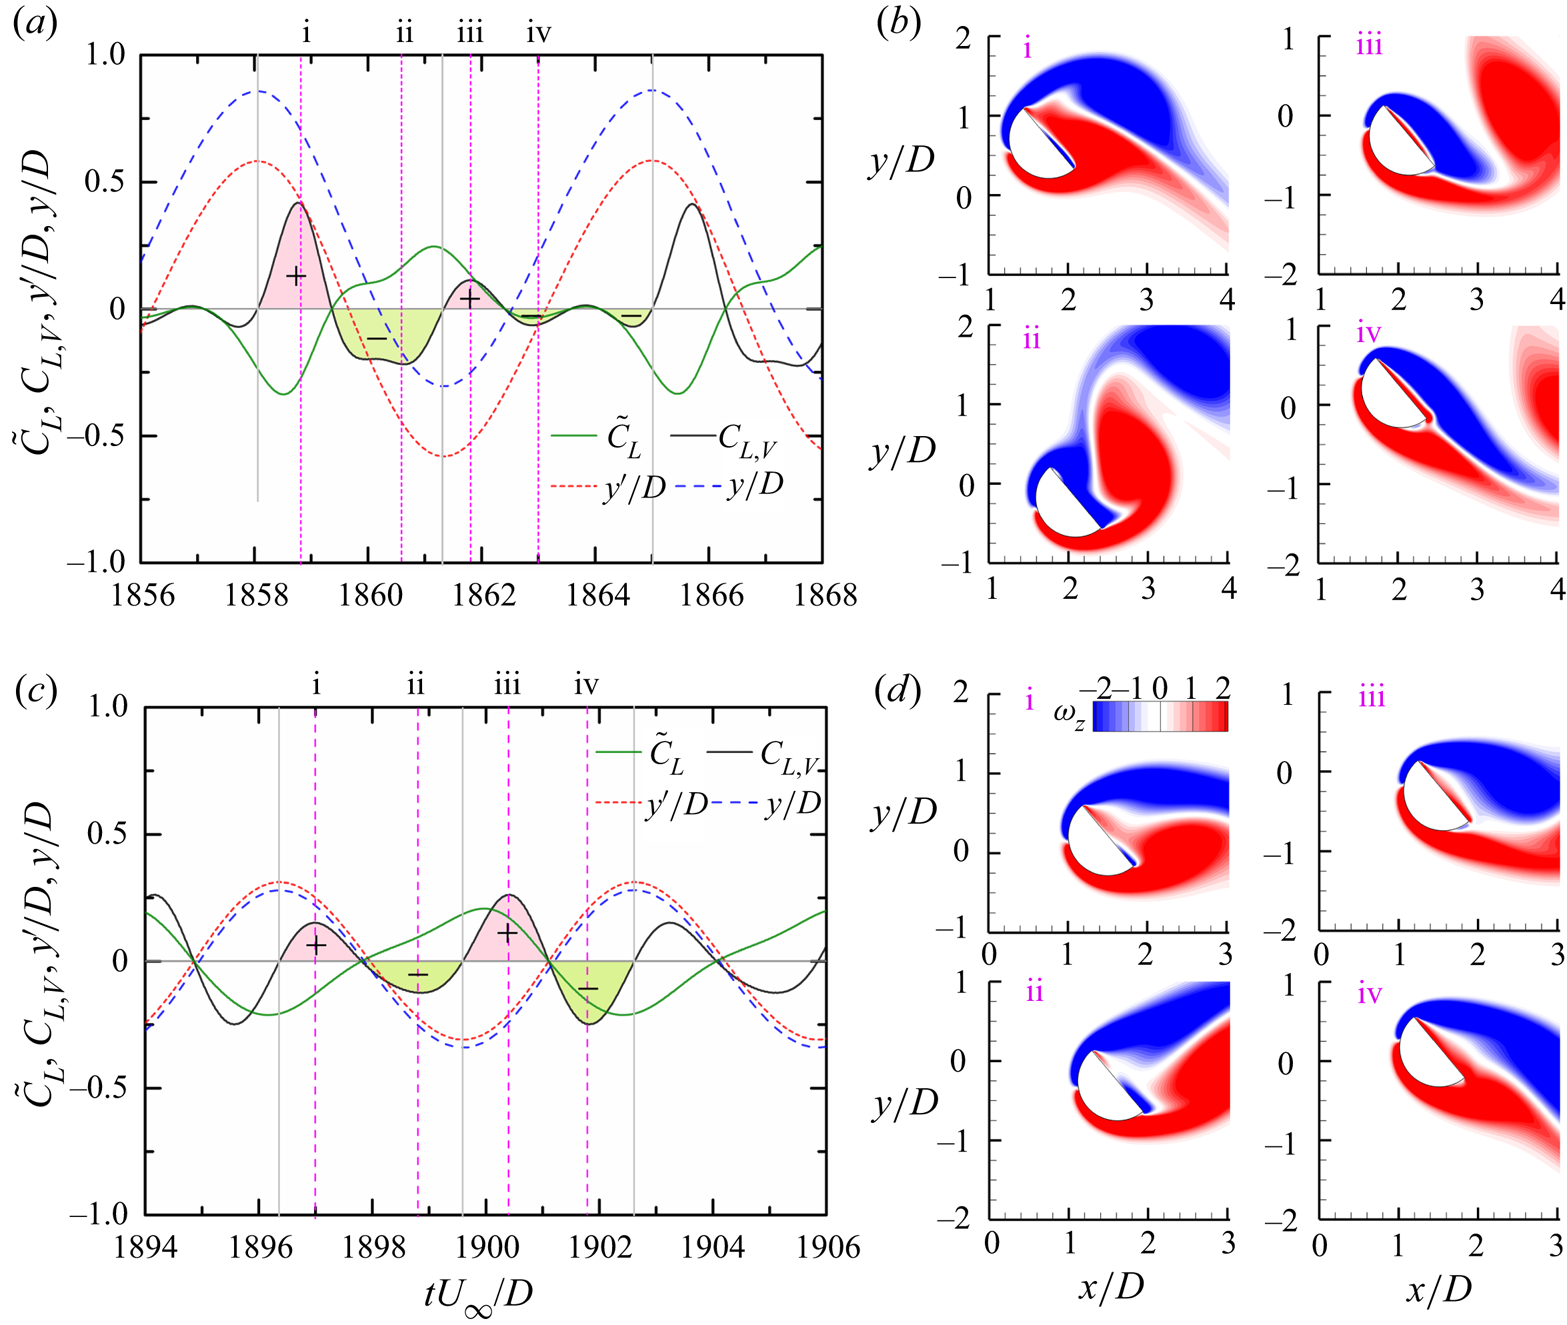
In the decreasing case, however, the variation in  $C_{L,V}$ becomes more regular (figure 17c). The $C_{L,V}$ is positive when the prism moves towards the mean position while negative when the prism moves away from the mean position. At instant i, as the prism moves toward the mean position, the lower shear layer is attached on the curved surface while the upper shear layer separates from the upper corner owing to the growing transverse velocity in the downward direction. The $C_{L,V}$ is thus positive. When the prism is below the mean position (instant ii), the upper and lower shear layers separate from the upper and lower corners, respectively, almost symmetrically. The lift force is positive, largely due to the negative pressure on the flat surface, resulting in negative $C_{L,V}$. In the following half-period, i.e. bottom $\rightarrow$ top, a similar change is observed. However, due to the influences of the separation (instant iii) and entrainment (to the flat part, instant iv) of the shear layer on the lower side, the magnitude of $C_{L,V}$ is larger than that in the former half-period (top $\rightarrow$ bottom).
From the above discussion, it is understood that in the increasing case, the upper shear layer largely reattaches onto the flat surface and the lower shear layer follows the curved surface (instants ii–iv). In the decreasing case only weak reattachments of the lower shear layer onto the flat part are observed (instants i, iv). In addition, the separation locations of the lower shear layer show discrepancies between the increasing and decreasing cases (figure 17b,d). These factors are essentially responsible for the sustenance of the hysteresis. Furthermore, we note that the prism vibration is synchronized with the vortex formation. The excitation and inhibition caused by the fluid are closely related to dynamic changes in the shear layers, such as reattachment, entrainment and separation. We can infer that the lock-in in the increasing case is largely associated with the shear layer reattachment, upholding our statement in § 3 for the occurrence of lock-in.
The second hysteresis discussed here is in the transverse-only galloping regime where the wake in both the increasing and decreasing cases is the 4S+4S mode and two distinctive states are related to the dynamic changes of shear layer reattachment. As shown in figure 18(a,b),  $C_{L,V}$ is repeatable in each half-period, signifying that the vibration period is four times that of the lift responsible for the response. However, for the two states, the variations in $C_{L,V}$ are significantly different. In the increasing case, $C_{L,V}$ is firstly negative when the prism moves upward from the bottom and then positive as the prism is around the mean position (figure 18a). It changes into negative before the prism approaches the top. As shown in figure 18(c), the positive and negative $C_{L,V}$ are reflected by the shear layer reattachment modifications. For example, at instant ii, when the prism is moving toward the mean position, the upper shear layer closely follows most of the curved surface while the lower shear layer separates from the lower corner. Consequently, the pressure at the upper side is lower than that at the lower side, and the resultant lift is in phase with the prism velocity. The vibration is promoted by the energy extracted from the fluid. However, in the decreasing case the variation in $C_{L,V}$ is roughly opposite to that in the increasing case, suggesting distinct vortex dynamics relative to the prism motion from those in the increasing case. As shown in figure 18(d), when the prism moves back from the top, the lower shear layer remains attached on the entire curved surface (instant i), yielding positive $C_{L,V}$. However, when the prism is near the mean position (instant ii), the lower shear layer separates from the curved surface and there is an initiation of the upper shear layer rolling close to the upper corner. It corresponds to positive lift force and negative $C_{L,V}$, given that the prism velocity is negative. From the description, we can see that the two states are caused by the dynamic changes of shear layer reattachment.
(a,b) Time histories of the fluctuating lift coefficient ( $\tilde {C}_L$, dashed line), lift coefficient in phase with the prism velocity ( $C_{L,V}$, solid line) and the displacement ( $y/D$), and (c,d) vorticity contours at the instants marked in (a,b) at $\alpha = 180^{\circ }$ and $U^* = 14.0$. (a,c) For the increasing case and (b,d) for the decreasing case. In this case, the prism symmetry recovers and the mean displacement position ( $\bar {Y}$) is zero. The grey vertical lines in (a,b) denote the borders of the half-period.
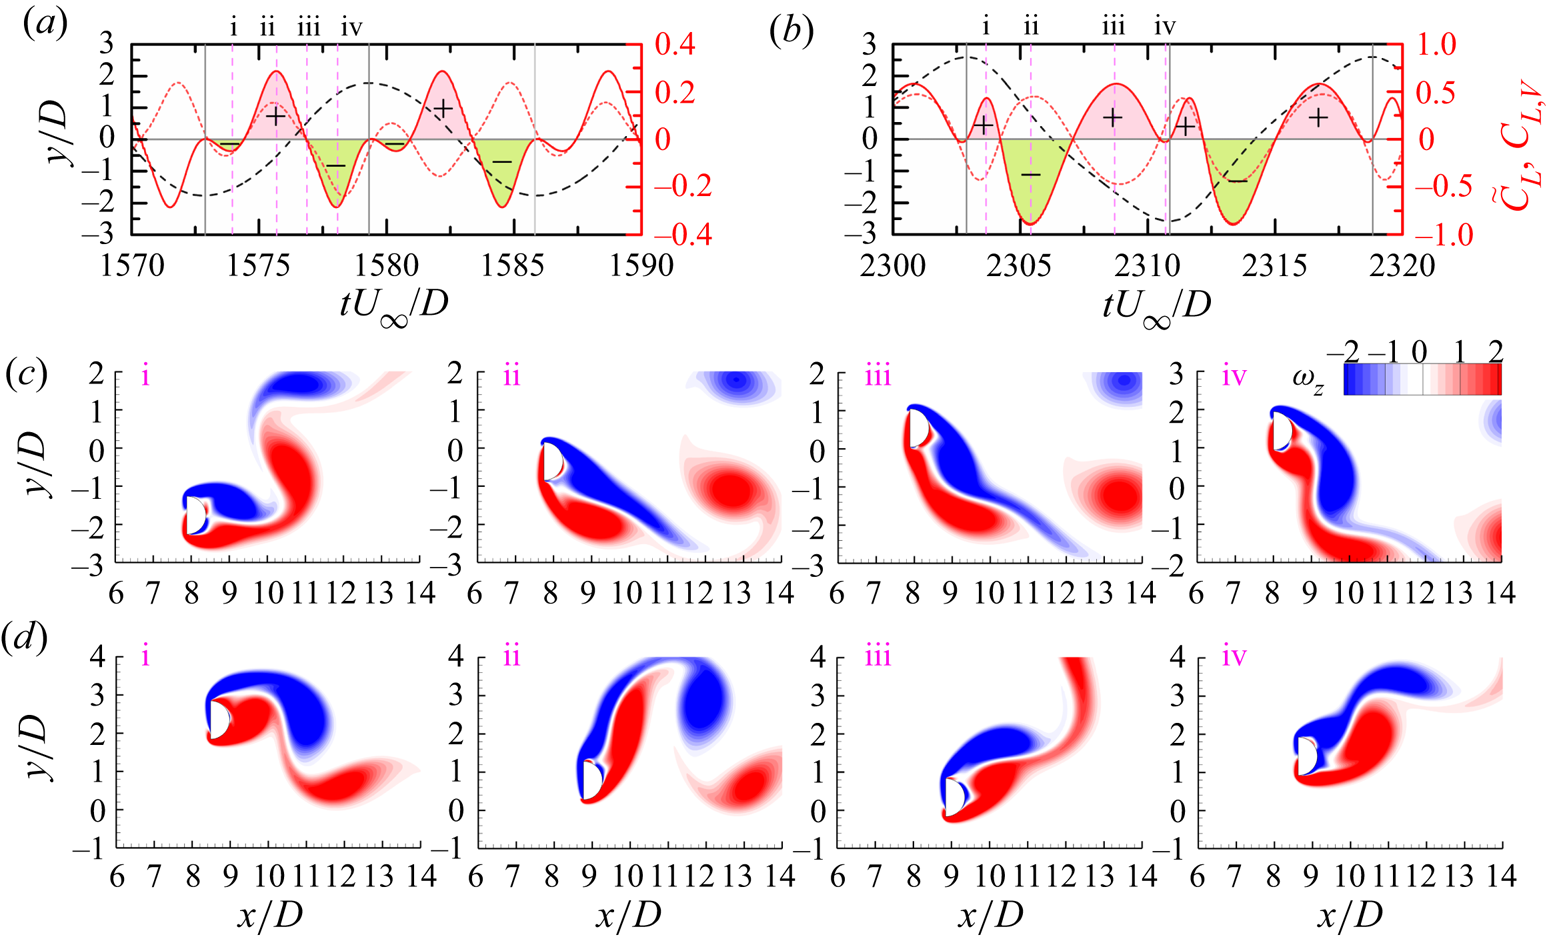
4.2.2. Mechanism for the intermittency in the transverse-only galloping
An intermittent response is noted at  $\alpha = 165^{\circ }\unicode{x2013}180^{\circ }$ and $U^* = 5.7\unicode{x2013}7.5$, as marked by the straight lines in figure 15. In this section we aim to unearth the physical mechanism for the intermittent behaviour with the help of dynamic mode decomposition (DMD) and wavelet transform (WT). Dynamic mode decomposition is an effective method to capture flow modes of different frequencies (Rowley et al. Reference Rowley, Mezic, Bagheri, Schlatter and Henningson2009; Schmid Reference Schmid2010; Jovanovic, Schmid & Nichols Reference Jovanovic, Schmid and Nichols2014). Therefore, DMD can provide flow modes with pure frequency contents. In this paper we use the codes for the DMD analysis provided by Jovanovic et al. (Reference Jovanovic, Schmid and Nichols2014). In each DMD analysis, 400 snapshots are collected with a non-dimensional time interval of 0.2. Details of WT can be found in Chen et al. (Reference Chen, Ji, Xu, Liu and Campbell2015). Figure 19(a) shows the time histories of the streamwise and transverse displacements. We can see that the vibration changes intermittently between two different states. In state I the vibration is regular but with a smaller amplitude in the streamwise direction. The figure-‘8’ trajectory of the displacements shown in figure 19(b) further supports this fact. However, in state II the vibration is chaotic, as suggested by the chaotic trajectory of the displacements shown in figure 19(c). The wake modes in the two states are the P+S and 2P modes, respectively (figure 19b,c).
(a) Time histories of the streamwise and transverse displacements, (b,c) instantaneous vorticity contours and trajectories of the displacement for states I and II, (d,e) WT results of the streamwise and transverse displacements and ( f,g) DMD modes of states I and II, respectively, at  $\alpha = 165^{\circ }$ and $U^* = 6.0$.
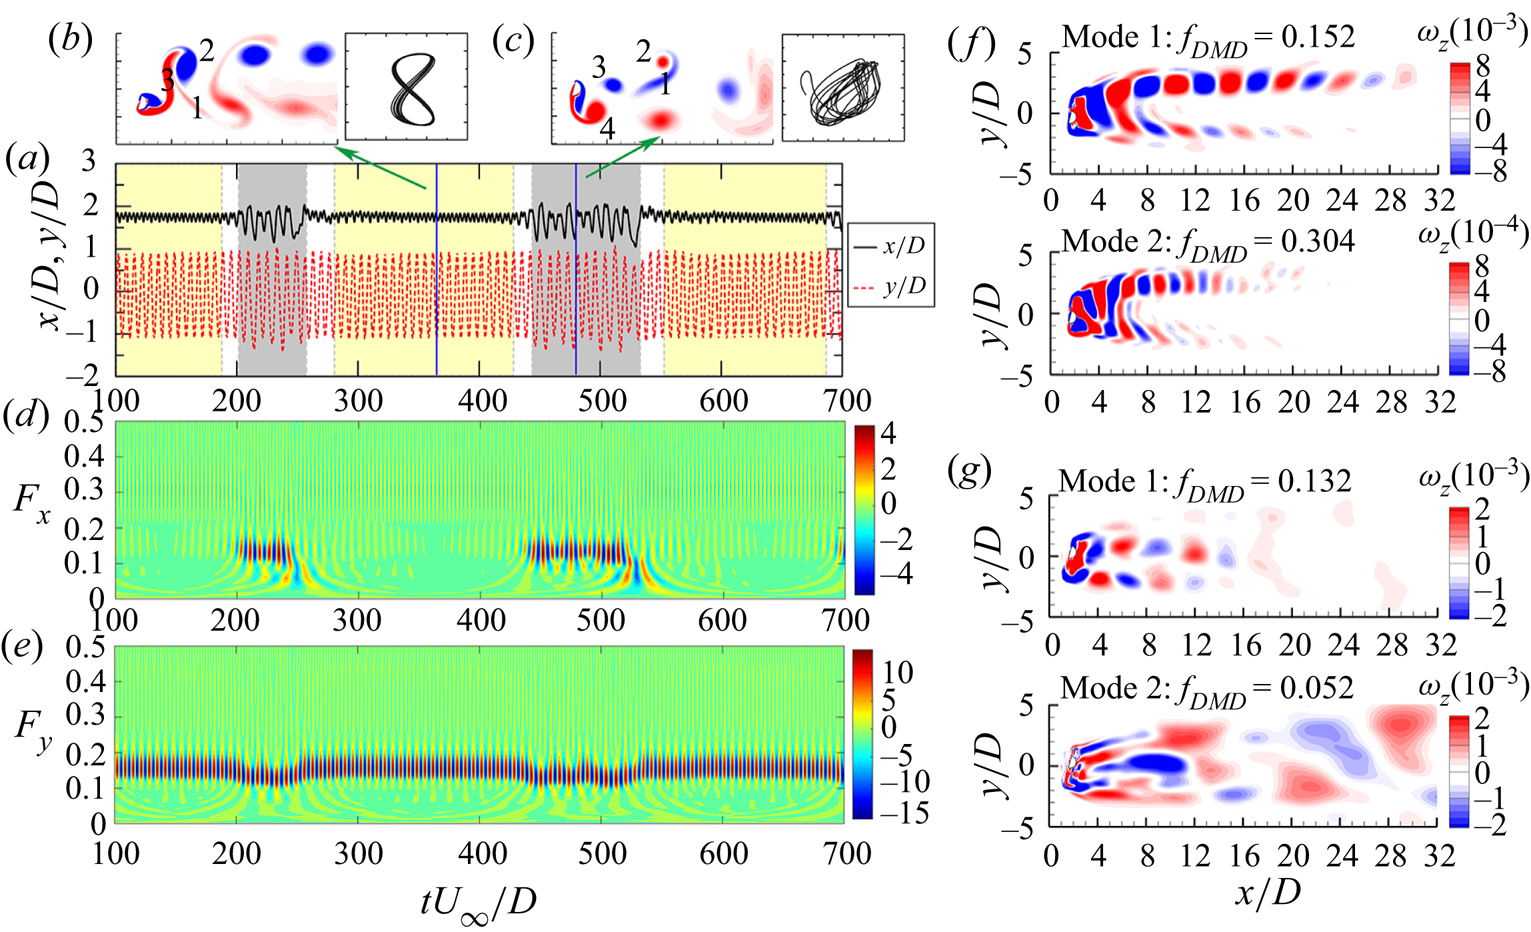
More information is provided by the WT analysis. In state I the streamwise vibration is dominated by the second harmonic frequency ( $F_x = 0.304$), with its amplitude much higher than that of the fundamental frequency ( $F_x = 0.152$), while the transverse vibration has only the fundamental frequency, which agrees well with the periodic response (figure 19d,e). In state II the dominant frequency ( $F_y = 0.132$) of the transverse vibration is slightly lower than that in state I, while other frequencies are still insignificant. The fundamental frequency $F_x = 0.132$ appears for the streamwise vibration, in addition to a lower frequency $F_x = 0.052$ at the transition between states I and II. The DMD modes corresponding to the frequencies observed in WT analysis are shown in figure 19( f,g). In state I the mode at $f_{DMD} = 0.152$ clearly shows the typical Kármán vortex street. However, owing to the asymmetry of the cross-section shape to the incoming flow, vortices shed from the upper side of the prism are stronger than those from the lower side. Correspondingly, the extracted mode is asymmetric. The mode at $f_{DMD} = 0.304$ is of the second harmonic frequency, which is featured by doubled vortices in the wake. In state II, owing to the irregular arrangement of vortices, the mode at $f_{DMD} = 0.132$ dominated in the streamwise and transverse vibrations exhibits a Kármán-like vortex street; the mode at $f_{DMD} = 0.052$ is significantly different. As shown in figure 19(g), in this low-frequency mode the vorticity energy is stronger at $x/D \gtrsim 7.0$, which positively suggests that it comes from unstable vortex interactions in a relatively far wake. This is not surprising when considering the irregular vortex arrangement in state II. Since the vortex interactions are not stable, the developed low-frequency component can impact the vortex shedding through the feedback mechanism (Ho & Huerre Reference Ho and Huerre1984; Huerre & Monkewitz Reference Huerre and Monkewitz1990), which leads to vortex street modification gradually. That is, because of the unstable vortex interactions, the two states are neutrally unstable, and accordingly, they appear intermittently.
4.2.3. Mechanism for the dual galloping
As discussed in § 3.3, the prism at  $\alpha = 70^{\circ }$ displays galloping responses in both streamwise and transverse directions. In this section we aim to uncover the physical mechanism for this dual galloping. The case at $\alpha = 70^{\circ }$ and $U^* = 8.0$ is selected. Here, it should be mentioned that due to the strong asymmetry of the cross-section to the incoming flow, the instantaneous pressure $C_p$ on the prism surface is not appropriate for evaluating the work done by the fluid, rather the time-averaged pressure $\bar {C}_{p}$ must be subtracted from $C_p$.
As shown in figure 20(a,b), both the streamwise and transverse displacements are relatively periodic, with large amplitudes, and the vibrations of the two directions show a strong coupling. Firstly, we focus on the streamwise galloping. When the prism moves upstream (instant i), the streamwise velocity increases gradually and the upper shear layer remains reattached on the flat surface before separating from the lower corner. Therefore, the fluctuating pressure  $C_p-\bar {C}_{p}$ on the flat surface is much lower than that on the curved surface (figure 20e). The $C_{D,U}$ is thus highly negative. After the prism crosses the mean streamwise position (instant ii), the prism velocity reduces and the lower shear layer separates earlier, which leads to $C_p-\bar {C}_{p}$ on the curved surface decreased at $\theta < 62^{\circ }$. The upper shear layer elongates and rolls behind the lower vortex, leading to a higher $C_p-\bar {C}_{p}$ on the flat surface (figure 20c,e), and hence, a small positive $C_{D,U}$ until the prism reaches the upstream position (figure 20a). However, when the prism moves downstream (instant iii), the intensity of the lower shear layer reaches roughly the peak, and because of the decreased transverse velocity, a small part of the lower shear layer is entrained onto the flat surface (figure 20c). Accordingly, the upper shear layer is forced to separate from the upper corner. The $C_p-\bar {C}_{p}$ on the flat surface is thus further increased continuously while that on the curved surface decreases, especially at $\theta < 40^{\circ }$. Therefore, $C_{D,U}$ changes into a small negative. As the prism crosses the mean position (instant iv), the prism velocities in both directions decrease, and the lower shear layer partly moves further toward the flat surface and partly goes downstream. Therefore, the $C_p-\bar {C}_{p}$ on the flat surface notably increases for $y_i> -0.21$ while that at the curved surface goes significantly lower, especially at $\theta < 45^{\circ }$ and $\theta > 135^{\circ }$, thus resulting in a positive $C_{D,U}$.
(a,b) Time histories of the fluctuating drag coefficient ( $\tilde {C}_D$), the drag coefficient in phase with the streamwise velocity ( $C_{D,U}$), the streamwise displacement ( $x^{\prime }/D$), the fluctuating lift coefficient ( $\tilde {C}_L$), the lift coefficient in phase with the transverse velocity ( $C_{L,V}$) and the transverse displacement ( $y^{\prime }/D$), and (c,d) vorticity contours at instants marked in (a,b) at $\alpha = 70^{\circ }$ and $U^* = 8.0$. The time-averaged streamwise and transverse displacements are $\bar {X} = 1.075$ and $\bar {Y} = 0.271$, respectively, which are not removed in the vorticity fields shown in (c,d). (e, f) The fluctuating pressure coefficient ( $C_p-\bar {C}_{p}$, where $C_p = (p-p_\infty )/0.5\rho U_\infty ^{2}$ is the instantaneous pressure on the surface and $\bar {C}_{p}$ is the time-averaged pressure on the surface) along the curved surface ( $\theta = 0^{\circ }\sim 180^{\circ }$) and flat surface ( $y_i = -0.5\sim 0.5$) at instants marked in (a,b). Here, $\theta = 0^{\circ }$ and $180^{\circ }$, rotating counterclockwise, are at the upper (P2) and lower (P1) intersection points, while $y_i$ = $-$0.5 and 0.5, positive upward, are at the lower (P1) and upper (P2) intersection points, respectively; see the subplot in ( f).

Then, we look at the transverse galloping. As shown in figure 20(b), when the prism moves toward the mean position (instant v), the transverse velocity rapidly increases and the upper shear layer remains attached on the flat surface. The lower shear layer covers a major part of the curved surface; therefore, the  $C_p-\bar {C}_{p}$ is relatively weak, especially at $45^{\circ } < \theta < 150^{\circ }$ (figure 20f), thus leading to a negative $C_{L,V}$. When the prism crosses the transverse mean position (instant vi), the upper shear layer goes weaker while the lower shear layer develops (figure 20d). Accordingly, the $C_p-\bar {C}_{p}$ on the flat surface increases for $y_i< 0.15$ while that on the curved surface significantly decreases at $\theta < 45^{\circ }$ and increases at $45^{\circ } < \theta < 180^{\circ }$ (figure 20f). The $C_{L,V}$ becomes positive. At instant vii, the prism moves back from the top position and the lower shear layer is entrained onto the flat surface, which leads to $C_p-\bar {C}_{p}$ being roughly zero. The $C_p-\bar {C}_{p}$ on the curved surface remains positive in a wider region, i.e. $50^{\circ } < \theta < 135^{\circ }$, which is opposite to the prism transverse velocity, thus, $C_{L,V}$ being negative. As the prism moves downstream (instant viii), the $C_p-\bar {C}_{p}$ on the flat surface increases further for $y_i>$ $-$0.25 while the lower shear layer decreases greatly for $\theta > 90^{\circ }$. As a result, $C_{L,V}$ becomes strongly positive.
The above analysis indicates that galloping in both directions is associated with the dynamics of shear layer development, attachment and entrainment, which leads to significant pressure fluctuations and are responsible for the sustenance of large-amplitude vibrations. This is different from the dynamics in the transverse-only galloping where multiple shear layer reattachments appear along with manifold vortices (Chen et al. Reference Chen, Ji, Alam, Xu, An and Tong2022b). To illuminate the modifications of the prism oscillation in sustaining the growing amplitude, figure 21 shows the dependence of the vibration amplitude on the phase lag ( $\varphi _{xy}$) between the streamwise and transverse displacements. The phase lag was calculated directly using the Hilbert transform of the displacements in the streamwise and transverse directions (Khalak & Williamson Reference Khalak and Williamson1999; Prasanth & Mittal Reference Prasanth and Mittal2008). Generally, the dependence can be divided into four regions. When the vibration amplitude is small (region i), $\varphi _{xy}$ shows significant variations. However, when the amplitude is intermediate (region ii), $\varphi _{xy}$ decreases gradually. At the two regions (regions iii and iv) with large amplitudes, $\varphi _{xy}$ is approximately constant. In region iv the amplitude is significantly large and $\varphi _{xy}$ displays strong fluctuations, signifying a modulation to sustain higher amplitudes.
Dependence of the phase lag ( $\varphi _{xy}$) between the streamwise and transverse displacements on (a) $A_x^{*}$ and (b) $A_y^{*}$ at $\alpha = 70^{\circ }$ for the dual galloping.
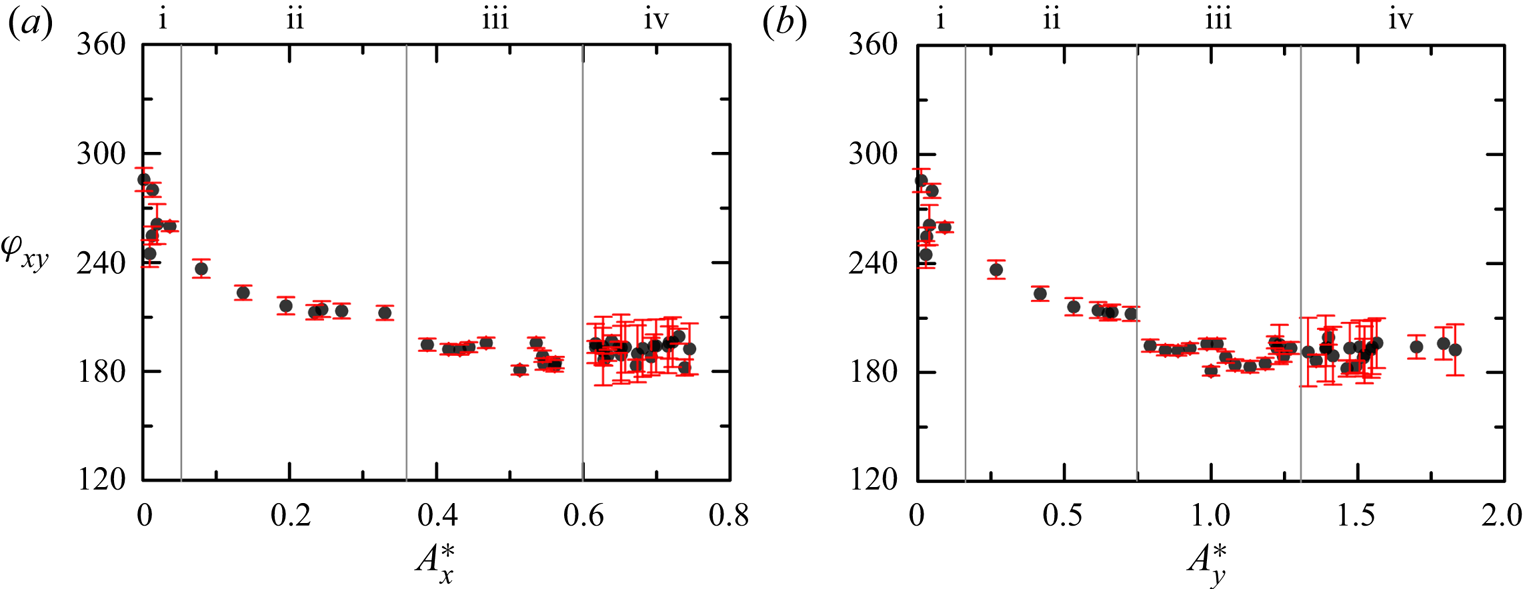
4.3. Dependence of wake modes on vibration amplitudes and frequencies
In this section we explore the dependence of wake modes on vibration amplitudes and frequencies. As discussed in § 3, in some  $U^*$ cases, the transverse amplitude is comparable to the streamwise amplitude, such as in the transition response and dual galloping regimes. There may exist influences of the streamwise vibration on the wake modes. However, it is rather difficult to quantify the coupled impacts. In this study, $A_y^{*}$ and $f_y^{*}$ are applied to explore the dependence. For comparison, the dependence of wake modes in the 1DOF case is superimposed.
According to the compiled map of the circular cylinder wake for low Reynolds numbers given by Williamson & Govardhan (Reference Williamson and Govardhan2004), the 2S mode can persist up to the amplitude of 0.6 and beyond which the P+S mode dominates. Leontini et al. (Reference Leontini, Stewart, Thompson and Hourigan2006a) demonstrated that the critical amplitude for the transition from the 2S to P+S mode depends on  ${Re}$. Govardhan & Williamson (Reference Govardhan and Williamson2000) showed that the shear layers of a circular cylinder with a higher amplitude are easier to be stretched and split into small parts, because of the intense strain rate field. In other words, more vortices shed from a vibrating circular cylinder require a higher amplitude. However, in the FIV of a non-circular prism, the wake dependence becomes different, due to the change of the cross-section shape to the incoming flow (Chen et al. Reference Chen, Ji, Xu, Zhang and Wei2020a, Reference Chen, Ji, Alam, Xu, An and Tong2022b). As shown in figure 22(a), the 2S mode occurs in a wide frequency range, depending on maximum $A_y^{*}$, which is similar to that of the 1DOF case. As the amplitude increases, the frequency range rapidly narrows and finally collapses to $f_y^{*} \approx 0.9$, falling inside the lock-in region. However, the largest amplitude for the 2S mode is 0.9, which is 50 % higher than that for a circular cylinder, suggesting the cross-section influences on the critical amplitude for the 2S mode.
Dependence of the wake modes on  $A_y^{*}$ and $f_y^{*}$. The modes in (d) belong to the $m{\rm S}+ n{\rm S}$ mode where $m$ and $n$ are positive integers and $m + n \ge 5$. The open circles denote the wake distributions of the 1DOF case.
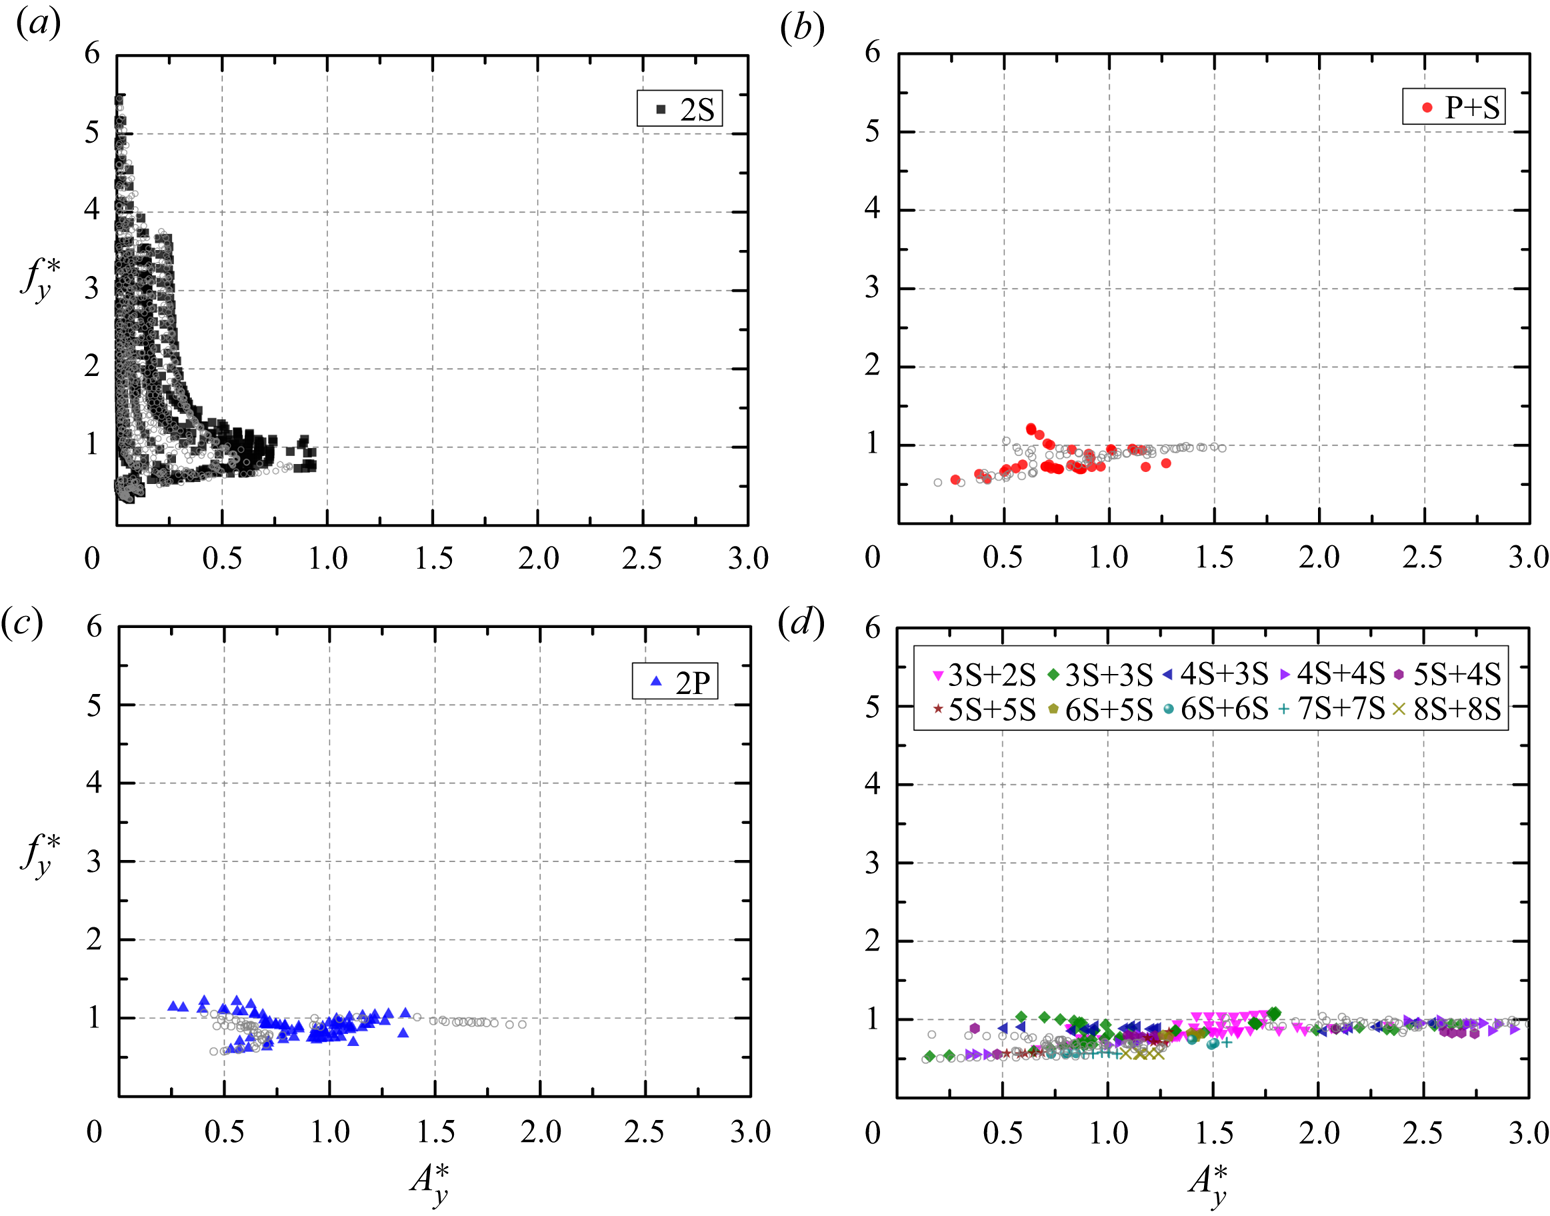
For the P+S mode, Williamson & Govardhan (Reference Williamson and Govardhan2004) believed it does not appear in the VIV of a circular cylinder for the reason that it does not deliver positive energy to excite a free vibration. However, owing to the symmetry breaking of the cross-section, the P+S mode is frequently encountered in the FIV of a non-circular prism (Nemes et al. Reference Nemes, Zhao, Lo Jacono and Sheridan2012; Wang et al. Reference Wang, Zhao, Yang and Yu2015; Zhao Reference Zhao2015; Seyed-Aghazadeh et al. Reference Seyed-Aghazadeh, Carlson and Modarres-Sadeghi2017). As shown in figure 22(b), similar to that of the 1DOF case, the amplitude for the P+S mode varies in the range of 0.25–1.3, slightly larger than that for the 2S mode. In the 1DOF case, the P+S mode occurs in a slightly wider amplitude range. The corresponding frequency varies around 0.6–1.2, significantly narrower than that for the 2S mode. This indicates that the P+S mode largely occurs in the lock-in region. As shown in figure 22(c), the dependence of the 2P mode is similar to that for the P+S mode. The amplitude for the 2P mode varies in the range of 0.25–1.36 while most of the cases are located at the region in which the amplitude is larger than 0.85. The occurrence of the 2P mode at the small amplitude (<0.6) indicates that the asymmetry could lower the amplitude requirement. The frequency of the 2P mode is always around 1.0, resting in the lock-in region.
The multi-vortex mode, i.e.  $m$S+
$m$S+ $n$S mode, occurs only in the transition response and three galloping regimes. As shown in figure 22(d), similar to the 1DOF case, the amplitude for the $m$S+
$m$S+ $n$S mode covers a wide amplitude range of 0.16–2.85. The frequency for the $m$S+
$m$S+ $n$S mode can be mainly separated into two, i.e. one is $f_y^{*} \approx 0.7$ while the other is $f_y^{*} \approx 1.0$, both falling inside the lock-in region. The former is in the dual galloping regime while the latter is in the transverse-only galloping regime. Although the amplitude in the region of $f_y^{*} \approx 0.7$ is smaller than that in the region of $f_y^{*} \approx 1.0$, the number ( $m$,
$m$, $n$) of vortices is higher.
5. Fluid forces
In this section we present variations of fluid forces with  $\alpha$ and $U^*$, spectral analyses of the lift and drag coefficients, and the phase lags between the lift and transverse displacement.
5.1. Statistics of fluid forces
Figure 23 shows the dependence of the fluid forces on  $U^*$ and $\alpha$. As shown in figure 23(a), there are two regions where the mean drag coefficient $\bar {C}_{D}$ is relatively large. The first region is in the typical and hysteretic VIV regimes where the curved surface points upstream, while the second region is in the second transition response and transverse-only galloping regimes where the flat surface faces upstream. The $\bar {C}_{D}$ values in the second region are much higher than those in the first region. This is expected as the flow velocity goes to zero when the flow encounters the flat surface and the pressure at the flat surface becomes higher, thus leading to a higher $\bar {C}_{D}$. A significant difference between these two regions is that in the first region the $\bar {C}_{D}$ value is amplitude dependent, the higher the amplitude, the higher the $\bar {C}_{D}$. However, in the second region the dependence of $\bar {C}_{D}$ on the amplitude is not straightforward, decreasing with $U^*$ (>6.0) although the amplitude enhances. With $\alpha$ increasing from $30^{\circ }$ to $90^{\circ }$ where the bluffness of the cross-section reduces, $\bar {C}_{D}$ for regimes ii–vii decreases, not much linked with the amplitude. As shown in figure 23(c), the mean lift coefficient $\bar {C}_{L}$ can be positive or negative, separated by $\alpha \approx 95^{\circ }$. At $\alpha \approx 180^{\circ }$, $\bar {C}_{L}$ is small and negative but still not zero, which stems from the asymmetric vortex shedding, as also reported by Wang et al. (Reference Wang, Zhao, Yang and Yu2015) and Chen et al. (Reference Chen, Ji, Xu, Zhang and Wei2020a). The positive $\bar {C}_{L}$ is more evident in the region where the amplitude is large, indicating the amplitude dependence. The negative $\bar {C}_{L}$ becomes significant at $\alpha = 125^{\circ }\unicode{x2013}145^{\circ }$, resting in the narrowed VIV regime. To some extent, $\bar {C}_{L}$ is largely $\alpha$ dependent as expected.
Dependence of the force coefficients on  $U^* (= 2{-}20)$ and $\alpha$ ( $= 0^{\circ }\unicode{x2013}180^{\circ }$): (a) $\bar {C}_{D}$, (b) $C_{D}^{\prime }$, (c) $\bar {C}_{L}$ and (d) $C_{L}^{\prime }$.
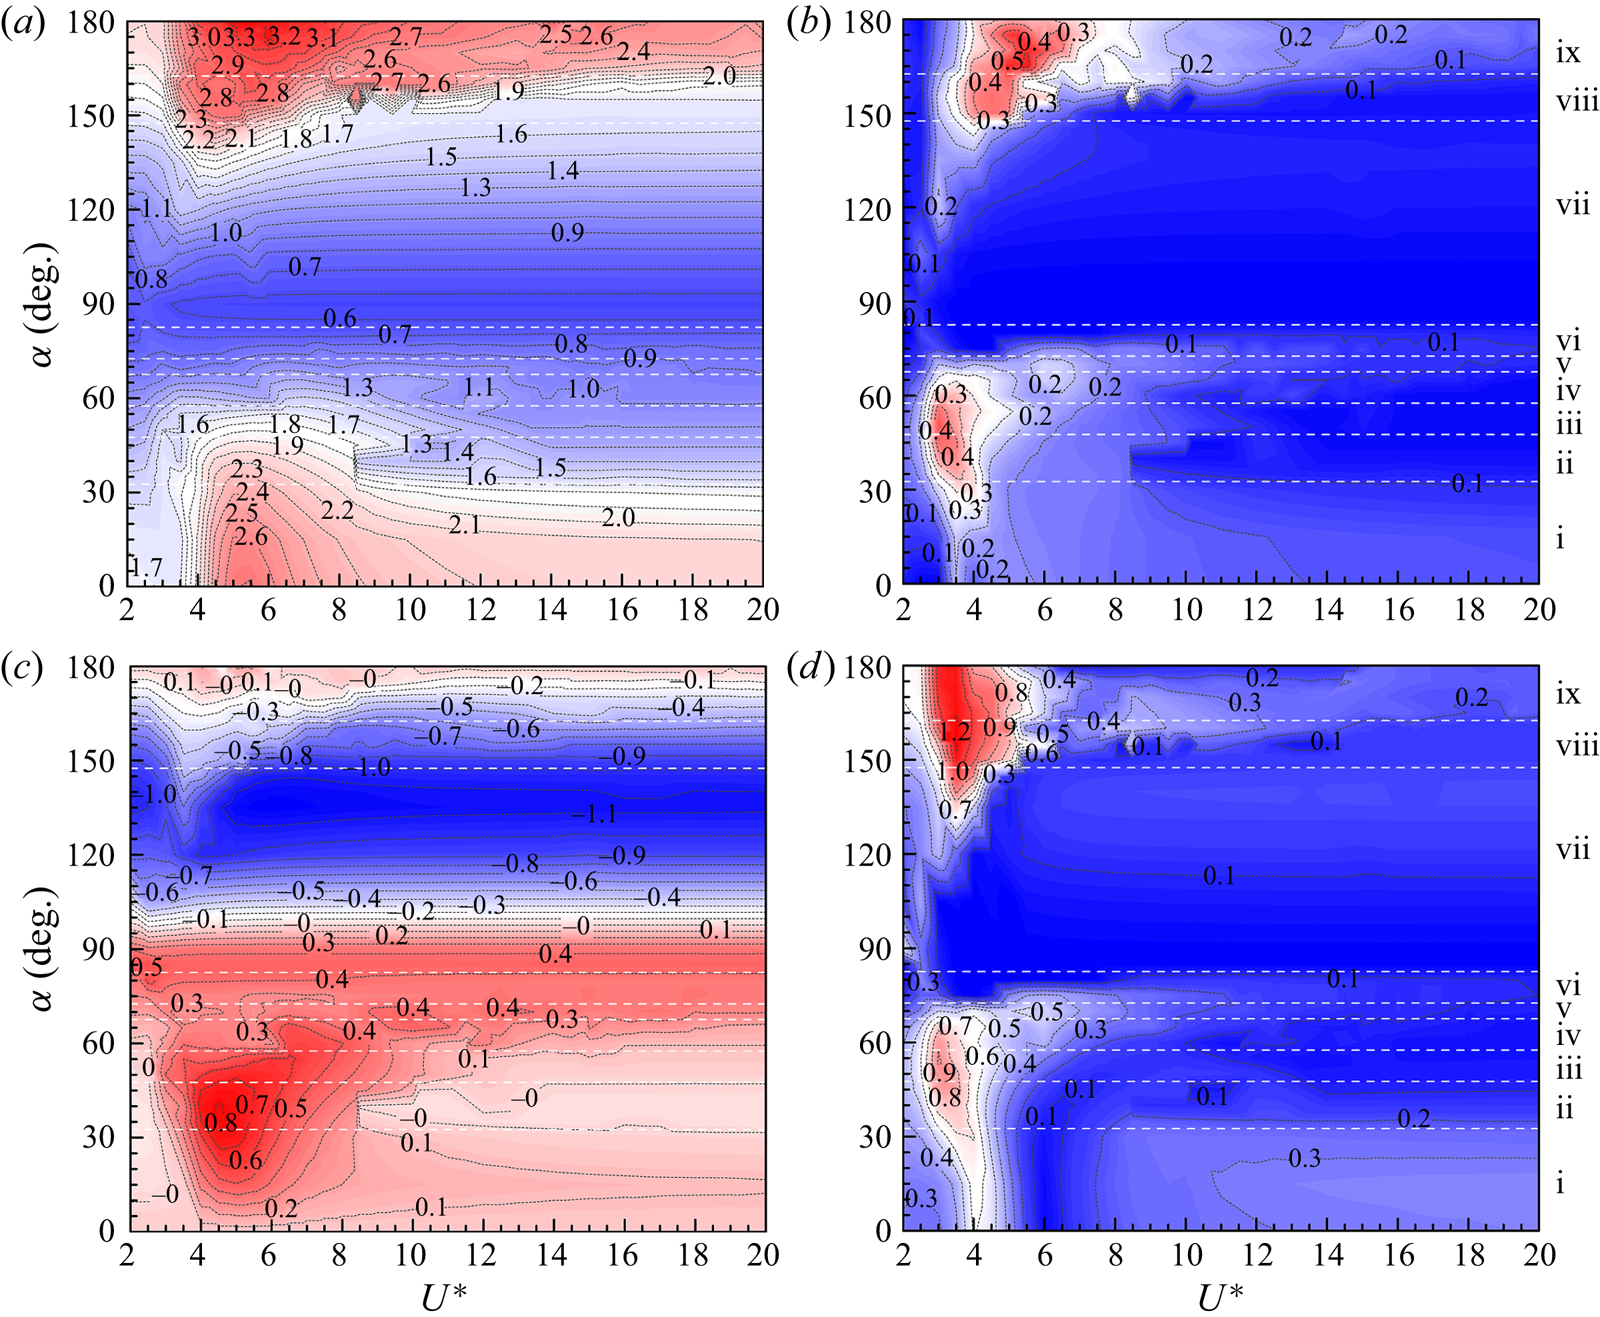
As shown in figure 23(b,d), the variations in  $C_{D}^{\prime }$ and $C_{L}^{\prime }$ are alike. There are two remarkable regions where $C_{D}^{\prime }$ and $C_{L}^{\prime }$ are large. The first region ( $U^* = 2.5\unicode{x2013}5.0$; $\alpha \approx 0^{\circ }\unicode{x2013}65^{\circ }$) lies in regimes i–iv, while the second region is at $U^* = 2.5\unicode{x2013}6.5$ and $\alpha = 135^{\circ }\unicode{x2013}180^{\circ }$, lying in regimes viii–ix. The large $C_{D}^{\prime }$ and $C_{L}^{\prime }$ correspond to the initial branch of VIV. Similar dependence was observed in the 1DOF case (Chen et al. Reference Chen, Ji, Alam, Xu, An and Tong2022b). The distributions of $C_{D}^{\prime }$ and $C_{L}^{\prime }$ show significant dependencies on $U^*$ but trivial dependencies on $\alpha$. The larger $C_{D}^{\prime }$ and $C_{L}^{\prime }$ occur at $U^*\approx 4.0\unicode{x2013}7.5$ and 2.5–5.5, respectively, while smaller $C_{D}^{\prime }$ and $C_{L}^{\prime }$ appear roughly in the narrowed VIV regime, as a result of the smaller amplitude and weaker fluctuation of shear layers. The galloping regimes are accompanied by small $C_{D}^{\prime }$ and $C_{L}^{\prime }$. This indicates that the excitation of the galloping is different from VIV, upheld by the results of Nemes et al. (Reference Nemes, Zhao, Lo Jacono and Sheridan2012), Zhao et al. (Reference Zhao, Leontini, Lo Jacono and Sheridan2014, Reference Zhao, Hourigan and Thompson2018) and Chen et al. (Reference Chen, Ji, Alam, Xu, An and Tong2022b).
5.2. Spectral analysis of fluid forces
Figure 24 shows the contours of dominant frequencies  $f_D^{*}$ ( $= f_D/f_n$) and $f_L^{*}$ ( $= f_L/f_n$) obtained from PSD functions of $C_{D}^{\prime }$ and $C_{L}^{\prime }$, respectively. Generally, $f_D^{*}$ and $f_L^{*}$ are identical in most cases except in the typical VIV regime where $f_D^{*}$ is two times $f_L^{*}$ (Bearman Reference Bearman1984; Naudascher Reference Naudascher1987; Jauvtis & Williamson Reference Jauvtis and Williamson2004; Bourguet Reference Bourguet2020). As shown in figure 25(a,b), in the hysteretic VIV regime, both $f_D^{*}$ and $f_L^{*}$ increase linearly with increasing $U^*$, being $f_D^{*} = 2\times f_L^{*}$ except at $U^* \approx 6.0$ where the third harmonic lift frequency is dominant. At a higher $\alpha$, $f_D^{*}$ and $f_L^{*}$ are identical. An exception is discerned around the location where the phase lag shifts from $0^{\circ }$ to $180^{\circ }$. As shown in figure 25(c–h), the second harmonic lift frequency becomes energetic but still weaker than the fundamental one, i.e. the fundamental drag frequency is more energetic than the second harmonic frequency, although several harmonic frequencies appear. The $f_D^{*}$ and $f_L^{*}$ are thus predominantly identical.
Dependence of (a) drag ( $\,f_D^{*}$) and (b) lift ( $\,f_L^{*}$) frequencies on $U^* (= 2{-}20)$ and $\alpha$ ( $= 0^{\circ }\unicode{x2013}180^{\circ }$). The star symbols represent the location of the phase lag between the lift and displacement jumping from $0^{\circ }$ to $180^{\circ }$.
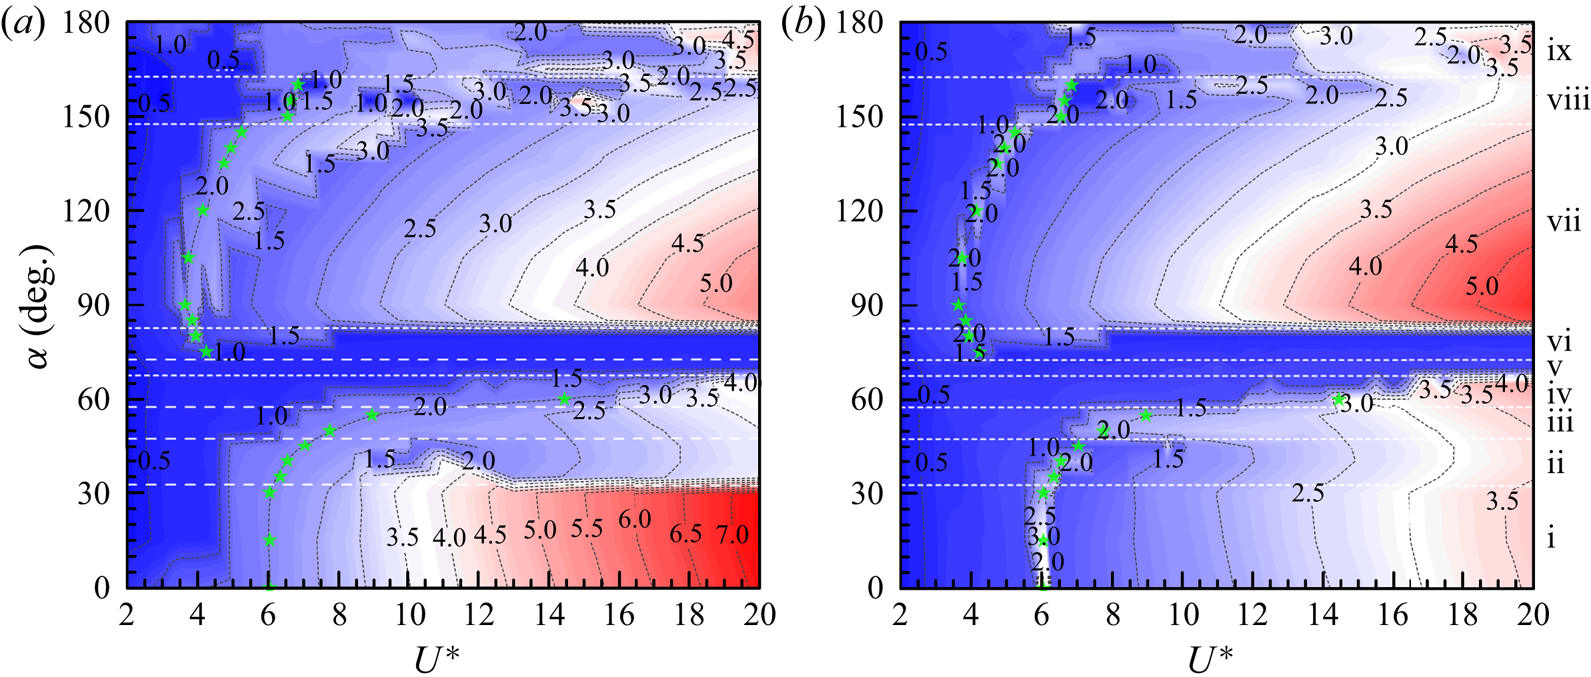
The PSD of the drag and lift coefficients at  $U^* = 2\unicode{x2013}20$ and selected $\alpha$ values. (a,b) Typical VIV at $\alpha = 15^{\circ }$, (c,d) hysteretic VIV at $\alpha = 40^{\circ }$, (e, f) extended VIV at $\alpha = 50^{\circ }$, (g,h) first transition at $\alpha = 60^{\circ }$, (i,j) dual galloping at $\alpha = 70^{\circ }$, (k,l) combined VIV and galloping at $\alpha = 80^{\circ }$, (m,n) narrowed VIV at $\alpha = 105^{\circ }$, (o,p) second transition at $\alpha = 155^{\circ }$ and (q,r) transverse-only galloping at $\alpha = 180^{\circ }$.
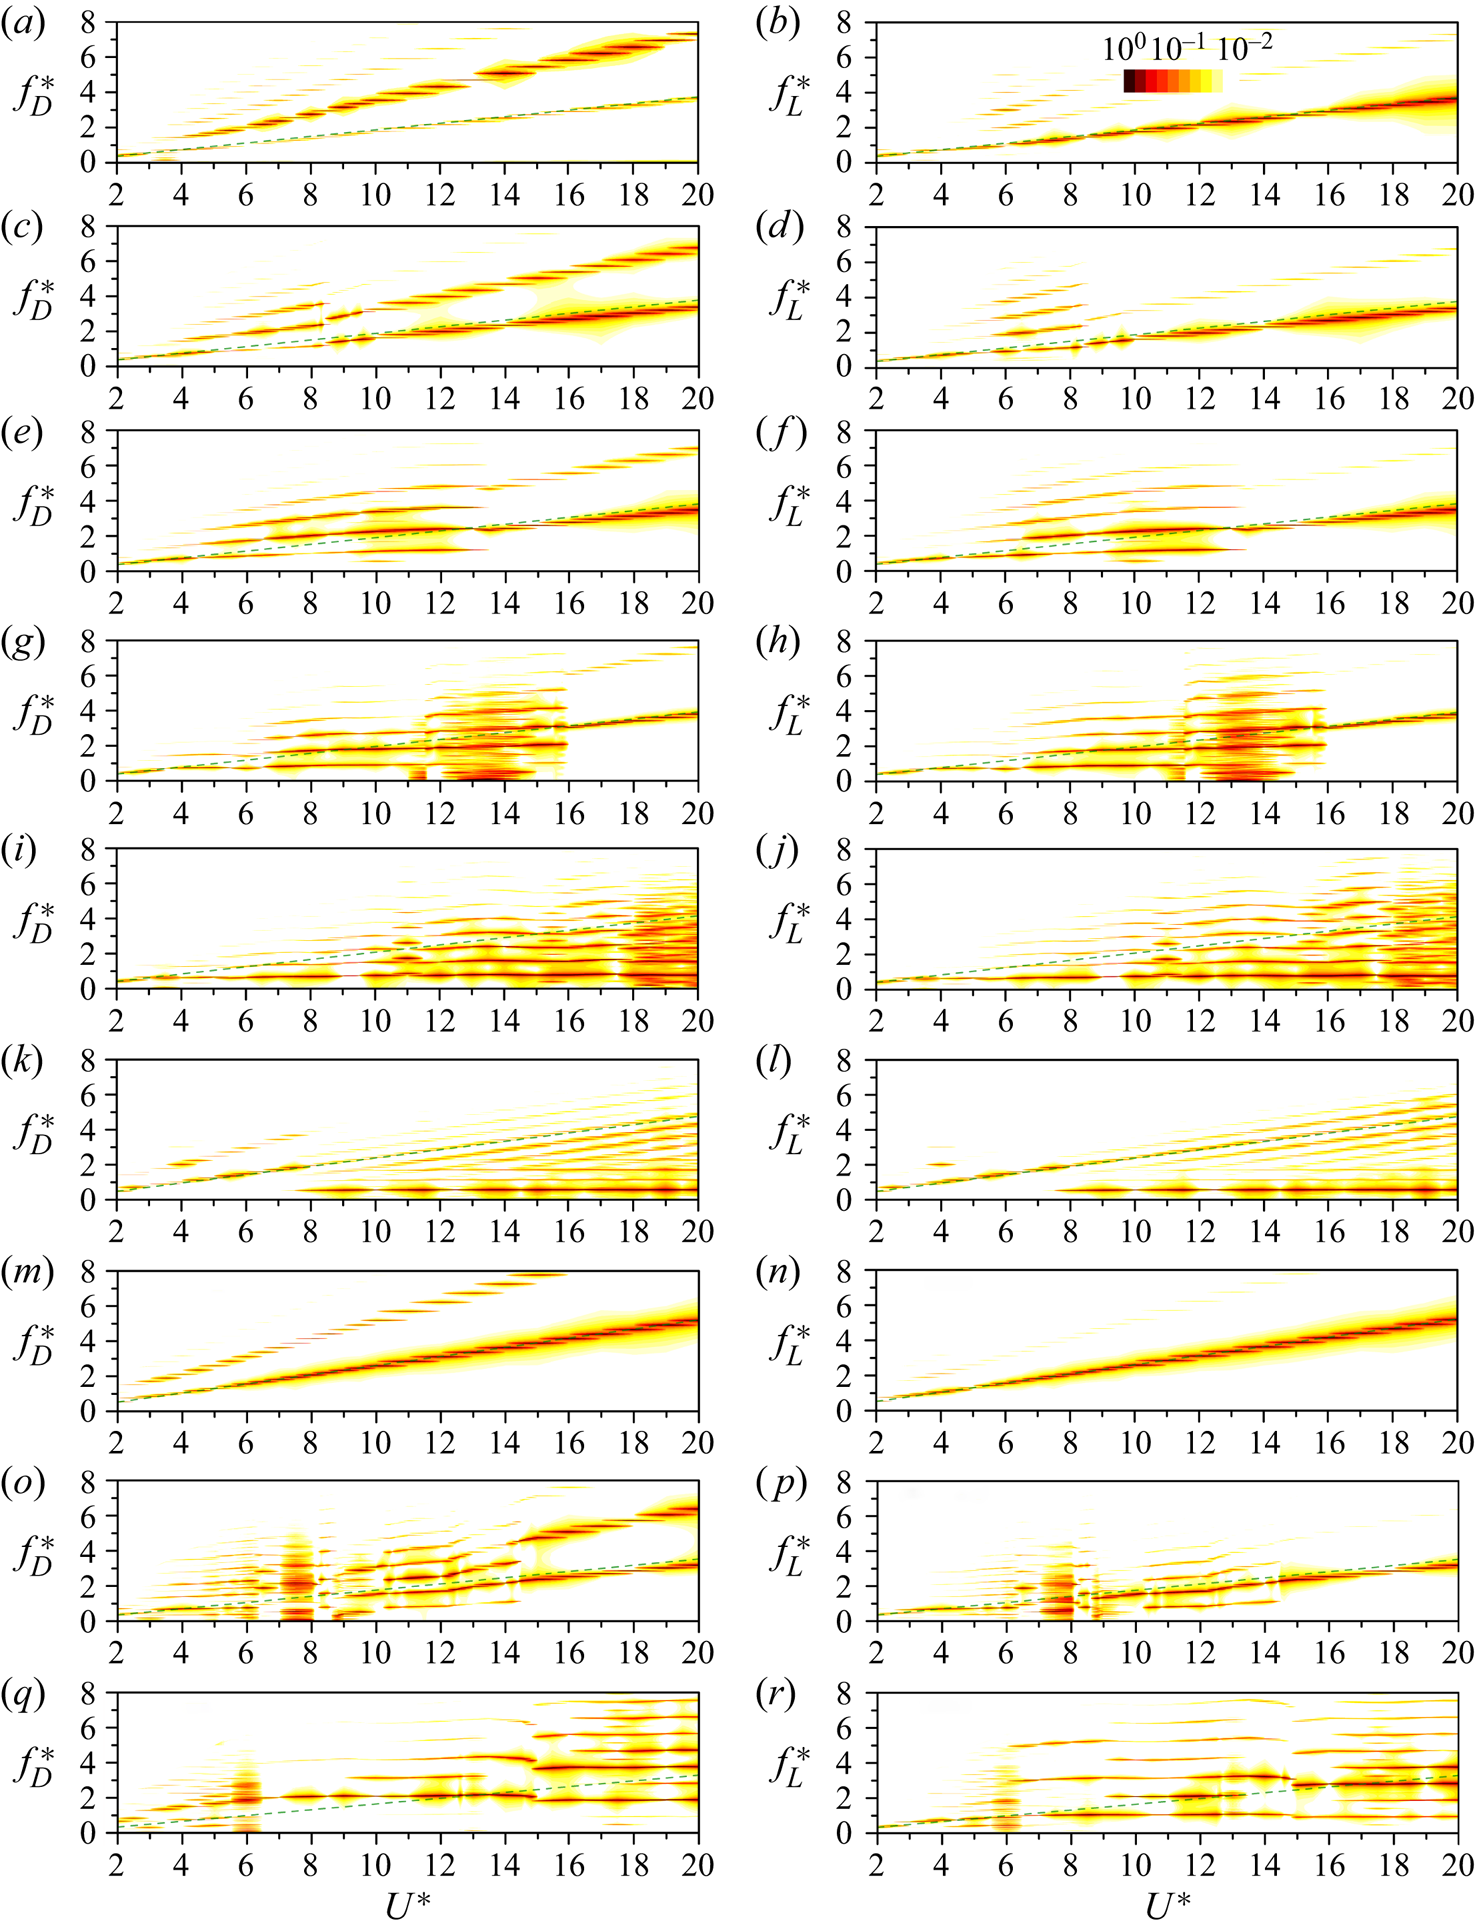
In the dual galloping and combined response regimes, the identical  $f_D^{*}$ and $f_L^{*}$ still stand, but multiple harmonic frequencies are detected (figure 25i–l). In the second transition response and transverse-only galloping regimes, the identical $f_D^{*}$ and $f_L^{*}$ are observed at the small $U^*$ while the relationship between $f_D^{*}$ and $f_L^{*}$ at large $U^*$ is complex, due to complicated vortex interactions in the near wake. As shown in figure 25(o–r), multiple frequencies emerge in the spectra of the drag and lift forces. In the transverse-only galloping regime, higher harmonic frequencies are noted as $U^*$ increases, owing to the growing number of vortices shed from the prism in each vibration cycle (Zhao et al. Reference Zhao, Leontini, Lo Jacono and Sheridan2014, Reference Zhao, Hourigan and Thompson2018; Seyed-Aghazadeh et al. Reference Seyed-Aghazadeh, Carlson and Modarres-Sadeghi2017; Chen et al. Reference Chen, Ji, Xu, Zhang and Wei2020a, Reference Chen, Ji, Alam, Xu, An and Tong2022b).
5.3. Phase lags between the lift and transverse displacement
For a vibration system without structural damping, the phase lag changing from  $0^{\circ }$ to $180^{\circ }$ occurs at the position where the vibration frequency ( $f_y^{*}$) passes through the unity (Sarpkaya Reference Sarpkaya2004). This way is adopted in the present study to confirm the location of the phase lag jump from $0^{\circ }$ to $180^{\circ }$, the same means adopted by Bourguet & Lo Jacono (Reference Bourguet and Lo Jacono2014). Figure 26 shows the variation of the phase lag between the lift and transverse displacement at different $\alpha$ cases. For comparison, the result of the 1DOF case is provided. It is seen that the variations in phase lag are very similar for the 1DOF and 2DOF cases. In the typical VIV regime the jump in phase lag occurs at a constant $U^*$. In the following three regimes, the phase lag jump appears at a higher $U^*$ as $\alpha$ increases. In the dual galloping regime the phase lag maintains around $0^{\circ }$, which has also been reported by Bourguet & Lo Jacono (Reference Bourguet and Lo Jacono2014), Zhao et al. (Reference Zhao, Leontini, Lo Jacono and Sheridan2014) and Chen et al. (Reference Chen, Ji, Alam, Xu, An and Tong2022b). However, in the combined VIV and galloping regime, the phase lag jump occurs at the VIV region. As $\alpha$ increases, the VIV dominates a wider $U^*$ region and the $U^*$ at which the phase lag jump occurs decreases gradually. The decreasing trend continues until $\alpha \approx 90^{\circ }$, and then the critical $U^*$ increases slowly with increasing $\alpha$. In the second transition response regime, the critical $U^*$ at which the phase lag jump occurs successively increases as $\alpha$ grows. In the transverse-only galloping the phase lag remains around $0^{\circ }$.
Phase lags ( $\varphi$) between the lift and displacement in the 2DOF FIV of a D-section prism at examined ( $U^*$, $\alpha$) plane. The grey and lime regions denote that the phase lag is approximately $0^{\circ }$ and $180^{\circ }$, respectively. The grey dashed line represents the phase lag variation in the 1DOF case.
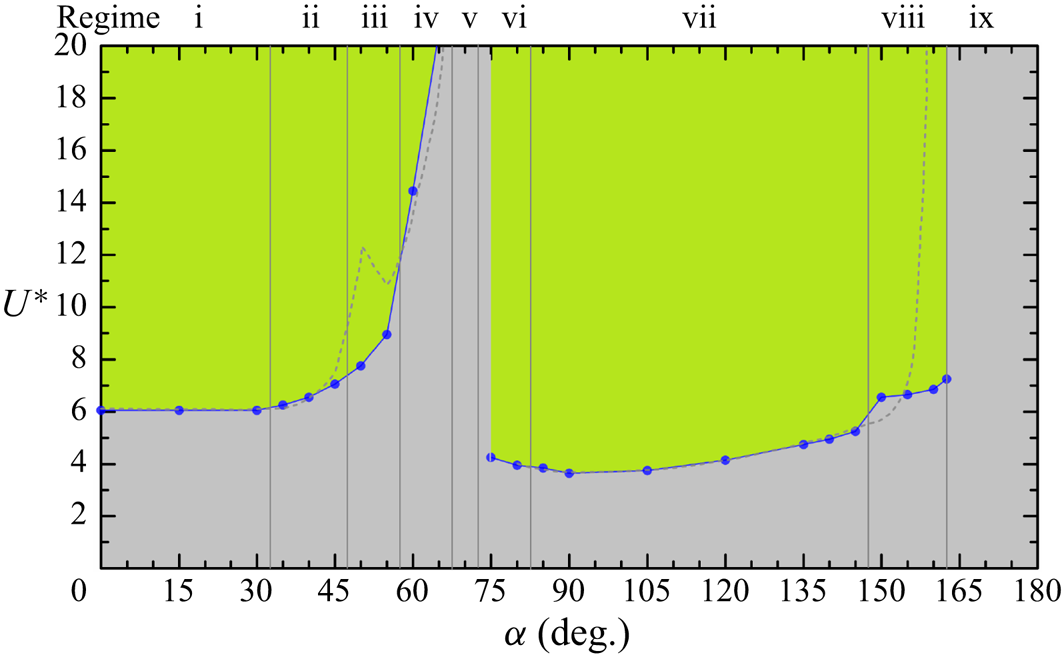
The position of the corresponding  $U^*$ at which the phase lag jump occurs is marked in figure 24. As shown in figure 24(b), the phase lag changing from $0^{\circ }$ to $180^{\circ }$ always occurs at the $U^*$ where the higher harmonic frequencies, such as the second or third harmonic frequency, are dominant. This indicates that the phase lag jump is associated with the appearance of higher harmonic frequencies (Prasanth & Mittal Reference Prasanth and Mittal2008; Chen et al. Reference Chen, Ji, Xu, Zhang and Wei2020a, Reference Chen, Ji, Xu and Zhang2022c).
6. Discussion
In this section we first provide a comprehensive summary of possible FIV responses of a D-section prism at different conditions, such as varied  ${Re}$ numbers, mass ratios and degrees of freedom, and then shed light on the roles of the separation point movement and shear layer reattachment in determining the observed responses.
6.1. Summary of FIV responses of D-section prism and effects of  ${Re}$ and streamwise vibration

Although the pioneering work of Lanchester (Reference Lanchester1907) can be traced to one hundred years ago, studies on the FIV of a D-section prism are still scarce. Based on the results in the literature, we provide a summary of the FIV responses of a D-section prism and their corresponding  $\alpha$ ranges in table 3. It is seen that most of the studies were at $\alpha = 0^{\circ }$ and $180^{\circ }$ only. The method used by Kumar et al. (Reference Kumar, Garg, Sharma and Bhardwaj2020), Chen et al. (Reference Chen, Ji, Alam, Xu, An and Tong2022b) and Sharma et al. (Reference Sharma, Garg and Bhardwaj2022) was direct numerical simulations, while others used water or wind tunnel experiments. In the water tunnel experiment by Zhao et al. (Reference Zhao, Hourigan and Thompson2018) and Chen et al. (Reference Chen, Zhao, Ji, Srinil and Song2021), the mass ratio is of the order 1, which is about two orders of magnitude smaller than that in wind tunnel experiments. To positively exhibit the details of the identified responses, we also offer a classification of the FIV responses in figure 27 with the amplitudes and vibration frequencies of each type included. At $\alpha = 0^{\circ }$, depending on the mass ratio, there are two types of response, i.e. VIV and no vibration (figure 27a). Brooks (Reference Brooks1960) reported no vibrations because of the higher mass ratio ( $\sim$O( $10^2$)), while Zhao et al. (Reference Zhao, Hourigan and Thompson2018), Sharma et al. (Reference Sharma, Garg and Bhardwaj2022) and Chen et al. (Reference Chen, Zhao, Ji, Srinil and Song2021, Reference Chen, Ji, Alam, Xu, An and Tong2022b) all with the mass ratio $\sim$O(1) presented typical VIV. Figure 27(a) further shows that a moderate increase in the mass ratio results in a decreased amplitude and narrowed vibration region. Owing to the absence of a major part of the afterbody, the response of the D-section prism at $\alpha = 0^{\circ }$ is different from that of a circular cylinder. In the laminar-flow case the shear layers separate from the prism corners and VIV is sustained even without an afterbody. By decomposing the lift force into pressure and viscous parts, Chen et al. (Reference Chen, Ji, Alam, Xu, An and Tong2022b) and Chen & Li (Reference Chen and Li2023) demonstrated that its sustenance comes from the positive work done by the viscous part. This mechanism is contrastingly different from the VIV of a circular cylinder where the pressure part exerts a positive role in the response while the viscous part always dampens the vibration (Menon & Mittal Reference Menon and Mittal2021). The variation in vibration frequencies also provides deep-going information. As shown in figure 27(a), in the laminar-flow cases (Chen et al. Reference Chen, Ji, Alam, Xu, An and Tong2022b; Sharma et al. Reference Sharma, Garg and Bhardwaj2022; and present study) the dominant vibration frequency increases almost linearly with increasing $U^*$. On the other hand, in the turbulent-flow cases (Zhao et al. Reference Zhao, Hourigan and Thompson2018; Chen et al. Reference Chen, Zhao, Ji, Srinil and Song2021) the vibration frequency remains unity for intermediate vibration amplitudes, indicating lock-in. This discrepancy is closely related to the movement of the separation points at high- ${Re}$ turbulent flow. However, out of the lock-in region, the vibration frequency closely follows the $St$ line.
Summary of the responses and their corresponding  $\alpha$ ranges in the FIV of a D-section prism with 1DOF or 2DOF. Here N.V. denotes no vibration; $G^\ast$ means galloping with initial disturbances required.

Non-dimensional vibration amplitudes and frequencies of a D-section prism versus  $U^*$ at different $\alpha$. (a) Typical VIV at $\alpha = 0^{\circ }$, (b) hysteretic VIV at $\alpha = 45^{\circ }$, (c) extended VIV at $\alpha = 50^{\circ }$, (d) first transition response at $\alpha = 60^{\circ }$, (e) (dual) galloping at $\alpha = 70^{\circ }$ for the present study, $\alpha = 75^{\circ }$ for Chen et al. (Reference Chen, Zhao, Ji, Srinil and Song2021) and $\alpha = 69^{\circ }$ for Chen et al. (Reference Chen, Ji, Alam, Xu, An and Tong2022b), ( f) combined VIV and galloping at $\alpha = 80^{\circ }$ for Chen et al. (Reference Chen, Ji, Alam, Xu, An and Tong2022b) and the present study and $\alpha = 90^{\circ }$ for Chen et al. (Reference Chen, Zhao, Ji, Srinil and Song2021), (g) narrowed VIV at $\alpha = 120^{\circ }$, (h) second transition response at $\alpha = 160^{\circ }$ and (i) (transverse-only) galloping at $\alpha = 180^{\circ }$. The cross-symbols in (b,d,h,i) denote the results of the decreasing $U^*$ cases. Note that the non-dimensional maximum amplitude ( $A_{max}^{*}$) is applied in Sharma et al. (Reference Sharma, Garg and Bhardwaj2022) and Kumar et al. (Reference Kumar, Garg, Sharma and Bhardwaj2020), while the average ( $A_{10}^{*}$) of the top 10 % amplitudes is adopted in Chen et al. (Reference Chen, Zhao, Ji, Srinil and Song2021) and Zhao et al. (Reference Zhao, Hourigan and Thompson2018).
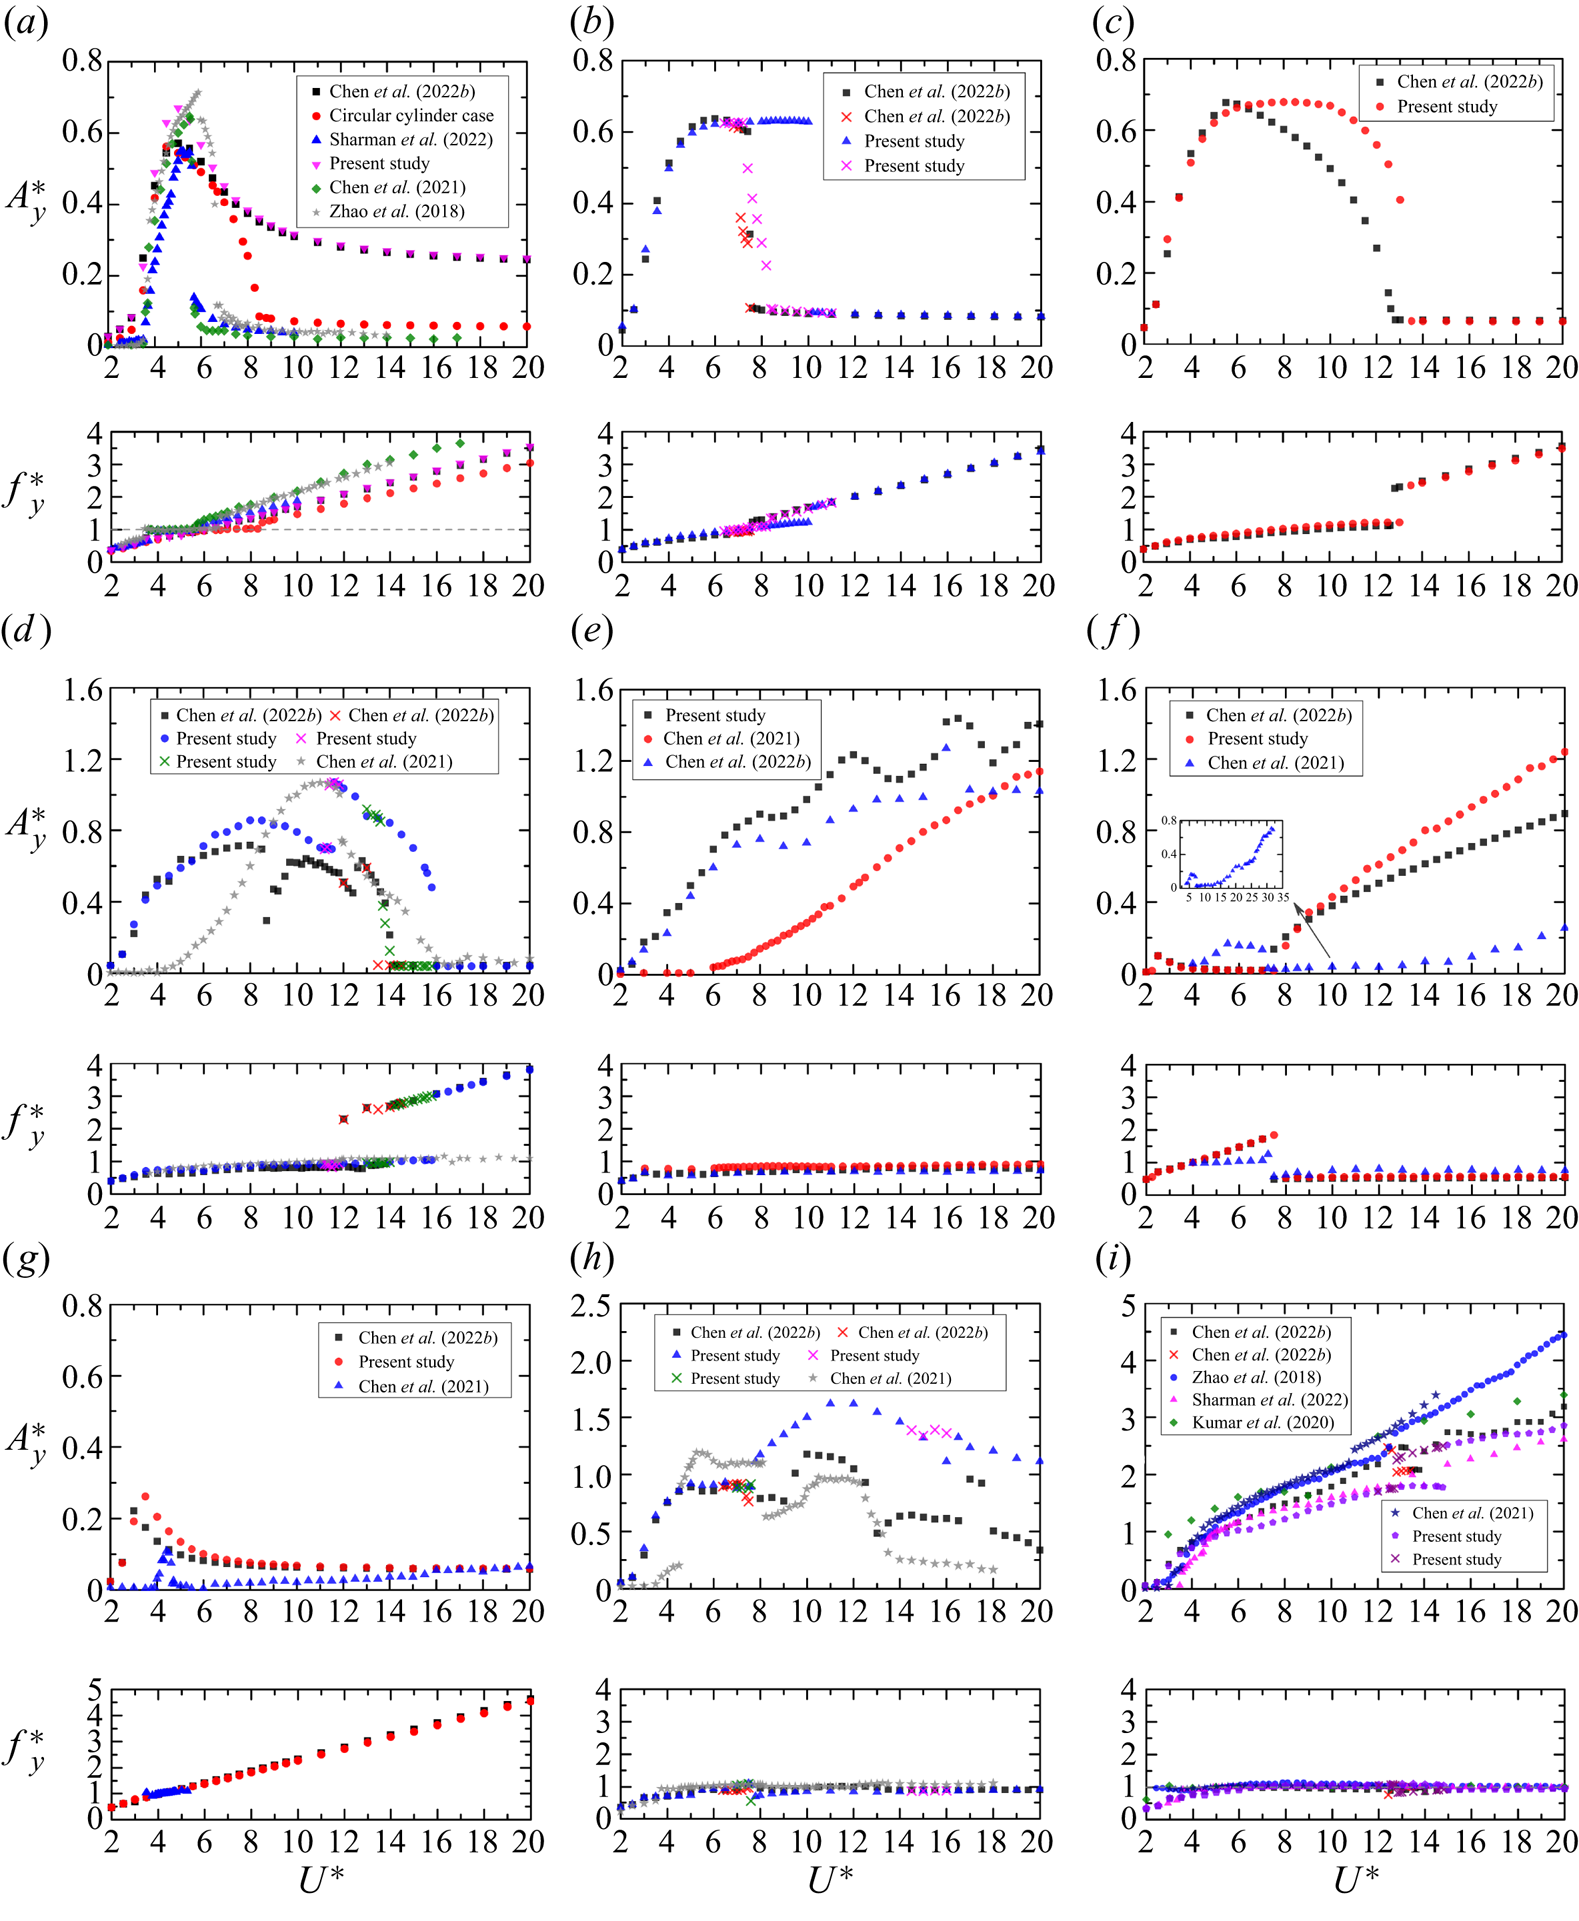
At  $\alpha = 180^{\circ }$, the response is also divided into two subtypes. When the mass ratio is small, the galloping response is characterized by the increased amplitude and constant frequency with $U^*$. For a high mass ratio, the galloping can be excited only when strong disturbances are applied, and otherwise, VIV appears. In the VIV the prism vibration generally exists in a narrow $U^*$ range (Brooks Reference Brooks1960; Parkinson Reference Parkinson1963; Weaver & Veljkovic Reference Weaver and Veljkovic2005). As shown in figure 27(i), the amplitude in the galloping increases with increasing $U^*$, and the vibration frequency maintains around 1.0 for the entire $U^*$ range, irrespective of the mass ratio. Comparing the amplitudes in experiments and numerical simulations, we can see that a higher ${Re}$, to some extent, enhances the prism vibration, which may be associated with the energetic shear layers in the turbulent flow. Compared with the 1DOF counterpart, the streamwise freedom leads to a lower amplitude, which is in contrast to the circular cylinder counterpart where the amplitude is slightly amplified by adding the streamwise freedom (Jauvtis & Williamson Reference Jauvtis and Williamson2004). A special feature in the galloping noted here is the hysteresis for increasing and decreasing $U^*$. A similar behaviour was reported in the galloping of a square cylinder, such as by Luo, Chew & Ng (Reference Luo, Chew and Ng2003), Barrero-Gil, Sanz-Andres & Alonso (Reference Barrero-Gil, Sanz-Andres and Alonso2009) and Liu et al. (Reference Liu, Ma, Dai, El Damatty and Li2022).
Studies at  $0^{\circ } <\alpha < 180^{\circ }$ are much less. However, as listed in table 3, seven different types of responses are identified in this $\alpha$ range, indicating significant influences of $\alpha$ on D-section prism vibrations. Owing to the disparities in ${Re}$ number, mass ratio and degree of freedom, the variations in the $\alpha$ range for each identified response are not explained here. However, it should be mentioned here that in Chen et al. (Reference Chen, Zhao, Ji, Srinil and Song2021) the increment of $\alpha$ is relatively large, and some of the responses observed in Chen et al. (Reference Chen, Ji, Alam, Xu, An and Tong2022b) and the present study are not detected, such as hysteretic and extended VIV. Firstly, we focus on the hysteretic VIV. As shown in figure 27(b), there is a hysteretic loop in the hysteretic VIV. At the same $\alpha$, the hysteretic loop in the 2DOF case is much wider than that in the 1DOF case, suggesting a promoting role of the streamwise vibration on the hysteresis. Then, the focus is on the extended VIV. As shown in figure 27(c), in this response, the amplitude first increases and then decreases rapidly before attenuation. Compared with the typical VIV, lock-in occurs at a wider $U^*$ region. The addition of the streamwise freedom widens the large-amplitude region, similar to that in the hysteretic VIV. Thirdly, in the first transition response noted at a higher $\alpha$, the amplitude first increases and then decreases with increasing $U^*$ before attenuation (figure 27d). The increase or decrease in amplitude with $U^*$ is not monotonic.
Next is the galloping. As shown in figure 27(e), at  $\alpha \approx 70^{\circ }$, the amplitude increases with increasing $U^*$, thus, the galloping dominates. However, it should be pointed out here that the increment of $\Delta \alpha = 5^{\circ }$ adopted by Chen et al. (Reference Chen, Ji, Alam, Xu, An and Tong2022b) is not fine enough, no galloping response is reported by them. Here, we further checked the response at $65^{\circ } < \alpha < 70^{\circ }$ with an increment of $\Delta \alpha = 1^{\circ }$ and confirmed the occurrence of galloping at $\alpha = 69^{\circ }$. In the laminar flow the amplitudes of the 1DOF and 2DOF cases are approximately identical at $U^*< 6.0$ but distinct at $U^*> 6.0$. This difference is expected because of the significantly amplified streamwise amplitude. As explained in § 4.2.3, the coupling of the vibrations in the two directions is strong, especially when $U^*$ is large, which is a benefit to the enlarged transverse amplitude. Compared with the turbulent-flow counterpart, the vibration in the laminar flow begins at a smaller $U^*$ but the amplitudes are higher. This is largely associated with smaller mass ratios and zero structural damping adopted in the two laminar-flow cases. The vibration frequencies are constant around 0.7, which is almost independent of ${Re}$ and degree of freedom. In the combined VIV and galloping response (figure 27 f), the VIV usually appears at low $U^*$ with small amplitudes. The galloping occurs at high $U^*$ where the amplitude gradually increases with increasing $U^*$. In the laminar flow the amplitudes of the 1DOF and 2DOF cases are similar and the discrepancy becomes perceivable only after $U^*>$ 10. Compared with the laminar-flow counterpart, the VIV amplitude in the turbulent flow is slightly larger, while the galloping amplitude is significantly smaller, even when $U^*$ is very high, as shown in the zoomed-in plot of figure 27( f). The vibration frequencies of two laminar-flow cases are approximately identical. In the VIV the vibration frequency follows the $St$ line, while maintains at 0.6 in the galloping. Although the variation of vibration frequency in the turbulent flow is similar to that in the laminar flow, one noticeable difference is the occurrence of lock-in in the turbulent VIV as a result of the intense shear layer reattachment.
The narrowed VIV dominates in the  $\alpha$ range of approximately $90^{\circ }\unicode{x2013}150^{\circ }$. As shown in figure 27(g), the VIV amplitude is much smaller as the prism orientation in this $\alpha$ range is more streamlined. Compared with the laminar-flow counterpart, the vibration in the turbulent flow is much weaker and appears in a narrower $U^*$ range. Depending on ${Re}$ and mass ratio, the second transition response appears at $\alpha$ around $150^{\circ }\unicode{x2013}160^{\circ }$. As shown in figure 27(h), this response can also be divided into several regions, with the hysteresis appearing in the transition of adjacent regions. Although the variations of the amplitude in the laminar and turbulent cases are similar, we still notice several evident discrepancies, such as a significantly lower amplitude in the turbulent case. In the 2DOF case the amplitude is higher than that in the 1DOF case, especially at high $U^*$. At $165^{\circ } \leq \alpha < 180^{\circ }$, the galloping recovers again, with its vibration and spectral features being similar to those of the galloping at $\alpha = 180^{\circ }$.
From the above, we know that the influencing factors, e.g.  ${Re}$, $m^*$ and structural damping, are significant for the presence of some responses. However, up to now, the studies are rather scarce. We still have some conclusive points: (1) irrespective of ${Re}$, the prism responses with increasing $\alpha$ are similar at low ( $\sim$O(1)) or intermediate $m^*$ ( $\sim$O(10)); (2) in contrast to the laminar case, lock-in always occurs when the prism vibration in the turbulent flow commences; and (3) with a significantly high $m^*$, the prism vibration may become insignificant, regardless of ${Re}$. Moreover, in the present study the simulations were conducted only at ${Re} = 100$ where the flow is two dimensional. Therefore, it is expected that there are some limitations of the response features identified here to universally apply for the three-dimensional (3-D) geometry at high- ${Re}$ turbulent flow. The differences in the occurrence of lock-in between the laminar and turbulent flows positively indicate the more complex physics of 3-D prisms. A thorough study should be conducted in the future.
By adding the streamwise vibration, we note strong similarities and some disparities between the 1DOF and 2DOF FIV cases. The similarities are summarized as follows. (1) Within  $\alpha = 0^{\circ }\unicode{x2013}180^{\circ }$, some response regimes are observed in the two cases, such as typical VIV, extended VIV, narrowed VIV, galloping and transition response, and the corresponding $\alpha$ range for each regime is very close. (2) All three groups of the response are reported in the two cases and underlying flow physics exhibit no differences. (3) The wake modes in each regime are alike, such as the dominating 2S and P+S modes for VIV and $m$S+
$m$S+ $n$S mode for galloping and galloping-like responses. (4) The dominant vibration frequencies exhibit similar behaviours with increasing $U^*$, although the amplitude is relatively higher in the 2DOF case. (5) The variations of fluid forces with $U^*$ and $\alpha$ are approximately the same, although the values are slightly different. Furthermore, some disparities, although not significant, are identified between the two cases. Firstly, compared with the 1DOF case, the peak amplitude is higher and the large-amplitude vibration exists in a wider $U^*$ range for the group of VIV. Secondly, the hysteresis loop is widened in the 2DOF case. Thirdly, the amplitude is much higher, especially at large $U^*$, for the galloping. Finally, the mean lift $\bar {C}_{L}$ in the 2DOF case is significantly lower for $\alpha < 90^{\circ }$.
6.2. Roles of separation point movement and shear layer reattachment in identified FIV responses
As discussed above, although the responses of a D-section prism are impacted by several factors, such as  ${Re}$ number, mass ratio and degree of freedom, the physical mechanisms of the responses remain the same. According to the mechanisms, the FIV responses are largely divided into three groups: VIV, galloping-like and galloping responses. In the VIV the vortex shedding frequency is always identical to the prism vibration frequency, and the resonant response is induced by the fluctuating lift and drag resulting from vortex shedding. In contrast to the self-limited VIV, the amplitude in galloping generally increases with increasing flow velocity (or reduced velocity), showing no limitation; the vortex shedding frequency is usually higher than the prism vibration frequency. Additionally, the galloping is driven by the shear layer reattachment, which produces strongly asymmetric pressure distribution on the prism surface (Nemes et al. Reference Nemes, Zhao, Lo Jacono and Sheridan2012; Zhao et al. Reference Zhao, Leontini, Lo Jacono and Sheridan2014; Chen et al. Reference Chen, Ji, Alam, Xu, An and Tong2022b). In the galloping-like response there are several regions where the amplitude is large, i.e. $A_y^{*}\sim 1$. This large-amplitude response is associated with multiple vortices shed in each vibration period, such as 3S+2S and 3S+3S modes. Multiple vortices lead to a high-frequency oscillation of the forces that are superimposed on the low-frequency vibrations. Therefore, the synchronization between the prism large-amplitude vibration and vortex shedding formation disappears (Stansby & Rainey Reference Stansby and Rainey2001; Yogeswaran & Mittal Reference Yogeswaran and Mittal2011; Bourguet & Lo Jacono Reference Bourguet and Lo Jacono2014). Here, we look deep into how the separation point movement and shear layer reattachment work in the 2DOF FIV of a D-section prism.
In the typical VIV regime ( $\alpha = 0^{\circ }\unicode{x2013}30^{\circ }$), the wake is the 2S mode and the prism vibration and vortex formation are synchronized. At most $U^*$ cases of $\alpha = 0^{\circ }$, the shear layers separate from the corners, and the afterbody is zero (figure 28a). However, owing to the intensified streamwise vibration, in some $U^*$ cases, especially when the amplitude is large, the shear layers separate from the curved surface (figure 28b), and a small part of the curved surface turns into an afterbody where the pressure variation is insignificant. Thus, the work done by the pressure force is negligible. At $\alpha = 15^{\circ }\unicode{x2013}30^{\circ }$, as the cross-section is asymmetric with respect to the incoming flow, the shear layer on the upper side persistently separates from the prism corner or from the curved surface, depending on the amplitude. As stated by Chen et al. (Reference Chen, Ji, Alam, Xu, An and Tong2022b), the vortex formation process in the typical VIV is largely determined by the fixed separation point on the upper side, with the vibration frequency following the $St$ line (figure 3b). It is noted that at some $U^*$ cases with higher amplitude, especially for $\alpha = 30^{\circ }$, the shear layer on the upper side may reattach onto the flat surface (figure 28c), and this could lead to the vortex shedding frequency slightly deviating from the $St$ line. In the hysteretic VIV regime ( $\alpha = 35^{\circ }\unicode{x2013}45^{\circ }$), the prism is more streamlined to the incoming flow and the shear layer on the upper side is easier to reattach onto the flat surface. As shown in figure 28(d), when the prism moves downward, the shear layer on the upper side of the prism closely reattaches onto the flat surface while that on the lower side separates from the curved surface. When the prism moves upward (figure 28e), the shear layer on the lower side is largely entrained onto the flat surface. Along with a wider afterbody, the shear layer reattachment and entrainment show significant influences on the vortex shedding, and the vibration frequency significantly deviates from the $St$ line (figure 3d). As $\alpha$ increases, the vibration frequency approaches the natural frequency of the prism. In the hysteretic region the prism vibration in the decreasing case is weak and the shear layer on the upper side does not reattach on the flat surface and the vibration frequency closely follows the $St$ line. However, in the increasing case the shear layer on the upper side closely reattaches onto the flat surface when the prism moves upward and the vibration frequency is very close to the natural frequency of the prism, signifying the occurrence of lock-in. At $\alpha = 50^{\circ }\unicode{x2013}55^{\circ }$, the shear layer reattachment occurs even when the amplitude is mild, and hence, the VIV extends significantly. Moreover, the shear layer on the lower side of the prism moves back and forth along a longer segment of the curved surface, thus contributing to the further closeness of the vibration frequency to the natural frequency of the prism. However, when the vibration is negligible, the shear layer on the upper side does not reattach onto the flat surface (figure 28f). Accordingly, the vibration frequency follows the $St$ line.
Instantaneous vorticity contours at different  $\alpha$ and $U^*$: (a) $\alpha = 0^{\circ }$ and $U^* = 10.0$, (b) $\alpha = 0^{\circ }$ and $U^* = 5.0$, (c) $\alpha = 30^{\circ }$ and $U^* = 5.0$, (d) $\alpha = 35^{\circ }$ and $U^* = 5.0$, (e) $\alpha = 45^{\circ }$ and $U^* = 6.0$, ( f) $\alpha = 50^{\circ }$ and $U^* = 2.5$, (g) $\alpha = 60^{\circ }$ and $U^* = 12.0$, (h) $\alpha = 75^{\circ }$ and $U^* = 2.5$, (i) $\alpha = 90^{\circ }$ and $U^* = 5.0$, (j) $\alpha = 120^{\circ }$ and $U^* = 5.0$, (k) $\alpha = 160^{\circ }$ and $U^* = 12.0$ and (l) $\alpha = 180^{\circ }$ and $U^* = 14.0$ (increasing). The positions of selected instants are marked in the trajectories by a red dot superimposed on the vorticity fields.

In the first transition response regime ( $\alpha = 60^{\circ }\unicode{x2013}65^{\circ }$), movements of the shear layer reattachment and separation point occur at high $U^*$. As shown in figure 28(g), when the prism moves upward, the upper side shear layer closely reattaches onto the flat surface while the lower side shear layer moves back and forth along a wide segment of the curved surface. Moreover, hysteresis detected in this transition regime, as explained in § 4.2.1, comes from the dynamic movements of the shear layer reattachment and separation point.
Dual galloping is observed at  $\alpha = 70^{\circ }$ where both streamwise and transverse amplitudes gradually increase with $U^*$. The sustenance of dual galloping is also strongly associated with the shear layer reattachment. As explained in § 4.2.3, multiple vortices shed from the two sides of the prism alternately can generate significant fluctuations of pressure distribution on the prism surface. In the combined VIV and galloping response ( $\alpha = 75^{\circ }\unicode{x2013}80^{\circ }$), the response is divided into two regions. In the VIV region (figure 28h), the upper shear layer separating from the upper corner flows over the flat surface while the lower side shear layer separates from the curved surface. Accordingly, the vibration frequency approximately follows the $St$ line. In the galloping region the amplitude increases monotonically with increasing $U^*$, and the physical mechanism is the same as that of dual galloping. The narrowed VIV can be thought of as an extension of the VIV region in the combined response as a result of increasing $\alpha$. According to the dynamics of the shear layers, we divide this regime mainly into two sub-regimes, i.e. one is at $\alpha = 85^{\circ }\unicode{x2013}95^{\circ }$ and the other is at $\alpha = 100^{\circ }\unicode{x2013}145^{\circ }$. In the first sub-regime the flat surface is approximately parallel to the incoming flow and the upper shear layer moves downstream along the flat surface. As shown in figure 28(i), the upper shear layer separates from the downstream corner while the lower side shear layer separates from the curved surface. Therefore, the response is similar to the VIV in the combined response. In the second sub-regime the afterbody extends as $\alpha$ increases (figure 28j). The upper shear layer separates from the upper corner and then reattaches onto the curved surface, while the lower shear layer oscillates strongly before separating from the prism (not shown here). As $\alpha$ increases, the fluctuation of the pressure distribution enhances and the amplitude increases gradually. However, as indicated by figure 3(h), although the shear layer separation point on the lower side somewhat moves back and forth, the vibration frequency linearly increases with increasing $U^*$.
In the second transition response regime, i.e.  $\alpha = 150^{\circ }\unicode{x2013}160^{\circ }$, the transverse amplitude increases significantly with increasing $\alpha$, which is associated with the enlarged afterbody and stronger shear layer reattachments on the two sides of the prism (figure 28k). The reattachment leads to the lock-in in a wider $U^*$ range, especially for $\alpha = 160^{\circ }$. The transverse-only galloping occurs at $\alpha = 165^{\circ }\unicode{x2013}180^{\circ }$. In this regime the transverse amplitude monotonically increases while the streamwise amplitude remains small. The sustenance is related to the shear layer reattachment (Nemes et al. Reference Nemes, Zhao, Lo Jacono and Sheridan2012; Zhao et al. Reference Zhao, Leontini, Lo Jacono and Sheridan2014; Seyed-Aghazadeh et al. Reference Seyed-Aghazadeh, Carlson and Modarres-Sadeghi2017).
7. Conclusions
We numerically studied FIV of an elastically mounted D-section prism in the parametric space of  $\alpha = 0^{\circ }\unicode{x2013}180^{\circ }$ and $U^* = 2.0\unicode{x2013}20.0$. The prism is allowed to freely vibrate in both streamwise and transverse directions. First, we shed light on the details of the vibration amplitudes and frequencies and uncovered the flow physics for the identified responses. Then, we carefully examined the dependence of the fluid forces and spectral frequencies on $\alpha$ and $U^*$. Finally, we provided a classification of the FIV responses of a D-section prism at various conditions and discussed the influences of the shear layer reattachment and separation point movement on the appearance of multiple responses. The major findings of this study are summarized as follows.
(a) Nine different types of responses depending on the angle of attack: according to the characteristics of the vibration amplitudes and frequencies, the responses are classified into nine different regimes, i.e. typical VIV at
$\alpha = 0^{\circ }\unicode{x2013}30^{\circ }$, hysteretic VIV at $\alpha = 35^{\circ }\unicode{x2013}45^{\circ }$, extended VIV at $\alpha = 50^{\circ }\unicode{x2013}55^{\circ }$, first transition response at $\alpha = 60^{\circ }\unicode{x2013}65^{\circ }$, dual galloping at $\alpha = 70^{\circ }$, combined VIV and galloping at $\alpha = 75^{\circ }\unicode{x2013}80^{\circ }$, narrowed VIV at $\alpha = 85^{\circ }\unicode{x2013}145^{\circ }$, second transition response at $\alpha = 150^{\circ }\unicode{x2013}160^{\circ }$ and transverse-only galloping at $\alpha = 165^{\circ }\unicode{x2013}180^{\circ }$. Based on the physical mechanisms, they are classified into three different groups: VIV, galloping-like and galloping responses. Table 4 shows the details of the response, fluid forces and wake modes in each regime. In the typical and narrowed VIVs, the vibration frequencies linearly increase with increasing $U^*$. In the hysteretic and extended VIVs, the vibration amplitudes are large in a wider $U^*$ region as a result of lock-in. Dual and transverse-only galloping are different in terms of the variation in the streamwise amplitude with increasing $U^*$. In the combined VIV and galloping, the vibration amplitude is relatively small in the VIV region while drastically increasing with $U^*$ in the galloping region. In the two transition responses, the vibration frequencies are galloping like but the divergent amplitude cannot persist at higher $U^*$.
Table 4.Characteristics of the response, fluid forces and wake modes in the 2DOF FIV of a D-section prism at Re = 100 and m* = 2.0.
(b) Several wake modes in the examined parametric space: a partition map of the wake modes in the
$U^*\unicode{x2013}\alpha$ plane is offered with the smallest increments of $\Delta U^* = 0.1$ and $\Delta \alpha = 5^{\circ }$. The 2S mode dominates the major part of the parametric plane, covering roughly the whole range of the typical, hysteretic and narrowed VIV regimes. The P+S mode usually appears at the region with a slightly higher amplitude. In the hysteretic and extended VIV regimes, the P+S mode occurs at $U^* = 9.0\unicode{x2013}10.0$ while largely appearing at $U^* = 4.0\unicode{x2013}5.5$ in the transition, combined and pure galloping regimes. The 2P mode is recognized only in the transition, combined and galloping regimes, which require a higher amplitude than those of the 2S and P+S modes. The $m$S+$n$S mode is observed only in the transition response and galloping regimes. However, in the transition regime the values of $m$ and $n$ are usually small while in the galloping region they generally increase with increasing amplitude. Furthermore, the dependence of the wake modes on vibration amplitudes and frequencies is examined.(c) Flow physics for several crucial response behaviours: hysteresis is observed in the hysteretic VIV, transition response and transverse-only galloping regimes. The hysteresis can be a combined effect of shear layer reattachment and separation point movement or induced only by dynamic changes of the shear layer reattachment. The intermittent behaviour where two different states compete with each other is induced by the low-frequency component because of the unstable vortex interactions in the near wake. Dual galloping is for the first time observed in the FIV of a non-circular cylinder and its emergence is related to the shear layer reattachment and entrainment. The fluctuating pressure on the prism surface is essentially induced by multiple vortices shed in each vibration period. This is contrastingly different from that for the transverse-only galloping where the asymmetric pressure distribution is caused by multiple shear layer reattachments along with the formation of multiple vortices.
(d) Statistics and spectral contents of the fluid forces with variations in
$\alpha$ and $U^*$: the $\bar {C}_{D}$ is more likely $\alpha$ dependent and the high $\bar {C}_{D}$ mainly appears in two regions: one is the curved surface facing upstream while the other is the flat surface facing upstream. The $\bar {C}_{L}$ can be positive or negative, roughly separated by $\alpha = 95^{\circ }$. The positive $\bar {C}_{L}$ is more evident in the region where the amplitude is large, indicating that $\bar {C}_{L}$ is, to some extent, amplitude dependent. The distributions of $C_{D}^{\prime }$ and $C_{L}^{\prime }$ are rather similar. Generally, there are two important regions: one at $U^* = 2.5\unicode{x2013}4.5$ and $\alpha \approx 0^{\circ }\unicode{x2013}65^{\circ }$ corresponds to the region where the amplitude increases sharply, covering regimes (i)–(iv), while the other is at smaller $U^*$ and higher $\alpha$, approximately covering regimes (viii)–(ix). The dominant $f_D^{*}$ and $f_L^{*}$ are identical in most cases. However, multiple frequencies are present, such as in the transition response and galloping-related regions, which can be thought of as a mirror of complex vortex-prism interactions.(e) Finally, we classified the FIV responses of a D-section prism at different conditions and explained how the movements of shear layer reattachment and separation point determine the categorized responses. Although the factors, such as Reynolds number and mass ratio, display a certain amount of influence, most of the FIV responses identified in the present study are confirmed with higher
${Re}$, moderate mass ratio or the addition of streamwise freedom. Successive transformations of nine types of responses with $\alpha$ are strongly dependent on the shear layer reattachment and separation point movement. The two processes that significantly impact the pressure distribution on the prism surface and vortex formation process. Along with the vortex formation, the shear layer reattachment could lead to strong fluctuations in the pressure distribution. Besides, owing to the reattachment, the rhythm of shear layer development is modified accordingly, and the vortex shedding frequency deviates from the $St$ line. The movement of the separation point can also alter the vortex formation. This is why we find that, in the VIV of a circular cylinder, the lock-in occurs where the separation points on both sides of the circular cylinder oscillate along the surface significantly while in the desynchronization region the oscillation of the separation points is relatively small (Cagney & Balabani Reference Cagney and Balabani2019). Together with the alternate vortex shedding, the separation points on the two sides of the prism move back and forth and, as a result, the pressure distribution on the prism surface displays significant changes during the vibration, which is responsible for the sustenance of the response.


Acknowledgements
This work was supported in part with computational resources provided by the National Supercomputing Centre, Singapore (https://www.nscc.sg), under project ID: 11002459. The authors would like to thank the anonymous reviewers for their constructive suggestions.
Funding
This research is supported by the Ministry of Education, Singapore, under the Academic Research Fund Tier 1 (FY2021).
Declaration of interests
The authors report no conflict of interest.


 Open access