


Introduction
While research on instructed second language (L2) acquisition in healthy older adults has recently begun to gain traction (e.g., Bak et al., Reference Bak, Long, Vega-Mendoza and Sorace2016; Kliesch et al., Reference Kliesch, Pfenninger, Wieling, Stark and Meyer2022; Mackey & Sachs, Reference Mackey and Sachs2012; Ramos et al., Reference Ramos, Fernández García, Antón, Casaponsa and Duñabeitia2017; Ware et al., Reference Ware, Damnee, Djabelkhir, Cristancho, Wu, Benovici, Pino and Rigaud2017), the mechanisms of third age additional language learning are yet to be investigated. In particular, there have been calls for more research employing dynamic methods capable of revealing how significant peaks and dips in the L2 development of older individuals emerge over time in relation to variable learner behavior (e.g., Kliesch & Pfenninger, Reference Kliesch and Pfenninger2021). In this study, we thus focus on the decomposition of intraindividual variation (IAV), which, according to Van Geert and Van Dijk (Reference Van Geert and Van Dijk2002: 355), is “an interesting variable in its own right” that occurs in various forms. It can, for instance, be distinguished as a function of the period considered (Fagot et al., Reference Fagot, Mella, Borella, Ghisletta, Lecerf and De Ribaupierre2018): inconsistency, which refers to performance fluctuations within tasks (= IAV across trials within cognitive and L2 tasks at one measurement); dispersion, which refers to effects of task type and task demands (= cognitive and L2 measures of IAV across different types of tasks within a single session); and variability, which refers to developmental change (= IAV within tasks in individual time-serial data of repeated observations). In both the cognitive neurosciences/developmental psychology (e.g., De Ribaupierre Reference De Ribaupierre2015; Golino et al., Reference Golino, Nesselroade and Christensen2022; Hamaker, Reference Hamaker, Mehl and Conner2012; Schmiedek et al., Reference Schmiedek, Lövdén and Lindenberger2009) and in language acquisition studies from a complex dynamic systems (CDST) perspective (Hiver et al., Reference Hiver, Al-Hoorie and Evans2022), it has been argued that IAV (a) represents the entire performance better than a measure of central tendency alone and (b) contains valuable information about human development in general and L2 development and cognitive ability in particular. While not all SLA researchers subscribe to CDST approaches, the insight that interactions between the variables that contribute to the explanation of SLA often go beyond rigid linear relationships will hardly be disputed anymore (Kersten & Greve, Reference Kersten, Greve, Kersten and Winsler2022).
To our knowledge, no studies exist on the cognition–affect interface in older L2 learners where all three IAV types are integrated. For this reason, and seeing that older adults tend to present a high degree of inter- and intraindividual variation owing to lifestyle factors and participation in cognitively stimulating activities (Pfenninger & Singleton, Reference Pfenninger and Singleton2019), the aim of this study is to investigate (a) whether different types of IAV are related and (b) how and when they influence L2 development over time. What kinds of IAV matter for L2 learning later in life, why do they matter, and when in the L2 developmental process do they matter most?
Not only is SLA in need of more data-rich longitudinal research, but it also becomes necessary to further decompose individual participants and focus on studying “language learner characteristics and behavior across various timescales of activity” (King, Reference King and King2016, p. 2). By investigating IAV more closely, researchers may come one step closer to discovering if, and to what extent, systematic relationships may occur between different types of IAV (Pallotti, Reference Pallotti2022). Furthermore, a better understanding of the mechanisms of third age additional language learning will facilitate sensitivity to intervention analysis and help refine and tailor future language-based interventions for older individuals. Our results are also of interest to developmental psychologists and neurocognitive scientists because they shed light of the operation of cognitive systems, which is particularly important considering that “most tasks (currently those used in neuropsychological assessments) provide only global scores and most probably do not contain enough trials to compute trial-by-trial variability” (De Ribaupierre & Lecerf, Reference De Ribaupierre and Lecerf2018, p. 5). From a methodological perspective, this study sets out a new direction of longitudinal SLA research (group studies based on time-serial data), which it approaches in an innovative way through the use of generalized additive mixed modeling (GAMM) in combination with qualitative analyses.
Intraindividual variation across the lifespan
IAV concerns differences in the behavior of a given individual learner across contexts and/or at different moments of development as well as nonlinear developmental changes that may be characterized by some regressions of fluctuations observable at different moments during the development of an individual (Hickmann et al., Reference Hickmann, Veneziano and Jisa2018). Those fluctuations may occur at different timescales (e.g., across the lifespan, days, daily occasions separated by hours, and moments separated by minutes or seconds) and contribute to observed month-to-month, week-to-week, day-to-day, minute-to-minute, and second-to-second variability—a phenomenon that is exacerbated with increasing age as far as cognitive functioning is concerned (Christensen, Reference Christensen2001; Leonhardt et al., Reference Leonhardt, Könen, Dirk and Schmiedek2016; Li et al., Reference Li, Aggen, Nesselroade and Baltes2001; MacDonald et al., Reference MacDonald, Nyberg and Bäckman2006; D. Park et al., Reference Park, Lodi-Smith, Drew, Haber, Hebrank, Bischof and Aamodt2014; S. Park et al., Reference Park, Choi, Choi, Kang and Lee2019; Rabbitt et al., Reference Rabbitt, Osman, Moore and Stollery2001). Several studies in the neurocognitive sciences (e.g., Hilborn et al., Reference Hilborn, Strauss, Hultsch and Hunter2009; Salthouse & Soubelet, Reference Salthouse and Soubelet2014) report higher levels of inconsistency at older ages and increased dispersion in the oldest individuals and in individuals having experienced cognitive decline. Recently, however, scholars (e.g., Fagot et al., Reference Fagot, Mella, Borella, Ghisletta, Lecerf and De Ribaupierre2018; Mella et al., Reference Mella, Fagot and De Ribaupierre2016) have challenged the well-established view of older adults being systematically more variable than younger adults, as they report younger adults to be the more variable group with respect to response times but not accuracy performance in working memory (WM) tasks. From this the authors in question also conclude that IAV in speed processing and IAV in accuracy performance may not have the same underlying psychological and biological processes. De Ribaupierre and Lecerf (Reference De Ribaupierre and Lecerf2018) thus urge researchers to assess whether different types of IAV correlate or are independent from one another across a number of cognitive measures, in part because such an examination may provide insight into the operation of cognitive systems.
L2 development, too, is inherently about nonlinear change over time, including phases of rapid developmental growth and more stable phases within L2 learners, as has been amply demonstrated in CDST-related studies. For instance, the nonlinearity of the L2 system has been demonstrated by the same situational input having divergent outputs depending on one’s expertise and attentiveness to input particulars (Al-Hoorie, Reference Al-Hoorie, Dörnyei, MacIntyre and Henry2015). Furthermore, the many individual learner differences influencing L2 development are in perpetual flux and often result in emergent, nonlinear, unpredictable outcomes (see the discussion in the following text). According to Piniel and Csizér (Reference Piniel, Csizér, Dörnyei, MacIntyre and Henry2015, p. 165), these characteristics of L2 development “necessitate the study of the interrelationship(s) of variables with the help of longitudinal developmental data on interindividual, as well as intra-individual variation,” as done in this study.
Intraindividual variation as a source of information
In SLA, the understanding of IAV constitutes an important contribution of the modeling research carried out within the framework of CDST (e.g., Van Geert, Reference Van Geert1994). Learners’ interlanguage development is nonlinear and characterized by phases of stability, called attractor states, alternating with high degrees of variability that accompany rapid development, sometimes referred to as repeller states in the CDST literature (De Bot et al., Reference De Bot, Lowie and Verspoor2007; Verspoor et al., Reference Verspoor, De Bot and Lowie2011). Defined as “differences in the level of a developmental variable within individuals and between repeated measurements” (Van Geert & Van Dijk, Reference Van Geert and Van Dijk2002, p. 341), IAV has been suggested to be a source of information both quantitatively, with data showing fluctuating levels of the variables of interest, and qualitatively, in the sense that multidimensional juxtapositions can also be illustrated for each measurement occasion (e.g., Lowie & Verspoor, Reference Lowie and Verspoor2019). What is more, within a trajectory of development, individual differences such as L2 learning motivation are dynamic entities that interact with individuals’ interlanguage, that is, exert differential effects on L2 development over time. In recent years, many CDST-inspired studies have tracked IAV to examine language development, albeit not with beginning L2 learners later in life and not with larger samples. Furthermore, although the default measure of IAV seems to be variability (rather than inconsistency and dispersion) in CDST-inspired work (see e.g., ibid.), different types of IAV have usually not been teased apart, as it has simply been suggested that it is “the degree of variability in itself (which may include systematic, free and unsystematic variation) that is taken as providing insight in the developmental process” (De Bot et al. Reference De Bot, Lowie and Verspoor2007, p. 53).
In cognitive developmental research, IAV—notably inconsistency and dispersion—usually bears a negative connotation, with larger IAV being associated with vulnerability or impairment and believed to be indicative of lower cognitive functioning (Fagot et al., Reference Fagot, Mella, Borella, Ghisletta, Lecerf and De Ribaupierre2018), as described in the preceding text. For example, greater dispersion across cognitive domains may reflect poorer sustained cognitive control across the different cognitive tests as well as cognitive impairment (measures included episodic memory, executive function, and language) (Hilborn et al., Reference Hilborn, Strauss, Hultsch and Hunter2009; Hultsch et al., Reference Hultsch, MacDonald and Dixon2002; Mella et al., Reference Mella, Fagot and De Ribaupierre2016). Similarly, inconsistency seems to be greater in the cognitive performance of demented persons or used as an indicator for children with learning disabilities (Fagot et al., Reference Fagot, Mella, Borella, Ghisletta, Lecerf and De Ribaupierre2018). Interestingly, in Holtzer et al. (Reference Holtzer, Verghese, Wang, Hall and Lipton2008), greater dispersion in neuropsychological test performance predicted incident dementia, independent of mean performance on each individual test. By contrast, larger dispersion has also been understood as reflecting greater cognitive specialization (e.g., Mella et al., Reference Mella, Fagot and De Ribaupierre2016; Roalf et al., Reference Roalf, Gur, Ruparel, Calkins, Satterthwaite, Bilker and Ruben2014), and it has been suggested that the quality of white matter symbolizes a strong relationship with IAV (Fagot et al., Reference Fagot, Mella, Borella, Ghisletta, Lecerf and De Ribaupierre2018). In short, the debate of whether high levels of IAV, along with neurological (frontal lobe) changes, represent (a) impairment or (b) adaptation remains at large (ibid.).
We also have to bear in mind that an exclusive focus on the cognitive mechanisms underlying L2 learning ignores that “individual differences in mental functions typically involve a blended operation of cognitive, affective and motivational components” (Dörnyei, Reference Dörnyei and Macaro2010, p. 234) and that language is “not only a cognitive phenomenon, the product of the individual’s brain; it is also fundamentally a social phenomenon, acquired and used interactively, in a variety of contexts for myriad practical purposes” (Firth & Wagner, Reference Firth and Wagner1997, p. 296). For instance, cumulative empirical evidence indicates that cognitive functioning and socioaffective variables such as motivation and overall well-being play a significant role in the process of developing proficiency in another language in adulthood (Pot et al., Reference Pot, Keijzer and De Bot2018). What is more, second-to-second as well as year-to-year fluctuations in L2 motivation have been found to occasion intraindividual differences in L2 performance in the field of motivational dynamics (Dörnyei et al., Reference Dönyei, MacIntyre and Henry2015). As such, motivation is “less a trait than a fluid play, an ever-changing one that emerges from the processes of interaction of many agents, internal and external, in the ever-changing complex world of the learner” (Ellis & Larsen-Freeman, Reference Ellis and Larsen-Freeman2006, p. 563). This indicates the potential for well-constructed studies exploring the dynamism of individual differences variables on various timescales. We must also pay more attention to the contributions of and dynamic interactions between the cognitive and noncognitive dimensions of L2 learning. This is by no means a novel argument—see, for example, the cognition–motivation interface long theorized in other fields like cognitive psychology (e.g., Ackerman et al., Reference Ackerman, Sternberg and Glaser1989; Snow, Reference Snow, Ackerman, Sternberg and Glaser1989)—but in practice, few longitudinal studies pay attention to individual differences on both ends of the spectrum.
This study
Research design and research questions
The data presented in this article are part of a large-scale intervention study that employs an ecological, person-centered approach to L2 learning in the third age. We are going to focus here on the experimental group, which included 26 older participants in Austria who voluntarily participated in an instructed L2 English training. The following research questions and corresponding hypotheses were formulated:
-
1. RQ1: Do cognitive measures of within-learner variation correlate with L2 measures of within-learner variation in older adulthood?
-
• H1: Because both applied linguists and cognitive psychologists (e.g., Mella et al., Reference Mella, Fagot and De Ribaupierre2016; Rabbitt et al., Reference Rabbitt, Osman, Moore and Stollery2001) characterize IAV as a stable characteristic of individuals, we expect L2 measures and cognitive measures of IAV to correlate.
-
-
2. RQ2: Which type of L2 intraindividual variation predicts L2 development in the third age (inconsistency, dispersion, or variability), in comparison to L2 motivation, well-being and age as predictors?
-
• H2: According to various CDST scholars (e.g., Lowie et al., Reference Lowie, Van Dijk, Chan and Verspoor2017; Lowie & Verspoor, Reference Lowie and Verspoor2019) L2 learners with larger levels of variability (rather than inconsistency and dispersion) are expected to make more L2 progress. Because it is assumed that lower L2 performance results in longer response times and, regarding WM tasks, that younger adults outperform children and older adults in accuracy performance (Fagot et al., Reference Fagot, Mella, Borella, Ghisletta, Lecerf and De Ribaupierre2018), then high inconsistency and large dispersion should be indicative of lower cognitive functioning in the third age, ultimately also revealing an age effect between younger and older participants.
-
-
3. RQ3: How are rapid L2 developmental phases characterized in terms of variable learner behavior, socioaffective, variables, and cognitive functioning?
-
• H3: In line with CDST-inspired studies (Lowie et al., Reference Lowie, Van Dijk, Chan and Verspoor2017; Lowie & Verspoor, Reference Lowie and Verspoor2019), we hypothesize that periods of significant L2 growth coincide with higher degrees of IAV. As for the potential stimuli for change perceived by the participants, this remains an open empirical question.
-
To find the right balance between doing justice to the pronounced degree of inter- and intraindividual variation amongst older adults and providing accounts of dynamic systems that to beyond the individual case, a longitudinal study with time-serial data and a relatively large number of participants was carried out to yield both reliable and generalizable result. The participants’ L2 English learning was tracked alongside their performance on cognitive measures and any socioaffective fluctuations over the course of six months. At each data collection point, participants completed eight cognitive measures and three language measures, and they responded to written questions on overall well-being and training motivation, resulting in 195 measurements per person and 5,070 data points in total, respectively.
We used a mixed-methods design, where the primary (quantitative) method was used to (a) compare different types of IAV and (b) identify rapid L2 developmental phases, while the secondary method (i.e., the qualitative analysis) was supposed to identify stimuli for change and therefore buttress any weaknesses of the primary method while it was being applied (see Mackey and Bryfonski’s Reference Mackey, Bryfonski, Phakiti, De Costa, Plonsky and Starfield2018 discussion of “measurement refinement”). In other words, the written questionnaire gave a richer insight of the feelings, emotions, strategies, and so forth that would be hard to capture numerically. This is in line with Ellis (Reference Ellis2007, p. 23), who suggested that “[i]t’s not enough to highlight individual variability.…We still have to explain [it].” Before data collection commenced, ethical clearance for the project was obtained through the Ethics Committee of the University of Salzburg (EK-GZ: 21/2019). The data and codebook can be accessed on the Open Science Framework: https://osf.io/497fa/?view_only=820c056a314949d89cb3ada9dda7bf8c. All materials are available at http://www.iris-database.org.
Participants
A total of 27 beginning EFL learners between 61 and 79 (9 male, 18 female) were recruited, all living in Salzburg and Kufstein (Austria), respectively. One participant had to be excluded, as they (a) were an extreme outlier and (b) dropped out after nine sessions, so the final sample size was 26. Individuals could sign up for the study if they met the following criteria: (a) they were between 60–90 years of age, (b) right-handed, (c) healthy individuals past retirement, (d) had no history of or ongoing psychiatric or neurological diseases as well as language or learning disabilities, and (e) demonstrated adequate hearing (pure-tone thresholds below 40 dB). Those who were professional musicians, who had previously lived in an English-speaking country (3+ weeks), or who had actively used English over the past 40 years were excluded, while the rest of the participants were then controlled for language background, level of education (from vocational to university education), IQ, physical fitness, and socioeconomic status. The sample size was determined by an a priori power analysis; the effect sizes were based on one of our pilot studies (Pfenninger & Polz, Reference Pfenninger and Polz2018) and Basak et al. (Reference Basak, Boot, Voss and Kramer2008). Because nonlinear trends of generalized additive models are virtually impossible to estimate, data simulations were performed based on linear mixed-effects models.
The participants were mainly recruited by word of mouth, radio shows, through the research teams’ networks, and using flyers/posters that were hung up on the university campus and elsewhere. Reasons for participating varied from interest in scientific studies and meeting new people to wanting to improve their language skills for an upcoming vacation or, more generally, to be able to speak English as a world language.
L2 English training
The participants received two English classes of 90 minutes each week, which were taught by two teaching assistants. The curriculum has been designed by a student specializing in Fachdidaktik (ELT) (Vötter, Reference Vötter2019). The pedagogical goal of the English course was to improve learners’ English proficiency in terms of speaking, reading, and writing, by studying textbook units, and by participating in different speaking activities. The instructed English course was designed to cater to the older adult population and their needs, which is important for fostering high motivation levels (Alvarado Cantero, Reference Alvarado Cantero2008), and was based on various principles grounded in adult education (see, e.g., Amer et al., Reference Amer, Campbell and Hasher2016; Knowles et al., Reference Knowles, Holton and Swanson2011; Ramírez Gómez, Reference Ramírez Gómez2016). Classroom activities included individual, partner and group work, and teacher-fronted explanations. The training duration and intensity were based on Antoniou, Gunasekera, and Wong (Reference Antoniou, Gunasekera and Wong2013, pp. 2694–2695), estimating that learning-related cognitive and structural changes “should be expected within six months of commencing language training, with training occurring for 1h per day, 5 days per week.” Although the study was originally scheduled for an 8-month period with 32 measurements per participant, the data collection came to a halt after 15 testing sessions due to the outbreak of COVID-19.
Tests and tasks
Biodata questionnaire
The participants filled in a questionnaire on their language background at the beginning of the study, in which they detailed any previous knowledge of their L1 (German), the dialect they spoke in the L1, and any knowledge of foreign languages (except for English), types of daily activities or hobbies they were involved in, highest education level, occupation, number of household members, the age at which they started learning any previous languages, their dialect(s), how long they had been speaking each language/variety, how comfortable they felt using them, the frequency with which they spoke each of them, and in which contexts they used them (see also Kliesch et al., Reference Kliesch, Pfenninger, Wieling, Stark and Meyer2022).
Cognitive test battery
We used the same five tasks measuring cognitive abilities programmed in PsychoPy (Peirce, Reference Peirce2009) that have been previously used with older adult L2 learners (e.g., in Kliesch & Pfenninger, Reference Kliesch and Pfenninger2021; Kliesch et al., Reference Kliesch, Pfenninger, Wieling, Stark and Meyer2022): a simple WM task (n-back), which yielded (a) accuracy scores and (b) reaction times per correct trial if the total number of hits in that session was within 2 standard deviations from the mean; a complex WM task (operation-span), where the proportion of items recalled correctly were counted; the Regensburger Wortflüssigkeitstest [Regensburg Word Fluency Test], in which the sum of words produced in 1 minute were calculated; a simultaneity task to test participants’ divided attention, which also yielded accuracy scores and reaction times of participants pressing a key while the mouse was focused on the dot; and an alertness task (go-no-go), presented in randomized order to the participants so as to take their reaction times of correct trials (for more details on this test battery, see Kliesch & Pfenninger, Reference Kliesch and Pfenninger2021).
Apart from pilot-testing well, these tasks were chosen because (a) they measured skills that are known to deteriorate with age-related cognitive decline (see e.g., Salthouse Reference Salthouse2010), (b) they had been regularly used in clinical settings (including our own studies), (c) they have normative data for elderly populations, and (d) have been shown to be tapped by L2 learning. Because they were administered 15 times, some practice effects were expected, which were statistically controlled for using a passive control group. Analyses were conducted on latency scores in the reaction times tasks and on accuracy scores in the WM tasks.
L2 tasks
To avoid undue reliance on a single type of test, we administered (a) a C-Test with gaps to assess overall proficiency (C-Test score: total number of correctly completed words, 25 points max.; Raatz & Klein-Braley, Reference Raatz and Klein-Braley1981); (b) a multiple-choice Odd-One-Out task to test lexical comprehension, where participants were presented with lists of five words and had to decide which one is semantically most different from the rest (OoO score: total number of correctly identified odd-ones-out, i.e., 12 points maximum per testing; Pfenninger & Polz, Reference Pfenninger and Polz2018); and (c) a multiple-choice grammar task (Test for Reception of Grammar; TROG score: 1 point for each correctly identified image, 9 points max. per testing; Bishop, Reference Bishop2009). The L2 tests were designed under the assumption that B2 (according to Common European Framework of Reference for Languages [CEFR]) would be the maximum attainable level after 30 weeks of L2 training, so that scores of 100% accuracy would only be attained toward the end of the training (if at all). To avoid repetition effects based on the repeated observations, four versions were created for each test. No solutions or feedback were given for any of the tests.
Socioaffective assessment
At the beginning of each data collection point, socioaffect was measured prior to the respective training, which included one question on overall well-being and another on training motivation on a 100-point slider scale from “bad” to “not at all” and “very well” to “very motivated,” respectively. Even though there was a reasonable correlation between well-being and L2 motivation, there was a great deal of variance around lower values, so concatenation would have been problematic. It was thus decided to not combine motivation and well-being into one score in this dataset. Due to our understanding that many internal states (from emotions to attitudes) and external states or events (the general context in which a language is learned, a particular teacher, an illness, a particular usage event, and so on) at any given moment may have an effect on the developmental path, we administered a 28-item questionnaire at each measurement, specifically pinpointing constructs related to L2 learning in an older-adult classroom setting and participants’ feelings toward the L2 English course and their L2 English development. These dimensions addressed (a) dynamic aspects of motivation, (b) investment, (c) enjoyment versus anxiety, (d) interest, (e) identity construction, (f) overall well-being, (g) autonomy and self-efficacy, (h) strategies, (i) general communicative skills, (j) context of learning, and (k) emotions.
Data analysis and visualization
Quantitative analyses
The IAV measures were theorized and operationalized as follows. As mentioned in the preceding text, we used the term “inconsistency” to indicate IAV across trials within tasks at one data collection point. Following Fagot et al. (Reference Fagot, Mella, Borella, Ghisletta, Lecerf and De Ribaupierre2018), inconsistency was examined in each task using an intraindividual standard deviation, residualized for the individual level of performance, that is, controlling for the individual level (mean) of performance and for potential practice effects. Following Halliday et al. (Reference Halliday, Stawski, Cerino, DeCarlo, Grewal and MacDonald2018) and Mella et al. (Reference Mella, Fagot and De Ribaupierre2016), the magnitude of dispersion was operationalized as within-individual standard deviation across different types of tasks. Variability was used to refer to differences in the level of a developmental variable within individuals and between repeated measurements of the same task (i.e., intraindividual variation across time, within tasks), following Van Geert and Van Dijk (Reference Van Geert and Van Dijk2002). Also, in line with those authors, the term “stability” was used to indicate the counterpart of (or the lack of) variability. We employed Lowie and Verspoor’s (Reference Lowie and Verspoor2019) coefficient of variation (CV), which refers to the SD/Mean and indicates individual variability over time, within tasks.
To answer RQ1, we computed Spearman’s correlations and simple linear regressions with one mean score for inconsistency. The correlations were interpreted based on statistical significance, and their strength was based on their effect size (small (r = .10), medium (r = .30) or large (r = .50) [Cohen, Reference Cohen1988]). Similarly, in the simple linear regressions, f 2 = 0.02 indicates a small effect; f 2 = 0.15 indicates a medium effect; f 2 = 0.35 indicates a large effect, while in the t-tests, d = .2 is considered small, d = .5 is medium, and d = .8 is large (ibid.). For RQ2, we used generalized additive mixed modeling (GAMM; see Wieling Reference Wieling2018), which allows for smooth functions of independent variables to be incorporated into regression models. GAMM was performed using the mgcv R package (Wood, Reference Wood2006) in R (R Core Team, 2020), and results were plotted using ggplot2. We modeled an individual GAMM for each L2 outcome, controlling for age, motivation, and well-being. Cognition was not included as a control to answer RQ2, as it cannot be considered conceptually independent of L2 development (i.e., it is part of the dependent variable), so any correlation that were to be found in the analysis would be (partly) artificially created (see Kersten & Greve, Reference Kersten, Greve, Kersten and Winsler2022 for a discussion of conceptual independence). Furthermore, “age” has to be considered a container variable, that is, an “umbrella term” for more specific processes, such as the developmental state of working memory, the developing effectiveness of the individual’s executive functions, the change of complexity of the neural networks of the brain, and so forth. Thus, if cognitive functioning and age would be measured in the same analysis, age would probably absorb all variance and remain as the only predictor in the analysis. In Appendix A1, we present the best-fitting GAMMs (the simplest models were created first, while new predictors were added only if they improve the model fit). We refer the reader to the data and online code on OSF for more information on model creation and criticism.
Qualitative analyses
After identifying repeller states (i.e., rapid L2 developmental phases) as opposed to attractor states (i.e., more stable phases) through fitted additive models with superimposed periods of significant L2 change for the individual slopes (see Simpson, Reference Simpson2014), which highlight phases of significant growth in each participant’s trajectory, we zoomed in on how the participants explained those phase shifts. To this end, the qualitative data were transcribed and analyzed via the software MAXQDA (www.maxqda.de). Each line of data was coded following Corbin and Strauss (Reference Corbin and Strauss2008), from open coding (i.e., finding all possible themes that emerge) through axial coding (i.e., finding relationships between them) to selective coding (i.e., finding the overarching theme), with a focus on moment-to-moment changes, stimuli of change, and phase shifts from repeller to attractor states. To be more specific, we first familiarized ourselves with the data and identified items of interest. We then generated codes (single words, formulaic expressions, short phrases, complete sentences, etc.) in line with the RQs in the preceding text and the research literature on third age additional language learning (see Pfenninger & Singleton, Reference Pfenninger and Singleton2019), which were subsequently organized into five potential themes.
Results
Figure 1 visualizes the descriptive statistics, that is, the 26 learner trajectories for the three L2 tasks over 6 months, that is, 15 measurements. It becomes clear that the participants not only differed by the speed of their L2 development but also they did not develop along identical paths. This can also be seen in the consistently high subject-related random effects (Table A1 in Appendix A2), reflecting IAV as an idiosyncratic phenomenon.
Individual L2 trajectories in the C-Test, Odd-One-Out (OoO) and TROG.

The GAMM analyses in Figure 2 (see also Tables A1–A3 in Appendix A2) assessing the effects of time on L2 performance also show that the learners made significant L2 gains over time in all three L2 tasks.
Partial effect plot showing the fixed effect of time on L2 performance.

Performance on the receptive grammar test (TROG) appeared to reach a plateau after six weeks (see also Figure 1). According to the visualization of individual trajectories, however, there was no ceiling effect; in other words, even though the participants could obtain up to 10 points, the plateau occurred at around 6–7 points. This means that two months into the L2 training, the remaining three items were still too difficult, whereas the other 7 became too easy, thus creating a plateau.
In the following, the results will be presented in three parts corresponding to the three research questions.
Correlation of cognitive measures of within-learner variation and L2 measures of within-learner variation
Figure 3 shows the Pearson’s correlation coefficients and p-values for the relationship between the inconsistency in L2 performance and inconsistency in cognition.
Correlations between the inconsistency in L2 performance and inconsistency in cognition.

There was a relationship between inconsistency in L2 performance and inconsistency in cognition on the divided attention test and Odd-One-Out; Go-No-Go and C-Test; and alertness and TROG. The correlations were positive, indicating that individuals with higher inconsistency in L2 performance were also more inconsistent in their cognitive performance. Interestingly, while there was some noticeable correlation between the cognitive measures, there was virtually no correlation between inconsistency measures of different L2 scores, indicating that the three tasks tapped into different L2 skills, as intended.
A simple regression analysis with one mean score for cognitive inconsistency revealed that variation across cognitive tasks was a marginally significant predictor of variation in the C-test (ß = 0.59, SE = 0.29, p = 0.052, f 2 = 0.14). Inconsistency in the Odd-One-Out was predicted by inconsistency in the divided attention task (ß = 0.48, SE = 0.19, t = 2.482, p = 0.020*; f 2 = 0.21), whereas inconsistency in the TROG was not predicted by inconsistency in cognitive performance. Similarly, there was no significant correlation between L2 and cognitive dispersion. Thus, in sum, hypothesis 1 can be partially confirmed in that inconsistency in L2 performance correlates with intravariation in cognitive functioning. The latter was a significant predictor for variability in two out of three L2 tests.
Intraindividual variation as a predictor of L2 development
Variability in L2 performance within tasks—rather than inconsistency or dispersion—was a significant predictor of performance in the C-test, with more variability leading to more L2 growth (see GAMM analysis in Figure 4).
Partial effect plot showing the fixed effect of variability on L2 performance.

The opposite picture emerged for the Odd-One-Out and the TROG, where variability was a significant predictor of poorer L2 performance (at least temporarily, see the following text). Recall that the Odd-One-Out is a multiple-choice task, which means that a certain amount of chance is involved, whereas the C-Test is very robust against guessing. Arguably, an increased amount of variation in the Odd-One-Out could simply mean an increased amount of guessing or pure chance, that is, less actual L2 knowledge.
Interestingly, the effect of variability on L2 growth was not linear, as the heat maps in Figure 5 show.
Tensor product smooth for the interaction of time and variability per test (C-Test on the left, Odd-One-Out in the middle, TROG on the right). Color coding is used to represent model predictions, with yellow indicating higher and blue representing lower cognitive scores. The contour lines connect points with identical values. Vertical contour lines would indicate an effect over time but no effect of the variable on the y-axis on the respective L2 outcome, while horizontal contour lines would represent the opposite, that is, an effect of the predictor variable onto the L2 outcome but no effect of time.

In the C-Test, differences between learners with more and learners with less L2 variability started getting more pronounced with increasing length of the L2 training (i.e., after the 5th data collection point), which means that variability became a stronger predictor over time. As for the Odd-One-Out and the TROG, those differences diminished with time, that is, the negative effect of variability on the performance in those tasks gradually disappeared.
Motivation, well-being and age did not significantly predict L2 growth, except for in the TROG, where we observed a negative effect of age (i.e., in favor of younger learners) once a certain level of L2 proficiency was reached after four weeks (see Figure 6). Between weeks 6 and 11, this age effect appeared to be rather linear (see similar distance between contour lines), which means the older the participants are, the lower their L2 scores (linearly). Interestingly, this negative effect of age disappeared again after in the last few weeks of the L2 training.
Tensor product smooth for the interaction of time and age in the TROG.

Characterization of periods of significant L2 growth in terms of IAV and socioaffective variables
To explore the relevance of IAV as an indicator of an ongoing process and even the potential driving force of development, periods of significant L2 growth were compared with relatively stable periods. The fitted additive models with superimposed periods of significant L2 growth for the individual slopes illustrate developmental stages (in blue) as opposed to more stable periods, including the quantitative assessment of well-being (hearts) and L2 motivation (batteries) (for an example, see Figure 7; Appendix A3 includes all the figures). Interestingly, no periods of significant decrease could be identified for any of the participants.
Visualization of GAMM-based analysis of L2 performance over time. Blue overlays represent superimposed periods of significant L2 growth (i.e., fast learning rates).
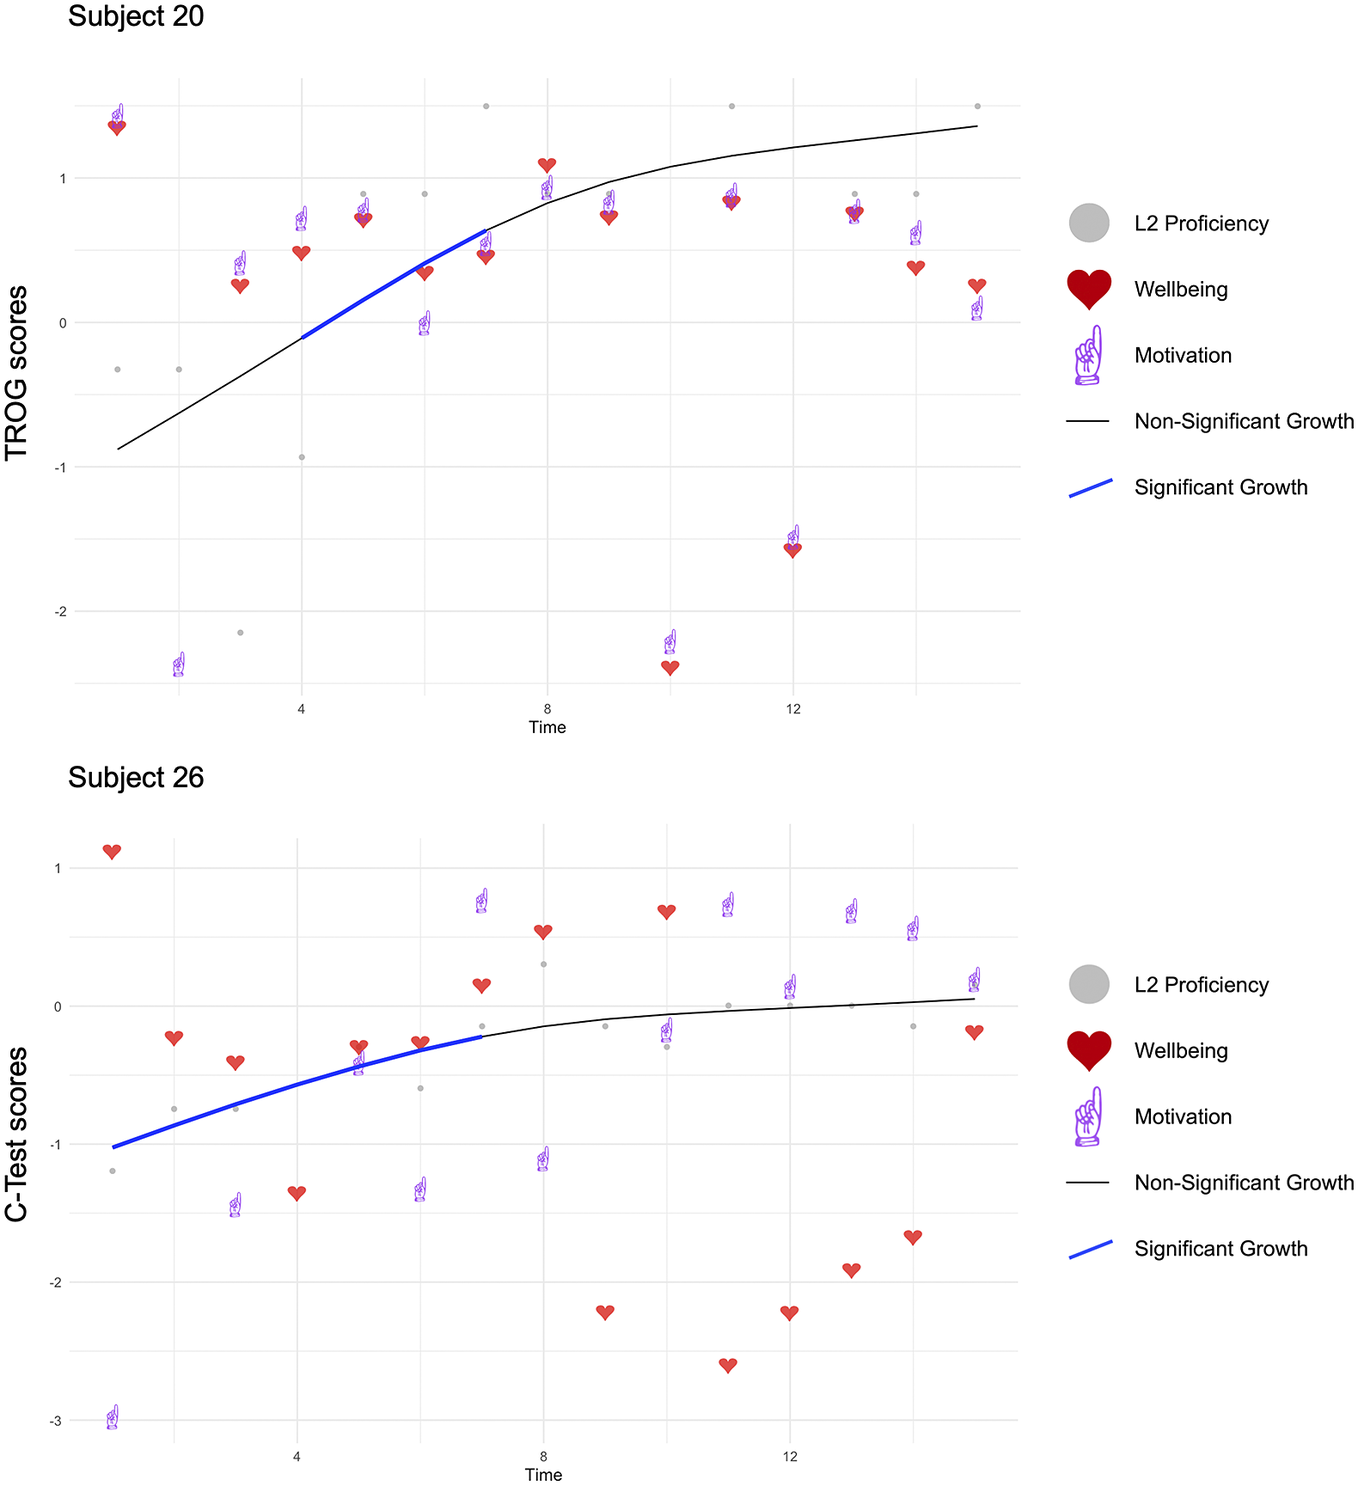
Two-tailed t-tests revealed that, again, variability (rather than inconsistency and dispersion) was especially large during periods of rapid development: 0.87 versus 0.78 in the C-Test (t = 2.208, p = 0.044*, Cohen’s d = 0.31), 0.80 versus 0.57 in the Odd-One-Out (t = 2.311, p = 0.053*, Cohen’s d = 0.32), and 0.57 versus 0.43 in the TROG (t = 2.013, p = 0.050*, Cohen’s d = 0.29). Furthermore, learners who showed more L2 variability also had higher mean levels than more stable learners in terms of motivation (76.77 vs. 74.48) and well-being (77.78 vs. 71.01), although Wilcoxon Rank Sum tests revealed that these differences were not significant and the effect sizes are weak, arguably due to the small dataset (motivation: W = 95, p = 0.4518, effect size = .04; well-being: W = 105, p = 0.2005, effect size = .09). Despite the obvious idiosyncratic developmental pathways, significant L2 growth was particularly noticeable in the early stages of L2 development for most participants (see also Figure 1).
The qualitative data shed light on drivers of L2 change, reflecting the most relevant appraisals from the participants’ point of view. According to their responses to the open-ended questions, phases of significant L2 development were predominantly characterized by the five themes presented in Table 1.
Participants’ rationales for rapid L2 developmental phases

Subjective well-being in the third age refers to an individual’s subjective experience of health, happiness, and prosperity, which is reflected in good mental health, subjective high life satisfaction, a sense of meaning or purpose of life, and ability to reduce or manage stress efficiently (Pikhart & Klimova, Reference Pikhart and Klimova2020).
As the example in (2) illustrates, in this study, shame was not linked to learner-internal variables but to a failure to create a positive impression in the mind of others (peers, family, society in general). According to Galmiche (Reference Galmiche2017) how one exists in the eye of others is of major significance, and everybody strives to be viewed as competent, talented, desirable and loved/admired, and failing to do so necessarily triggers feelings that one is unworthy of others’ attention. Importantly, shame does not necessarily impair the learning process at different stages, as demonstrated in this study.
As for (3), it is important to mention that although cognitive functioning was occasionally perceived as a barrier or obstruction, and interference with goal-attainment and of reward-expectation, the frustration process of the L2 learners in our study seemed to have aspects of emotion, tension, resistance, conflict, and aggression rather than withdrawal, regression, embarrassment, and inhibition. Interestingly, although test anxiety was also mentioned a great deal in the early stages of the training, it did not seem to impair L2 development, as early stages were characterized by L2 growth rather than plateaus (see preceding text).
Motivated learning behavior (4) was also associated with L2 growth by most participants; it describes how much effort the participants are willing to invest in language learning (Piniel & Csizér, Reference Piniel, Csizér, Dörnyei, MacIntyre and Henry2015).
Pride (5) is known to play an important role in promoting L2 learners’ motivation, creativity, interest, and performance, often positively correlating with self-efficacy, intrinsic motivation, extrinsic motivation, self-regulation, and negatively correlating with anxiety (Shao et al., Reference Shao, Pekrun and Nicholson2019, 2020).
Besides highlighting these five drivers of change as overarching themes in periods of significant L2 growth as opposed to more stable periods, the qualitative results also corroborated the picture emerging from the quantitative analysis: The participants were highly motivated to take part in the L2 training throughout the whole training period, arguably due to a selection bias both at the moment of recruitment and throughout the training. In demanding and data-rich studies, such as this one, individuals must be motivated to actively participate in the course. Interestingly, there was little variance in motivation at later stages of the L2 acquisition, too. Throughout the entire training period, the learners repeatedly said they were particularly motivated by a “social stimulus” (Pikhart & Klimova, Reference Pikhart and Klimova2020) that motivates people to learn a new foreign language: “The course takes place in a group = you are part of a community. The group represents a social context, where inter-learner relationships are a priority. We have the same goals, interests, needs” (SBG_slk_76).
Discussion
The aim of this study was to illustrate the use of microdevelopment designs to investigate intralearner variation, interrelatedness, and temporal dynamics of the multidimensional L2 system in older adults. A positive relationship between cognitive inconsistency and L2 inconsistency has been found, indicating that individuals who are more variable within L2 tasks are also more variable within cognitive tasks, which corroborates previous results in the neurocognitive sciences and in language acquisition research (see e.g., Hilborn et al., Reference Hilborn, Strauss, Hultsch and Hunter2009; Lowie & Verspoor, Reference Lowie and Verspoor2019; Mella et al., Reference Mella, Fagot and De Ribaupierre2016; Rabbitt et al., Reference Rabbitt, Osman, Moore and Stollery2001). It also supports the hypothesis (Unsworth, Reference Unsworth2015) that consistency of attention control is an important cognitive trait that is related to a number of cognitive abilities (including L2 learning).
That said, inconsistency, dispersion and variability did not reflect the same phenomenon. As in previous CDST-related studies (e.g., Lowie & Verspoor, Reference Lowie and Verspoor2019), a higher degree of L2 IAV coincided with higher C-Test scores—an effect that increased over time. This confirms the hypothesis that IAV can be interpreted as an indication that developmental changes are taking place in one or more subsystems (Spoelman & Verspoor, Reference Spoelman and Verspoor2010; Van Geert & Van Dijk, Reference Van Geert and Van Dijk2002). A lower degree of IAV, however, means that the system is relatively stable, settling into what is called an attractor state before the next change in the system takes place and variability increases again. That said, it was a specific type of IAV, namely L2 variability, rather than L2 inconsistency or L2 dispersion, that was to some extent indicative of L2 growth. Thus, our findings not only suggest that the relation of IAV to cognitive L2 development depends on the type of IAV measure and L2 measure used. It seems that variability reflects more durable within-person change, while inconsistency and dispersion are more transient and reversible within-person fluctuation (see also Holtzer et al., Reference Holtzer, Verghese, Wang, Hall and Lipton2008; Nesselroade, Reference Nesselroade, Downs, Liben and Palermo1991; Vaughan et al., Reference Vaughan, Leng, Dagenbach, Resnick, Rapp, Jennings and Espeland2013). Such findings demonstrate the interest to further decompose IAV while also showing that using only an average performance is not sufficient (although of course simpler) to understand performance at the level of an individual.
Rapid developmental phases emerged particularly in the earlier stages of L2 acquisition, with degrees of stabilization occurring as the learner’s L2 proficiency increased. The ensuing more stable periods in the second half of the training (none of the participants exceeded B1 level) could arguably be attributed to the novelty of the training in the first phase of the intervention and/or the difficulty level in the second half of the training. Elsewhere (Kliesch & Pfenninger, Reference Kliesch and Pfenninger2021), it is also argued that this pattern might be the result of temporary beneficial effects of prior knowledge of other language or cognitive skills that may only be beneficial initially and lose their significance at later stages. In any event, is important to bear in mind that attractor states do not represent periods of complete stasis, but rather of relative stability compared to turbulent repeller states and phase shifts (Larsen-Freeman & Cameron, Reference Larsen-Freeman and Cameron2008). A completely static state would not lend itself to further development.
The results also confirm the hypothesis that “learners in a rapid developmental phase may show relatively more variability than learners who have reached a more stable phase” (Verspoor & De Bot, Reference Verspoor and De Bot2021, p. 5). From a CDST perspective, variability is especially large during periods of rapid development because at that time the learner explores and tries out new strategies or modes of behavior that are not always successful and may therefore alternate with old strategies or modes of behavior (Siegler, Reference Siegler, Kuhn, Siegler, Damon and Lerner2006; Thelen & Smith, Reference Thelen and Smith1994). At early stages of development (i.e., in the first half of the training), we found relatively more variability, confirming Siegler (Reference Siegler, Kuhn, Siegler, Damon and Lerner2006), who suggested that especially early on in development, the learner discovers new approaches or strategies, and that when the learner uses them, the strategies are generally used inconsistently (see also Spoelman & Verspoor, Reference Spoelman and Verspoor2010; Van Geert & Verspoor, Reference Van Geert, Verspoor, MacWhinney and O’Grady2015). Such results show that variability patterns may be worth investigating further.
Interestingly, in the quantitative analyses, the actual (causal) contribution of L2 motivation and well-being to repeller states remained invisible, arguably because there was not enough variation of the factor within a specific set of data (Kersten & Greve, Reference Kersten, Greve, Kersten and Winsler2022). By contrast, the qualitative analysis revealed that the development of a learner’s linguistic systems is intricately intertwined with the individual cognitive, socioaffective, and emotional development and is embedded in his or her individual developmental process and in the interactions with the environment. Among the participants’ perceived stimuli for L2 change in this study we found that collective culture was an important contextual factor that shaped the positive emotion of pride (see also Shao et al., Reference Shao, Pekrun and Nicholson2019, 2020). The crucial role of positive emotions in relation to cognitive thinking, personality traits, physical health, psychological well-being, and the social environment as well as the reciprocal relationships among these variables is emphasized in various theories, such as Pekrun’s (Reference Pekrun2006) control-value theory of achievement emotions (CVT) and Fredrickson’s (Fredrickson, Reference Fredrickson2001; Fredrickson & Joiner, Reference Fredrickson and Joiner2002) broaden-and-build theory (BBT) (see MacIntyre & Gregersen, Reference MacIntyre and Gregersen2012, for a summary).
Furthermore, positive psychology stresses the positive aspects of improved well-being in participants who engage in various activities, particularly mental and brain-training practices (Pikhart & Klimova, Reference Pikhart and Klimova2020). Pfenninger and Singleton (Reference Pfenninger and Singleton2019) suggest that L2 learning in older age must be considered not just as an aim in itself but as a means of developing social inclusiveness and networking, which is partly done through the stimulation of social well-being where its cognitive effects may, potentially, be observed. Thus, improved well-being on its own might also modulate cognitive performance (Pot et al., Reference Pot, Keijzer and De Bot2018), as voiced by the participants in this study.
Recently, there has also been a move toward examining the positive effects of negative emotions (Swain, Reference Swain2013) in L2 teaching and learning. For instance, it has been suggested that different negative affective states may reflect physiologically separable states with distinct effects on cognition, depending on whether they are avoidance-motivated emotions, which are expected to impair executive function by diminishing cognitive resources, and approach-motivated emotions, which do not impair cognition (Carver & Harmon-Jones, Reference Carver and Harmon-Jones2009). For example, fatigue, negative mood states, poor well-being, and general anxiety can be considered avoidance-motivated emotions, while test anxiety, certain types of L2-related shame, and well-being are approach motivated. Because general anxiety is more cognitively draining that test anxiety, the latter is unlikely to impair executive function (Shields et al. Reference Shields, Moons, Tewell and Yonelinas2016), which might explain why test anxiety was particularly prevalent during periods of significant L2 growth in this study. Relatedly, foreign language classroom shame is often described as a factor contributing to learners’ reluctance to use the L2 and as a predictor of their disengagement from L2 learning and of their ultimate achievement (Galmiche, Reference Galmiche2014, Reference Galmiche2017). In this study, we found that one specific type of reaction style was particularly prominent in phases of significant growth: Shame not to speak English in today’s society played a significant role in the students’ willingness to pursue the learning of English. In this sense, shame is approach motivated rather than avoidance motivated. The learners’ L2 motivation was also approach motivated, but because it was generally high across the whole period of the L2 training, it did not have a particular effect on phases of significant L2 growth.
Conclusion
In many research and applied settings across the social, behavioral, and health sciences, it has been suggested that it is variability, rather than averages, that is of key interest (Feng & Hancock, Reference Feng and Hancock2022; Golino et al., Reference Golino, Nesselroade and Christensen2022). To our knowledge, this is the first study that has examined inconsistency, dispersion, and variability of L2 development in relation to cognitive functioning and socioaffect in old adulthood; and it is also the first study that has investigated age differences in all three of the defined types of IAV simultaneously.
We found, on the one hand, that there seems to be an interplay between greater L2 proficiency gains, higher degrees of L2 variability and higher levels fluctuations in L2 motivation and well-being (although this will have to be investigated further before it can be generalized). On the other hand, IAV is not meaningful per se, as it is variability rather than inconsistency or dispersion that can be considered “a required byproduct of the learning process” (Lowie & Verpoor, Reference Lowie and Verspoor2019, p. 19). Older SLA studies—going back as far as Cancino, Rosansky, and Schumann (Reference Cancino, Rosansky, Schumann and Hatch1978)—explicitly mentioned and showed the high degree of variability and variation found in their learners’ trajectories, but they did not further investigate different types of IAV and their function.
Our observations are clearly in line with what has been found in other studies observing L2 development over time from a CDST perspective, from nonlinearity of processes (progression, regression, and iteration) to temporally limited effects, complex interactions amongst variables over time, and variability as an intrinsic property of a self-organizing, developing system, where learners have their own paths (De Bot et al., Reference De Bot, Lowie and Vespoor2005; Lowie et al., Reference Lowie, Van Dijk, Chan and Verspoor2017). The analyses also reveal that learners’ individuality in the foreign language learning process and enable applied linguists to identify consistent patterns of individual differences as well as phases with significant increase/decline—and the factors that contribute to them.
The results have many implications for SLA theory, for instance, as far as the widely hypothesized meaningfulness of IAV and the potential systematic relationships between different types of IAV (Pallotti, Reference Pallotti2022) are concerned. Using and comparing inconsistency, dispersion, and variability measures across subjects therefore allows for a broader and more accurate picture of a participant’s L2 learning process and trajectory to be painted (De Ribaupierre & Lecerf, Reference De Ribaupierre and Lecerf2018; Fagot et al., Reference Fagot, Mella, Borella, Ghisletta, Lecerf and De Ribaupierre2018). While many studies relating to language acquisition and involving behavioral tasks typically favor the examination of interindividual (between-subject) variability, often times participants’ intraindividual (within-subject) variability is overlooked, or merely disregarded, due to a lack of sufficient data points in relation to time (i.e., length of the study; number of trials) and/or tasks (De Ribaupierre & Lecerf, Reference De Ribaupierre and Lecerf2018). However, this rationale should be viewed as rather problematic because using the average measure of a task may not always be the most sufficient way of truly comprehending a participant’s overall performance. Moreover, it has been argued that within-task variability may even be better representative of the level of the individual, rendering this notion relevant for the fields of aging and child development alike (Fagot et al., Reference Fagot, Mella, Borella, Ghisletta, Lecerf and De Ribaupierre2018).
Finally, we believe that the design of our study is noteworthy among the growing body of CDST-inspired studies of linguistic complexity in L2 development because of its longitudinal design in combination with its fairly dense data collection points and its number of learners, which with 26 learners investigated exceeds that of most previous CDST studies. Further research is needed to decide whether our findings are meaningful or spurious. Larsen-Freeman (Reference Larsen-Freeman2009) argued that because variability is such an important source of information about the underlying language development process, variability within individuals should be a primary center of the research focus.
Appendix A1
CTest_mod = bam(CTest_z ~
s(Time) +
s(CTest_sd_z) +
ti(Time, CTest_sd_z) +
s(Time, subject, bs = “fs,” m = 1),
data = final_df,
discrete = T, nthreads = 2)
OoO_mod = bam(OoO_z ~
s(Time) +
s(OoO_sd_z) +
ti(Time, OoO_sd_z) +
s(Time, subject, bs = ”fs,” m = 1),
data = final_df,
discrete = T, nthreads = 2)
TROG_mod = bam(TROG_z ~
s(Time, k = 9) +
s(TROG_sd_z, k = 9) +
s(Age_mc, k = 9) +
ti(Time, TROG_sd_z, k = 9) +
ti(Time, Age_mc, k = 9) +
s(Time, subject, bs = "fs,” m = 1, k = 9),
data = final_df,
discrete = T, nthreads = 2)
Appendix A2
Summary of the Generalized Additive Mixed Model with respect to the C-Test

Note: Edf = effective degrees of freedom; Ref.df = reference number of degrees of freedom.
Summary of the Generalized Additive Mixed Model with respect to the Odd-One-Out test

Note: Edf = effective degrees of freedom; Ref.df = reference number of degrees of freedom.
Summary of the Generalized Additive Mixed Model with respect to the TROG

Note: Edf = effective degrees of freedom; Ref.df = reference number of degrees of freedom.
Appendix A3
Visualization of GAMM-based analysis of L2 performance over time for the C-Test. Blue overlays represent superimposed periods of significant L2 growth (i.e. fast learningrates).

Visualization of GAMM-based analysis of L2 performance over time for the Odd-One-Out test. Blue overlays represent superimposed periods of significant L2 growth (i.e. fast learning rates).

Visualization of GAMM-based analysis of L2 performance over time for the TROG test. Blue overlays represent superimposed periods of significant L2 growth (i.e. fast learning rates).


 Open access