


Introduction
The evolution and spread of glyphosate- and multiple herbicide–resistant weed species in conservation tillage systems has led to increased use of new herbicide-tolerant soybean [Glycine max (L.) Merr.] varieties and associated POST herbicides (dicamba, 2,4-D, glufosinate), as well as increased use of soil-applied herbicides (Kniss Reference Kniss2018; Norsworthy et al. Reference Norsworthy, Ward, Shaw, Llewellyn, Nichols, Webster, Bradley, Frisvold, Powles and Burgos2012). Herbicide-resistance models indicate that applying herbicide mixtures containing multiple sites of action within crop phases and rotating sites of action across crop rotations are imperative for delaying further resistance evolution (Busi et al. Reference Busi, Goggin, Heap, Horak, Jugulam, Masters, Napier, Riar, Satchivi, Torra, Westra and Wright2018; Evans et al. Reference Evans, Williams, Hager, Mirsky, Tranel and Davis2018). In addition, integrated weed management (IWM) strategies that employ complementary chemical and nonchemical weed management tactics underpinned by ecological principles (Liebman et al. Reference Liebman, Mohler and Staver2001) are critically needed for the long-term sustainability of weed management systems and preservation of currently effective herbicides (Mortensen et al. Reference Mortensen, Egan, Maxwell, Ryan and Smith2012).
Diversity is a foundation of both IWM and sustainable agroecosystem management. Crop rotation diversity can reduce weed populations and selection pressures that drive the evolution of herbicide resistance (Weisberger et al. Reference Weisberger, Nichols and Liebman2019). Integrating fall-sown cover crops within annual grain rotations introduces additional crop diversity, extends the temporal period when a competitive crop is growing in a field, and is increasingly viewed as a best management practice for soil conservation (Hamilton et al. Reference Hamilton, Mortensen and Kammerer Allen2017; Wayman et al. Reference Wayman, Kucek, Mirsky, Ackroyd, Cordeau and Ryan2016). At a mechanistic level, cover crops serve as a weed community assembly filter by competing with weeds for light, water, space, and nutrients (Smith et al. Reference Smith, Atwood, Pollnac and Warren2015). Fall-sown cover crops provide direct competition with weed species that have overlapping life cycles, and cover crop residue left on the soil surface after termination can indirectly influence the recruitment and growth rates of summer annual weed species (Ryan et al. Reference Ryan, Mirsky, Mortensen and Teasdale2011b; Teasdale et al. Reference Teasdale, Pillai and Collins2005). Recent studies have demonstrated that integrating cover crops can increase suppression of glyphosate-resistant weeds, including fall- and spring-emerging horseweed [Conyza canadensis (L.) Cronquist] (Cholette et al. Reference Cholette, Soltani, Hooker, Robinson and Sikkema2018; Pittman et al. Reference Pittman, Barney and Flessner2019; Wallace et al. Reference Wallace, Curran and Mortensen2019) and summer annuals Palmer amaranth (Amaranthus palmeri S. Watson) and waterhemp [Amaranthus tuberculatus (Moq.) Sauer] (Loux et al. Reference Loux, Dobbels, Bradley, Johnson, Young, Spaunhorst, Norsworthy, Palhano and Steckel2017; Montgomery et al. Reference Montgomery, McClure, Hayes, Walker, Senseman and Steckel2018; Wiggins et al. Reference Wiggins, McClure, Hayes and Steckel2015).
Intensifying cover crop management via use of weed-suppressive monocultures or mixtures (Baraibar et al. Reference Baraibar, Hunter, Schipanski, Hamilton and Mortensen2018; Smith et al. Reference Smith, Atwood, Pollnac and Warren2015; Wortman et al. Reference Wortman, Francis, Bernards, Drijber and Lindquist2012), higher seeding rates (Ryan et al. Reference Ryan, Curran, Grantham, Hunsberger, Mirsky, Mortensen, Nord and Wilson2011a), or delayed termination tactics (Nord et al Reference Nord, Ryan, Curran, Mortensen and Mirsky2012; Wallace et al. Reference Wallace, Curran and Mortensen2019) will likely make cover cropping a more robust IWM tool. However, there are currently few guiding IWM principles for integrating cover crops with herbicide-based weed control tactics. We suggest that the lack of guidelines result, in part, from alternative and sometimes opposing management goals. Weed control programs have traditionally relied on a critical weed-free period management goal, but a zero seed rain management goal is increasingly recommended for multiple herbicide–resistant weeds in no-till systems with simplified crop rotations (Norsworthy et al. Reference Norsworthy, Ward, Shaw, Llewellyn, Nichols, Webster, Bradley, Frisvold, Powles and Burgos2012). The contribution of cover crops to zero seed rain management of multiple herbicide–resistant weeds remains equivocal. For example, previous studies have concluded that multiple-pass and multiple site-of-action weed control programs are still needed, regardless of cover crop selection and management, to control multiple herbicide–resistant species such as A. palmeri (Loux et al. Reference Loux, Dobbels, Bradley, Johnson, Young, Spaunhorst, Norsworthy, Palhano and Steckel2017). Consequently, when viewed as a prescriptive tool for achieving a zero seed rain management goal, integrating cover crops may be perceived by growers as contributing to additional weed control input costs, agronomic management complexity, or reduced yields due to incomplete termination of cover crops or unanticipated trade-offs related to soil fertility, crop establishment, and pest dynamics.
In contrast, cover crops are a promising tool for proactive resistance management, where additional management tactics are implemented before resistance is widespread in order to delay the evolution of resistance traits. The contribution of cover crops to proactive resistance management should be measured with different performance targets, including a measurable decrease in the intensity of selection pressure on herbicide-based weed control tactics and reduction in the number of herbicide applications or active ingredients in weed control programs. Increasing cover crop management intensity has been shown to decrease the intensity of herbicide selection pressure by reducing emerged weed population densities and the number of large individuals within the weed population at the time of herbicide exposure (Montgomery et al. Reference Montgomery, McClure, Hayes, Walker, Senseman and Steckel2018; Wallace et al. Reference Wallace, Curran and Mortensen2019; Wiggins et al. Reference Wiggins, McClure, Hayes and Steckel2015). These two population-level outcomes can potentially delay the evolution of herbicide resistance by decreasing the proportion of the seedbank that is exposed to the selection pressure of a given herbicide (Comont et al. Reference Comont, Hicks, Crook, Hull, Cocciantelli, Hadfield, Childs, Freckleton and Neve2019) and by decreasing the survival rate, and therefore fitness advantage, of larger individuals that have a disproportionate effect on the gene pool of subsequent generations (Heywood Reference Heywood1986; Weiner Reference Weiner1985).
We conducted field experiments at two mid-Atlantic locations to evaluate high-residue cover crop management across a herbicide input gradient in no-till corn (Zea mays L.) and soybean production systems. Field experiments were designed to determine whether high-residue cover crop management: (1) facilitates reduced herbicide inputs without compromising cash crop and weed control performance targets and (2) decreases the intensity of selection pressure at preplant burndown and POST herbicide application timings by reducing the density and the proportion of large individuals at the time of herbicide exposure. We evaluated weed population-level responses using artificial seedbanks of glyphosate-resistant C. canadensis and glyphosate-susceptible A. hybridus. Consequently, this study is best viewed as evaluation of proactive resistance management designed to slow future herbicide-resistance evolution by implementing IWM, rather than reactive management approaches for current, multiple herbicide–resistant weed species. Finally, we conducted a partial budget analysis to characterize the effects of cover crop–based IWM strategies on short-term profits.
Materials and Methods
Corn and soybean experiments were conducted from fall 2015 to 2017 at the University of Delaware’s Carvel Research and Education Center near Georgetown, DE, and the Penn State Russell E. Larson Agricultural Experiment Center near Rock Springs, PA. The DE sites were on Pepperbox loamy sand (loamy, mixed, semiactive, mesic Aquic Arenic Paleudults) soils and the PA sites were on Hagerstown silt loam (fine, mixed, semiactive, mesic Typic Hapludalfs) soils. Average annual growing degree days (GDD) are higher at Georgetown, DE (2,440 GDD) than Rock Springs, PA (1,660 GDD), but annual precipitation is similar between locations, averaging (30-yr) between 100 and 115 cm (NOAACD 2019). The 2016 and 2017 growing season (April to September) approximated 30-yr averages at Rock Springs, PA, for both precipitation and GDDs. At Georgetown, DE, the only departure from 30-yr averages included lower accumulated precipitation in August of the 2016 growing season. Field experiments in corn were preceded by small grain production the previous year at each site, and soybean experiments were preceded by corn the previous year at each site (PA, corn silage; DE, corn grain).
Experimental Design and Field Operations
The interaction between alternative cover-cropping and herbicide control tactics was evaluated using a two-factor, randomized complete block with a split-plot design and four replications. Cover crop treatments were imposed in main plots (PA, 12 by 12 m; DE, 12 by 8 m) and herbicide treatments were imposed in split plots (PA, 3 by 12 m; DE, 3 by 8 m). In the corn experiment, cover crop treatments included: (1) a cover crop control, (2) cereal rye (Secale cereale L.) ‘Aroostook’ + crimson clover (Trifolium incarnatum L.) ‘Dixie’ seeded at 34 + 22 kg ha−1, and (3) cereal rye + hairy vetch (Vicia villosa Roth) ‘Auburn Early Cover’ seeded at 34 + 34 kg ha−1. In the soybean experiment, cover crop treatments included: (1) a cover crop control, (2) cereal rye seeded at 135 kg ha−1, and (3) cereal rye + hairy vetch seeded at 101 + 22 kg ha−1. Seeding rate selection was informed by cover crop management practices used in organic rotational no-till systems for optimizing weed suppression and nitrogen provisioning, with grass-dominant monocultures or mixtures preceding soybean and mixtures designed to increase legume proportion preceding corn (Wallace et al. Reference Wallace, Keene, Curran, Mirsky, Ryan and VanGessel2017). Cover crops were seeded with a no-till drill in 19-cm-wide rows following a burndown glyphosate application (1.26 kg ae ha−1) after small grain harvest (early September) in the corn experiment and after corn harvest (early to mid-October) in the soybean experiment (Table 1).
Table 1. Dates of field operations in corn and soybean experiment by site (DE, PA) and year (16, 17).a
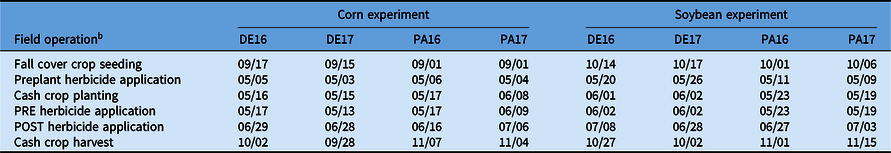
a DE, University of Delaware’s Carvel Research and Education Center near Georgetown, DE; PA, Penn State Russell E. Larson Agricultural Experiment Center near Rock Springs, PA. 16, 2015–2016; 17, 2016–2017.
b Herbicide treatment combinations include substitutive (PRE only, POST only) and additive (PRE/POST) integrated weed management (IWM) strategies.
In each experiment, an artificial C. canadensis and A. hybridus seedbank was established in separate, permanently marked 0.5-m2 microplots (0.5 by 1.0 m) in the middle of each split-plot treatment immediately after cover crop seeding each year. Mature C. canadensis and A. hybridus inflorescences were collected each season from local populations at each experimental site. Seeds were separated from inflorescences using a series of mesh screens in the laboratory, composited in a single seed lot, and dry stored at room temperature. Seeding rates were based on weight aliquots for approximately 5,000 C. canadensis seeds m−2 and 500 A. hybridus seeds m−2. Glyphosate resistance was not confirmed in C. canadensis seed lots, but C. canadensis biotypes were known to be resistant at both sites based on previous management experience.
Herbicide treatments in corn and soybean experiments included: (1) a preplant burndown application (PrePlant; herbicide control) timed to the late-boot growth stage (Zadoks 55) of cereal rye 10 d before cash crop planting; (2) PrePlant followed by (fb) a soil-applied PRE program (PRE) applied at cash crop planting; (3) PrePlant fb a POST program (POST) applied at the V3-V4 crop growth stage, approximately 35 to 42 d after cash crop planting; and (4) a three-pass herbicide program including the PrePlant, PRE, and POST applications (PRE/POST). Active ingredients used for herbicide treatments differed between corn and soybean experiments (Table 2). Herbicides were applied at 187 L ha−1 at 276 kPA using a tractor-mounted sprayer equipped with AI11002VS spray tips (TeeJet® Technologies, Glendale Heights, IL).
Table 2. Herbicide active ingredients and application rates used in corn and soybean herbicide treatments.

a Herbicide application timing for each strategy is presented in Table 1.
Corn and soybean were planted in 76-cm-wide rows with a John Deere 1720 no-till planter (Deere & Company, Moline, IL) equipped with ZRX roller-crimpers and double-disk row cleaners (Dawn Equipment, Sycamore, IL) at the PA site. Integrated ZRX systems are designed to roll-crimp cover crops at planting with use of double-disk row cleaners that move residue away from the planted row to improve seed-to-soil contact. However, the amount of soil and cover crop mulch disturbance created by these row cleaners varies based on soil moisture conditions at the time of planting. Corn and soybean were planted in 76-cm-wide rows with a Kinze 3000 planter (Kinze Manufacturing, Williamsburg, IA) at the DE site. Glufosinate-resistant corn ‘DEKALB DKC48-56RIB’ (DEKALB Genetics Corporation, DeKalb, IL 60115) was planted at 79,000 seeds ha−1, with 45 kg ha−1 N applied at planting. Glufosinate-resistant soybean ‘Doebler’s DB3217LL’ (Doebler’s Pennsylvania Hybrids, Williamsport, PA) was planted at 445,000 seeds ha−1.
Data Collection
Cover crop performance was assessed by collecting living aboveground biomass (kg ha−1) in two randomly placed 0.25-m2 microplots at the split-plot level just before termination in the spring. Aboveground biomass subsamples were composited and separated by cover crop species, oven-dried (65 C) for 5 d, and weighed. Cash crop yield performance was assessed by machine harvesting the middle two rows from each split plot using a small plot combine. Corn and soybean yields were corrected to 15.5% and 13% moisture content, respectively, for statistical analyses.
Treatment effects on weed population dynamics were assessed using multiple indicators. First, C. canadensis and A. hybridus population densities were quantified within one-half of each microplot (0.25-m2) just before PrePlant and POST applications, respectively. Second, C. canadensis populations were subsampled at the PA site at the time of PrePlant applications to quantify treatment effects on the rosette size structure of the emerged populations. The diameter of the first 10 seedlings or rosettes encountered within the two middle cover crop interrows, from the front to back of the microplots, was measured to the nearest 0.5 cm. In plots with low C. canadensis density, plants were measured in the entire microplot or until 10 plants had been assessed. Similarly, A. hybridus populations were subsampled at the PA site at the time of POST application. The height of the first 10 A. hybridus plants was measured to the nearest 1 cm in cover crop interrows. Finally, aboveground weed biomass, including the resident emerged weed community, was collected in late August from each microplot at both sites. Subsamples were separated by species, oven-dried (65 C) for 5 d, and weighed.
Statistical Analysis
Linear mixed-effect (LME) models were used to conduct null hypothesis tests of cover crop and herbicide treatment effects on cover crop biomass, grain yield, and weed biomass response variables in R using the nlme package (Pinheiro et al. Reference Pinheiro, Bates, DebRoy and Sarkar2015). Analyses were conducted by cash crop (corn and soybean) due to differences in cover crop and herbicide treatments. All models were fit with a nested random effects structure (year/site/block) to account for sources of variation associated with environmental and management differences (site, year) as well as spatial variation within site-years (block).
Fixed-effect parameters differed among LME models based on the observation timing of response variables. Total aboveground cover crop biomass (kg ha−1) was averaged at the main plot level, because split-plot treatments (herbicide) had yet to be imposed. Cash crop grain yield (kg ha−1) and total aboveground weed biomass (kg ha−1) models were fit with cover crop, herbicide, and their interaction as fixed effects. Total aboveground weed biomass and cash crop yields were log transformed after adding a constant (1.0) to meet assumptions of normality and homogeneity of variance. Statistical significance of fixed-effect terms was assessed by conditional F-tests. Fitted models were used to estimate marginal means (±SE) for each response variable using the emmeans package (Lenth et al. Reference Lenth, Singmann, Love and Buerkner2018).
Population density (plants 0.25 m−2) of C. canadensis and A. hybridus was assessed with generalized linear mixed-effects models (GLMM) using a negative binomial distribution and log link function (glmer.nb) in the lme4 package (Bates et al. Reference Bates, Maechler, Bolker, Walker, Christensen, Singmann, Dai, Grothendieck and Green2016). Data from DE in 2015 to 2016 were excluded from this analysis due to low recruitment within synthetic weed seedbanks, leaving a random effects structure of block nested within site-year and three site-year treatment levels. Population density of C. canadensis at the preplant application timing was averaged at the main plot level, because split-plot treatments (herbicide) had yet to be imposed. Models of population density of C. canadensis and A. hybridus at the POST timing were fit with cover crop, herbicide, and their interaction as fixed effects. The herbicide factor was reduced to two treatment levels by pooling treatments with or without PRE applications to compare PRE and PrePlant-only treatment effects. Statistical significance of fixed effects and their interaction terms were assessed using log-likelihood ratio tests (Wald χ2) in GLMMs (Bolker et al. Reference Bolker, Brooks, Clark, Geange, Poulsen, Stevens and White2008).
Mean separations of significant effects in both LME and GLMM models were conducted using Tukey’s contrasts (glht) in the package MULTCOMP (Hothorn et al. Reference Hothorn, Bretz, Westfall, Heiberger, Schuetzenmeister and Scheibe2008). In addition, marginal and conditional coefficients of determination (R2m and R2c, respectively) were calculated to describe the proportion of the variance in the response associated with fixed effects only (R2m) and random plus fixed-effect components (R2c) of the model using the package MuMIn (Nakagawa and Schielzeth Reference Nakagawa and Schielzeth2013).
A limited data set resulting from variable recruitment levels across site-years precluded statistical analysis of C. canadensis and A. hybridus population size structure as described in Wallace et al. (Reference Wallace, Curran and Mortensen2019). Frequency distribution plots were constructed to visually evaluate cover crop effects on weed size structure within populations. The frequency distribution of C. canadensis rosette size at the time of the PrePlant application was calculated at the main plot level and pooled across years. The frequency distribution of A. hybridus height at POST application was calculated within split plots with and without PRE applications to isolate the effect of cover crops and then pooled across years.
Preplanned contrasts from fitted models and a partial budget analysis were utilized to better understand the effects of alternative IWM tactics that integrate cover crops on weed management and economic outcomes. In each set of analyses, pairwise contrasts were conducted between the PRE/POST treatment without cover crops, representing a “standard” herbicide-based weed management strategy, and additive (i.e., adding cover crops to herbicide-based program) or substitutive (i.e., substituting cover crops for either PRE or POST herbicide inputs) IWM strategies. Fitted models of (1) total weed biomass (August), (2) C. canadensis density at the PrePlant timing, and (3) A. hybridus density at the POST timing were used to estimate the marginal means of each treatment. We then calculated pairwise multiple comparisons using the Bonferroni correction for an overall error rate of 0.05 in the emmeans package. Pairwise comparisons of weed density data analyzed with a Poisson distribution are presented as the ratio of geometric (i.e., back-transformed) means and can be interpreted as the proportional difference between treatments. Weed biomass density is presented as the difference in percent weed control by expressing treatment differences as a proportion of the weedy check (PrePlant only, no cover crop). Finally, a partial budget analysis was conducted to compare net returns to management (revenues − input costs) for alternative IWM approaches. Revenues (yield × price) were calculated using experimental yields (corn, 15.5% moisture; soybean, 13% moisture) and the national average 2016 to 2017 corn and soybean market prices: $0.13 kg−1 and $0.34 kg−1, respectively (USDA-NASS 2019). Input costs that differed among IWM approaches and were used in analyses included chemicals, cover crop seed, and field operation passes (Supplementary Table 1). Chemical and cover crop seed costs were obtained from mid-Atlantic distributors (Helena Chemical, Warriors Mark, PA 16877; King’s Agriseeds, Lancaster, PA), and field operation costs were taken from 2016 Penn State University crop enterprise budgets (Harper Reference Harper2016).
Results and Discussion
Cover Crop Performance
Mean total aboveground cover crop biomass did not differ (P < 0.05) between cover crop treatments in the corn and soybean experiments (Figure 1). Random effects associated with management and environmental conditions across sites and years contributed 80% and 50% of the total variation observed in total aboveground biomass production in corn and soybean experiments, respectively. Mean cover crop biomass ranged from 2,000 to 8,500 kg ha−1 across sites and years in the corn experiment and 3,000 to 5,500 kg ha−1 in the soybean experiment. For comparison, targeted weed-suppressive biomass levels for organic grain production, which is characteristically more management intensive, range from 5,000 to 9,000 kg ha−1 (Mirsky et al. Reference Mirsky, Ryan, Curran, Teasdale, Maul, Spargo, Moyer, Grantham, Weber, Way and Camargo2012; Wallace et al. Reference Wallace, Keene, Curran, Mirsky, Ryan and VanGessel2017). Observed variation in cover crop biomass production and the grass–legume ratio highlight how environmental and soil factors, rather than management practices such as cover crop species selection and seeding rates, drive biomass accumulation.

Figure 1. Mean cover crop biomass (kg ha−1) by site-year and cover crop treatment in (A) corn and (B) soybean experiments. Data (mean ± SE) are presented as total cover crop biomass and by species in grass/legume mixtures. Cover crop treatments were not significantly different (P > 0.05) within corn and soybean experiments. See Table 1 for definitions of site-year abbreviations.
Weed Control and Yield Performance Targets
In the corn experiment, total aboveground weed biomass (August) showed a cover crop by herbicide treatment effect (F(6, 165) = 2.5, P = 0.02). Cover crops had no effect on total aboveground weed biomass in PRE, POST, and PRE/POST herbicide strategies, but rye/clover reduced weed biomass compared with no cover crop in the PrePlant-only treatment (Figure 2A). Within each cover crop treatment level, weed biomass was lower in PRE, POST, and PRE/POST treatments compared with PrePlant only. Pairwise comparisons between PRE, POST, and PRE/POST treatments within cover crop treatments did not differ, with the exception of rye/vetch, for which weed biomass was lower in the PRE/POST strategy compared with POST only. Weed management treatments explained 51% of the total variation observed in total aboveground weed biomass, whereas random effects associated with environmental and management conditions contributed 10% of total variation. Herbicide and cover crop treatments did not affect (P > 0.05) corn yield (Figure 2B). Corn yields approximated county-level averages, with exception of the 2016 experiment in DE, where drought conditions likely contributed to below-average corn yields.

Figure 2. Mean total aboveground weed biomass (A and C) and cash crop yields (B and D) by herbicide and cover crop treatment in corn and soybean experiments. Weed biomass was collected in late August and included seeded weed species (Conyza canadensis, ERICA; Amaranthus hybridus; AMACH) and the resident weed community. Data are estimated population-level log-transformed means (±SE) of fixed effects. See Table 1 for definitions of site-year abbreviations.
In the soybean experiment, herbicide (F(3, 164) = 90.1, P < 0.0001) and cover crop (F(2, 164) = 8.8, P = 0.0002) treatments resulted in additive effects on aboveground weed biomass (August; Figure 2C). Each herbicide program (PRE, POST, PRE/POST) resulted in lower weed biomass than PrePlant only, and herbicide treatments with POST applications resulted in lower weed biomass than the PRE treatment. Weed biomass was lower in cover crop treatments compared with the control across herbicide strategy levels. Weed management treatments explained 44% of the total variation observed in total aboveground weed biomass, whereas random effects associated with environmental and management conditions contributed 27% of total variation. Herbicide treatments had a significant effect (F(3,164) = 26.4, P < 0.0001) on soybean yield (Figure 2D), with lower yields observed in the no-herbicide control compared with other herbicide programs (PRE, POST, PRE/POST). Soybean yields approximated county-level averages, with exception of the 2016 experiment in DE, where drought conditions likely contributed to below-average corn yields.
In summary, these results indicate that herbicide-based tactics were the primary drivers of weed suppression, and cover crops generally provided additional weed suppression that was smaller in magnitude. Our results do not provide supporting evidence that surface residue mulch reduced herbicide efficacy or cash crop yields. Recent studies in corn and soybean production regions of the Midwest and Midsouth support the inference that herbicide inputs are the primary driver of cash crop yields and weed control performance, including multiple herbicide–resistant Amaranthus spp., when cover crops are integrated as a component of an IWM strategy (Loux et al. Reference Loux, Dobbels, Bradley, Johnson, Young, Spaunhorst, Norsworthy, Palhano and Steckel2017; Montgomery et al. Reference Montgomery, McClure, Hayes, Walker, Senseman and Steckel2018; Wiggins et al. Reference Wiggins, McClure, Hayes and Steckel2015).
Herbicide Selection Pressure on Weed Populations
In the corn experiment, cover crop main effects were significant (χ2 = 29.5, P < 0.001) for C. canadensis density at the PrePlant application timing. Both cover crop treatments reduced C. canadensis density compared with the control (Figure 3A). High levels of C. canadensis control efficacy were observed following the PrePlant application across treatments, which precluded reliable model fit of C. canadensis density at the POST application timing. A significant herbicide main effect (χ2 = 46.2, P < 0.001) was observed in analysis of A. hybridus density at the POST application timing, in which PRE residual herbicides reduced A. hybridus density compared with no PRE herbicides across cover crop treatments (Figure 3B). In PA experiments, 18% of C. canadensis rosettes exposed to PrePlant applications in the cover crop control were larger than 7.6 cm in diameter (Figure 3C), which is associated with decreased efficacy of glyphosate and auxinic herbicides on C. canadensis in spring preplant applications (Dinelli et al. Reference Dinelli, Marotti, Bonetti, Minelli, Catizone and Barnes2006). Similarly, 3% of A. hybridus plants exposed to POST applications in the cover crop control exceeded 10 cm in height (Figure 3D), which is the maximum weed height commonly recommended on herbicide labels and a best management practice for maintaining herbicide efficacy. In comparison, no C. canadensis rosettes or A. hybridus plants exceeded a 5-cm diameter or 8-cm height, respectively, in treatments with cover crops.

Figure 3. Weed population dynamics in response to herbicide and cover crop treatments in corn experiment, including: (A) Conyza canadensis (ERICA) density just before PrePlant and POST herbicide applications; data are treatment means (±SE) by cover crop treatment and pooled across site-years. (B) Amaranthus hybridus (AMACH) density just before POST application timing in response to cover crop treatment and with or without a PRE application across site-years; horizontal line within box plots indicates median, whiskers extend to 1.5 × interquartile range, and dots indicate outliers. (C) Relative frequency distribution of C. canadensis rosette diameter at the PrePlant application timing by cover crop treatment and pooled across Pennsylvania site-years. (D) Relative frequency distribution of A. hybridus height just before POST application timing by cover crop in treatments that excluded a PRE application and pooled across Pennsylvania site-years.
In the soybean experiment, cover crop main effects were significant (χ2 = 11.2, P < 0.01) for C. canadensis density at the PrePlant timing. Rye/vetch reduced C. canadensis density compared with the control and rye only, which did not differ in pairwise comparisons (Figure 4A). High levels of C. canadensis control were also observed following PrePlant application in soybean. At the POST application timing, a significant herbicide main effect (χ2 = 26.7, P < 0.001) was observed, in which C. canadensis density was lower when herbicide strategies included a PRE application. Analysis of A. hybridus density at the POST application timing showed a cover crop by herbicide effect (χ2 = 9.5, P < 0.01), in which the PRE application resulted in lower A. hybridus density within the cover crop control but herbicide treatment differences were not observed within rye and rye/vetch treatments (Figure 4B). In PA soybean experiments, 25% of C. canadensis rosettes exposed to PrePlant applications in the cover crop control exceeded 7.6 cm in diameter, whereas no C. canadensis rosettes exceeded a diameter of 6 cm in treatments with cover crops (Figure 4C). In the cover crop control, 75% of A. hybridus plants exposed to POST applications exceeded 10 cm in height, as opposed to 15% in both treatments with cover crops (Figure 4D).

Figure 4. Weed population dynamics in response to herbicide and cover crop treatments in soybean experiment, including: (A) Conyza canadensis (ERICA) density just before PrePlant and POST herbicide applications; data are treatment means (± SE) by cover crop treatment and pooled across site-years. (B) Amaranthus hybridus (AMACH) density just before POST application timing in response to cover crop treatment and with or without a PRE application across site-years; horizontal line within box plots indicates median, whiskers extend to 1.5 × interquartile range, and dots indicate outliers. (C) Relative frequency distribution of C. canadensis rosette diameter at the PrePlant application timing by cover crop treatment and pooled across Pennsylvania site-years. (D) Relative frequency distribution of A. hybridus height just before POST application timing by cover crop in treatments that excluded a PRE application and pooled across Pennsylvania site-years.
Contrasting Alternative Weed Management Strategies
To provide a deeper understanding of economic and management trade-offs associated with integrating cover crops, we performed multiple contrasts between the “standard” herbicide-based strategy (PRE/POST) without cover crops in our study and alternative IWM-based strategies that integrated cover crops, including (1) an “additive” strategy that aims to enhance weed suppression and diversify selection pressure by integrating cover crops with “standard” herbicide-based strategies and (2) a “substitutive” strategy that aims to reduce herbicide inputs by substituting cover-cropping tactics for PRE or POST herbicides.
Additive and substitutive strategies resulted in increased input costs relative to a herbicide-based strategy in corn (Figure 5) and soybean (Figure 6). Substituting cover-cropping tactics for PRE herbicides resulted in only marginal differences in input costs relative to the herbicide-based strategy when hairy vetch was excluded from the cover crop mixture. Revenues from corn and soybean were not significantly different (P > 0.05) in comparisons between IWM and herbicide-based strategies, but mean estimates for IWM strategies were lower than the herbicide-based strategy in 10 of 12 contrasts. Lower net returns to management were observed across all IWM strategies compared with the herbicide-based strategy, which was primarily a function of differences in input costs rather than differences in revenue. We recognize that this partial budget analysis is highly context dependent, but it is instructive for identifying factors that will shape economic decision making and outcomes when proactive IWM strategies are employed. First, we note that our PRE programs were designed for the expected weed community. Presence of multiple-resistant summer annual weeds within cropping systems would necessitate inclusion of more active ingredients and increase herbicide input costs. Next, cover crop seed costs can be highly variable depending on source (i.e., certified variety, bin run), seeding rate, and species mixture. Seeding rates used in the this study were adopted from organic no-till practices that rely on cover crop residues as the primary weed-suppression tactic. Integrating cover crops with herbicide-based control tactics likely presents opportunities for reducing cover crop seeding rates and should be explored. Finally, due to widespread farmer interest in soil health and other associated ecosystem services (Schipanski et al. Reference Schipanski, Barbercheck, Douglas, Finney, Haider, Kaye, Kemanian, Mortensen, Ryan, Tooker and White2014), long-term net returns and nonmarket benefits are increasingly considered in economic decision making related to cover cropping, extending beyond a singular focus on weed management goals.

Figure 5. Pairwise comparisons of economic and weed management outcomes between the “standard” herbicide-based strategy (PRE/POST) without cover-cropping and alternative integrated weed management (IWM) strategies that integrate cover crops in corn production. IWM strategies include adding cover crops to herbicide-based strategies (additive) or substituting cover crops for PRE or POST herbicide inputs (substitutive). Input costs reflect differences among strategies in use of cover crop seed, herbicide, labor, and fuel. Pairwise comparisons are presented by cover crop tactic (i.e., species). Significant differences are denoted by asterisks (***P < 0.001; **P < 0.01); input costs and net returns were not subjected to significance tests.

Figure 6. Pairwise comparisons of economic and weed management outcomes between the “standard” herbicide-based strategy (PRE/POST) without cover-cropping and alternative integrated weed management (IWM) strategies that integrate cover crops in soybean production. IWM strategies include adding cover crops to herbicide-based strategies (additive) or substituting cover crops for PRE or POST herbicide inputs (substitutive). Input costs reflect differences among strategies in use of cover crop seed, herbicide, labor, and fuel. Pairwise comparisons are presented by cover crop tactic (i.e., species). Significant differences are denoted by asterisks (**P < 0.01); input costs and net returns were not subjected to significance tests.
In our study, total weed control (%) was not significantly different (P > 0.05) in comparisons between each additive and substitutive strategy and the herbicide-based strategy in corn (Figure 5) and soybean (Figure 6). The absence of significant differences among strategies for both crop yield and weed control suggests that there are opportunities for reducing herbicide inputs as a proactive resistance management approach in cropping systems that are uninvaded by multiple herbicide–resistant summer annual weed species. However, general trends in our data suggest that substituting cover crops for herbicide inputs have the potential to sustain critical-period weed management goals but compromise zero seed rain management goals. Mean weed control levels were 3% to 15% lower when cover crops were substituted for POST herbicides and 0% to 9% lower when cover crops were substituted for PRE herbicides. In comparison, weed control levels within additive cover crop strategies were 6% lower to 2% higher than herbicide-based strategies.
The effect of IWM strategies on weed population densities at time of herbicide exposure produced similar trends in corn (Figure 5) and soybean (Figure 6) but differed between winter annual (C. canadensis) and summer annual (A. hybridus) weed species. With exception of the cereal rye monoculture treatment in soybean, cover-cropping tactics significantly reduced C. canadensis density at the PrePlant application timing compared with the herbicide-based strategy. In contrast, substituting cover crops for PRE herbicides resulted in higher A. hybridus population density (P < 0.01), and thus greater herbicide selection pressure at the POST application timing compared with the standard herbicide-based strategy.
Recent studies have consistently demonstrated significant C. canadensis population reductions within fall-sown cover crops compared with winter fallow (Cholette et al. Reference Cholette, Soltani, Hooker, Robinson and Sikkema2018; Pittman et al. Reference Pittman, Barney and Flessner2019; Wallace et al. Reference Wallace, Curran and Mortensen2019), but the impact of cover crop species and seeding rates on C. canadensis recruitment remains equivocal. Wallace et al. (Reference Wallace, Curran and Mortensen2019) reported that fall cover crop biomass production and foliar ground cover were the most important predictors of spring C. canadensis population density, whereas spring biomass production was the primary driver of C. canadensis rosette size at the time of preplant herbicide exposure. Though results from our study and others indicate that cover cropping can contribute to herbicide-resistance management by reducing the total population and number of large C. canadensis individuals exposed to herbicide selection, additional management challenges may arise. For example, complete suppression of C. canadensis by cover crops has not been observed in published studies, which highlights the need for effective herbicide-based control tactics within fall-sown cover crops. In this management scenario, herbicide applications will need to be optimized to ensure C. canadensis individuals surviving within cover crops are exposed to effective herbicide doses, because reduced herbicide deposition through cover crops could result in recurrent selection to low herbicide doses, which has been shown to result in evolution of resistance in certain weed species (Neve and Powles Reference Neve and Powles2005).
Cover-cropping effects on the exposure of A. hybridus populations to POST herbicide applications varied in magnitude across our corn and soybean experiments, but results suggest that the presence of surface mulch likely lengthens management windows for on-label POST applications that target small weeds. Wiggins et al. (Reference Wiggins, McClure, Hayes and Steckel2015) and Montgomery et al. (Reference Montgomery, McClure, Hayes, Walker, Senseman and Steckel2018) showed that integrating high-residue cover crops like crimson clover or hairy vetch extended the length of time during which POST applications targeting A. palmeri remained on label due to delayed recruitment or reduced growth rates from cover crop mulch interference. Extending management windows for A. palmeri is particularly critical given high relative growth rates, but such benefits are likely to extend for many summer annual species that are adapted to emerge with or in a cash crop.
In our study, PRE herbicides resulted in lower A. hybridus populations at the time of POST herbicide exposure compared with cover crop mulch alone. Cover crop mulch properties can have significant impacts on the fate of residual herbicides by influencing interception, retention, and degradation processes in no-till systems (Alletto et al. Reference Alletto, Coquet, Benoit, Heddadj and Barriuso2010; Cassigneul et al. Reference Cassigneul, Alletto, Benoit, Bergheaud, Etievant, Dumey, Le Gac, Chuette, Rumpel and Justes2015). Previous studies suggest that integrating cover crop residues and soil-applied residual herbicides can result in synergistic or antagonistic effects on early-season weed suppression (Teasdale et al. Reference Teasdale, Shelton, Sadeghi and Isensee2003, Reference Teasdale, Pillai and Collins2005). Emerging cover-cropping practices that include delaying cover crop termination until or after cash crop planting increase the likelihood of reduced bioavailability of residual herbicides due to interception by cover crop residues. For example, Whalen et al. (Reference Whalen, Shergill, Kinne and Bish2020) reported that the soil concentration and weed control efficacy of sulfentrazone applied preplant or POST was higher in earlier-terminated (21 d preplant) cover crop systems compared with later-terminated (7 d preplant) systems.
In summary, developing complementary weed control tactics that reduce the intensity of herbicide selection pressure while maintaining weed control and cash crop yield performance targets is imperative in no-till grain crop production systems. Our study indicates that reducing herbicide selection pressure is a potential nonmarket benefit of intensified cover crop management that may be considered with other ecosystem services when assessing long-term net returns to management. In the near term, rotation of herbicide mixtures remains the primary recommendation for prevention of herbicide-resistance evolution (Busi et al. Reference Busi, Powles, Beckie and Renton2019), yet there is increasing concern that evolution of cross-resistance to multiple herbicide sites of action will reduce the long-term efficacy of this strategy (Liu et al. Reference Liu, Neve, Glasgow, Wuerffel, Owen and Kaundun2020; Nandula et al. Reference Nandula, Riechers, Ferhatoglu, Barrett, Duke, Dayan, Goldberg-Cavalleri, Tetard-Jones, Wortley, Onkokesung, Brazier-Hicks, Edwards, Gaines, Iwakami and Jugulam2019). Reducing herbicide inputs in favor of intensified cultural control practices offers an alternative path forward. Our study suggests that high-residue cover crop management offers opportunities for reducing herbicide inputs while meeting crop protection goals but should be integrated with other nonchemical control tactics, such as harvest weed seed control (Shergill et al. Reference Shergill, Bejleri, Davis and Mirsky2020), to achieve zero seed rain management goals. Finally, we suggest that herbicide-resistance management and economic returns will likely improve with advances in planter technologies for high-residue cover-cropping systems and improved decision tools for cover crop species and seeding rate selection. Further development of high-residue cover-cropping practices, coupled with a deeper understanding of weed population dynamics in high-residue cover crops, is needed to improve the performance of integrated cover-cropping and herbicide-based tactics to consistently realize IWM goals.
Acknowledgments
This research was funded by USDA-CPPM award 2014-70006-2251 and the Pennsylvania Soybean Board. No conflicts of interest have been declared. We are grateful for the assistance of Tosh Mazzone, Dayton Spackman, and many undergraduate employees.
Supplementary material
To view supplementary material for this article, please visit https://doi.org/10.1017/wsc.2020.49


 Open access