


Introduction
High-entropy alloys (HEAs) have attracted great attention in the academy over the last 15 years, as many useful and unique properties have been discovered from such materials with a high degree of configurational entropy [Reference Yeh, Chen, Lin, Gan, Chin, Shun, Tsau and Chang1]. HEAs are generally described as alloys comprising five or more elements in a compositional range of 5–35 at.% each, generally forming a single solid-solution (SS) phase. Other terms such as multiprincipal element alloys (MPEAs), complex concentrated alloys (CCAs), and high-entropy materials (HEMs) are generally used to describe the broader range of multicomponent alloys, including multiphase HEAs, which are not restricted to single-phase formation [Reference Miracle and Senkov2, Reference Tsai and Yeh3].
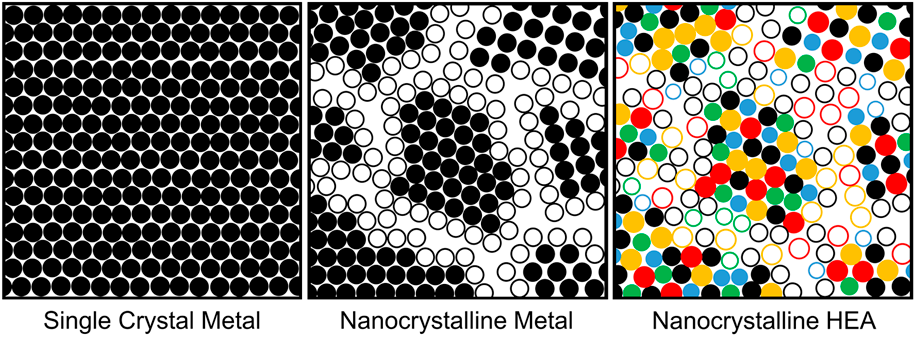
Nanocrystalline (NC) materials, with their grain size <100 nm, have brought both scientific and technical interests since the 1980s, especially NC metals and alloys [Reference Gleiter4]. In NC materials, it is the grain boundaries, rather than their compositions, that influence their mechanical and functional properties substantially, for example, enhanced material strength by grain refinement has seen much success over the past three decades [Reference Gleiter4, Reference Koch5]. However, the current limitation that restricts the use of NC metals in elevated, and even moderate, temperature environments is their poor thermal stability, as grains dramatically coarsen with time. Some early studies suggested that alloying may stabilize nanometer-sized grains, improving the thermal stability of NC metals and providing additional strength through combined grain-boundary and SS strengthening mechanisms [Reference Weissmüller6, Reference Weissmüller7]. It is from this theory that the progression from single crystals to NC metals to NC HEAs [Fig. 1(a)] in recent literature has emerged.
(a) Microstructural schematic of the progression from single crystal metals to NC metals to NC HEAs and (b) core effects of HEAs proposed by Yeh [Reference Yeh8]. The hollow and solid circles represent atoms that lie on grain boundaries and within grains, respectively.
Combining the alloying and grain-size effects, NC and nanostructured HEMs have attracted much attention over the past five years. This article outlines the progress in this field and assesses the current state of validation of entropy-based stabilization theories. Synthesis processes, types of materials, mechanical properties, thermal stability, and a few functional properties will be reviewed. This article will provide insight into the most recent advancements in HEMs and identify the gaps in knowledge and direction, in which novel HEM research may progress rapidly in the future.
Core effects in HEAs
Four core effects characterizing the behavior of HEAs were initially proposed by Yeh in 2006 [Reference Yeh8]: high-entropy, sluggish diffusion, severe lattice distortion, and “cocktail” effects. As shown in Fig. 1, the ultimate source of such effects stems from either size mismatch (i.e., the difference in atomic radii) or the quantity of alloying elements. The resultant properties are amplified lattice-sensitive properties, slower kinetics, and enhanced stability of SS phases. Contrarily, the cocktail effect describes the innate complexity of trying to anticipate the properties of a configurationally complex alloy. Collectively, these four effects can be used to predict mechanical and functional properties that certain compositions of HEAs can exhibit. These effects are discussed in further detail in the literature [Reference Miracle and Senkov2, Reference Tsai and Yeh3].
Thermodynamics of phase formation in HEAs
Phase formation in HEAs is predominantly governed by a competition between the stability of SS and intermetallic (IM) phases. Although it is typically desirable to avoid IM phases because of their inherent brittleness, in CCAs, this is often difficult because of the heightened number of compositional degrees of freedom, as described by the Gibbs phase rule. The Gibbs free energy of a given phase ϕ is calculated as [Reference Miracle and Senkov2]
 $${G^\phi } = {H^\phi } - T{S^\phi }\quad .$$
In this case, we consider the phase ϕ as either SS or IM. From this equation, the more stable phase will be one that best balances the minimization of enthalpy and maximization of entropy. It is from this balance that the competition between SS and IM phase formation is apparent.
Strengthening mechanisms in HEAs
Solid-solution strengthening
As a cornerstone of HEA development, SS strengthening is an effective mechanism by which the strength of materials can be increased. Strengthening results from the pinning of dislocations due to local lattice strain within the grains of a material. Lattice strain arises from an atomic radius and elastic modulus mismatch between the constituent elements. Modeling of the strengthening contribution from the addition of solute atoms (ΔσSS) in dilute binary systems has been extensively studied, with the most widely accepted models being those proposed by Fleischer [Reference Fleischer9] and Labusch [Reference Labusch10], which are expressed as
 $$\Delta {\sigma _{{\rm{SS}}}} = {B_i}X_i^{{1 \over c}}\quad ,$$
where ΔσSS is the increase in yield strength, c a constant (typically around 2–3), X i the solute concentration (in atomic fraction), and B i a hardening parameter dependent on the atomic mismatch, shear modulus, and elastic misfit.
However, HEA systems are much more complex than binary alloys because of enhanced interactions between different atoms in the crystal lattice. Few models have been proposed to accurately describe the SS strengthening behavior in multicomponent alloys. Early attempts by Gypen and Deruyttere [Reference Gypen and Deruyttere11] made assumptions that solutes within the material do not interact with one another. The issue with this model is that the atomic size misfit that exists in the continuously deformed matrix of HEAs is not considered, making it only applicable to multicomponent alloys compositionally dominated by a single element. The most recent model by Toda-Caraballo and Rivera-Díaz-del-Castillo [Reference Toda-Caraballo and Rivera-Díaz-del-Castillo12] builds on the Labusch model and demonstrates a good fit to experimental data. Their model goes beyond that of other attempts, taking into account a number of effects unique to HEAs [Reference Toda-Caraballo and Rivera-Díaz-del-Castillo12]. The HEA SS strengthening effect, ΔσSS,HEA, can thus be modeled by
 $$\Delta {\sigma _{{\rm{SS,HEA}}}} = {\left( {\sum\limits_i {B_{i,L}^{{3 \over 2}}{X_i}} } \right)^{2/3}}\quad ,$$
where B i is calculated in the same way as in the Labusch model. From this relationship, we anticipate a pronounced strengthening effect in HEAs compared with “conventional” binary alloy systems.
Grain-boundary strengthening
Grain-boundary strengthening is one of the most widely studied strengthening mechanisms. The premise behind it is the enhanced impingement of dislocation motion through the introduction of more grain boundaries within a material (i.e., decreasing grain size). The relationship between yield strength (σy) and grain size (D) is known as the Hall–Petch (H–P) relationship [Reference Hall13, Reference Petch14]:
 $${\sigma _{\rm{y}}} = {\sigma _{\rm{o}}} + {k_{\rm{y}}}{D^{ - {1 \over 2}}}\quad ,$$
where σo is the overall resistance of the lattice to dislocation motion and k y is a constant related to the relative hardening contribution of grain boundaries [Reference Luo and Wang15]. As Eq. (4) suggests, when the average grain size of a material is decreased, its strength increases. This relationship is the major driving force behind the development of NC materials (defined in this article as materials with a grain size <100 nm), where this effect becomes further enhanced at very low values of D because of the inverse–square root relationship. However, this relationship tends to break down at very small grain sizes, typically around 10–20 nm. At this point, an inverse H–P relationship takes over, in which pronounced softening takes place with decreasing grain size. The mechanisms underlying the inverse H–P effect include dislocation- or diffusion-induced grain-boundary shearing and sliding, grain rotation, and two-phase–based models [Reference Carlton and Ferreira16]. Because of its complex nature, the inverse H–P effect will not be further discussed in this article, which will instead only explore the mechanical properties and deformation mechanisms of materials in the grain size range ∼10–100 nm.
Coupling grain-boundary strengthening with the high-entropy effect
To make these NC materials more universally functional across engineering systems, many studies have focused on devising methods to stabilize such small grains over larger temperature and time scales. In determining the methods by which we can effectively stabilize NC grains, we must first outline the thermodynamic parameters that affect grain growth. The rate of grain growth can be represented thermodynamically by the grain-boundary velocity, v g, which is the product of the grain-boundary mobility (M g) and the difference in total driving (F t) and drag (F d) forces acting on a grain [Reference Gottstein and Shvindlerman17], as expressed by Eq. (5).
 $${v_{\rm{g}}} = {M_{\rm{g}}}\left( {{F_{\rm{t}}} - {F_{\rm{d}}}} \right)\quad .$$
The total driving force can be contributed to by many factors, including stored deformation energy, grain-boundary energy, surface energy, chemical driving force, magnetic field, elastic energy, and temperature gradients [Reference Gottstein and Shvindlerman17]. In NC materials, the driving force for a reduction in grain-boundary energy (F g) is often the dominating term in F t because of their small grain size. This driving force is calculated using the following equation:
 $${F_{\rm{g}}} = {{2\gamma } \over D} = {{\Delta G} \over {{V_{\rm{m}}}}}\quad ,$$
which is also known as the Gibbs–Thompson equation [Reference Porter, Easterling and Sherif18]. According to Eq. (5), there are three possible ways of stabilizing grains: decreasing the driving force, decreasing the mobility, and increasing the drag force. In NC HEAs, although the grain size (D) is very small, the effective grain-boundary energy (γ) is inherently low compared with conventional alloy classes, leading to a decrease in the driving force [Reference Weissmüller6]. This is due to a combination of segregation of solutes along boundaries and heightened energy levels in the distorted matrix compared with a matrix of pure metal. In terms of mobility, the probability of an atom successfully “jumping” across a grain boundary is lower because of the configurational complexity and the need for coordinated movement of different atoms. Lastly, high diffusivity along grain boundaries compared to the bulk diffusivity can lead to pronounced localized segregation of certain elements, which increases the drag force. The overall combined effect should result in a lower rate of grain growth upon heating in HEAs than conventional materials with similar melting points. Such results have been reported in 3d transition and refractory metal HEAs [Reference Zou, Ma and Spolenak19, Reference Liu, Wu, He, Nieh and Lu20, Reference Sriharitha, Murty and Kottada21, Reference Sathiyamoorthi, Basu, Kashyap, Pradeep and Kottada22], which will be discussed further in the following sections.
Methods to prepare NC HEAs
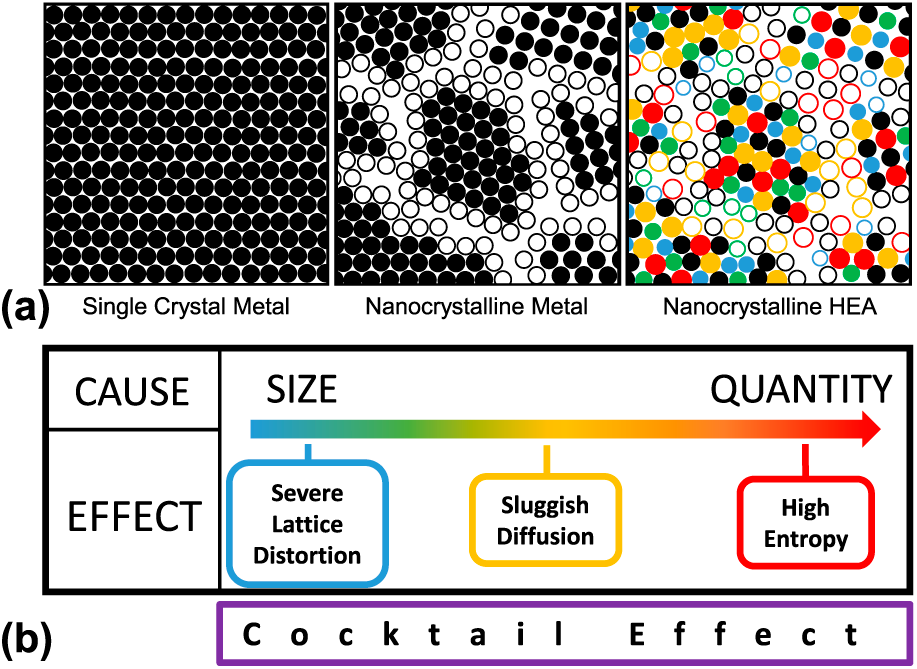
There are many methods of preparing NC materials for various applications, length-scale capabilities, energy requirements, and capital costs. Table I lists the advantages and disadvantages of each NC-material synthesis category. Although there are other unique synthesis methods, we can generally classify them into one of these categories.
Advantages and disadvantages of five major classes of NC material synthesis techniques.
Of these synthesis methods, mechanical alloying (MA), thermal spraying, and electrodeposition are the most industrially scalable, which are potentially able to produce large volumes of NC materials within a reasonable time frame. Scalability studies surrounding combined severe plastic deformation (SPD) techniques have been performed, with samples more than 800 mm in length and 6.5 mm in diameter [Reference Valiev and Wang23]. However, the large-scale adoption of these techniques is currently not existent. Although they have much higher operating costs, vapor deposition techniques can yield very uniform and contamination-free NC metals as a result of their well-controlled and isolated working environment.
We can also investigate the popularity of each method as it relates specifically to the synthesis of NC HEAs, as shown in Fig. 2. MA is the most popular synthesis method in literature, followed by high-pressure torsion (HPT) and physical vapor deposition (PVD) processes. Through all synthesis routes, most popular HEAs studied to date are from the 3d transition metal category, such as CoCrFeNiMn.
Distribution of synthesis methods and HEA classification (as described by Miracle and Senkov [Reference Miracle and Senkov2]) used in the NC-HEA literature (MA: mechanical alloying, HPT: high-pressure torsion, PVD: physical vapor deposition, ANN: annealed, CM: cryo-milling, ECAP: equal channel angular pressing, and other: sol–gel processing, flame spray pyrolysis, cold rolling, and melt spinning).

The major benefit of MA is its incredible versatility. Any material that can be made in a powder form could be refined using this method [Reference Sathiyamoorthi, Basu, Kashyap, Pradeep and Kottada22, Reference Long, Su, Zhang, Liang, Peng and Li24, Reference Lu, Scudino, Chen, Wang, Li, Mao, Kang, Liu and Fu25, Reference Kumar, Tiwary and Biswas26, Reference Youssef, Zaddach, Niu, Irving and Koch27]. The ease of use of the MA equipment is another advantage compared with more complex systems, such as PVD and electrodeposition. However, the most predominant issue in MA arises from the need to consolidate the refined NC powders into a bulk material, which is usually done through spark plasma sintering (SPS). Although long milling times (∼40 h) for 3d transition metals can yield single-phase materials with grain sizes typically around 20 nm, and as low as 5 nm, the preparation of a bulk specimen from these powders dramatically coarsens the grain structure to beyond 500 nm in some cases [Reference Pohan, Gwalani, Lee, Alam, Hwang, Ryu, Banerjee and Hong28, Reference Wang, Cai and Cheng29, Reference Praveen, Murty and Kottada30]. Another disadvantage of the MA method is the contamination that can occur during the preparation process, in which the cylinder walls can contaminate HEA compositions.
Although grain refinement of 3d transition HEAs through HPT is typically limited to average grain sizes near 50 nm, and as low as 10 nm [Reference Shahmir, He, Lu, Kawasaki and Langdon31, Reference Lee, Choi, Seok, He, Lu, Suh, Kawasaki, Langdon and Jang32], this method is more suitable for producing bulk specimens that do not need further processing, and hence such NC HEAs do not suffer from grain coarsening as those made by MA. Conversely, the major disadvantages of HPT stem from the scalability of the process. When considering the long-term goal of producing large-scale NC HEAs or even simply NC materials, HPT and other SPD methods require extensive process optimization before they can become industrially viable.
Finally, the third most popular synthesis method is DC magnetron sputtering (DCMS). The major advantage of this method is its versatility in being able to produce an alloy from nearly any combination of elements [Reference Feng, Zhang, Wang, Hou, Wu, Liu and Sun33, Reference Nagase, Rack, Noh and Egami34, Reference Chen, Shun, Yeh and Wong35]. For this reason, we see that most of the work done on the refractory and interstitial classes of NC HEAs was accomplished by DC magnetron co-sputtering. Another advantage is the very small and uniform grain size that can be produced by this method, with an average of approximately 10 nm in 3d transition metal HEAs [Reference Liao, Lan, Gao, Zhang, Xu, Song, Wang and Lu36]. The limitation of this method is that only thin films (thickness up to 1–5 µm) can be produced. Thus, it is often difficult to accurately determine the material's mechanical properties through conventional testing methods. This also limits the potential applications of materials made through this route, as the relatively niche market of thin films for mechanical applications suggests PVD is most applicable as a proof-of-concept driven technique rather than an industrially viable one.
Materials for NC HEAs
To date, the 3d transition metal class has been the most popular NC-HEA class. Within the 3d transition metals, we can generally identify two subclasses: Al-containing and non–Al-containing. The most common HEAs in these two classes are AlCoCrFeNi and CoCrFeNiMn alloys, respectively. In many cases, additional non–3d-transition metal elements other than Al have been added, such as Ti, Mg, Mo, and Nb, each with their own unique intent toward affecting the material properties of the HEAs. Figure 3 shows the distribution of crystal structures across publications relating to the synthesis of 3d transition metal NC HEAs.
Phase formation tendencies in 3d transition NC HEAs processed via MA, HPT, and DCMS. Multiphase alloys are made up of a combination of FCC, BCC, and/or HCP phases. Precipitates generally refer to IM compounds. The average grain size achieved by each process for each material class is highlighted above in their respective columns.

There is no considerable preference in phase formation in both MA and DCMS processed NC HEAs, with a nearly even split between single-phase and multiphase materials in both Al- and non–Al-containing 3d transition alloys. By contrast, the HPT process, although it has a smaller sample size than MA, shows a much stronger tendency to form single SS phases, particularly in the CoCrFeNiMn alloys. We also see that the average grain size that can be achieved varies across the three synthesis routes, from 10 nm in DCMS to 18–20 nm in MA, and 33–53 nm in HPT. As deformation-based techniques, MA and HPT require that a significant amount of plastic deformation be applied to the material to achieve nanoscale grain sizes. Specifically, the lowest grain sizes (∼5–10 nm) in ball-milled HEAs have been obtained after milling times exceeding 20 h (using a planetary ball milling machine), which also tends to promote the formation of a single SS phase [Reference Pohan, Gwalani, Lee, Alam, Hwang, Ryu, Banerjee and Hong28, Reference Chen, Hu, Tsai, Hsieh, Kao, Yeh, Chin and Chen37]. For HPT, grain sizes as low as 10 nm have been achieved at shear strains of 420 (equal to 10 revolutions) and pressure of 5 GPa [Reference Lin, An, Liu, Tang, Dai and Liao38]. By contrast, extremely low grain sizes in the order of 10 nm are characteristically acquired through DCMS, providing a much more uniform size distribution than those made by deformation-based methods.
As mentioned in section “Methods to prepare NC HEAs”, NC-refractory HEAs have been much less explored than 3d transition metals, likely because they are generally more expensive and difficult to process. As a result, they are most often fabricated as coatings and thin films via a PVD process (i.e., DCMS or vacuum arc deposition). These coatings will generally exhibit a BCC SS structure when comprised of the core refractory elements (Nb, Mo, Ta, and W) [Reference Zou, Ma and Spolenak19, Reference Feng, Zhang, Wang, Hou, Wu, Liu and Sun33, Reference Kim, Nam, Roh, Son, Ham, Kim and Choi39], and can even form FCC structures in alloys such as TiVZrNbHf [Reference Firstov, Gorban', Danilenko, Karpets, Andreev and Makarenko40, Reference Sobol', Andreev, Gorban', Krapivka, Stolbovoi, Serdyuk and Fil'chikov41]. Compared with 3d transition HEAs, the grain sizes that can be achieved in these alloys are much larger, typically in the range of 40–50 nm. Processing via HPT does not affect this average grain size range and has been used to produce single-phase BCC HEAs by Schuh et al. [Reference Schuh, Völker, Todt, Schell, Perrière, Li, Couzinié and Hohenwarter42, Reference Schuh, Völker, Maier-Kiener, Todt, Li and Hohenwarter43].
The synthesis of NC HEAs from other material classes such as interstitial, light metal, and precious metal alloys have been explored as well. There are no distinct trends in processing routes, phase formation, or grain sizes within these subclasses, but a few interesting features of some of such HEAs have been examined. Interstitial HEAs are of great interest because of the innate SS hardening that can be achieved by very small additions of elements such as nitrogen and carbon to 3d transition metals. The unintended effect that comes up often, in this case, is the formation of precipitate phases, which can also act to strengthen the material, although through the separate mechanism of precipitate-hardening. These NC-interstitial HEAs tend to form either precipitates (which can be nano-sized) [Reference Sathiyamoorthi, Basu, Kashyap, Pradeep and Kottada22, Reference Rogal, Kalita, Tarasek, Bobrowski and Czerwinski44] or dual-phase structures (FCC + BCC) [Reference Chen, Shun, Yeh and Wong35]. There has only been one report of light-metal NC-HEA production, achieved in an AlLiMgScTi alloy produced via ball-milling by Youssef et al. [Reference Youssef, Zaddach, Niu, Irving and Koch27], with an average grain size down to 12 nm and hardness of 5.8 GPa. Similarly, precious metals have rarely been explored, although Kumar et al. [Reference Kumar, Tiwary and Biswas26] have produced a CuAgAuPtPd with a grain size of 9 nm via cryo-milling. However, the exact intended application of this alloy is currently unclear.
Mechanical properties of NC HEAs
The development of 3d transition metal HEAs is driven by the desire to replace conventional stainless steels and Ni-based superalloys. Of primary interest are the mechanical properties of such NC HEAs as a function of grain size and their thermal stability over large temperature and time ranges.
As shown in Fig. 4(a), there is a wide range of hardness values that can be achieved in NC HEAs, with no distinct trends as a function of grain size. Generally, NC-3d transition HEAs fall within hardness ranges of 400–700 HV. In comparison with conventional materials such as 304 stainless steel (660 MPa tensile strength, ∼200 HV [Reference Washko and Aggen66]) and Inconel 600 (660 tensile strength, ∼200 HV [Reference Washko and Aggen66]), the hardness of the 3d transition metal class exceeds ∼400 HV at all grain sizes below 150 nm. However, insight into the toughness, ductility, and work hardening characteristics of these HEAs is currently lacking.
Hardness as a function of grain size for NC-3d transition HEAs: (a) Vicker's micro-hardness (HV) and (b) instrumented indentation hardness. The shaded region in (b) shows the rough bounds which most NC HEAs, including all CoCrFeNiMn, fall within. Data were collected from Refs. Reference Pohan, Gwalani, Lee, Alam, Hwang, Ryu, Banerjee and Hong28, Reference Wang, Cai and Cheng29, Reference Praveen, Murty and Kottada30, Reference Lee, Choi, Seok, He, Lu, Suh, Kawasaki, Langdon and Jang32, Reference Schuh, Völker, Maier-Kiener, Todt, Li and Hohenwarter43, Reference Rogal, Kalita, Tarasek, Bobrowski and Czerwinski44, Reference Shahmir, Tabachnikova, Podolskiy, Tikhonovsky and Langdon45, Reference Shahmir, Nili-Ahmadabadi, Shafiee, Andrzejczuk, Lewandowska and Langdon46, Reference Xie, Cheng, Tang, Chen, Chen and Dai47, Reference Wang, Cheng, Cai, Xue and Zhang48, Reference Rogal, Kalita and Litynska-Dobrzynska49, Reference Shahmir, Nili-Ahmadabadi, Shafie and Langdon50, Reference Shang, Axinte, Sun, Li, Li, Du, Qiao and Wang51, Reference Maulik, Kumar, Kumar, Fabijanic and Kumar52, Reference Gómez-Esparza, Baldenebro-López, González-Rodelas, Baldenebro-López and Martínez-Sánchez53, Reference Fu, Chen, Wen, Zhang, Chen, Zheng, Zhou and Lavernia54, Reference Yu, Zhang, Cheng, Zhang, Ma, Li, Li, Liaw and Liu55, Reference Yu, Cheng, Zhang, Zhang, Jing, Ma, Liaw, Li and Liu56, Reference Khanchandani, Sharma, Kumar, Maulik and Kumar57, Reference Schuh, Mendez-Martin, Völker, George, Clemens, Pippan and Hohenwarter58, Reference Tang, Huang, Huang, Liao, Langdon and Dai59, Reference Ji, Wang, Wang, Zhang, Wang, Zhang and Fu60, Reference Mohanty, Gurao and Biswas61, Reference Wang, Ji and Fu62, Reference Ji, Fu, Wang, Wang, Zhang, Wang and Zhang63, Reference Praveen, Murty and Kottada64, and Reference Pradeep, Wanderka, Choi, Banhart, Murty and Raabe65.

Figure 4(b) presents the hardness measured using instrumented indentation. As this testing technique continuously measures the depth and load throughout indentation, the reported results are more readily comparable to more common testing procedures such as tensile and compression testing. For these HEAs, there is no distinct trend with varying grain size. Most HEAs fall in the range of 5–9 GPa, indicated by the red hatched box.
For refractory HEAs, Firstov et al. [Reference Firstov, Gorban', Danilenko, Karpets, Andreev and Makarenko40] and Sobol' et al. [Reference Sobol', Andreev, Gorban', Krapivka, Stolbovoi, Serdyuk and Fil'chikov41] have synthesized NC-TiVZrNbHf nitride coatings, achieving hardness values of 64 and 70 GPa, respectively. The core group of refractory elements, NbMoTaW, exhibits high hardness with nanoscale structure, falling in the hardness range of 12–16 GPa [Reference Feng, Zhang, Wang, Hou, Wu, Liu and Sun33, Reference Kim, Nam, Roh, Son, Ham, Kim and Choi39]. In comparison to 3d transition HEAs, the refractory class generally exhibits higher hardness. The NbMoTaW alloy has also been shown to have incredible thermal stability by Zou et al. [Reference Zou, Ma and Spolenak19], which will be discussed in section “Microstructure and mechanical stability”.
Hall–Petch effect
Characteristics of the H–P effect can be distinctly different between different alloy compositions. Figure 5(a) shows that although many different materials may have similar friction stresses (σo), there are large differences in their k y constants (a constant related to the relative hardening contribution of grain boundaries). We observe a trend that, in general, as the number of elements is increased in an alloy, there is an increase in the slope of the H–P relation (k y). This value is related to the grain-boundary surface energy of the material, which we have already established is inherently low in HEAs [Reference Luo and Wang15]. Stacking fault energy (SFE) also affects the H–P constant [Fig. 5(b)], as a lower SFE promotes the formation of subboundaries which are more resistant to dislocation motion [Reference Porter, Easterling and Sherif18]. Zaddach et al. [Reference Zaddach, Niu, Koch and Irving68] have demonstrated using a combined experimental and DFT-based computational approach that the SFE can be significantly decreased with the addition of principal elements into the matrix, decreasing from ∼125 mJ/m2 in pure Ni to ∼20 mJ/m2 in equiatomic CoCrFeNiMn. Furthermore, the slightest variance from an equiatomic composition can drastically alter the SFE, with values ranging from 57.7 mJ/m2 in Co20Cr14Fe20Ni26Mn20 down to 3.5 mJ/m2 in Co20Cr26Fe20Ni14Mn20.
(a) Hall–Petch relationship for several low-, medium-, and high-entropy 3d transition metal alloys and (b) slope of Hall–Petch relationship versus SFE, adapted from Okamoto et al. [Reference Okamoto, Fujimoto, Kambara, Kawamura, Chen, Matsunoshita, Tanaka, Inui and George69]. Data from (a) were obtained from Refs. Reference Okamoto, Fujimoto, Kambara, Kawamura, Chen, Matsunoshita, Tanaka, Inui and George69, Reference Yoshida, Ikeuchi, Bhattacharjee, Bai, Shibata and Tsuji70, Reference Keller and Hug71, Reference Yoshida, Bhattacharjee, Bai and Tsuji72, Reference Otto, Dlouhý, Somsen, Bei, Eggeler and George73, and Reference Hansen and Ralph74.

Although none of the HEAs presented in Fig. 5 are NC, it gives insight into a supposed improved hardenability that can be achieved in decreasing grain sizes of HEAs to the nanoscale compared with more dilute alloys.
Wear resistance
The wear resistance of all materials is closely related to their hardness, represented by the following steady-state wear equation [Reference Yang75]:
 $$V = K{{PL} \over {3H}}\quad ,$$
where V and L are the volumetric loss and sliding distance, respectively. K is a dimensionless net steady-state wear coefficient and H the Brinell hardness. In general, materials with high hardness typically exhibit high wear resistance. For materials of similar hardness, the wear coefficient K is also a good comparative standard for wear resistance.
As a major component in many high-performance industrially used alloys, the CoCrFeNi system is an ideal base for HEAs. However, its intrinsic hardness is relatively low (∼106 HV) because of its FCC structure [Reference Yeh, Chen, Lin, Gan, Chin, Shun, Tsau and Chang1, Reference Kao, Chen, Chen and Yeh76, Reference Wang, Wang and Yeh77, Reference Wu, Lin, Yeh, Chen, Huang and Chen78, Reference Chen, Lin, Yeh, Chen, Huang and Tu79]. As previously established, a reduction in the grain size is an effective method of improving the mechanical performance of a material. The production of a NC-CoCrFeNi alloy through MA and vacuum hot-pressing sintering (VHPS) has been used to achieve 30-nm grain sizes, resulting in higher hardness values (450 HV) and a low friction coefficient (0.38) [Reference Shang, Axinte, Ge, Zhang and Wang80]. Another method frequently used to strengthen materials is precipitation hardening, in which small-scale hard phases can help to impede dislocation motion throughout the lattice through a mechanism known as Zener pinning. Following this Zener pinning mechanism, the addition of hard metallic elements from the refractory group such as Mo and W to 3d transition metal HEA matrices have been shown to significantly improve the hardness and wear resistance [Reference Shang, Axinte, Sun, Li, Li, Du, Qiao and Wang51]. However, contrary to this theory, Cu-rich FCC nanoprecipitates in the CoCrFeNiCu system yield lower hardness (∼400 HV) and a large friction coefficient (0.6). This suggests that Cu-comprising precipitates are generally soft and do not promote the Zener pinning mechanism. Therefore, such NC HEAs are not very useful for wear resistance [Reference Shang, Axinte, Ge, Zhang and Wang80].
Although Al in its pure form is a relatively soft material with low hardness (∼107 HV), its addition to the CoCrFeNi system has resulted in remarkable hardening effects. This is caused by the formation of an Al–Ni rich BCC phase, which can form into wall-shaped ordered precipitates in alloys such as Al2CoCrFeNi, producing a hardness of 500 HV [Reference Kao, Chen, Chen and Yeh76], which can be retained even at high temperatures (200 HV at 1273 K; <50 HV for CoCrFeNi) [Reference Wang, Wang and Yeh77]. Furthermore, it is interesting to note that the hardening effect caused by Al addition is more significant in the CoCrFeNiCu system than that in the CoCrFeNi system, which sees a broadened dual-phase (FCC + BCC) regime with a maximum hardness of 655 HV [Reference Yeh, Chen, Lin, Gan, Chin, Shun, Tsau and Chang1]. As the Al content is increased, the AlxCoCrCuFeNi system shows a lower wear coefficient and higher resistance to anneal softening [Reference Yeh, Chen, Lin, Gan, Chin, Shun, Tsau and Chang1, Reference Wu, Lin, Yeh, Chen, Huang and Chen78]. The excellent wear performance in this alloy is believed to be caused by a combined effect from SS hardening within the Al-rich BCC phase, precipitate hardening through the formation of nano-precipitates 3–50 nm in size, and nanocomposite strengthening resulting from nanoscale spinodal structures (100-nm wide dendrites with interspinodal plates 70 nm in width) [Reference Yeh, Chen, Lin, Gan, Chin, Shun, Tsau and Chang1].
The materials summarized thus far have all followed the expected inverse relation between hardness and wear coefficient, for example, the lowest observed wear coefficient of 1 × 10⁻⁴ mm3/Nm is obtained at the composition in AlxCoCrCuFeNi which exhibits the highest hardness [Reference Wu, Lin, Yeh, Chen, Huang and Chen78]. By contrast, in a system such as Al0.5CoCrCuFeNiTix, the highest wear resistance of 1.3 m/mm3 (with x = 1) is not achieved at the highest hardness level (with x = 2) [Reference Chen, Lin, Yeh, Chen, Huang and Tu79]. This is a result of a loss of precipitate hardening because of the instability of the hard CoCr-like phase with higher Ti content. Regardless, harder and finer microstructures, controlled by both synthesis routes and alloy composition, typically improve the wear resistance of HEAs.
Thermal stability of NC HEAs
Microstructure and mechanical stability
The thermal stability of mechanical properties is one of the most popular topics in the field of NC HEAs, particularly for high-temperature applications. Figure 6 shows a few examples of the thermal stability of hardness and grain size of NC HEAs that have been mentioned in this article.
(a) Vicker's HV and (b) grain size of coarse-grain (CG) and NC HEAs as a function of annealing temperature. Annealing for all alloys was performed over one hour, except in the CG-CoCrFeNiCu and CoCrFeNi–C composites, which were annealed for five and 600 h, respectively. The hatched region in (b) shows the refractory element–containing HEAs. Data were redrawn from Refs. Reference Sathiyamoorthi, Basu, Kashyap, Pradeep and Kottada22, Reference Pohan, Gwalani, Lee, Alam, Hwang, Ryu, Banerjee and Hong28, Reference Shahmir, He, Lu, Kawasaki and Langdon31, Reference Shahmir, Nili-Ahmadabadi, Shafiee, Andrzejczuk, Lewandowska and Langdon46, Reference Schuh, Mendez-Martin, Völker, George, Clemens, Pippan and Hohenwarter58, Reference Tang, Huang, Huang, Liao, Langdon and Dai59, Reference Zhou, Hu, Huang and Luo81, and Reference Zhang, He, Pan and Guo82.

In reviewing Fig. 6, we can make direct comparisons of the stability of hardness between coarse- and nano-grained HEAs. Shahmir et al. [Reference Shahmir, He, Lu, Kawasaki and Langdon31, Reference Shahmir, Nili-Ahmadabadi, Shafiee, Andrzejczuk, Lewandowska and Langdon46] have shown that in both CoCrFeNiMnTi2 and CoCrFeNiMn, there is a considerable rise in the room temperature hardness (from ∼125 HV to ∼450 HV) when the grain size is reduced from a few tens of micrometers down to sub-50 nm size. As temperature increases, we observe very good stability of these hardness values over an annealing time of one hour, up to a temperature of about 600 °C. Likewise, with grain-size stability, we see that significant grain growth only begins at about 600 °C. In general, most other alloys follow the same trend, although some HEAs exhibit pronouncedly more significant thermal stability, such as the CoCrFeNi–C composite, exceeding temperatures of 800 °C while maintaining 85% of its original strength after 600 h of annealing.
As shown in Fig. 6(b), we also observe that refractory-like HEAs, such as NbMoTaW, can operate and maintain smaller grain sizes at higher temperatures than purely 3d transition metal HEAs. This is likely because those refractory elements, such as Nb, Mo, and Ta, have higher melting points than the 3d transition metal constituents, and as such may slow down the diffusion kinetics within the material. Zou et al. [Reference Zou, Ma and Spolenak19] demonstrated that the NbMoTaW system exhibits immense thermal stability as one of the refractory HEAs. Their work has shown that NC-NbMoTaW micropillars annealed at 1100 °C for 72 h experience no noticeable change in their initial grain size of 70–100 nm and yield strength of ∼5 GPa. These results are shown in Fig. 7.
Pre- and postannealing structures of W and NbMoTaW HEA films after three days at 1100 °C. Scale bars, 200 nm (the first column, large magnification of top surfaces); 300 nm (the last column, EBSD maps); 1 µm (other images). Reprinted from Ref. Reference Zou, Ma and Spolenak19.

In contrast to pure W, which experiences a more than 10-fold increase in grain size and a decrease in yield strength from ∼5 GPa to less than 1 GPa, the performance of this HEA is staggeringly superior, suggesting that the theory behind thermal stabilization in HEAs does indeed have merit.
Phase stability
Another area of interest is the phase stability of these NC HEAs. A primary concern typically stems from the MA-processed alloys, which require a combination of pressing and sintering after being refined to nanoscale grain sizes. Although long milling times have been shown to produce single-phase FCC and BCC structures, the consolidation process can have a negative impact of promoting phase decomposition.
In Fig. 8(a), Mohanty et al. [Reference Mohanty, Maity, Mukhopadhyay, Sarkar, Gurao, Bhowmick and Biswas83] showed that the primary FCC phase in an AlCoCrFeNi alloy remains relatively stable up to SPS processing temperatures of 1173 K (900 °C). Kumar et al. [Reference Kumar, Maulik, Kumar, Prasad and Kumar84] [Fig. 8(b)] showed the precipitation of a number of IM phases from an initial mixed FCC + BCC AlCuCrFeMnW powder after SPS at 900 °C. Transitioning to refractory-based HEAs [Figs. 8(c) and 8(d)], we see that in Zr70Cu24Al4Nb2 phase decomposition occurs at quite a low temperature [Reference Sharma, Yadav, Biswas and Basu85], whereas in TiZrNbHfTa [Reference Schuh, Völker, Todt, Schell, Perrière, Li, Couzinié and Hohenwarter42], there is a transition from single-phase to multiphase and back to single-phase through an annealing temperature range of 300–1100 °C. From these results, it is clear that the phase decomposition behavior of HEAs is a process unique to each specific alloy composition, which is nearly impossible to accurately predict with the current state of modeling methods.
Thermal stability of the structure of NC HEAs processed via mechanical alloying and subsequent sintering: (a) AlCoCrFeNi (reprinted with permission from Ref. Reference Mohanty, Maity, Mukhopadhyay, Sarkar, Gurao, Bhowmick and Biswas83, Copyright 2017 from Elsevier), (b) AlCuCrFeMnW (reprinted with permission from Ref. Reference Kumar, Maulik, Kumar, Prasad and Kumar84, Copyright 2018 from Elsevier), (c) Zr70Cu24Al4Nb2 (reprinted with permission from Ref. Reference Sharma, Yadav, Biswas and Basu85, Copyright 2018 from Elsevier), and (d) TiZrNbHfTa (reprinted with permission from Ref. Reference Schuh, Völker, Todt, Schell, Perrière, Li, Couzinié and Hohenwarter42, Copyright 2018 from Elsevier).

Although we typically want to take advantage of the SS hardening mechanisms in HEAs by promoting single-phase formation, decomposition of these alloys in multiple phases and/or precipitates can also have its advantages. A transition of the strengthening mechanisms can drastically alter an alloy's mechanical and functional properties, to the point where HEA design is a multivariable optimization problem.
Functional properties of HEAs
Compared with the vast number of studies on mechanical properties of NC HEAs, their functional properties, such as electrical, electrochemical, thermal, and magnetic properties, have been much less explored. This is due not only to an apparent negative trade-off between small grain sizes and many functional properties (e.g., corrosion resistance and electrical conductivity) but also to the extremely wide range in performances of many specific types of nanostructures. However, nanoscale structures in an HEA matrix, such as precipitates and secondary phases, indeed affect the functional performance significantly. Among all HEAs, most studies have focused on AlxCoCrFeNi [Reference Kao, Chen, Chen and Yeh76, Reference Chou, Chang, Chen and Yeh86, Reference Shafeie, Guo, Hu, Fahlquist, Erhart and Palmqvist87, Reference Wang, Zhang, Davies and Wu88, Reference Dong, Zhou, Zhang, Zhang, Liaw, Li and Liu89, Reference Shi, Collins, Feng, Zhang, Balke, Liaw and Yang90, Reference Kao, Chen, Chen, Chu, Yeh and Lin91]. Such HEAs show considerable property variations that can be obtained through both a drive for phase transformation (from FCC to BCC) caused by different Al compositional ratios and nanostructure evolution resulting from its synthesis route. A summary of the functional properties of AlxCoCrFeNi HEAs is shown in Fig. 9. The effects on specific properties as they relate to different structures will be discussed in the following text.
Functional properties of the AlxCoCrFeNi system as a function of Al-content (x): (a) Seebeck coefficient (S), calculated power factors (σS 2), and figure-of-merit (ZT); (b) thermal conductivity (κ) and coefficient of thermal expansion (CTE); (c) electrical conductivity (σ); (d) Vicker's hardness (HV); (e) phase boundary for as-cast, homogenized (24 h at 1100 °C) and deformed (rolling to 50% reduction in thickness) alloys. Data were collected from Refs. Reference Koch5, Reference Chou, Chang, Chen and Yeh86, Reference Shafeie, Guo, Hu, Fahlquist, Erhart and Palmqvist87, Reference Wang, Zhang, Davies and Wu88, Reference Dong, Zhou, Zhang, Zhang, Liaw, Li and Liu89, Reference Shi, Collins, Feng, Zhang, Balke, Liaw and Yang90, and Reference Kao, Chen, Chen, Chu, Yeh and Lin91.

Corrosion resistance
There is currently no unified theory for the effect of grain size on the corrosion behavior of HEAs, with opposing phenomena being observed for various material systems, grain-size ranges, and processing routes [Reference Ralston and Birbilis92]. The formation of passive films is one of the key controlling factors of the corrosion resistance in materials. For example, corrosion resistance can be compromised because of unstable passive films in NC Ni [Reference Rofagha, Langer, El-Sherik, Erb, Palumbo and Aust93], whereas Ni–Fe alloys show similar corrosion resistance in both nanoscale and coarse-grained microstructures because of the formation of stable homogenous passive films [Reference Monaco, Avramovic-Cingara, Palumbo and Erb94]. There have been few studies on the comparison of corrosion performance between bulk and NC HEAs, but the investigation of specific nanostructures and their effect on corrosion are much more common.
In general, corrosion reactions will be significantly facilitated by a higher density of interfaces or grain boundaries where the activation energy of corrosion is lower. Thus, CoCrFeNi HEAs exhibit a lower corrosion resistance in its NC form (grain size ∼28 nm) than its coarse-grained counterpart [Reference Kao, Chen, Chen and Yeh76, Reference Shang, Axinte, Ge, Zhang and Wang80]. In addition, galvanic corrosion resulting from phase segregation is a major concern in HEAs due to the enhanced propensity of elements to segregate in these configurationally complex alloys. It has been demonstrated that CoCrFeNiCu with a grain size of 29 nm exhibits poorer corrosion resistance than CoCrFeNi with similar grain size, suggesting Cu is not an ideal candidate elemental addition in HEA systems for corrosion resistance [Reference Shang, Axinte, Ge, Zhang and Wang80, Reference Qiu, Thomas, Gibson, Fraser and Birbilis95, Reference Shi, Yang and Liaw96]. Such an effect is also prevalent in Al-containing alloys, where significant segregation in AlxCoCrFeNi promotes the formation of BCC precipitates 50–100 nm in size within a uniform FCC matrix with increasing Al content, which in turn act as localized galvanic cells [Reference Shi, Collins, Feng, Zhang, Balke, Liaw and Yang90]. Compounding the effects of Al and Cu segregation, an increase in Al content in the AlxCoCrCuFeNi system has expectedly been shown to decrease its corrosion resistance [Reference Qiu, Thomas, Gibson, Fraser and Birbilis95].
Pit formation readily occurs in single-phase (FCC and BCC) HEAs, in which the BCC phase shows poorer corrosion resistance than the FCC phase; in dual-phase (FCC + BCC) systems, the interface structures are much more complex than systems with a single phase, and those complex phase boundaries with higher surface energy act as corrosion nucleation sites, therefore leading to localized corrosion [Reference Shi, Collins, Feng, Zhang, Balke, Liaw and Yang90]. Heat treatment is an effective approach to improve the corrosion resistance in these dual-phase HEAs, due to the homogenization effect in simplifying microstructures and compositions as well as reducing elemental segregations [Reference Wang, Zhang, Davies and Wu88, Reference Shi, Collins, Feng, Zhang, Balke, Liaw and Yang90, Reference Shi, Yang and Liaw96]. For example, BCC nanoparticles with 5- to 50-nm diameter transform to homogeneous FCC matrix in Al0.5CoCrFeNi after annealing, showing better corrosion resistance [Reference Shi, Collins, Feng, Zhang, Balke, Liaw and Yang90]. Meanwhile, samples with nanoscale dendrites (∼50 nm) prepared by direct laser fabrication exhibit a much poorer corrosion resistance than samples aged at 1200 °C, which have a uniform FCC matrix [Reference Wang, Zhang, Davies and Wu88]. Heat treatment could reduce the complexity of interfaces and boundaries and improve the homogeneity of elemental distribution in HEAs, resulting in low passivation/corrosion current and high corrosion/pitting potential, therefore enhancing corrosion resistance. The influence of Al content and processing methods on morphology and nanostructures of AlxCoCrCuFeNi is shown in Fig. 10, along with corresponding corrosion performances.
Characterization of nanostructures in HEAs by transmission electron microscopy (TEM) (a, c, e, g) and respective morphology of corrosion area after polarization by scanning electron microscopy (SEM) (b, d, f, h) in as-forged and as-equilibrated AlxCoCrCuFeNi samples with different Al content (x = 0.5 and 0.7). Reprinted with permission from Ref. Reference Shi, Collins, Feng, Zhang, Balke, Liaw and Yang90. Copyright 2018 from Elsevier.

As a common configurational element, Cr is a promising stable metallic addition for higher corrosion resistance in HEAs, especially for AlCuFeNi, in which the grains of the dual-phase (FCC + BCC) alloy can be refined, resulting in a reduced corrosion rate [Reference Shi, Yang and Liaw96]. The effect of Ti, however, is much more controversial in different systems [Reference Shi, Yang and Liaw96]. Noble elements dispersing into passive films can limit oxidation, and therefore improve corrosion resistance [Reference Qiu, Thomas, Gibson, Fraser and Birbilis95]. The effect of Mo on corrosion behavior is still under debate. Some studies have reported that Mo will facilitate elemental segregation [Reference Shang, Axinte, Sun, Li, Li, Du, Qiao and Wang51], leading to more boundaries where severe localized corrosion will initiate. Others have shown Mo possesses the potential to protect the passive films and resist the penetration of Cl− anions [Reference Qiu, Thomas, Gibson, Fraser and Birbilis95]. In contrast to the latter of these views, research on TiZr0.5NbCr0.5VxMoy [Reference Li, Yang, Zhu and Zhang97] has found a completely opposite result, in which general corrosion resistance in NaCl will deteriorate, whereas resistance in H2SO4 will be strengthened. Compared with Mo, V has been regarded as a better corrosion-resistant additive element, showing enhanced corrosion resistance in both acid and chloride environments, with a low temperature sensitivity [Reference Li, Yang, Zhu and Zhang97]. However, their nanoscale features have yet to be explored.
As far as current research is concerned, small grain sizes show a negative effect on corrosion resistance for HEAs. There is no clear relationship between configurational entropy and corrosion resistance, although intrinsic properties of elements and nanostructures such as phase segregation have a major influence on corrosion performance of HEAs. Regarding high-entropy ceramics, such as Al0.5CoCrCuFeNiBx [Reference Hsu, Yeh, Chen and Shun98] and Cu0.5NiAlCoCrFeSi [Reference Chen, Duval, Hung, Yeh and Shih99], these examples exhibit either poor (B-containing) or excellent (Si-containing) corrosion resistance. This new class of HEMs will be discussed in section “High-entropy ceramics and oxides/nitrides”.
Electrical conductivity
As a result of enhanced scattering of electrons due to grain refinement, the electrical conductivity is expected to be inherently low in NC materials. Electrons scattering in high-entropy systems can be exacerbated because of high lattice distortion, which has been used to reduce electronic thermal conductivity in thermoelectric materials. As specific tests on electrical properties of HEAs are seldom conducted [Reference Kao, Chen, Chen, Chu, Yeh and Lin91, Reference Nong, Zhu, Yang, Yu and Lai100, Reference von Rohr, Winiarski, Tao, Klimczuk and Cava101, Reference von Rohr and Cava102], electrical conductivity is often a property measured to characterize the thermoelectrical performance of materials [Reference Chou, Chang, Chen and Yeh86, Reference Shafeie, Guo, Hu, Fahlquist, Erhart and Palmqvist87, Reference Dong, Zhou, Zhang, Zhang, Liaw, Li and Liu89, Reference Karati, Nagini, Ghosh, Shabadi, Pradeep, Mallik, Murty and Varadaraju103]. The synthesis routes and compositions of NC HEAs can significantly affect their electrical properties. For example, in the AlxCoCrFeNi system [Reference Kao, Chen, Chen, Chu, Yeh and Lin91], variations in electrical conductivity are observed in samples made by different fabrication methods (rather than the Al-content): homogenized samples with uniform nanostructure exhibit the lowest electrical resistivity, whereas high electrical resistivity can be obtained in plastically deformed samples because of the formation of a considerable density of defects. In the dual-phase (FCC + BCC) AlCrCuFeMnTi system [Reference Nong, Zhu, Yang, Yu and Lai100], despite significant differences in hardness, the electrical conductivity varies only slightly after relatively low-temperature annealing (<995 °C). With increasing annealing temperature to 1100 °C, such HEAs show more distinct conductivity differences, which is attributed to the formation of a C14 phase (MgZn2 hexagonal Laves structure) with subgrains about 500 nm in size, which impedes the movement of free electrons. Moreover, despite having the same carrier density, HEAs generally have lower carrier mobility than conventional alloys because of high lattice distortion.
It is interesting to find that a TaNbHfZrTi HEA system with a homogeneous BCC (TaNb)1−x(ZrHfTi)x nanostructure exhibits a combination of both crystalline- and amorphous-like features of transition metal superconductors. Such a phenomenon is mainly influenced by the mixing entropy of the system [Reference von Rohr, Winiarski, Tao, Klimczuk and Cava101]. However, further exploration of the optimal composition of (TaNb)0.67(ZrHfTi)0.33 with Al additions has determined that Al is not an appropriate alloying element for developing superconductive HEAs [Reference von Rohr and Cava102].
Thermal conductivity and thermoelectric properties
As one of the proposed “core” effects in HEAs, severe lattice distortion can affect not only electron movement but can also drive phonon scattering and, therefore, reduce thermal conductivity [Reference Liu, Chen, Zhao, Qin, Jiang, Zhang, Sha, Shi, Uher, Zhang and Chen104]. Such an effect makes HEAs a promising class of potential high-performance thermoelectric materials, attracting significant research interest recently [Reference Karati, Nagini, Ghosh, Shabadi, Pradeep, Mallik, Murty and Varadaraju103, Reference Yan, Liu, Ma, Gong, Zhu, Wang, Ao, Zhang, Li and Li105]. In general, it has been recognized that the two most efficient ways of improving thermoelectric performance are (i) modifying a material's electronic/thermal transport properties and (ii) maintaining crystal symmetry for higher Seebeck coefficients. Both approaches can be applied by optimizing the entropy of the HEA systems [Reference Liu, Chen, Zhao, Qin, Jiang, Zhang, Sha, Shi, Uher, Zhang and Chen104].
In AlxCoCrCuFeNi, both electrical conductivity and electronic thermal conductivity change slightly with increasing Al content. However, phono thermal conductivity is more sensitive to structure variation and shares much more influence on total thermal conductivity κ. Dual-phase samples possess the lowest value of κ because of their complex nanostructures, such as nonuniformity of compositional elements and spinodal decompositions [Reference Chou, Chang, Chen and Yeh86]. By increasing the symmetry and homogeneity of elemental distribution, an optimized combination of thermal conductivity and Seebeck coefficient can be obtained in this material made up of a single BCC phase (x = 2.0, ZT = 0.012) [Reference Chou, Chang, Chen and Yeh86, Reference Shafeie, Guo, Hu, Fahlquist, Erhart and Palmqvist87]. Furthermore, a suitable annealing temperature can further improve the thermoelectric performance [Reference Shi, Collins, Feng, Zhang, Balke, Liaw and Yang90].
As the optimization of thermoelectric performance of HEAs requires a systematic approach rather than programmable high-throughput evaluation, similar nanostructures have been shown to exhibit completely opposing phenomena. For example, adding Gd to the CoCrFeNi system facilitates the formation of nanoscale Laves phases, leading to a decrease in all of its thermoelectric parameters (electrical conductivity, thermal conductivity, and Seebeck coefficient) and having a reduced figure of merit, ZT [Reference Dong, Zhou, Zhang, Zhang, Liaw, Li and Liu89]. In the NC-Ti2NiCoSnSb system (grain size ∼12 nm), a secondary phase of TiC is obtained after long ball-milling times, facilitating more Ni3Sn4 formation and leading to higher electrical and thermal conductivities, but undermining the thermoelectric performance [Reference Karati, Nagini, Ghosh, Shabadi, Pradeep, Mallik, Murty and Varadaraju103]. By contrast, Mn-rich nanoscale precipitates (20–30 nm in size) in SnTe–MnTe (medium-entropy) and Sn0.555Ge0.15Pb0.075Mn0.275Te (high-entropy) systems promote the formation of nano line-defects, nanoscale strain clusters, and microscale interfaces, which scatter phonons and, therefore, reduce thermal conductivity, leading to excellent thermoelectric properties [Reference Tan, Shi, Hao, Chi, Bailey, Zhao, Uher, Wolverton, Dravid and Kanatzidis106, Reference Hu, Zhang, Wu, Li, Li, McKenna, He, Liu, Pennycook and Zeng107]. The results from these studies showing the synergetic effect between nanostructure and lattice distortion are shown in Fig. 11. Moreover, many other additive elements such as Zr, Ti, V, Mo, and Hf in NbFeSb [Reference Yan, Liu, Ma, Gong, Zhu, Wang, Ao, Zhang, Li and Li105] reinforce the severe lattice-distortion effect. This serves to strongly scatter phonons, resulting in low lattice thermal conductivity and enhanced Seebeck coefficient, leading to excellent thermoelectric properties. Hence, despite that high lattice distortion shows a positive effect on thermoelectrical properties in high-entropy systems, there seems to be no obvious relation toward the influence of nanostructures.
(a) TEM image of Sn0.93Mn0.07Te without precipitates; (b) TEM image of Sn0.88Mn0.12Te, showing orthogonal nanoprecipitates; (c) thermoelectrical properties of Sn1−xMnxTe samples, in which Sn0.88Mn0.12Te presents the highest temperature-dependent ZT values; (d) high density of line defects in (Sn0.7Ge0.2Pb0.1)0.9Mn1.1Te viewed by STEM; (e) corresponding ZT values in comparison with other lower order systems; (f) and (g) schemes of the lattice structures of pure SnTe and (Sn0.7Ge0.2Pb0.1)0.9Mn1.1Te system, respectively. (a)–(c) reprinted (adapted) with permission from Ref. Reference Tan, Shi, Hao, Chi, Bailey, Zhao, Uher, Wolverton, Dravid and Kanatzidis106. Copyright 2015 from American Chemical Society. (d)–(g) reprinted with permission from Ref. Reference Hu, Zhang, Wu, Li, Li, McKenna, He, Liu, Pennycook and Zeng107. Copyright 2018 from John Wiley and Sons.

Magnetic properties
Elemental composition is the major controlling factor of the magnetic properties of HEAs. Fe, Co, and Ni are identified as ferromagnetic elements, and Cr is recognized as an antiferromagnetic element, resulting in a reduced ferromagnetic property for the CoCrFeNi system [Reference Shang, Axinte, Ge, Zhang and Wang80]. As a diamagnetic material, Cu significantly reduces the magnetization of a system and causes soft magnetic properties [Reference Shang, Axinte, Ge, Zhang and Wang80]. The FCC and BCC phases in AlxCoCrFeNi alloys show opposing magnetism characteristics, and as such a decrease in magnetization and magnetism transition (from ferromagnetic to paramagnetic) is observed with increasing temperature [Reference Kao, Chen, Chen, Chu, Yeh and Lin91]. Interestingly, the magnetic properties in this alloy appear to be unaffected by increasing Al-content [Reference Kao, Chen, Chen, Chu, Yeh and Lin91].
So far, there have been few relevant studies on the magnetic properties of NC HEAs. For example, magnetic properties of a BiFeCoNiMn HEA system [Reference Yao, Zhang, Liu, Li, Ye, Liu and Tong108] depend on their nanostructures: with decreasing molar ratio of Bi(III) to divalent transition metal ions (Fe, Co, Ni, and Mn) their amorphous structure transitions into nanorods (50–70 nm in length and 10 nm in diameter) through a “grain-to-rod” transformation. Such transformation leads to a decrease in exchange coupling that results from a larger distance than the exchange-correlation length, along with which the soft magnetic and paramagnetic materials change into one with hard magnetic anisotropy, that is, magnetic hardening. One must also consider that nearly all magnetocaloric alloys with magnetocaloric effect are metallic glasses, showing amorphous rather than NC structures [Reference Luo, Zhao, Pan and Wang109]. Despite the concept of “high-entropy bulk metallic glasses” proposed recently [Reference Yuan, Wu, Tong, Zhang, Wang, Liu, Ma, Suo and Lu110], these noncrystalline structures are not classified within the conventional definition of HEAs.
Hydrogen storage
The hydrogen storage properties of HEAs have attracted significant research interests recently [Reference Sahlberg, Karlsson, Zlotea and Jansson111, Reference Hu, Shen, Jiang, Gong, Xiao, Liu, Sun and Zu112]. In conventional research on hydrogen storage material, compositional selection is usually focused on transition metals such as Ti, V, Ni, and Zr, which are similar to compositions of HEMs [Reference Gesari, Pronsato, Visintin and Juan113]. Many HEA systems possess the potential for hydrogen absorption. However, elements with high atomic weight (high Z-number) in certain high-entropy systems reduce the hydrogen capacity below the requirement for practical applications of hydrogen storage. For example, the mass capacity of TiZrNbMoV is in the range of 2.3–2.5 wt% [Reference Sahlberg, Karlsson, Zlotea and Jansson111]. Hence, most HEAs are not seen as promising hydrogen storage candidates. Another use of hydrogen atoms within metal lattices is for use as an indicator to present the difference of structure between HEAs and traditional alloys [Reference Hu, Shen, Jiang, Gong, Xiao, Liu, Sun and Zu112]. The presence of hydrogen in metallic systems also has an effect on mechanical properties, which is another important research direction to be conducted in the field of HEAs [Reference Luo, Li and Raabe114, Reference Zhao, Lee, Seok, Lee, Phaniraj, Suh, Ha, Kim, Ramamurty and Jang115].
Nanostructured high-entropy materials
Beyond NC HEAs, studies on nanotwins, nanoprecipitates, and nanoscale segregation in HEAs have also been conducted. Such structures can have considerable effects on strength, corrosion initiation, and other functional properties. As discussed in section “Materials for NC HEAs”, several different processing routes, ranging from cryogenic to high-temperature scales, can be used to obtain these structures. For example, deformation-induced nanotwinning is the principal mechanism for cryogenic fracture resistance. The addition of nonmetallic elements into multielement systems can also provide unique properties in mechanical and functional applications, especially in reversible energy storage, broadening the research class of HEMs. Thus, this section is mainly focused on specific nanostructures of HEAs as well as high-entropy ceramics/oxides. The phases, structure characteristics, and properties of these HEMs are summarized in Table II.
Phases, nanostructures, properties and synthesis methods of HEMs.

Nanotwinning and phase transformations
Conventionally, metallic materials at low temperatures tend to exhibit increased strength and decreased fracture resistance. The CrMnFeCoNi alloy breaks such trade-off by introducing nanoscale twinning during plastic deformation [Reference Gludovatz, Hohenwarter, Catoor, Chang, George and Ritchie116, Reference Wu, Parish and Bei117]. Deformation-induced nanotwinned structures and planar slip are discerned as the mechanisms for their excellent cryogenic behavior (1280 MPa strength with >0.7 ductility) during steady-strain hardening rather than necking from plastic instability, in contrast to grain disorientation due to dislocation activity being the reason for ambient temperature deformation (759 MPa with ∼0.5 ductility) [Reference Gludovatz, Hohenwarter, Catoor, Chang, George and Ritchie116]. This nanotwin-mediated plasticity has been further improved with the addition of 0.5 at.% C [Reference Wu, Parish and Bei117], showing a higher strength with good ductility at low temperature, however, compromising the performance at ambient temperature. It is recognized that the formation of deformation-induced nanoscale twinning is attributed to dissociation within the glide of dislocations, driven from their precursors as stacking faults [Reference Idrissi, Ryelandt, Veron, Schryvers and Jacques118]. Local atomic environments and thermodynamic stabilities of stacking sequences influence the SFE of materials [Reference Zhang, Zhuang, Hu, Kai and Liu119], and a lower SFE caused by elemental addition will, in turn, facilitate the formation of stacking faults and hence nanotwinning [Reference Wu, Parish and Bei117]. Of practical interest is the amount and type of elemental additions to be implemented into an alloy, since an imbalance of certain elements might compromise the ductility despite the formation of nanoscale twinning (e.g., SiC nanoparticles in the CoCrFeMnNi system [Reference Rogal, Kalita, Tarasek, Bobrowski and Czerwinski44]). Moreover, a similar result has also been found in the Fe80−xMnxCo10Cr10 system [Reference Li, Pradeep, Deng, Raabe and Tasan120], in which the strength-ductility trade-off could be overcome by a dynamic strain–stress partitioning effect [Reference Wang, Tasan, Ponge, Dippel and Raabe121] because of good plasticity caused by phase transformation and twinning formation. However, although nanotwinned structures could significantly improve the mechanical properties of HEAs, they are deformation-induced structures rather than intrinsic ones. Thus, future studies focusing on the fabrication of HEAs with intrinsic nanoscale twinning could be a promising research direction.
Phase transformations in HEAs can result from the addition of various elements such as Al [Reference Wang, Wang and Yeh77, Reference Chou, Chang, Chen and Yeh86] and Ti [Reference Chen, Lin, Yeh, Chen, Huang and Tu79] or can be affected by synthesis routes [Reference Kao, Chen, Chen and Yeh76, Reference Wang, Wang and Yeh77, Reference Wang, Zhang, Davies and Wu88]. For example, with increased Al content, the FCC phase of CoCrFeNi transitions into a BCC phase, and the dual-phase region is broadened after homogenization in which dendrite and interdendritic segregation with spinodal structure could be obtained [Reference Kao, Chen, Chen and Yeh76, Reference Chou, Chang, Chen and Yeh86, Reference Shi, Collins, Feng, Zhang, Balke, Liaw and Yang90]. During use, the occurrence of phase transformations depends on the stability of each phase under particular operating conditions. Contrary to conventional belief, the CoCrFeNi system exhibits metastability in the dominant phase at intermediate temperatures, showing obvious elemental decomposition [Reference He, Wang, Wu, Li, Wang and Liu122]. The rate of phase segregation could be accelerated by adding specific segregation-inducing elements such as Al, Cu, and B [Reference Shi, Yang and Liaw96, Reference He, Wang, Wu, Li, Wang and Liu122].
Regarding irradiation damage, high stability can be obtained in HEAs as a result of the high atomic-level stresses in multicomponent alloys, providing a damage healing mechanism [Reference Egami, Guo, Rack and Nagase123]. Zr–Hf–Nb alloys possess excellent irradiation resistance and show no electron irradiation–induced structural changes [Reference Nagase, Anada, Rack, Noh, Yasuda, Mori and Egami124]. In CoCuCrFeNi, although phase segregation can occur after sintering of MA powders [Reference Shang, Axinte, Ge, Zhang and Wang80], homogeneous structures can be obtained in samples synthesized by co-sputter deposition, showing good stability under high-voltage electron irradiation [Reference Nagase, Rack, Noh and Egami34]. Radiation in HEAs can also be used to characterize the sluggish diffusion in HEAs [Reference Tunes, Le, Greaves, Schön, Bei, Zhang, Edmondson and Donnelly125].
High-entropy ceramics and oxides/nitrides
Some multielement materials with high proportions of nonmetallic elements, for example, Si [Reference Chen, Duval, Hung, Yeh and Shih99, Reference Zhang, Zuo, Cheng and Liaw126], present excellent properties. For example, FeCoNi(AlSi)0.2, with an FCC structure, possesses good mechanical properties (342 MPa yield strength with 50% ductility), as well as promising soft magnetic properties (1.15 T saturation magnetization, 1400 A/m coercivity, and 69.5 µΩ cm electrical resistivities) [Reference Zhang, Zuo, Cheng and Liaw126]. However, with increasing Si content, a BCC phase transition occurs, after which a brittle fracture mechanism takes over. Moreover, nitrided HEA films have also been widely investigated and offer themselves as a promising class of engineering surface materials [Reference Chen, Shun, Yeh and Wong35, Reference Huang and Yeh127], showing an FCC structure (NaCl-type) with homogeneous elemental distribution and exhibiting high hardness and thermal stability. NC-AlCrTaTiZr-nitride films have also been recognized as an excellent diffusion barrier in Cu metallization [Reference Chang, Chen and Chen128].
The concept of high-entropy ceramics was not widely accepted until a few studies on entropy-stabilized oxides [Reference Rost, Sachet, Borman, Moballegh, Dickey, Hou, Jones, Curtarolo and Maria129] and nitrides [Reference Chen, Shun, Yeh and Wong35] were reported. Such materials have more recently been recognized as forms of HEMs. High-temperature processing is generally beneficial toward the formation of entropy-stabilized oxides and nitrides. With increasing temperature, the structure of (MgNiCoCuZn)O system changes from a mixture of original phases of MgO, NiO, ZnO, CuO, and CoO to a homogenous single-phase rock salt structure [Reference Rost, Sachet, Borman, Moballegh, Dickey, Hou, Jones, Curtarolo and Maria129]. Comparing the (CoCuMgNiZn)O and (CoMgNiZn)O systems, the minimum required synthesis temperature in the former is much lower than that of the latter [Reference Sarkar, Djenadic, Usharani, Sanghvi, Chakravadhanula, Gandhi, Hahn and Bhattacharya130], further fortifying the theory of entropy stabilization. Hence, this theory has guided the research of high-entropy oxides (HEOs) and has led to widespread recognition of the class of high-entropy ceramics.
Toward applications, HEOs can be used in the energy sector. For example, the (MgNiCoCuZn)O system exhibits a very high dielectric constant of 2 × 10⁵ at 440 K with bulk resistance of 30 MΩ [Reference Bérardan, Franger, Dragoe, Meena and Dragoe131], as well as excellent lithium-ion conductivities with high capacity for lithium-ion batteries [Reference Sarkar, Wang, Schiele, Chellali, Bhattacharya, Wang, Brezesinski, Hahn, Velasco and Breitung132, Reference Bérardan, Franger, Meena and Dragoe133, Reference Sarkar, Velasco, Wang, Wang, Talasila, de Biasi, Kübel, Brezesinski, Bhattacharya, Hahn and Breitung134]. Doping this system with cations, such as Pt, results in high stability and compressibility [Reference Chen, Liu, Liu, Zhang, Yuan, Zhao, Yan, Hou, Yan, Kunz, Tamura, Zhang and Yin135], with good catalytic activity of CO oxidation [Reference Chen, Fu, Zhang, Peng, Abney, Jie, Liu, Chi and Dai136]. The electrochemical properties, CO oxidation activity, and compressibility of the (MgNiCoCuZn)O system are shown in Fig. 12. Unlike crystalline HEAs with FCC, BCC, or occasionally HCP structures, HEOs can present much more complex structures, such as fluorite [Reference Gild, Samiee, Braun, Harrington, Vega, Hopkins, Vecchio and Luo137], perovskite [Reference Jiang, Hu, Gild, Zhou, Nie, Qin, Harrington, Vecchio and Luo138] and rock salt structures [Reference Sarkar, Wang, Schiele, Chellali, Bhattacharya, Wang, Brezesinski, Hahn, Velasco and Breitung132]. Orthorhombic (Pbnm) perovskite HEOs, (5A0.2)(5B0.2)O3, show antiferromagnetic behaviors, due to a combination of an antiferromagnetic matrix and ferromagnetic clusters [Reference Witte, Sarkar, Kruk, Eggert, Brand, Wende and Hahn139].
(a) Long-term cycling stability of (CoCuMgNiZn)0.2O with the corresponding Coulombic efficiency; (b) lithium superionic conductivity in (Mg, Co, Ni, Cu, and Zn)1−xLixO; (c) CO oxidation activity of Pt-doped NiMgCuZnCoOx; (d) structure of NiMgCuZnCoOx; and (e) compressibility of Li-doped MgCoNiCuZnO5 (d). Figures (a) and (b) adapted from Refs. Reference Sarkar, Velasco, Wang, Wang, Talasila, de Biasi, Kübel, Brezesinski, Bhattacharya, Hahn and Breitung134 and Reference Bérardan, Franger, Meena and Dragoe133, respectively. Figures (c) and (d) adapted from Ref. Reference Chen, Fu, Zhang, Peng, Abney, Jie, Liu, Chi and Dai136 with permission from the Center National de la Recherche Scientifique (CNRS) and The Royal Society of Chemistry. Figure (e) reprinted (adapted) with permission from Ref. Reference Chen, Liu, Liu, Zhang, Yuan, Zhao, Yan, Hou, Yan, Kunz, Tamura, Zhang and Yin135, Copyright 2019 from American Chemical Society.

Next to HEOs, other high-entropy ceramics systems are under exploration as well, such as high-entropy diborides [Reference Gild, Zhang, Harrington, Jiang, Hu, Quinn, Mellor, Zhou, Vecchio and Luo140], carbides [Reference Harrington, Gild, Sarker, Toher, Rost, Dippo, McElfresh, Kaufmann, Marin, Borowski, Hopkins, Luo, Curtarolo, Brenner and Vecchio141], silicides [Reference Gild, Braun, Kaufmann, Marin, Harrington, Hopkins, Vecchio and Luo142] and sulfides [Reference Zhang, Gucci, Zhu, Chen and Reece143]. Both (V0.2Nb0.2Ta0.2Mo0.2W0.2)C [Reference Harrington, Gild, Sarker, Toher, Rost, Dippo, McElfresh, Kaufmann, Marin, Borowski, Hopkins, Luo, Curtarolo, Brenner and Vecchio141] and (Hf0.2Zr0.2Ta0.2Cr0.2Ti0.2)B2 [Reference Gild, Zhang, Harrington, Jiang, Hu, Quinn, Mellor, Zhou, Vecchio and Luo140] have been shown to be ideal systems for further investigation of entropy stabilization theory in high-entropy carbides and diborides, respectively. The (Yb0.25Y0.25Lu0.25Er0.25)2SiO5 system not only presents significant anisotropy in thermal expansion but also provides a new theory on elemental configuration for high-entropy ceramics [Reference Heng, Huimin, Fu-Zhi, Jiachen and Yanchun144]. Furthermore, based on the entropy stabilization theory and configuration principle, a complete metallic-element system made up of IM compounds, such as (Fe0.2Co0.2Ni0.2Mn0.2Cu0.2)Al, is also a promising research direction, providing a system that bridges the gap between HEAs and ceramics [Reference Zhou, Jiang, Huang, Qin, Hu and Luo145]. Nevertheless, recent investigations are mainly focused on fabrication methods, and the properties of these newly explored materials are much less studied. As a result, the effect of nanoscale structures on high-entropy ceramics has not been well understood. Therefore, the combination of entropy stabilization theory and unique performance due to nanoscale grain sizes is interesting for future research.
Summary, current challenges, and future opportunities
Summary
In summary, this article has reviewed the recent literature on NC HEAs and NC HEMs. We have summarized the most popular methods used to synthesize NC HEAs and NC HEMs as MA (more specifically, ball milling), followed by HPT and DCMS. Of these three, HPT has been shown to have the highest success rate in forming single-phase alloys. Although we have not found conclusive trends in mechanical or functional properties that support current theories surrounding HEMs, there are many useful properties that can be extracted from such materials. In general, NC HEAs are stronger than coarse-grained HEAs and NC metals/alloys, and their thermal stability generally surpasses pure and binary NC materials. NC HEAs can be regarded as promising candidates for wear resistance, whereas they seem to be less ideal for the corrosion resistance. Through modifications in synthesis techniques and compositions, nanostructures can be optimized for specific functional properties. Although nanostructures result in high impedance to electron movement, their synergetic influence with high lattice distortion in NC HEAs leads to promising thermoelectric properties. Additionally, the transition of nanostructures can also affect the types of magnetism of NC HEAs. We also see an ever-increasing expansion in the breadth of HEMs being studied, from the more conventional 3d transition metal group, to oxides, nitrides, glasses, composites, and many more. The mechanical studies of NC HEAs and HEMs have been intensively focused on hardness, tensile strength, and ductility. However, the fracture toughness, creep resistance, and fatigue properties of such NC HEAs have been relatively rarely reported up to date.
Current challenges
Further development in this field is hindered primarily by the limitation of methods and suitable materials. If the motivation to develop new NC HEAs is to replace conventional alloys, such as stainless steels and Ni-based superalloys, and provide superior mechanical and functional properties, the development of more suitable HEM candidates with low cost and good scalability should be considered at the early stage of materials design. Industrial viability must also be measured by the potential applications of these materials, which are currently narrow and specific to very few alloys. A second, and widespread, challenge impeding HEM research, is that searching the appropriate compositions out of the huge compositional space is an arduous task. However, there is little potential toward simulating HEMs, as their complexity lends them to oftentimes form structures and properties that are unexpected and unpredictable. Furthermore, the methods used to make NC HEMs are very limited and it is also challenging to scale up the sample size using current processing methods. Consequently, it is challenging to test many mechanical and functional properties, such as fracture toughness and fatigue, toward practical applications. Finally, the thermod1ynamic and kinetic models for NC metals and binary alloys may not be directly applied to NC HEAs/HEMs; new theories are expected to be developed to give a better understanding of mechanical and functional behavior in NC HEAs/HEMs.
Future opportunities
The outlook on NC-HEM research is not entirely grim, as many of the promising opportunities in this field stem directly from these challenges. Much effort has gone toward the improvement of mechanical and thermal stability of HEMs, and many through novel methods and structures. As such, the contributions of HEA studies are not only restricted to this field but also to the whole metallurgy and materials science community. Furthermore, the expansion of this research outlook to include not only HEAs but all HEMs could help to drive more innovative research as well.
HEAs and HEMs are often classified as fields in which high throughput experimentation is required to fully explore the compositional landscape of available alloy/material combinations. On the other side of this coin is the vast expanse of functional properties that a single material could exhibit, which itself requires high-throughput experimentation to fully explore. If we consider the approximate number of unique alloys (∼75), processes (11), and properties (9) reviewed in this article, to fully investigate the comparative performance of each alloy we arrive at minimum of ∼7500 separate characterization studies that must be performed, not including those alloys with the same composition but different microstructures. The time and cost to obtain this information is huge, and not altogether certain to give the results that are desired. Conventionally, the identification of new HEMs with desired structures and properties out of a vast compositional space is a daunting task through a sequential, slow, and trial-and-error approach. A prospective time- and cost-saving approach to acquiring this information is the use of machine learning (ML). As a tool to accompany physical testing, ML can be very useful in accelerating the discovery of new HEM candidates for various engineering applications. It would be of benefit to the HEM, and even broader material community, that a new methodology inverts the traditional paradigm. Such a new closed-loop paradigm may require incorporating material design, ML screening, high-throughput fabrication, characterization, and testing into an integrated system.
Supplementary material
To view supplementary material for this article, please visit https://doi.org/10.1557/jmr.2020.33.
Acknowledgments
This work was developed with the financial support from the Discovery Grants Program (RGPIN-2018-05731) of the Natural Sciences and Engineering Research Council of Canada (NSERC) and Dean's Spark Assistant Professorship in the Faculty of Applied Science & Engineering at the University of Toronto.


 Open access