


INTRODUCTION
State legislatures play a critical role in American democracy, with primary authority over salient policy areas including education, healthcare, and election administration. These institutions also allocate nearly $2 trillion in annual spending and are a key source of future members of Congress.Footnote 1 Yet, despite their importance, voters often know little about legislative politics (Carpini, Keeter, and Kennamer Reference Carpini, Delli and David Kennamer1994; Squire and Moncrief Reference Squire and Moncrief2019), and, as a result, observers worry that elections frequently fail to hold state legislators accountable for their representation (Carey et al. Reference Carey, Niemi, Powell and Moncrief2006; Rogers Reference Rogers2023a). Would state legislatures function differently if voters were exposed to more information about legislative politics?
A rich literature in political science reports that members of Congress who receive more news coverage better represent their constituencies (Arnold Reference Arnold2004; Campbell, Alford, and Henry Reference Campbell, Alford and Henry1984; Snyder and Stromberg Reference Snyder and Stromberg2010). Media coverage may also strengthen electoral selection for moderate candidates (Canes-Wrone and Kistner Reference Canes-Wrone, Kistner, Cameron, Canes-Wrone, Gordon and Huber2023) and reduce roll-off in congressional elections (Hayes and Lawless Reference Hayes and Lawless2015; Moskowitz Reference Moskowitz2021). However, since state legislatures are generally low-salience policy arenas receiving limited media coverage, it remains unclear whether the accountability-enhancing effects of press coverage identified in highly salient national settings extend to these down-ballot legislatures. For example, the marginal impact of press coverage may be higher in down-ballot elections, where baseline news penetration is low (Gentzkow, Shapiro, and Sinkinson Reference Gentzkow, Shapiro and Sinkinson2011; Schulhofer-Wohl and Garrido Reference Schulhofer-Wohl and Garrido2013), or the fragmented and localized nature of legislative politics may limit the influence of news sources no matter their strength (Dunaway Reference Dunaway2008). Assessing how media coverage shapes elections and legislative behavior in these low-salience settings is particularly important in light of the secular decline of local news sources (Hayes and Lawless Reference Hayes and Lawless2018; Martin and McCrain Reference Martin and McCrain2019; Napoli et al. Reference Napoli, Stonbely, McCollough and Renninger2019; Peterson Reference Peterson2021b; Worden, Matsa, and Shearer Reference Worden, Matsa and Shearer2022) and may help explain the rising ideological polarization of representatives across state legislatures (e.g., Shor and McCarty Reference Shor and McCarty2011; Reference Shor and McCarty2022).
Simply comparing state legislators who receive more and less news coverage, however, would capture differences other than relative media exposure, including district demographics, legislators’ behavior, and voters’ interest in legislative politics. I overcome this concern by constructing a measure of congruence between newspaper markets and state legislative districts, based on Snyder and Stromberg (Reference Snyder and Stromberg2010), that shapes legislative press coverage but is plausibly uncorrelated with other political and economic variables (Hayes and Lawless Reference Hayes and Lawless2015; Reference Hayes and Lawless2018; Martin and McCrain Reference Martin and McCrain2019).Footnote 2 To the extent that the selection on observables assumption from Snyder and Stromberg (Reference Snyder and Stromberg2010) is satisfied—an assumption I relax by including a battery of election, representative, and district controls and evaluate through a series of placebo tests—this article is the first to systematically identify the causal effect of newspaper coverage on state legislative elections, representation, and voters.
Leveraging this new measure of press coverage, this article follows the causal chain of the press’s impact in state legislatures: congruence between legislative districts and newspaper markets increases press coverage of state legislators, which increases voters’ knowledge about legislative politics, which in turn affects who is elected, and, ultimately, alters legislative representation. Figure 1 outlines these relationships. As I detail below, in addition to motivating these substantive analyses, the measures I introduce in this article will enable numerous valuable follow-on studies of press coverage across state legislatures.
Structure of Relationships Studied
Note: This figure outlines the series of relationships studied in this article.

I begin in the following section by introducing my empirical design, which leverages the haphazard overlap between legislative districts and newspaper markets, and by evaluating the driving assumption that newspaper coverage of a given state legislator increases with the congruence between legislative districts and newspaper markets. To do so, I gather extensive new data on press coverage of incumbent state legislators in 272 geographically and politically representative newspapers.Footnote 3 Analyzing this text corpus, I find that the number of articles appearing in a given newspaper about the incumbent state legislator is indeed strongly increasing in that newspaper’s share of readers residing in the associated legislative district. This relationship also holds at the aggregate level, with districts with greater congruence with local newspaper markets receiving substantially more legislative news coverage than relatively non-congruent districts. These strong relationships underlie the remainder of the article.
Having validated my empirical design, I proceed to investigate how press coverage impacts voters, legislative elections, and, ultimately, legislative representation. The next section studies voters using both survey and administrative data. First, studying Cooperative Election Study (CES) survey data, I find that my measure of legislative press coverage is associated with greater voter knowledge about their state legislator, but, importantly, is not associated with greater overall political knowledge about the U.S. Congress or state legislatures. Second, drawing on a massive dataset of precinct-level election returns, I find that press coverage augments voter engagement with legislative politics, as measured by ballot roll-off in legislative elections relative to the presidential ticket.
I then proceed in the next section to study how press coverage influences two prominent features of legislative elections: the electoral return to moderation and the incumbency advantage. Drawing on the midpoint design of Ansolabehere, Snyder, and Stewart (Reference Ansolabehere, Snyder and Stewart2001), which compares changes in vote shares as the ideological midpoint between general election candidates varies, I find that stronger press coverage substantially increases the electoral return to moderation in contested general elections. Second, leveraging the regression discontinuity (RD) design from Lee (Reference Lee2008), I show that legislative press coverage augments the combined personal and partisan incumbency advantage.
Finally, the penultimate section studies effects on how legislators represent their constituents once in office. Analyzing extensive roll-call, bill sponsorship, and committee assignment data, I find that state legislators who receive more news coverage are more productive: they sponsor more bills, are absent from roll-call votes less often, and are more likely to serve on important legislative committees. I also study how news coverage affects ideological representation. Applying a RD design introduced by Lee, Moretti, and Butler (Reference Lee, Moretti and Butler2004), I find that state legislators converge to the district median more when legislative newspaper coverage is stronger.
Taken together, these results underscore the critical role that the press plays in the functioning of state legislatures. My results indicate that state legislators would be more moderate, representative, and productive, and voters would engage more with legislative politics, were down-ballot press coverage strengthened. These results also suggest that the rapid erosion of local press coverage may have important consequences for accountability in low-salience, low-information environments, including state legislatures.
These analyses contribute to a rich literature on media coverage and accountability, as summarized in Table A.1 in the Supplementary Material. Most directly, my analysis builds on Snyder and Stromberg’s (Reference Snyder and Stromberg2010) foundational study of newspaper and television coverage in Congress, which reports that members of Congress who receive stronger media coverage better represent their constituents on a variety of dimensions. Related studies have identified similar effects of press coverage on voter knowledge (Arnold Reference Arnold2004; Hayes and Lawless Reference Hayes and Lawless2015; Peterson Reference Peterson2021b), ballot roll-off (Filla and Johnson Reference Filla and Johnson2010; Moskowitz Reference Moskowitz2021), the incumbency advantage (Prior Reference Prior2006; Schaffner Reference Schaffner2006; Trussler Reference Trussler2021; Reference Trussler2022), and the electoral return to moderation (Canes-Wrone and Kistner Reference Canes-Wrone, Kistner, Cameron, Canes-Wrone, Gordon and Huber2023) in Congress.
A smaller, yet critical, literature also studies how press coverage affects a limited set of political outcomes in municipal governments and state legislatures, including roll-off (Rubado and Jennings Reference Rubado and Jennings2020), the incumbency advantage (Hopkins and Pettingill Reference Hopkins and Pettingill2018; Schulhofer-Wohl and Garrido Reference Schulhofer-Wohl and Garrido2013), and voters’ political knowledge (Carpini, Keeter, and Kennamer Reference Carpini, Delli and David Kennamer1994).Footnote 4 Of particular relevance is Auslen’s (Reference Auslen2024) recent working paper studying dyadic issue representation in state legislatures, or the extent to which legislators match specific roll-call votes to their constituents’ preferences. Leveraging a congruence design that is similar to that of this article, Auslen finds that legislators who receive more news coverage are more likely to cast roll-call votes that match their district’s preferences on abortion, same-sex marriage, gun control, Medicaid expansion, and the minimum wage between 2011 and 2022. While this work is valuable, my analysis improves upon Auslen’s study in scope and research design. First, as Table A.1 in the Supplementary Material illustrates, my analysis’s focus on nine features of state legislative elections far exceeds prior studies of down-ballot accountability, including Auslen’s, and allows me to systematically trace the causal chain of the press’s impact in state legislatures from voters, to elections, to ideological representation and legislative effort.Footnote 5 Moreover, by studying elections between 2000 and 2022, my analysis offers double the temporal coverage of Auslen’s study. Second, this article improves upon Auslen’s panel-based research design by incorporating two RD designs, addressing long-standing concerns in observational research about the difficulty of placing districts and politicians on the same ideological scale (Broockman Reference Broockman2016) and regression toward the mean and differential candidate quality when estimating the incumbency advantage (e.g., Erikson Reference Erikson1971).
Finally, while scholars have long been interested in press coverage and accountability in low-salience electoral settings, data limitations have impeded systematic analysis across states, time, and political outcomes. The data and measures introduced in this article, which span all 98 partisan state legislative chambers for the years 2000–2022, will enable numerous valuable studies of press coverage in state legislatures precisely as concerns about the viability of local news sources grow most urgent.
EMPIRICAL STRATEGY
Measuring Congruence Between Newspaper Markets and Legislative Districts
Evaluating the effect of press coverage on accountability in state legislatures is challenging because the quantity and quality of newspaper coverage are endogenously determined by a variety of political and economic factors. Hence, simply comparing state legislators who receive more and less press coverage would capture differences other than relative media exposure, including district demographics, legislators’ behavior, and voters’ interest in legislative politics. To overcome this challenge, I adapt the newspaper congruence design from Snyder and Stromberg (Reference Snyder and Stromberg2010) to state legislatures. This design leverages the assumption that a newspaper’s coverage of a legislator is partially a function of the share its readers residing in the associated legislator’s district.Footnote 6 Intuitively, if the majority of a newspaper’s readers reside in a single district, the newspaper will cover that district’s legislator much more closely than legislators in other nearby areas. Conversely, a newspaper that straddles multiple districts will split its coverage of legislators accordingly, resulting in less-active political newspaper coverage. Identification in this design relies on the further assumption that the economic factors that shape newspaper markets are often orthogonal to political boundaries.Footnote 7 The result is natural variation in newspaper coverage, driven by the haphazard overlap of newspaper markets and legislative districts, that is plausibly orthogonal to confounding from economic and political variables.
More formally, let $ {q}_{mdt} $
be the number of articles about the legislator representing district d in time t appearing in newspaper m, and
$ {q}_{mdt} $
be the number of articles about the legislator representing district d in time t appearing in newspaper m, and $ ReaderShar{e}_{mdt} $
be the share of newspaper m’s readers that live in district d in time t.
Footnote
8 The central assumption of this article is that
$ ReaderShar{e}_{mdt} $
be the share of newspaper m’s readers that live in district d in time t.
Footnote
8 The central assumption of this article is that $ {q}_{mdt} $
is increasing in
$ {q}_{mdt} $
is increasing in $ ReaderShar{e}_{mdt} $
, or
$ ReaderShar{e}_{mdt} $
, or
 $$ \begin{array}{rl}{q}_{mdt}={\alpha}_0+{\alpha}_1ReaderShar{e}_{mdt}.& \end{array} $$
Throughout the article, I focus on districts where multiple newspapers circulate.Footnote 9 Hence, the sales-weighted number of articles written about the legislator representing district d in time t is
 $$ \begin{array}{rl}{q}_{dt}={\displaystyle \sum_{m=1}^M}MarketShar{e}_{mdt}{q}_{mdt},& \end{array} $$
where $ MarketShar{e}_{mdt} $
is newspaper m’s share of total newspaper circulation in district d in year t. Finally, substituting Equation 1 into Equation 2, we have
$ MarketShar{e}_{mdt} $
is newspaper m’s share of total newspaper circulation in district d in year t. Finally, substituting Equation 1 into Equation 2, we have
 $$ \begin{array}{rl}{q}_{dt}={\alpha}_0+{\alpha}_1Congruenc{e}_{dt},& \end{array} $$
where $ Congruenc{e}_{dt}={\sum}_{m=1}^MMarketShar{e}_{mdt}ReaderShar{e}_{mdt} $
. My analysis leverages variation in Congruence in Equation 3 to identify the effect of newspaper coverage on legislative accountability.
$ Congruenc{e}_{dt}={\sum}_{m=1}^MMarketShar{e}_{mdt}ReaderShar{e}_{mdt} $
. My analysis leverages variation in Congruence in Equation 3 to identify the effect of newspaper coverage on legislative accountability.
Intuitively, Congruence ranges from zero to one. When Congruence is equal to one, there is perfect overlap between newspaper markets and legislative districts, suggesting that the newspaper will concentrate its coverage on that district’s legislator. Congruence near zero indicates that voters will often be exposed to newspaper coverage about an incumbent that is not their legislator.
I calculate Congruence for every district in all 98 partisan state legislative chambers for the years 2000–2022—accounting for both decennial and court-initiated redistricting—using county-level newspaper circulation data from Peterson (Reference Peterson2021a).Footnote 10 These data were digitized from the 2008, 2014, and 2018 editions of the Standard Rate and Data Service Circulation handbook.Footnote 11 Additional details on this calculation are available in Section C of the Supplementary Material.
To provide intuition about the underlying source of variation that Congruence captures, consider the Wisconsin Senate in 2020, as plotted in Figure 2. The largest cities in Wisconsin are Milwaukee (red triangle), located in the south-eastern corner of the state, and Madison (red square), located in the south-central portion of the state. In Milwaukee, the highest circulating newspaper is the Milwaukee Journal Sentinel, with 81% of the newspaper market in the city. But, since the Milwaukee Journal Sentinel circulates widely across the state (only 6% reader share in the city), Congruence in Milwaukee is low. Conversely, in nearby Madison, the highest circulating newspaper is the Wisconsin State Journal, also with 81% of its city’s newspaper market. However, since the Wisconsin State Journal tends to circulate in Madison (24% reader share), Congruence is higher in Madison than in Milwaukee.
Congruence Between State Senate Districts and Newspaper Markets in Wisconsin
Note: The haphazard overlap between newspaper markets and legislative districts generates strong contrasts in Congruence, even between adjacent districts. Comparisons highlighted in the text are marked in red.

A similar strong contrast in Congruence is apparent in the western, more rural portion of Wisconsin. In the north-western 10th Senate district (red diamond), the majority of newspaper coverage comes from the St. Paul Pioneer Press and the Minneapolis Star Tribune (market shares of 64% and 11%, respectively), both of which primarily circulate across the border in Minnesota (reader shares of 6% and 1%, respectively). Hence, Congruence is low in Wisconsin’s 10th Senate district. Conversely, circulation of the St. Paul Pioneer Press and the Minneapolis Star Tribune is limited in the adjacent 31st Senate district (red circle), with readers instead largely purchasing the Eau Claire Leader-Telegram (63% market share). Since 53% of the Eau Claire Leader-Telegram’s readers reside in the 31st Senate district, Congruence is high in the 31st Senate district. Similar differences in Congruence hold across the state.
As these examples illustrate, the haphazard overlap of newspaper markets and legislative districts often produces strong contrasts in Congruence, even between adjacent districts. To emphasize this point, Figure 3 plots the distribution of Congruence across all states and years in my sample. As the figure depicts, there is substantial variation in Congruence across my sample, ranging from near zero to one. Hence, in order to appropriately characterize their substantive size, throughout the article I interpret estimated effects with reference to a one standard deviation increase in Congruence, or 0.19.
Distribution of Congruence Across Analysis Sample
Note: This figure plots the distribution of Congruence across all district-years included in my sample. The horizontal axis is logged, representing constant proportional change in Congruence, for ease of presentation.

Congruence Predicts Observed Legislative Newspaper Coverage
The foundation of my empirical design is the assumption that the number of articles a newspaper publishes about a legislator is increasing in that newspaper’s share of readers who live in the associated legislative district (Equation 1). While it is impossible to evaluate this assumption for all newspapers in my sample, I am able to examine the assumption for a subset of newspapers to which full text is available.
To do so, I use Newspapers.com to search 272 local and regional newspapers for articles about every incumbent state legislator between 2000 and 2020.Footnote
12 In Table D.1 in the Supplementary Material, I show that the newspapers contained in this archive are, on average, highly similar to newspapers not included in the archive across a variety of characteristics including average daily circulation, geography, the average Democratic share of circulation, and the average rural share of circulation.Footnote
13 Using this text corpus, I estimate $ {q}_{mdt} $
—the number of articles appearing in newspaper m about the legislator representing district d in year t—by searching for the name of the legislator, their state, and the name of their legislative chamber. In total, my sample includes nearly one million articles about state legislators.
$ {q}_{mdt} $
—the number of articles appearing in newspaper m about the legislator representing district d in year t—by searching for the name of the legislator, their state, and the name of their legislative chamber. In total, my sample includes nearly one million articles about state legislators.
As an initial test of Equation 1, I plot the univariate relationship between $ {q}_{mdt} $
and
$ {q}_{mdt} $
and $ ReaderShar{e}_{mdt} $
, the share of newspaper m’s readers that reside in district d in year t. The results are shown in Figure 4, where
$ ReaderShar{e}_{mdt} $
, the share of newspaper m’s readers that reside in district d in year t. The results are shown in Figure 4, where $ ReaderShar{e}_{mdt} $
is logged and the red dots represent averages of equal-sample-sized bins. I find a strong positive relationship between
$ ReaderShar{e}_{mdt} $
is logged and the red dots represent averages of equal-sample-sized bins. I find a strong positive relationship between $ ReaderShar{e}_{mdt} $
and
$ ReaderShar{e}_{mdt} $
and $ {q}_{mdt} $
. In other words, the number of articles written about the incumbent state legislator increases strongly in newspaper reader share.
$ {q}_{mdt} $
. In other words, the number of articles written about the incumbent state legislator increases strongly in newspaper reader share.
Newspaper Reader Share Shapes Legislator Press Coverages
Note: The number of articles written by newspaper m about the legislator representing district d in year t (vertical axis) is strongly increasing in newspaper m’s reader share in district d (horizontal axis). Circles are averages of equal-sample-sized bins of the horizontal axis. The horizontal axis is logged, representing constant proportional change in reader share, and the solid line plots a third-degree polynomial that is fit to the underlying data.

Building on this initial evidence, I now formally test this motivating assumption while controlling for a variety of variables that may affect legislator news coverage. These controls fall into three categories. First, I add legislator-specific controls, including indicators for whether the legislator is a freshman and a chair of a legislative committee. I also control for the legislator’s experience as measured by their tenure in the legislature. Second, I control for election characteristics, including whether the election was close (margin less than 10 percentage points), was uncontested, or was for an open seat. Finally, I add district controls, including population density, median income, percent urban, percent retired, percent veterans, and percent foreign born. The summary statistics for these controls, along with their sources, are reported in Table B.1 in the Supplementary Material. Summary statistics for all outcomes studied in this article are included in Table B.2 in the Supplementary Material.
Table 1 presents the results from this analysis. Throughout, I include state-chamber-year fixed effects, which rule out confounding from factors that are constant within each chamber’s legislative session, including legislative professionalism, overall levels of news penetration, and chamber-specific norms.
Newspaper Reader Share and Legislator Press Coverages

Note: After controlling for legislator, election, and district variables, newspaper Reader Share strongly predicts observed press coverage. As a result, the congruence between newspaper markets and districts is also highly predictive of legislative newspaper coverage. Standard errors are clustered by district in parenthesis. The sales-weighted average number of articles about a legislator in district d in time t is $ {q}_{dt}={\sum}_{m=1}^MMarketShar{e}_{mdt}\cdot {q}_{mdt}. $
The definition of
$ {q}_{dt}={\sum}_{m=1}^MMarketShar{e}_{mdt}\cdot {q}_{mdt}. $
The definition of $ {q}_{cdt} $
is analogous. Results are substantively similar after logging ReaderShare and Congruence.
$ {q}_{cdt} $
is analogous. Results are substantively similar after logging ReaderShare and Congruence.
In columns 1 and 2 of Table 1, the unit of analysis is the district-newspaper and the outcome is the number of articles appearing in newspaper m about the legislator representing district d in year t ( $ {q}_{mdt} $
). The key independent variable is Reader Share. Column 1 of Table 1 simply provides a formal test of Figure 4. In column 2, I add legislator, election, and district controls, which help account for potential confounders that vary across districts within a given state-chamber-year. Across both specifications, I find strong evidence that
$ {q}_{mdt} $
). The key independent variable is Reader Share. Column 1 of Table 1 simply provides a formal test of Figure 4. In column 2, I add legislator, election, and district controls, which help account for potential confounders that vary across districts within a given state-chamber-year. Across both specifications, I find strong evidence that $ {q}_{mdt} $
increases in Reader Share, as specified by Equation 1. Specifically, I estimate that a one standard deviation increase in Reader Share (0.15) is associated with 16 additional articles written about the incumbent state legislator.
$ {q}_{mdt} $
increases in Reader Share, as specified by Equation 1. Specifically, I estimate that a one standard deviation increase in Reader Share (0.15) is associated with 16 additional articles written about the incumbent state legislator.
Overall, the strong relationship between an individual newspaper’s Reader Share and its legislative news coverage underlies the results of the remainder of this article. Because I focus my analysis on districts where at least two newspapers circulate, however, I must aggregate these newspaper-level relationships to the district level. Following Equation 2 and Equation 3, I do so by calculating the sales-weighted total number of articles written about the legislator representing district d in time t ( $ {q}_{dt} $
). Columns 3 and 4 of Table 1 then regress
$ {q}_{dt} $
). Columns 3 and 4 of Table 1 then regress $ {q}_{dt} $
on Congruence with and without controls. In both specifications, I find a strong positive relationship between Congruence and legislative press coverage. These results provide robust evidence that the newspaper-level relationships documented in columns 1 and 2 of Table 1 generate meaningful variation in aggregate district-level press coverage.
$ {q}_{dt} $
on Congruence with and without controls. In both specifications, I find a strong positive relationship between Congruence and legislative press coverage. These results provide robust evidence that the newspaper-level relationships documented in columns 1 and 2 of Table 1 generate meaningful variation in aggregate district-level press coverage.
To probe the robustness of these results, I conduct two additional analyses in Section F of the Supplementary Material. First, to account for the possibility that larger newspapers may have more resources with which to produce political news coverage, Table F.1 in the Supplementary Material adds controls for each newspapers’ log total circulation (columns 2 and 4) or the logged total circulation of all newspapers serving a district (columns 6 and 8). Second, in columns 3 and 7 of Table F.1 in the Supplementary Material, I control for each district’s distance to the state capital, which accounts for the possibility that legislative press coverage may be stronger closer to the state capital. My conclusions remain unchanged following these additions.
To recapitulate, in this section I found that newspaper Reader Share is highly predictive of legislative newspaper coverage, as required by Equation 1. As a result, aggregate newspaper coverage of state legislators increases strongly in Congruence, as specified by Equation 3. This relationship forms the foundation of the remainder of this article.
VOTERS
Having introduced and validated my empirical strategy, I transition to following the causal chain of the press’s impact in state legislatures, beginning with voters. In this section, I evaluate how Congruence affects voters’ political knowledge and engagement with legislative politics.
Voter Political Knowledge
In order to hold their representatives accountable, a rich literature indicates that voters require information about their legislators’ actions and positions. Access to more political information may reduce the probability that voters mistakenly cast votes for the “wrong” candidate (Hall and Snyder Reference Hall and Snyder2015; Lupia and McCubbins Reference Lupia and McCubbins1998) and raise the perceived cost of corruption (Campante and Do Reference Campante and Do2014; Ferraz and Finan Reference Ferraz and Finan2008; Song Reference Song2016) and poor policy outcomes (Benedictis-Kessner and Warshaw Reference Benedictis-Kessner and Warshaw2020; Hastings et al. Reference Hastings, Kane, Staiger and Weinstein2007). In this subsection, I evaluate whether political news coverage, as proxied by Congruence, affects voters’ knowledge about their state legislator.
To examine whether Congruence affects voters’ knowledge about their state legislator, I study two questions appearing in the 2018 Cooperative Election Study (CES).Footnote 14 In the first, respondents were asked the open-ended question “Even if you had to guess, who is your current representative in the [state legislative chamber name]?” Using responses to this question, I map each respondent to the appropriate legislative district and create an indicator for whether they correctly identified the name of their state legislator.Footnote 15 Similar to Rogers (Reference Rogers2023a), I find that only a small minority of respondents (10%) can correctly identify their state legislator.
Because this first question is open-ended, it presents a difficult test of respondents’ legislative political knowledge. To ensure my results are not a fluke of this challenging survey question, I analyze a second CES question that offers respondents a set choice of responses. Specifically, the question asks respondents to “Indicate whether you approve or disapprove of the job that [state legislator’s name] is doing.” The set of responses are “Strongly approve,” “Approve,” “Disapprove,” “Strongly disapprove,” or “Never heard of this person.” Using these responses, I generate a second variable that records whether respondents have heard of their state legislator (85% have).
In Table 2, I regress these two indicator variables on Congruence. As above, I employ state-chamber-year fixed effects and estimate the regressions with and without my battery of legislator, election, and district controls. In columns 1 and 2, the outcome is an indicator for whether the respondent correctly provided the name of their state legislator. Looking at column 1, I estimate that a one standard deviation increase in Congruence (0.19) is associated with a 2.9 percentage point increase in the probability that a respondent correctly identifies their state legislator. Given that only 10% of respondents correctly identified their state legislator, this increase represents a roughly 29% increase in the probability of correctly identifying the incumbent state legislator. After adding legislator, election, and district controls in column 2, the my conclusions remain unchanged.
News Congruence and State Legislative Name Recall and Recognition

Note: Congruence strongly predicts voters’ probability of correctly identifying their lower chamber state legislator. Standard errors are clustered by district in parentheses.
In columns 3 and 4 of Table 2, I study whether respondents indicate ever hearing of their state legislator. Looking at column 3, I estimate that a one standard deviation increase in Congruence is associated with a 4.8 percentage point increase in the probability of hearing of their state legislator. Since 85% of respondents answered in the affirmative, on average, this estimate translates into a more-modest 6% increase in the probability of correctly identifying the incumbent legislator. Again, the results are similar after introducing my battery of control variables.
While the limited sample size requires caution, that Congruence has a larger proportional effect on name recall than name recognition suggests that Congruence may have a more substantial effect on cognitively demanding measures of legislative knowledge. Regardless, the results presented in Table 2 provide strong evidence that Congruence augments voters’ knowledge about their state legislator.
Voter Knowledge Placebo Test
By design, my measure of Congruence influences the quantity of press coverage that a specific state legislator receives. Congruence should not, however, affect the quantity of press coverage a district receives about national politics or state politics in general. Evaluating this prediction is an essential robustness check on my identification strategy, because, if Congruence was associated with political knowledge in general, we would be worried that the effects I identify reflect a broader informational advantage in congruent districts, or that voters in congruent districts have a stronger demand for political news coverage.
To evaluate this possibility, I conduct a placebo test using questions placed in the same 2018 CES survey employed in Table 3.Footnote 16 Specifically, for state legislative upper and lower chambers, the U.S. House, and the U.S. Senate, the CES asked respondents “Which party has a majority of seats in the [chamber name]?” Respondents chose between “Republicans,” “Democrats,” “Neither,‘” or “Not sure.” For each respondent, I impute the correct response and generate an indicator for whether their response was correct.
Placebo Test: News Congruence and General Political Knowledge

Note: Respondents’ knowledge about aggregate state- and national-level politics is not affected by Congruence. Standard errors are clustered by district in parentheses.
In Table 3, I regress these indicators on Congruence and the standard controls and fixed effects. Across all four columns in Table 3, I estimate small and statistically insignificant coefficients on Congruence, indicating that Congruence does not appear to be associated with greater voter political knowledge in general. These results increase our confidence that the estimates presented in Table 3 are not spurious, and that results in subsequent sections are not driven by an unobserved dimension of voters’ political interest or engagement.
Roll-Off
The results presented so far indicate that Congruence increases voters’ knowledge about their state legislator. These results hold in spite of the often fragmented and localized nature of legislative press coverage. By augmenting voters’ political knowledge, Congruence may also affect how voters engage with legislative politics. A rich literature on congressional elections, for example, reports that stronger local media coverage increases turnout (Hayes and Lawless Reference Hayes and Lawless2015; Oberholzer-Gee and Waldfogel Reference Oberholzer-Gee and Waldfogel2009; Peterson Reference Peterson2021a) and reduces roll-off (Moskowitz Reference Moskowitz2021; Snyder and Stromberg Reference Snyder and Stromberg2010). I evaluate whether Congruence has a similar mobilizing effect in down-ballot state-legislative elections.
To study voter engagement, I focus on roll-off in state legislative races relative to the presidential ticket. This measure captures the share of voters that, conditional on casting a vote in the presidential election, do not vote in their state legislative race. Studying roll-off is valuable because voting is most Americans’ primary form of political engagement, and lower turnout elections may indicate dissatisfaction with representatives’ policy making (Adams, Dow, and Merrill Reference Adams, Dow and Merrill2006). To study roll-off, I draw on a massive administrative dataset of precinct-level election returns in the vast majority of state legislative districts in presidential election years between 2000 and 2020.Footnote
17 Using these data, I calculate the total number of votes cast in presidential ( $ {P}_{dt} $
) and state legislative (
$ {P}_{dt} $
) and state legislative ( $ S{T}_{dt} $
) elections within each state legislative district d in time t,Footnote
18 and calculate roll-off as
$ S{T}_{dt} $
) elections within each state legislative district d in time t,Footnote
18 and calculate roll-off as
 $$ \begin{array}{rl}{RollOff}_{dt}^{StateLeg.}=(1-\frac{S{T}_{dt}}{P_{dt}})\times 100.& \end{array} $$
The value of $ {RollOff}_{dt}^{StateLeg.} $
indicates the percent of voters who vote for the presidential ticket but do not cast a vote in their state legislative election.
$ {RollOff}_{dt}^{StateLeg.} $
indicates the percent of voters who vote for the presidential ticket but do not cast a vote in their state legislative election.
Columns 1 and 2 of Table 4 regress this measure of roll-off on Congruence, including the standard fixed effects and with and without controls. In both columns, the coefficient on Congruence is negative and highly significant, indicating that legislative press coverage reduces roll-off in state legislative races relative to the presidential ticket. Interpreting the substantive size of these coefficients, in column 1, I find that that a one standard deviation increase in Congruence is associated with a 0.6 percentage point decrease in roll-off in state legislative races. Given that $ {RollOff}_{dt}^{StateLeg.} $
is, on average, 3.98% across my sample, this increase translates into a 14% decrease in legislative roll-off. After adding controls in column 2, my conclusions remain unchanged.
$ {RollOff}_{dt}^{StateLeg.} $
is, on average, 3.98% across my sample, this increase translates into a 14% decrease in legislative roll-off. After adding controls in column 2, my conclusions remain unchanged.
Voter Roll-Off in State Legislative Race Relative to Presidential Race

Note: Voter roll-off in state legislative races relative to the presidential ticket (columns 1 and 2) is lower when Congruence is stronger. As a placebo test, columns 3 and 4 show that there is no meaningful relationship between roll-off in U.S. Senate races relative to the presidential ticket and Congruence. Standard errors are clustered by district in parentheses.
As a robustness check, I also compute the total votes cast in U.S Senate elections ( $ SE{N}_{dt} $
) within each state legislative district, and calculate roll-off in U.S. Senate elections relative to the presidential ticket as
$ SE{N}_{dt} $
) within each state legislative district, and calculate roll-off in U.S. Senate elections relative to the presidential ticket as
 $$ \begin{array}{rl}{RollOff}_{dt}^{U.S.Senate}=(1-\frac{SE{N}_{dt}}{P_{dt}})\times 100.& \end{array} $$
Because Congruence affects the quantity of press coverage about state legislators, but not coverage of U.S. senators, Congruence should not affect roll-off in U.S. Senate races. This is indeed what I find in columns 3 and 4 of Table 4, where the coefficients on Congruence are small in magnitude, estimated precisely, and not statistically distinguishable from zero. Overall, this placebo test should bolster our confidence that Congruence is not confounded by other factors that broadly influence voter political engagement or interest.
PRESS COVERAGE AND LEGISLATIVE ELECTIONS
In the previous two sections, I found that congruence between newspaper markets and legislative districts augments legislative press coverage, and this coverage strengthens voter knowledge about their state legislator and increases engagement in legislative politics. Building on these findings, I now evaluate how these informational and engagement effects alter the functioning of legislative elections, focusing on two prominent claims: that press coverage strengthens the electoral selection for moderate candidates and press coverage increases the incumbency advantage.
Electoral Returns to Moderation
A rich literature in political science documents that voters prefer more-moderate candidates to more-extreme candidates (Ansolabehere, Snyder, and Stewart Reference Ansolabehere, Snyder and Stewart2001; Burden Reference Burden2004; Canes-Wrone, Brady, and Cogan Reference Canes-Wrone, Brady and Cogan2002; Erikson et al. Reference Erikson, Wright, Brady, Cogan, Fiorina, David W., Cogan and Fiorina2000; Handan-Nader, Myers, and Hall Reference Handan-Nader, Myers and Hall2025; Rogers Reference Rogers2023a; Tomz and Van Houweling Reference Tomz and Van Houweling2008), matching canonical theories of candidate ideological positioning (Black Reference Black1958; Downs Reference Downs1957; Hotelling Reference Hotelling1929). It is plausible, though, that voters will be less able to respond to candidates’ ideological positions when news coverage of elections is low. Hall (Reference Hall2015) and Canes-Wrone and Kistner (Reference Canes-Wrone, Kistner, Cameron, Canes-Wrone, Gordon and Huber2023), for example, find that the electoral penalty to ideological extremists in congressional elections is indeed higher when press coverage is stronger. Similarly, Cohen, Noel, and Zaller (Reference Cohen, Noel and Zaller2004) find that television coverage strengthens the relationship between ideological moderation and legislators’ probability of winning reelection in Congress. It remains unclear, however, whether these results on Congress translate to state legislatures, where elections receive limited press coverage and public attention.
Studying whether press coverage augments electoral selection for moderate candidates is critical given the secular decline of local news sources (Hayes and Lawless Reference Hayes and Lawless2018; Martin and McCrain Reference Martin and McCrain2019; Napoli et al. Reference Napoli, Stonbely, McCollough and Renninger2019; Peterson Reference Peterson2021b; Worden, Matsa, and Shearer Reference Worden, Matsa and Shearer2022). As I detail below, if press coverage strengthens electoral selection for moderates, contemporary declines in legislative press coverage may help explain the rising polarization of state legislatures (e.g., Shor and McCarty Reference Shor and McCarty2011; Reference Shor and McCarty2022).
To assess how news coverage affects the electoral return to moderation, I adapt the midpoint method from Ansolabehere, Snyder, and Stewart (Reference Ansolabehere, Snyder and Stewart2001) to my setting. This design leverages changes in the ideological midpoint between Democratic and Republican general election candidates, holding fixed the distance between the candidates and the district median, to predict candidates’ vote shares. I prefer the midpoint method over the “candidate extremism” method of Canes-Wrone, Brady, and Cogan (Reference Canes-Wrone, Brady and Cogan2002)—where vote shares are regressed directly on candidates’ ideological positions—because the midpoint method does not require assuming that the Democratic and Republican candidates are on the “correct” side of the district median or that zero is the reference point with which ideological extremity is calculated (Hall Reference Hall2019).Footnote 19
For information on candidates’ ideological positioning, I rely on the ideological scalings from Handan-Nader, Myers, and Hall (Reference Handan-Nader, Myers and Hall2025) (henceforth “HMH scores”), which use supervised machine learning to infer candidates’ roll-call ideology based on their network on campaign contributions. I prefer these scalings over CFscores from Bonica (Reference Bonica2014) because HMH scores correlate highly with observed roll-call voting, even within-party, and are trained only on the contributions that a candidate receives before they take office, short-circuiting concerns that contributions from access-seeking donors may make winners appear artificially moderate. HMH scores run from approximately−2 (most liberal) to 2 (most conservative) in my sample. Finally, election returns data for this and subsequent analyses comes from Klarner (Reference Klarner2023).
Following Ansolabehere, Snyder, and Stewart (Reference Ansolabehere, Snyder and Stewart2001), I estimate equations of the form
 $$ \begin{array}{l}{\hskip-0.2em Dem\ Vote\ Share}_{dt}=\hskip0em {\beta}_0+{\beta}_1{Midpoint}_{dt}+{\beta}_2{Distance}_{dt}\\ {}\hskip8.4em +\hskip0.2em {\beta}_3{Congruence}_{dt}+{\beta}_4{Midpoint}_{dt}\\ {}\hskip8.3em \times \hskip0.1em {Congruence}_{dt}+\Omega {X}_{dt}+{\delta}_{sct}+{\varepsilon}_{dt},\end{array} $$
where $ {Dem\ Vote\ Share}_{dt} $
is the Democratic candidate’s general election vote share in district d in election t.
Footnote
20
$ {Dem\ Vote\ Share}_{dt} $
is the Democratic candidate’s general election vote share in district d in election t.
Footnote
20 $ Midpoin{t}_{dt} $
and
$ Midpoin{t}_{dt} $
and $ Distanc{e}_{dt} $
are the midpoint and distance between Democratic and Republican candidates, respectively, and
$ Distanc{e}_{dt} $
are the midpoint and distance between Democratic and Republican candidates, respectively, and $ Congruenc{e}_{dt} $
is my measure of congruence between newspaper markets and legislative districts.Footnote
21 The term
$ Congruenc{e}_{dt} $
is my measure of congruence between newspaper markets and legislative districts.Footnote
21 The term $ {X}_{dt} $
is an optional vector of controls,
$ {X}_{dt} $
is an optional vector of controls, $ {\delta}_{sct} $
stands in for state-chamber-year fixed effects, and the error term,
$ {\delta}_{sct} $
stands in for state-chamber-year fixed effects, and the error term, $ {\varepsilon}_{dt} $
, is clustered by district d. Finally, to hold the district’s median voter constant, I control for the Democratic presidential candidate’s two-party vote share in the most recent presidential election. In words, this specification makes comparisons of Democratic vote shares across different values of Midpoint within the same state-chamber-year, after holding the distance between candidates and the district median constant.
$ {\varepsilon}_{dt} $
, is clustered by district d. Finally, to hold the district’s median voter constant, I control for the Democratic presidential candidate’s two-party vote share in the most recent presidential election. In words, this specification makes comparisons of Democratic vote shares across different values of Midpoint within the same state-chamber-year, after holding the distance between candidates and the district median constant.
Previous research on state legislatures suggests that $ {\beta}_1 $
is positive and between 0.12 and 0.3, indicating that candidates benefit from ideological moderation (Handan-Nader, Myers, and Hall Reference Handan-Nader, Myers and Hall2025), on average. The term
$ {\beta}_1 $
is positive and between 0.12 and 0.3, indicating that candidates benefit from ideological moderation (Handan-Nader, Myers, and Hall Reference Handan-Nader, Myers and Hall2025), on average. The term $ {\beta}_4 $
tests whether this advantage is stronger in districts with more-congruent newspaper coverage.
$ {\beta}_4 $
tests whether this advantage is stronger in districts with more-congruent newspaper coverage.
Table 5 reports the results from this analysis. To validate my data, column 1 simply evaluates the midpoint model without reference to Congruence. The coefficient on Midpoint of 0.16 in column 1 indicates that a shift from the left-most to right-most midpoint in my data is associated with a 16 percentage point increase in Democratic vote share.Footnote 22 A more reasonable one standard deviation increase in the midpoint (0.14) would increase the Democratic candidate’s vote share by 2.2 percentage points.
News Congruence and the Advantage of Moderate Candidates in Contested General Elections

Note: Moderate candidates receive higher vote-shares in districts with more-congruent newspaper coverage. The outcome is either Democratic vote share or a Democratic win indicator. Robust standard errors are clustered by district in parentheses. Midpoint and Distance variables are scaled to run from 0 to 1. The sample is limited to contested general elections in single member districts.
The remaining columns in Table 5 interact Midpoint with Congruence and explore sensitivity to alternate specifications. Across all specifications, I find a positive and highly significant coefficient on the interaction between Midpoint and Congruence, indicating that press coverage increases the electoral return to moderation. Consider the results in column 2, my baseline specification. Here, I estimate that a one standard deviation increase in Congruence increases the electoral return to moderation by 16% relative to when Congruence is at its mean of 0.14.Footnote 23
Next, in column 3, I extend the baseline specification to allow the relationship between Distance and Democratic vote share to vary with Congruence. Finally, columns 4 and 5 use different approaches to control for differences in candidate fundraising that may affect their ideological scalings—column 4 controls for primary-election fundraising totals while column 5 restricts the sample to contests where the gap in fundraising between the two candidates is below the median of the distribution of fundraising gaps. The results are highly consistent across these specifications.
To further evaluate the robustness of these results, I conduct three additional exercises. First, in Table G.1 in the Supplementary Material, I replicate Table 5 using CFscores from Bonica (Reference Bonica2014). Using this alternative ideological scaling, I identify similar, if slightly larger, effects of Congruence on Midpoint. Second, given recent concerns about the robustness of multiplicative interaction models (e.g., Hainmueller, Mummolo, and Xu Reference Hall2019), I show in Section J of the Supplementary Material that my results are highly similar using the non-parametric binning estimator Interflex proposed by Hainmueller, Mummolo, and Xu (Reference Hall2019). Third, to address the possibility that an unobserved confounder might be correlated with variation in Congruence and Democratic vote share across legislative districts within a given chamber, in Table G.2 in the Supplementary Material, I re-estimate Equation 6 after substituting in district-regime fixed effects. This specification leverages changes in Congruence within a district over time and rules out confounding from district-level factors that are constant over time. The results are highly similar in magnitude, yet slightly less precise because there is less variation in Congruence within a given district.
In sum, the results presented in Table 5 establish an important new finding: press coverage substantially increases the electoral returns to moderation in state legislative elections. To the extent that legislative polarization is driven by voters selecting more-extreme candidates, these results suggest that the decline of local press coverage may exacerbate polarization in state legislatures (e.g., Shor and McCarty Reference Shor and McCarty2011; Reference Shor and McCarty2022).
The Incumbency Advantage
Having examined how press coverage influences the electoral return to moderation, I now turn to a second key element of legislative elections: the incumbency advantage.
The incumbency advantage is one of the most studied features of American elections. In addition to highlighting the extraordinary advantage that incumbents receive in their re-election bids (e.g., Ansolabehere and Snyder Reference Ansolabehere and Snyder2002; Erikson Reference Erikson1971; Gelman and King Reference Gelman and King1990; Lee Reference Lee2008), prior research predicts that the incumbency advantage will be larger for higher-visibility offices and races (Ashworth and Bueno de Mesquita Reference Ashworth and de Mesquita2008).Footnote 24 While a rich literature reports that press coverage indeed increases the incumbency advantage in congressional elections (Prior Reference Prior2006; Schaffner Reference Schaffner2006; Trussler Reference Trussler2021; Reference Trussler2022), there is no evidence in low-salience state legislative elections. In this section, I evaluate the prediction from Ashworth and Bueno de Mesquita (Reference Ashworth and de Mesquita2008), using my measure of Congruence as a proxy for race visibility.
To assess this prediction, I employ the RD design from Lee (Reference Lee2008).Footnote
25 This design compares party vote shares in time $ t+1 $
in districts where the margin of victory was very close in time t. Since vote share is continuous around
$ t+1 $
in districts where the margin of victory was very close in time t. Since vote share is continuous around $ 50\%+1 $
, but incumbency status changes discontinuously, this difference estimates the change in vote share that is caused by incumbency.Footnote
26 This design represents a substantial improvement in identification over prior panel-based studies of press coverage and the incumbency advantage (e.g., Snyder and Stromberg Reference Snyder and Stromberg2010), which could be confounded by factors including regression toward the mean or differential candidate quality (Erikson Reference Erikson1971).
$ 50\%+1 $
, but incumbency status changes discontinuously, this difference estimates the change in vote share that is caused by incumbency.Footnote
26 This design represents a substantial improvement in identification over prior panel-based studies of press coverage and the incumbency advantage (e.g., Snyder and Stromberg Reference Snyder and Stromberg2010), which could be confounded by factors including regression toward the mean or differential candidate quality (Erikson Reference Erikson1971).
Since I am interested in how Congruence shapes the incumbency advantage, I modify Lee’s (Reference Lee2008) original design to allow for heterogeneity in the incumbency advantage. Specifically, for district d in election t, I estimate OLS regressions of the form
 $$ {Dem\ Vote\ Share}_{dt+1}={\displaystyle \begin{array}{l}{\alpha}_0+{\alpha}_1{V}_{dt}+{\alpha}_2{T}_{dt}+{\alpha}_3{C}_{dt}\\ {}+\hskip2px {\beta}_1{V}_{dt}{C}_{dt}+{\beta}_2{V}_{dt}{T}_{dt}\\ {}+\hskip2px {\beta}_3{C}_{dt}{T}_{dt}+{\gamma}_1{V}_{dt}{C}_{dt}{T}_{dt}\\ {}\Big[+{\alpha}_4{\mathbf{W}}_{dt}+{\beta}_4{V}_{dt}{\mathbf{W}}_{dt}\\ {}+\hskip2px {\beta}_5{T}_{dt}{\mathbf{W}}_{dt}+\hskip2px {\boldsymbol{\gamma}}_2{T}_{dt}{V}_{dt}{\mathbf{W}}_{dt}\Big]\\ {}+{\eta}_{sc}+{\delta}_t+{\varepsilon}_{dt}.\end{array}} $$
The term $ {Dem\ Vote\ Share}_{dt+1} $
is the Democrat’s vote share in time
$ {Dem\ Vote\ Share}_{dt+1} $
is the Democrat’s vote share in time $ t+1 $
,
$ t+1 $
, $ {T}_{dt} $
is an indicator for the Democrat’s victory in time t,
$ {T}_{dt} $
is an indicator for the Democrat’s victory in time t, $ {V}_{dt} $
is the Democratic candidate’s general election win margin in time t,
$ {V}_{dt} $
is the Democratic candidate’s general election win margin in time t, $ {C}_{dt} $
is the district’s Congruence,
$ {C}_{dt} $
is the district’s Congruence, $ {\eta}_{sc} $
and
$ {\eta}_{sc} $
and $ {\delta}_t $
represent state-chamber and year fixed effects, respectively, and
$ {\delta}_t $
represent state-chamber and year fixed effects, respectively, and $ {\mathbf{W}}_{dt} $
is an optional vector of control variables. This specification matches recent empirical and theoretical work on so-called “heterogeneity-in-discontinuities” designs (Bansak and Nowacki Reference Bansak and Nowacki2023; Desai and Frey Reference Desai and Frey2023; Olson Reference Olson2020). The quantity of interest,
$ {\mathbf{W}}_{dt} $
is an optional vector of control variables. This specification matches recent empirical and theoretical work on so-called “heterogeneity-in-discontinuities” designs (Bansak and Nowacki Reference Bansak and Nowacki2023; Desai and Frey Reference Desai and Frey2023; Olson Reference Olson2020). The quantity of interest, $ {\beta}_3 $
, captures the extent to which Congruence affects the incumbency advantage.
$ {\beta}_3 $
, captures the extent to which Congruence affects the incumbency advantage.
Table 6 reports the results from this analysis. Throughout the table, I combine local linear regression on each side of the discontinuity with the optimal bandwidth from Calonico, Cattaneo, and Titiunik (Reference Calonico, Cattaneo and Titiunik2014). Column 1 then establishes a baseline by estimating the incumbency advantage in state legislative elections without reference to Congruence. Here, I estimate that the as-if random assignment of incumbency increases a party’s subsequent vote share by 4 percentage points. This estimate is slightly smaller than most estimates of the incumbency advantage in Congress, including Lee’s (Reference Lee2008) 7.8 percentage points, Erikson’s (Reference Erikson1971) 6.7 percentage points, and Ansolabehere and Snyder’s (Reference Ansolabehere and Snyder2002) 5.9 percentage points.Footnote 27
Regression Discontinuity Estimates of the Incumbency Advantage in High and Low-Congruence Districts

Note: The incumbency advantage is higher in more-congruent districts. Standard errors are clustered by district-regime in parentheses.
Next, columns 2 through 4 of Table 6 allow the incumbency advantage to vary with levels of Congruence. Across Table 6, I find that press coverage augments the incumbency advantage. Consider column 2, which includes state-chamber fixed effects and no controls. Here, I estimate that the incumbency advantage is 4 percentage points when Congruence is zero, and increasing Congruence to one would boost the incumbency advantage by 5 percentage points. A more realistic one standard deviation increase in Congruence is associated with a 1 percentage point increase in the incumbency advantage. Given its initial value, this one standard deviation increase in Congruence translates into a 25% increase in the incumbency advantage.
To ensure these results are not confounded by political or demographic trends, columns 3 and 4 of Table 6 introduce my battery of legislator, election, and district controls, and allow their relationship with the outcome to vary across the discontinuity, with the running variable, and the interaction of the two.Footnote 28 In column 4, I further add a year fixed effect to account for potential changes in the incumbency advantage over time (Jacobson Reference Jacobson2015; Rogers Reference Rogers2023b). Following these additions, my substantive conclusions remain the same. Finally, given concerns about the robustness of multiplicative interaction models, in Section J of the Supplementary Material, I show that these results are robust to the non-parametric binning estimator Interflex introduced by Hainmueller, Mummolo, and Xu (Reference Hainmueller, Mummolo and Yiqing2019).
Taken together, the results presented in this subsection support the theoretical predictions of Ashworth and Bueno de Mesquita (Reference Ashworth and de Mesquita2008), indicating that where news coverage of state legislators is stronger, the incumbency advantage is substantially larger.
LEGISLATORS’ REPRESENTATION AND EFFORT IN OFFICE
The final step in my analysis examines how press coverage influences legislators’ representation in office. Press coverage may augment the representation that voters ultimately receive in three complementary ways. First, stronger press coverage may allow voters to select legislators that better match their priorities and to vote out of office legislators who provide poor representation (Lupia and McCubbins Reference Lupia and McCubbins1998). Second, press coverage may incentivize legislators to invest greater effort in their representation, either out of fear of being perceived as shirking their responsibilities or to garner free publicity for a job well done (Arnold Reference Arnold1990; Cooper Reference Cooper2002). Finally, by amplifying constituent concerns and preference, press coverage may equip legislators with better information to serve their constituency effectively (Cook Reference Cook2005; Kedrowski Reference Kedrowski1996; Riffe Reference Riffe1988). In this section, I explore how these mechanisms in aggregate influence legislative effort and legislators’ ideological representation.
Legislative Effort
Casting roll-call votes, sponsoring bills, and serving on committees are some of the most consequential duties that legislators perform. By casting roll-call votes, legislators engage in a highly consequential form of position-taking (Mayhew Reference Mayhew1974). Similarly, crafting and sponsoring legislation allows legislators to build a personal legislative agenda (Schiller Reference Schiller1995), while strategic committee service may permit legislators to prioritize and expedite the demands of their constituency (e.g., Berry and Fowler Reference Berry and Fowler2016; Gilligan and Krehbiel Reference Gilligan and Krehbiel1987; Shepsle Reference Shepsle1978; Reference Shepsle1989; Weingast and Marshall Reference Weingast and Marshall1988). Snyder and Stromberg (Reference Snyder and Stromberg2010) find strong evidence that members of Congress who receive more press coverage are more likely to work harder for their constituencies. In state legislatures, however, where press coverage is often limited and political activity may go unnoticed, it remains unclear whether press coverage has the power to incentivize legislative effort. In this section, I evaluate whether Congruence is associated with greater legislative effort.
To implement this analysis, I build datasets on legislative effort from a variety of sources. First, to measure whether legislators shirk by failing to cast a roll-call vote or sponsoring legislation, I assemble data on state legislative roll-call voting and bill sponsorships from Fouirnaies and Hall (Reference Fouirnaies and Hall2022) and the online data vendor Legiscan.com.Footnote 29 To this dataset, I merge in data on state legislative committee assignments from Bucchianeri, Volden, and Wiseman (Reference Bucchianeri, Volden and Wiseman2025). Using these datasets, I generate three measures of legislative effort: the percent of floor votes that I legislator misses, the number of bills each legislator sponsored, and an indicator for whether the legislator served on a power committee.Footnote 30 , Footnote 31
Table 7 regresses these three measures of legislative effort on Congruence. In odd numbered columns, I include state-chamber-year fixed effects, meaning these columns leverage comparisons of effort between legislators representing high and low congruence districts within the same legislative session and chamber. However, since the majority party may appear systematically more productive than the minority party (Bucchianeri, Volden, and Wiseman Reference Bucchianeri, Volden and Wiseman2025), even-numbered columns include state-chamber-year-party fixed effects. Hence, in this second set of columns, I only leverage comparisons within the same legislative session, chamber, and party.
Active Newspaper Coverage Increases Legislative Productivity

Note: Active newspaper coverage is associated with fewer missed roll-call votes, more bill sponsorships, and more-active committee membership. Outcomes are reported in column headers. Standard errors are clustered by district in parentheses.
The first two columns of Table 7 show the relationship between Congruence and the percent of floor votes that a legislator misses. When press coverage of legislative politics is stronger, I find that legislators miss fewer roll-call votes. Looking at column 1, I estimate that a one standard deviation increase in Congruence reduces missed floor votes by 0.3 percentage points. Given that the average legislator misses 3.3% of floor votes in my sample, this effect is equivalent to an 8% decrease in the missed vote rate. In column 2, I show that this result holds after restricting comparisons within party. Further, in Table I.1 in the Supplementary Material, I show that these results, and the remaining results in Table 7, hold after controlling for the distance between a legislator’s district and the state capital.
Next, columns 3 and 4 of Table 7 report estimates for the number of bills state legislators sponsor. Using both fixed effects specifications, I find that press coverage substantially increases the number of bills that a legislator sponsors. To interpret the substantive size of this effect, consider column 3. Here, I estimate that a one standard deviation increase in Congruence translates into roughly two more bill sponsorships, or a 7% increase over the median sponsorship rate. After accounting for partisan control of the legislative chamber, this effect is slightly smaller yet statistically significant and substantively meaningful (a one standard deviation increase in Congruence is associated with a 5% increase in sponsorships).
Finally, columns 5 and 6 study the probability that a legislator serves on a budget- or appropriations-related committee or committees responsible for setting chamber rules—the most powerful committees in state legislatures. These columns report a precisely estimated positive effect of Congruence on membership in these powerful committees. Looking at column 5, I estimate that a one standard deviation increase in Congruence increases the probability a state legislator serves on a power committee by 1 percentage point, or a 3% increase over the baseline. The effects are similar in column 6 after controlling for partisan control of the chamber. Hence, there appears to be a modest but potentially important effect of press coverage on committee membership.
Taken together, these estimates on legislative productivity suggest that press coverage meaningfully influences legislators’ effort once in office. Legislators representing districts with stronger press coverage demonstrate higher levels of legislative engagement, as proxied by fewer missed roll-call votes, more bill sponsorships, and a higher likelihood of serving on powerful committees. In the final section, I extend these findings on representation to legislators’ roll-call voting.
Representation Divergence
A defining feature of contemporary legislative polarization is the divergence in ideological representation between Democratic and Republican legislators. Despite Downs’ prominent prediction that candidates will converge to the median voter (Black Reference Black1958; Downs Reference Downs1957; Hotelling Reference Hotelling1929), previous work documents systematic and persistent divergence in American legislatures (Fowler and Hall Reference Fowler and Hall2016; Reference Fowler and Hall2017; Lee, Moretti, and Butler Reference Lee, Moretti and Butler2004). Scholars have advanced numerous explanations for the failure of convergence, including voter preferences for non-ideological characteristics (Ashworth and Bueno de Mesquita Reference Ashworth and de Mesquita2009; Bernhardt and Ingberman Reference Bernhardt and Ingberman1985; Eyster and Kittsteiner Reference Eyster and Kittsteiner2007; Groseclose Reference Groseclose2001), the threat of a third-party entrant (Palfrey Reference Palfrey1984), and uncertainty over electoral outcomes (Calvert Reference Calvert1985; McCarty et al. Reference McCarty, Rodden, Shor, Tausanovitch and Warshaw2019; Wittman Reference Wittman1983).
Surprisingly, there is little evidence on how news coverage shapes divergence in legislative representation. One important exception is Snyder and Stromberg (Reference Snyder and Stromberg2010), who show that congressional divergence is smaller in districts with stronger newspaper coverage. We might expect legislative media coverage to decrease legislative representation by prompting legislators to place more weight on their constituents’ preferences or by providing legislators better information about their constituency’s preferences. Alternatively, the legislative media environment may be too weak to meaningfully alter representatives’ ideological representation.
To assess the relationship between press coverage and divergence, I use a RD design to compare representation in districts where the Democratic candidate barely won to districts where the Republican candidate barely won (Fowler and Hall Reference Fowler and Hall2016; Reference Fowler and Hall2017; Lee, Moretti, and Butler Reference Lee, Moretti and Butler2004) across values of Congruence. In the neighborhood of the discontinuity, this design isolates the effect of an election result on ideological representation (Imbens and Lemieux Reference Imbens and Lemieux2008) and addresses concerns that districts that elect Democrats are, on average, systematically different than those that elect Republicans.
As a fundamental element of representation, I use state legislators’ roll-call votes to measure the ideological representation they provide their constituents, as captured by Shor and McCarty’s (Reference Shor and McCarty2011) NP-Scores.Footnote 32 For this design, I focus on contested state legislative elections in single-member districts. Specifically, for district d in election t I estimate OLS regressions of the form
 $$ {NP\ Score}_{dt}={\displaystyle \begin{array}{l}{\alpha}_0+{\alpha}_1{V}_{dt}+{\alpha}_2{T}_{dt}+{\alpha}_3{C}_{dt}+{\beta}_1{V}_{dt}{C}_{dt}\\ {}+\hskip2px {\beta}_2{V}_{dt}{T}_{dt}+{\beta}_3{C}_{dt}{T}_{dt}+{\gamma}_1{V}_{dt}{C}_{dt}{T}_{dt}\\ {}\Big[+{\alpha}_4{\mathbf{W}}_{dt}+{\beta}_4{V}_{dt}{\mathbf{W}}_{dt}+{\beta}_5{T}_{dt}{\mathbf{W}}_{dt}\\ {}+\hskip2px {\gamma}_2{T}_{dt}{V}_{dt}{\mathbf{W}}_{dt}\Big]\\ {}+{\eta}_{sc}+{\delta}_t+{\varepsilon}_{dt}.\end{array}} $$
In district d in election t, $ {\mathrm{NP}\ \mathrm{Score}}_{dt} $
is the winning candidate’s NP-Score,
$ {\mathrm{NP}\ \mathrm{Score}}_{dt} $
is the winning candidate’s NP-Score, $ {T}_{dt} $
is an indicator for the Democratic candidate’s victory,
$ {T}_{dt} $
is an indicator for the Democratic candidate’s victory, $ {V}_{dt} $
is the Democratic candidate’s general election win margin, and
$ {V}_{dt} $
is the Democratic candidate’s general election win margin, and $ {C}_{dt} $
is the district’s Congruence. The terms
$ {C}_{dt} $
is the district’s Congruence. The terms $ {\eta}_{sc} $
and
$ {\eta}_{sc} $
and $ {\delta}_t $
represent state-chamber and year fixed effects, respectively, and
$ {\delta}_t $
represent state-chamber and year fixed effects, respectively, and $ {\mathbf{W}}_{dt} $
is an optional vector of control variables. Note that this design mirrors the specification employed in Equation 7.
$ {\mathbf{W}}_{dt} $
is an optional vector of control variables. Note that this design mirrors the specification employed in Equation 7.
In a simple regression that excludes interactions with Congruence, the coefficient $ {\alpha}_2 $
captures the effect of narrowly electing a Democratic legislator on the associated district’s subsequent roll-call representation. As Fowler and Hall (Reference Fowler and Hall2017) note, if legislators closely match their roll-call voting to the median voter, we should expect
$ {\alpha}_2 $
captures the effect of narrowly electing a Democratic legislator on the associated district’s subsequent roll-call representation. As Fowler and Hall (Reference Fowler and Hall2017) note, if legislators closely match their roll-call voting to the median voter, we should expect $ {\alpha}_2 $
to be zero. Prior research, however, consistently reports a negative coefficient on
$ {\alpha}_2 $
to be zero. Prior research, however, consistently reports a negative coefficient on $ {\alpha}_2 $
, indicating that there is substantial divergence in ideological representation (Fowler and Hall Reference Fowler and Hall2016; Reference Fowler and Hall2017).Footnote
33 For this study, I am interested in
$ {\alpha}_2 $
, indicating that there is substantial divergence in ideological representation (Fowler and Hall Reference Fowler and Hall2016; Reference Fowler and Hall2017).Footnote
33 For this study, I am interested in $ {\beta}_3 $
, or the marginal effect of Congruence on ideological divergence. In other words,
$ {\beta}_3 $
, or the marginal effect of Congruence on ideological divergence. In other words, $ {\beta}_3 $
estimates the difference in roll-call divergence that is attributable to active newspaper coverage.
$ {\beta}_3 $
estimates the difference in roll-call divergence that is attributable to active newspaper coverage.
The results from this analysis are reported in Table 8. As in Table 6, I use local linear regression on each side of the discontinuity and apply the optimal bandwidth from Calonico, Cattaneo, and Titiunik (Reference Calonico, Cattaneo and Titiunik2014) to estimate Equation 8. The results are similar across alternate bandwidths from 0.05 to 0.15. To establish a baseline, column 1 estimates legislative divergence without accounting for Congruence. The negative and highly significant coefficient on Dem Win indicates that the “coin-flip” election of a Democratic state legislator shifts the associated district’s roll-call representation in the liberal direction relative to an otherwise identical district that elects a Republican legislator.
RD Estimates of Divergence in High and Low-Congruence Districts

Note: Districts with high newspaper congruence have less divergence in roll-call representation between narrowly elected Democratic and Republican legislators. Standard errors are clustered by district-regime in parentheses.
In the remaining columns of Table 8, I allow ideological divergence to vary with levels of Congruence. Across these columns, I find consistent, precise evidence that legislative press coverage reduces divergence in ideological representation. To interpret the substantive size of this effect, consider the point estimate reported in column 2, which includes state-chamber fixed effects but excludes controls. Here, I estimate that a one standard deviation increase in Congruence would reduce baseline divergence by roughly 5%.
To ensure these results are not confounded by a time-varying confounder that is correlated with Congruence and Democratic vote share, columns 3 and 4 of Table 8 introduce my battery of legislator, election, and district controls.Footnote 34 Following Bansak and Nowacki (Reference Bansak and Nowacki2023), I allow the controls’ relationship with the outcome to vary across the discontinuity, with the running variable, and the interaction of the two. Column 4 further adds a year fixed effect to account for potential changes in divergence over time. Following these additions, the relative effect of Congruence declines slightly, but remains highly significant. Further, as in Table 6, in Section J of the Supplementary Material I show that these multiplicative interaction estimates are robust to the non-parametric binning estimator introduced by Hainmueller, Mummolo, and Xu (Reference Hainmueller, Mummolo and Yiqing2019).
Hence, while the estimates vary slightly in magnitude, the results presented in Table 8 consistently indicate that press coverage has a modest, yet potentially important effect on ideological divergence. Put differently, legislators representing districts with higher press coverage tend to converge to their district’s median voter more than legislators representing districts with weaker press coverage.
Taken together, the evidence presented in this section suggests that press coverage meaningfully impacts the representation that constituents receive, both in terms of legislative effort and roll-call voting.
DISCUSSION
Robust political media coverage is widely regarded a key ingredient of democratic governance, yet it is often uneven across political arenas. This concern is particularly acute in state legislatures, where voter engagement is limited and overall press coverage is sparse. Does the general lack of down-ballot news coverage alter the functioning of state legislatures?
This is an important question, and future work should continue to investigate how accountability functions in low-information environments like state legislatures, building on the measures and data that I have assembled. Leveraging the haphazard overlap of newspaper markets and legislative districts, this article provides the first systematic evidence on how local media shapes down-ballot elections and the behavior of state legislators. My evidence suggests that the fourth estate plays critical monitoring and mobilizing roles in state legislatures.
When press coverage of state legislative elections is strongest, I find that voters know more about their state legislator and are more likely to participate in legislative elections. These informational effects also impact election outcomes, leading to greater support for moderate and incumbent candidates. Finally, state legislators respond to increased press coverage by working more for their constituency and more closely representing their ideological preferences.
While this article brings extensive new evidence to bear on the relationship between local press coverage and down-ballot elections, there are two important caveats to highlight. First, the outcomes I study cannot be unambiguously interpreted as enhancing or curtailing voter welfare. For example, local news may enhance the quality of representation by reducing incentives for ideological extremism and the gridlock that often accompanies ideological polarization. Alternatively, the finding that local news coverage is associated with larger incumbency advantages might suggest that under-performing incumbents can leverage news coverage in ways that undermine legislative accountability. In short, the normative implications of these findings are not immediately measurable with my data. Future work should seek to evaluate the implications of these findings for voter welfare.
Second, the mechanisms by which press coverage shapes accountability in state legislatures extend beyond the evidence marshaled in this article. While my results suggest that robust press coverage increases voter knowledge about and engagement with legislative politics, why press coverage augments legislative representation remains unclear. On one hand, stronger press coverage may allow voters to select legislators that better match their priorities and vote out of office legislators who provide poor representation. On another, press coverage may incentivize legislators to invest greater effort in their representation, either out of fear of being perceived as shirking their responsibilities or to garner free publicity for a job well done. Or third, by amplifying constituent concerns and preferences, press coverage may equip legislators with better information to serve their constituency effectively. Evaluating these mechanisms is an important avenue for future research and will be aided by the measures and data I introduce. Whatever the mechanism, my analysis underscores the importance of robust media coverage for legislative accountability and suggests that legislative elections and state legislators would be more moderate, representative, and productive were local press coverage strengthened.
Finally, these results are critical in light of the secular decline of local reporting resources over the past two decades. By one count, the number of full-time newspaper reporters covering state legislatures has declined by 34% since 2014, further depleting an already low-information legislative news environment (Worden, Matsa, and Shearer Reference Worden, Matsa and Shearer2022). My findings suggest that the erosion of local press coverage could exacerbate the rising polarization documented by Shor and McCarty (Reference Shor and McCarty2011; Reference Shor and McCarty2022). By incentivizing ideological moderation at the ballot-box and in office, local press coverage may serve as a counterweight to the partisan forces increasingly reshaping state legislatures specifically and American democracy in general.
SUPPLEMENTARY MATERIAL
To view supplementary material for this article, please visit https://doi.org/10.1017/S000305542500022X
DATA AVAILABILITY STATEMENT
Research documentation and data that support the findings of this study are openly available at the American Political Science Review Dataverse: https://doi.org/10.7910/DVN/ALPYDK.
ACKNOWLEDGEMENTS
For comments and suggestions, the author thanks Justin Grimmer, Andrew Hall, Cassandra Handan-Nader, Janet Malzahn, Erik Peterson, Steven Rogers, Maria Silfa, and Chenoa Yorgason. Some of the computing for this project was performed on the Sherlock cluster. The author would like to thank Stanford University and the Stanford Research Computing Center for providing computational resources and support that contributed to these research results.
CONFLICT OF INTEREST
The author declares no ethical issues or conflicts of interest in this research.
ETHICAL STANDARDS
The author affirms this research did not involve human participants.


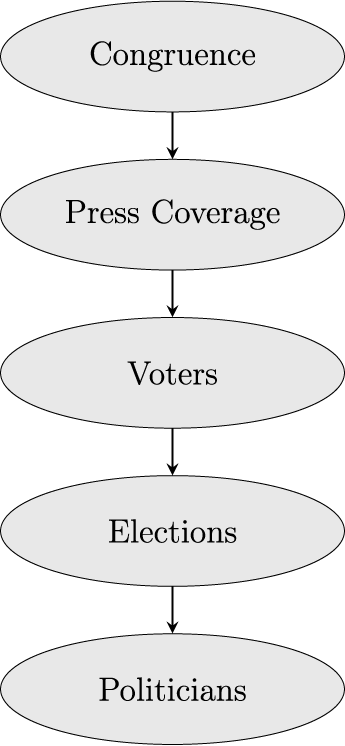
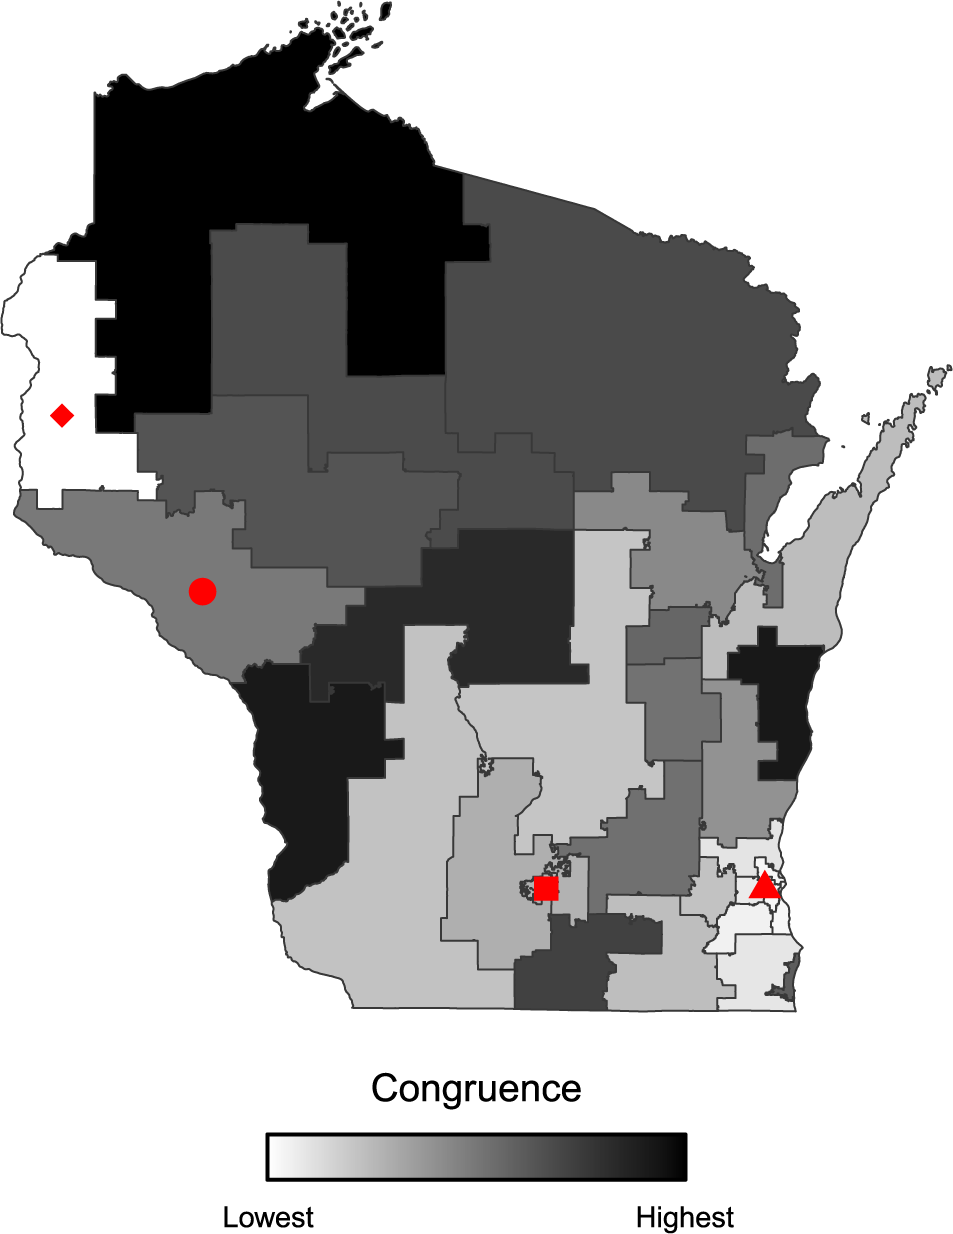
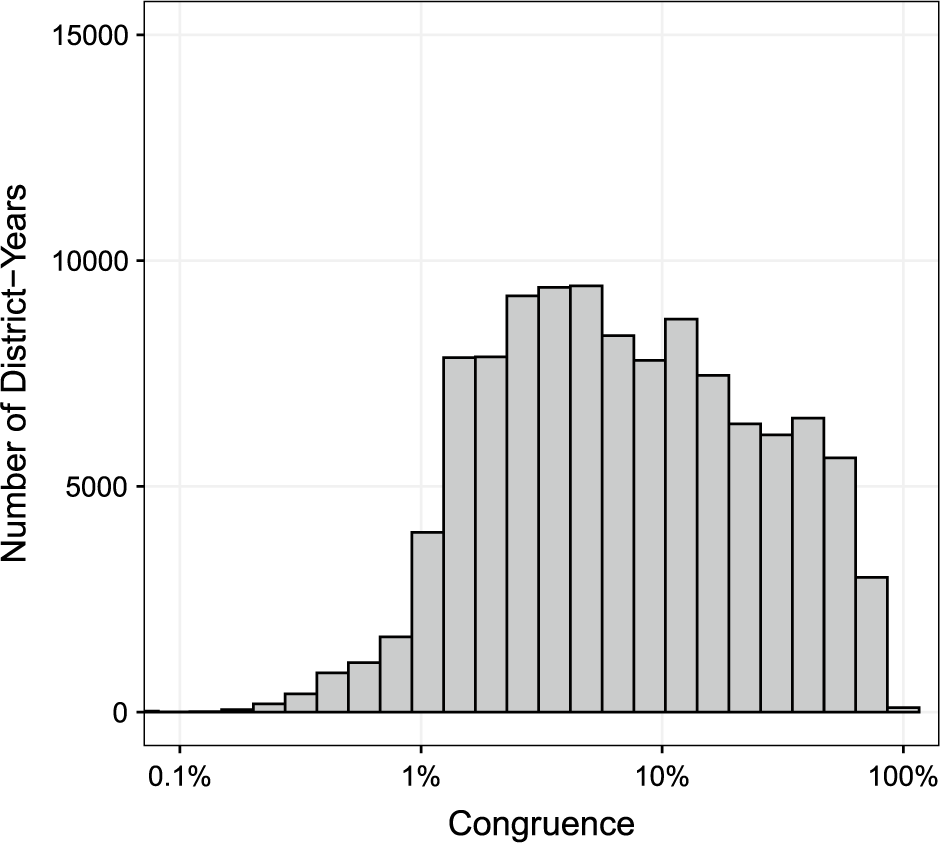
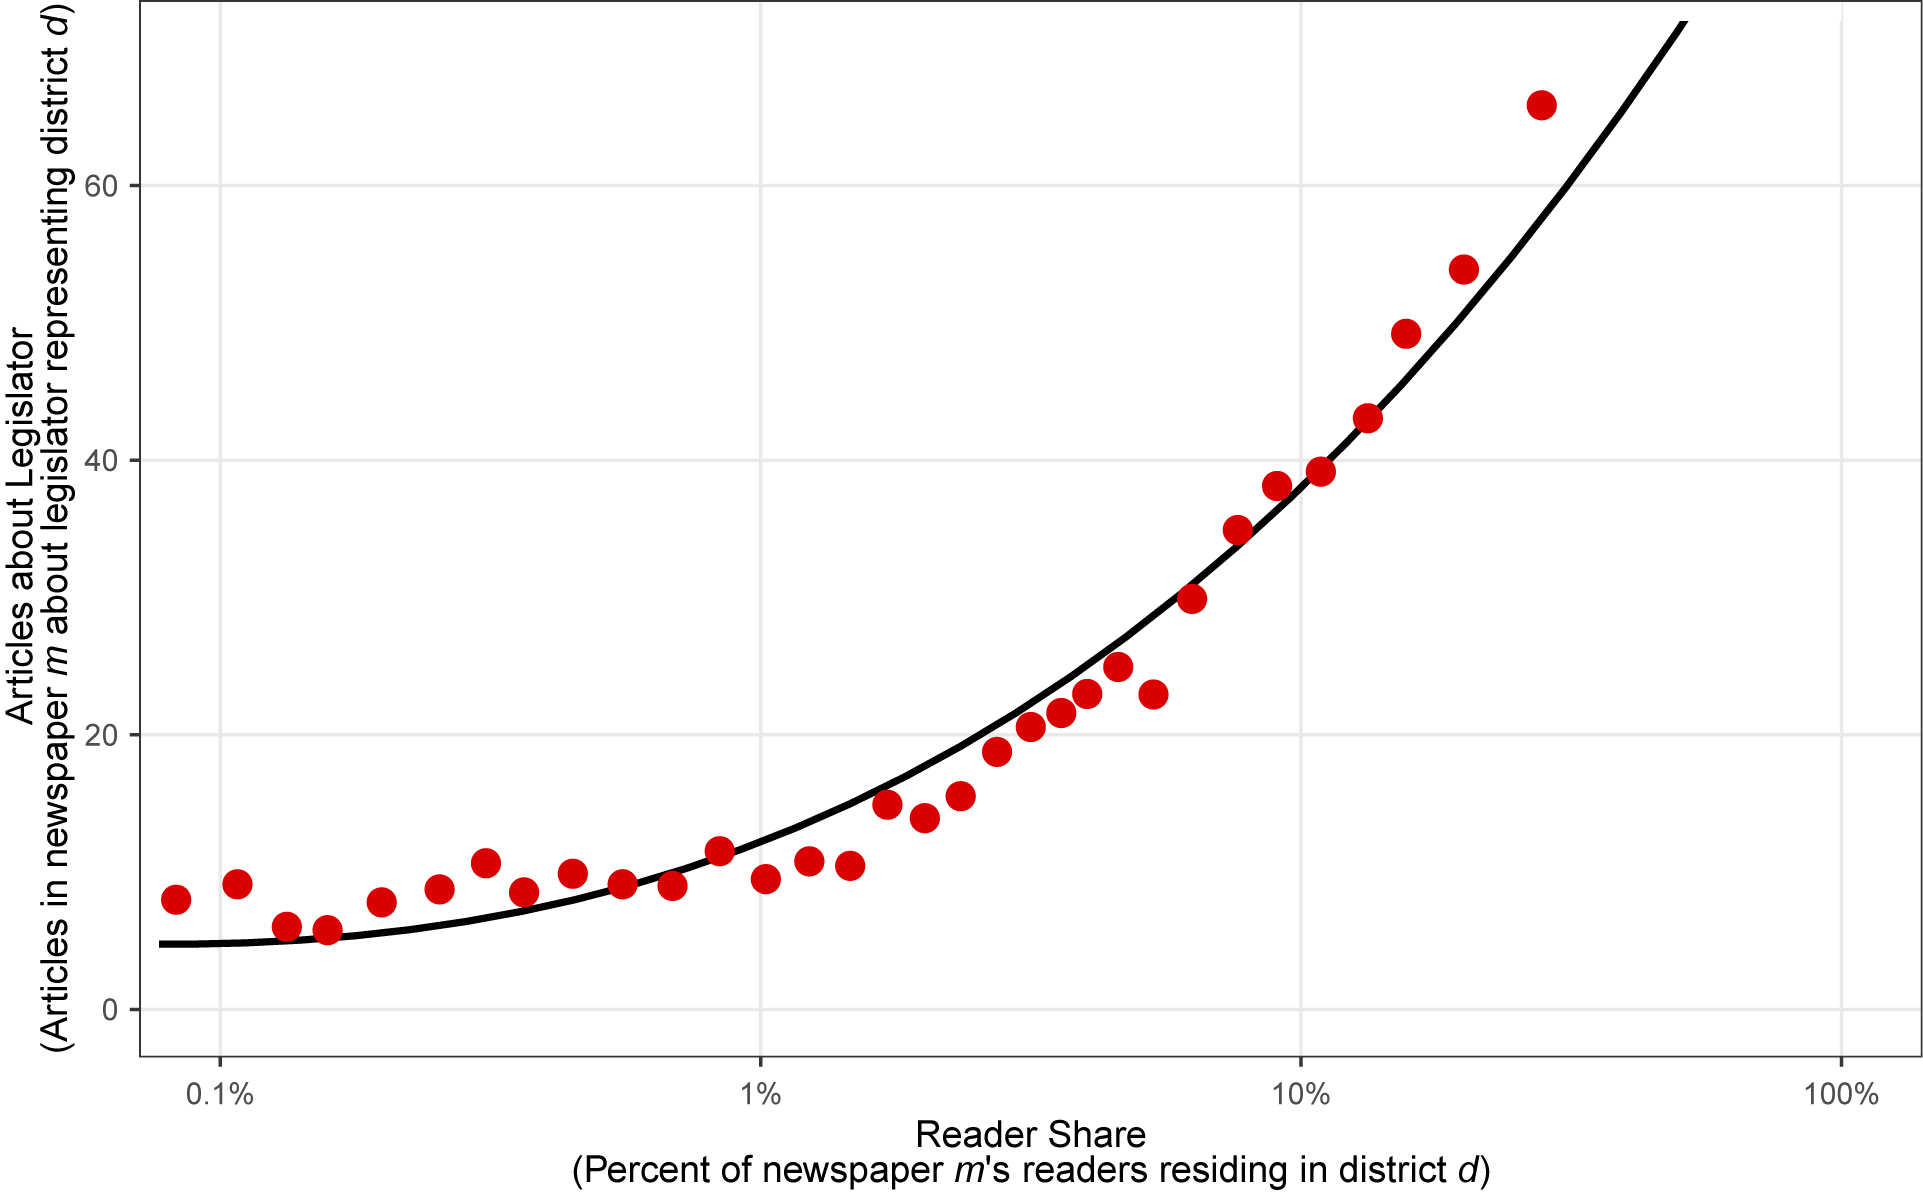

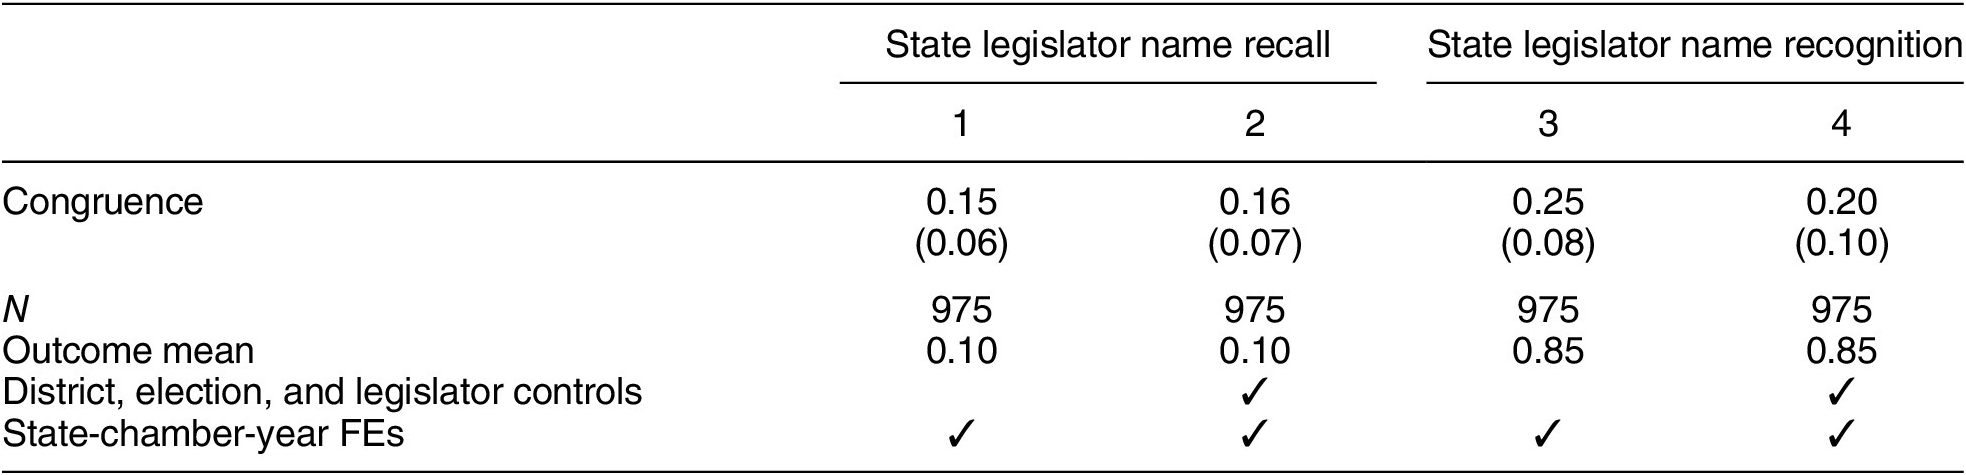
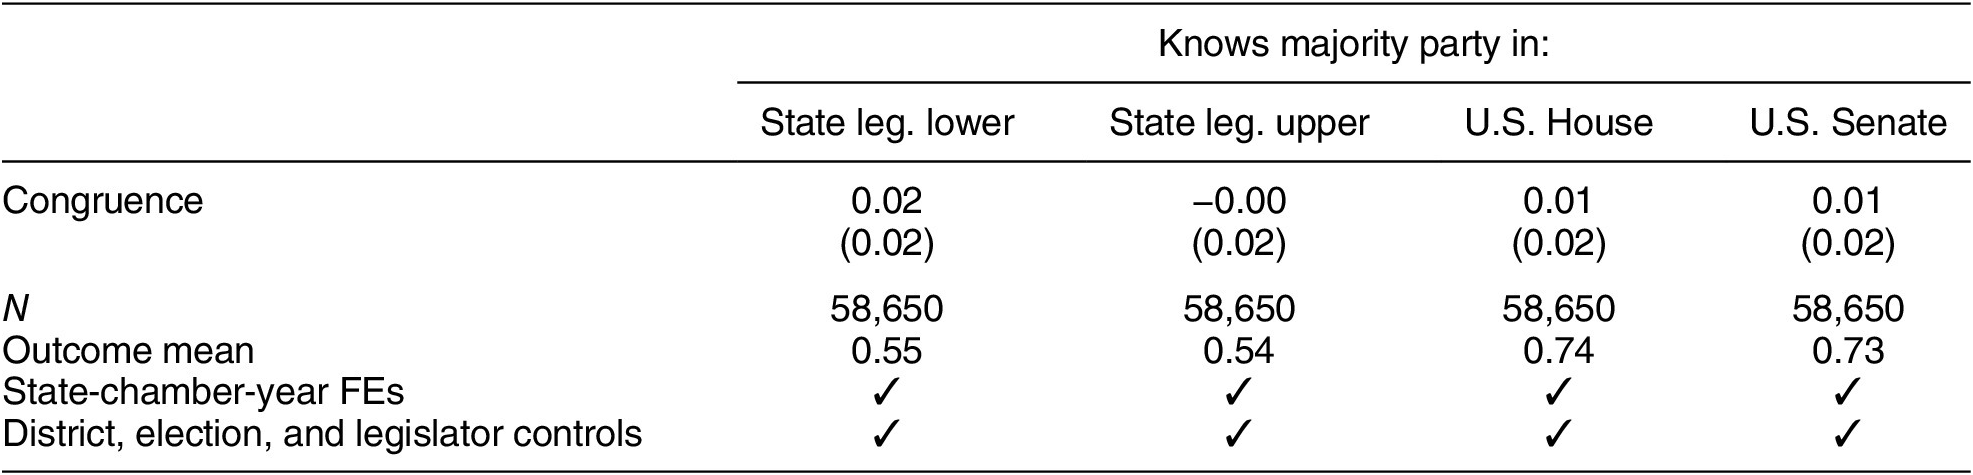
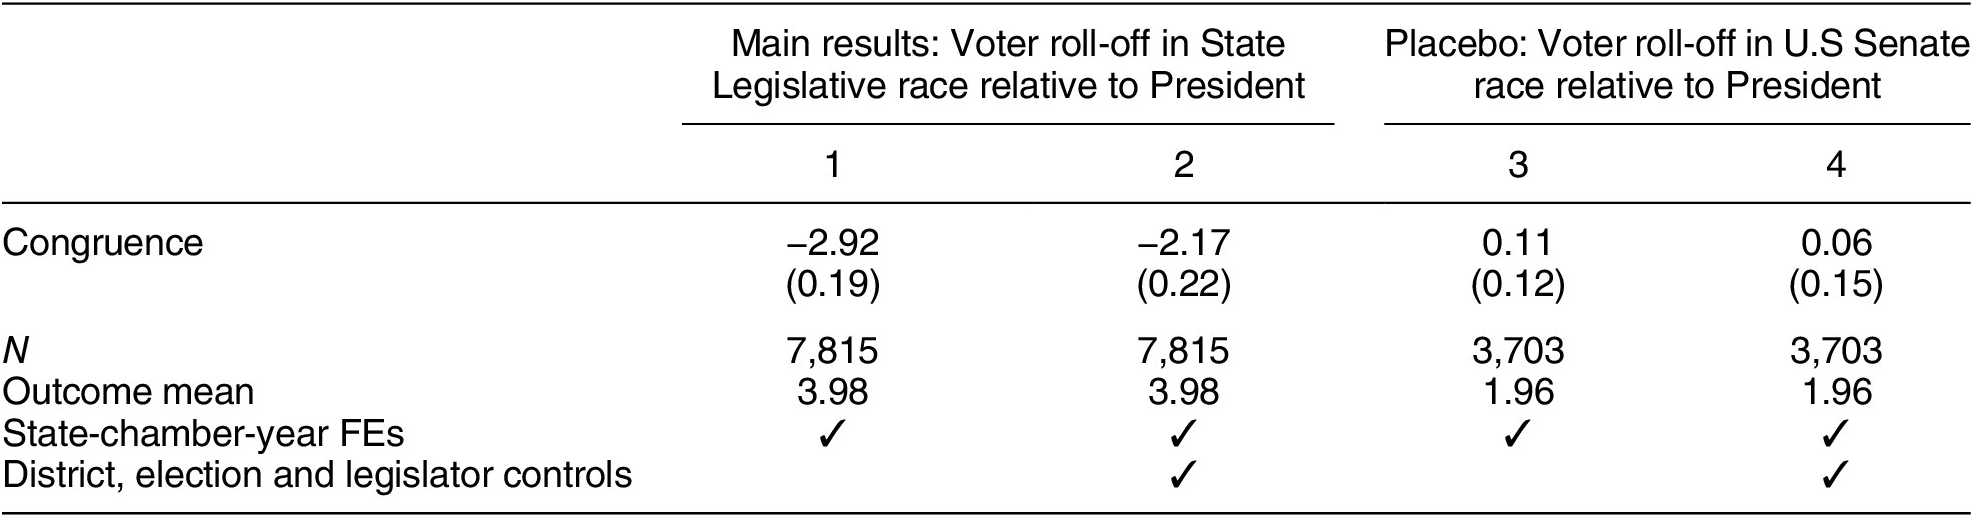
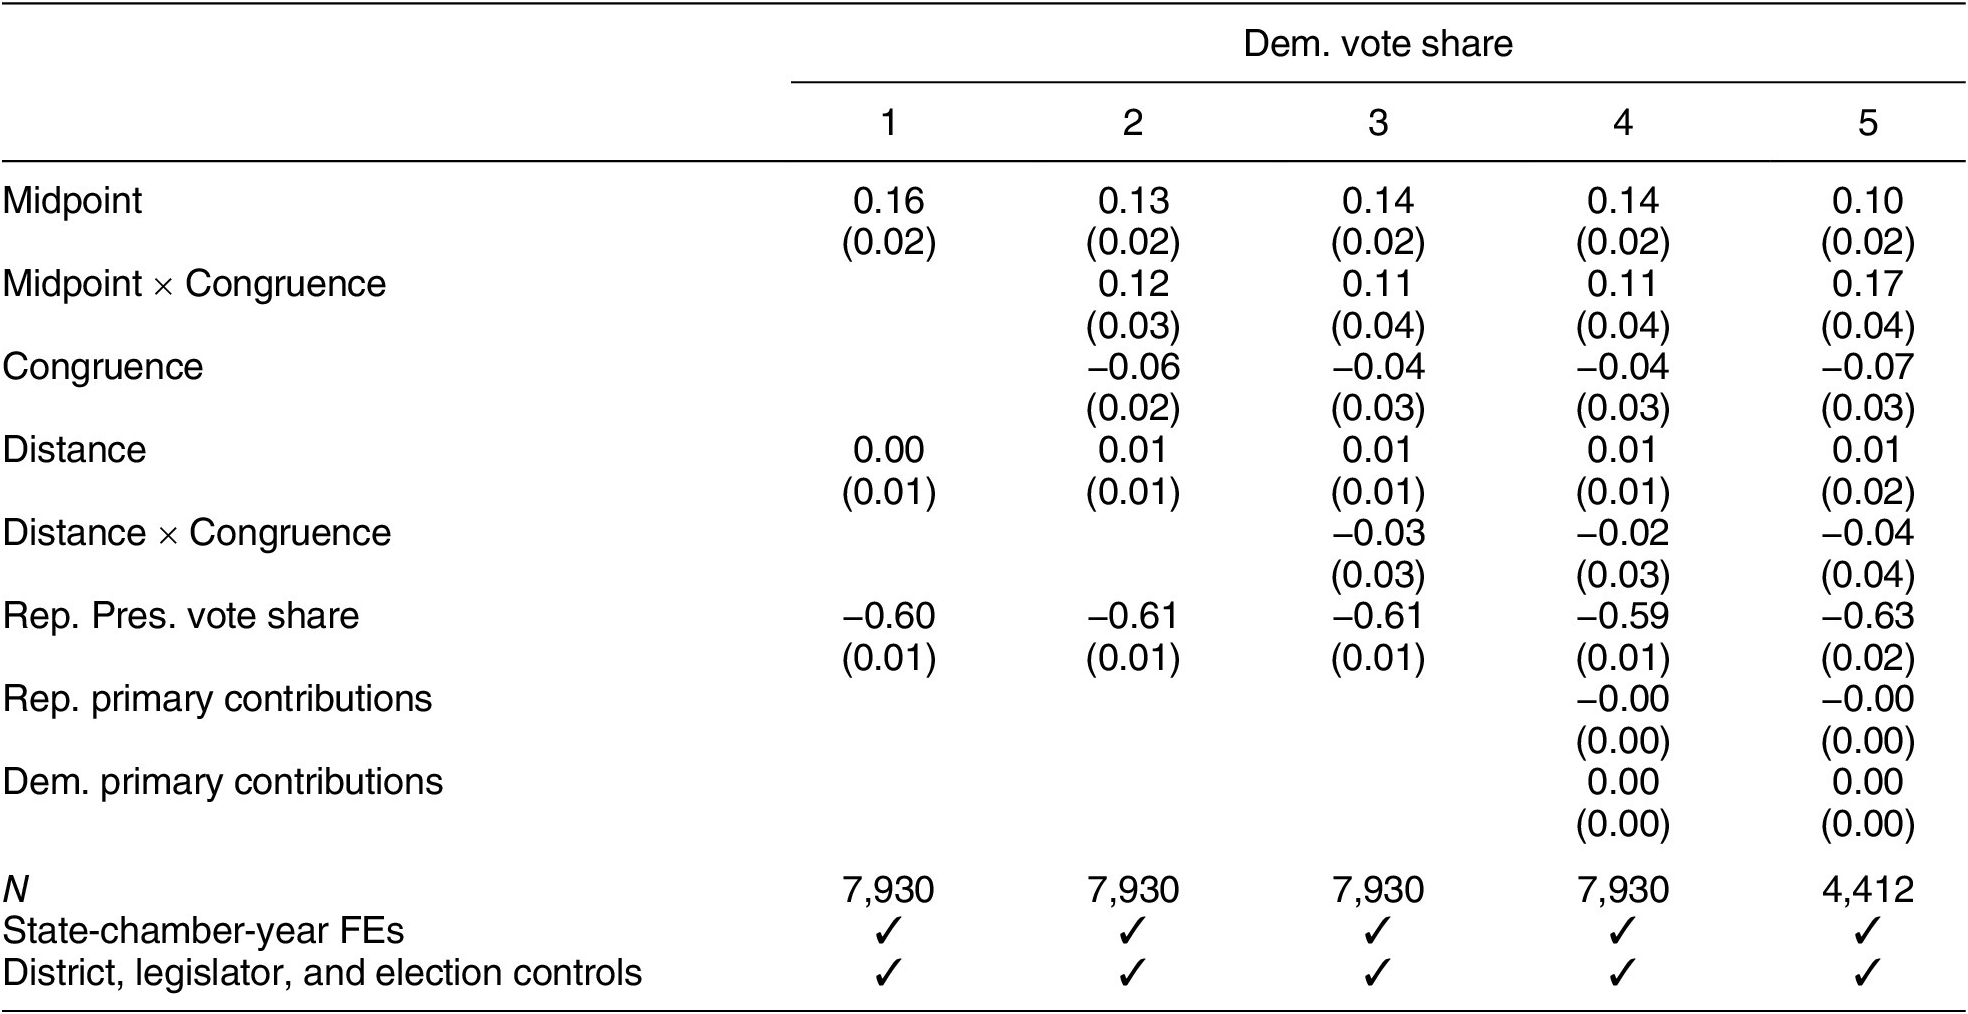
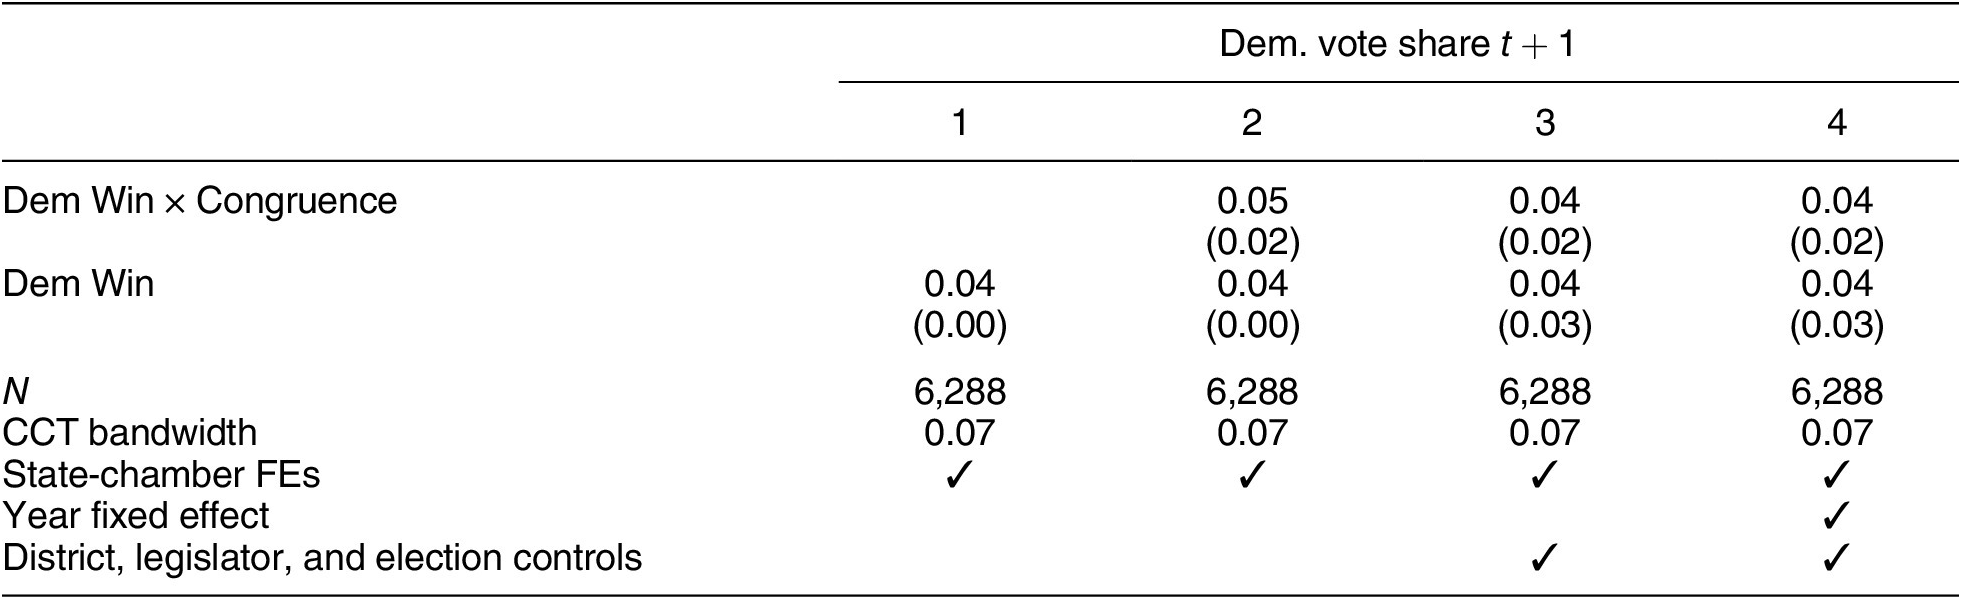
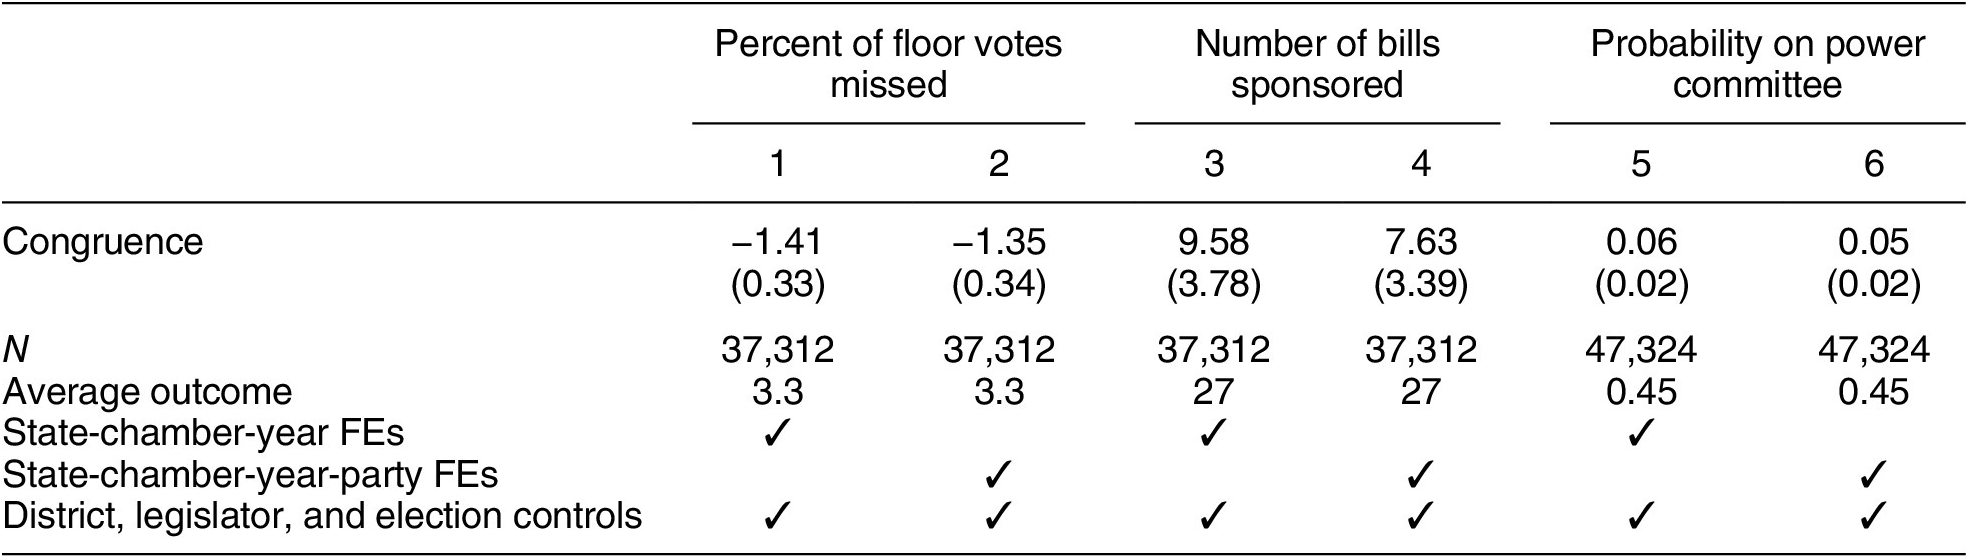
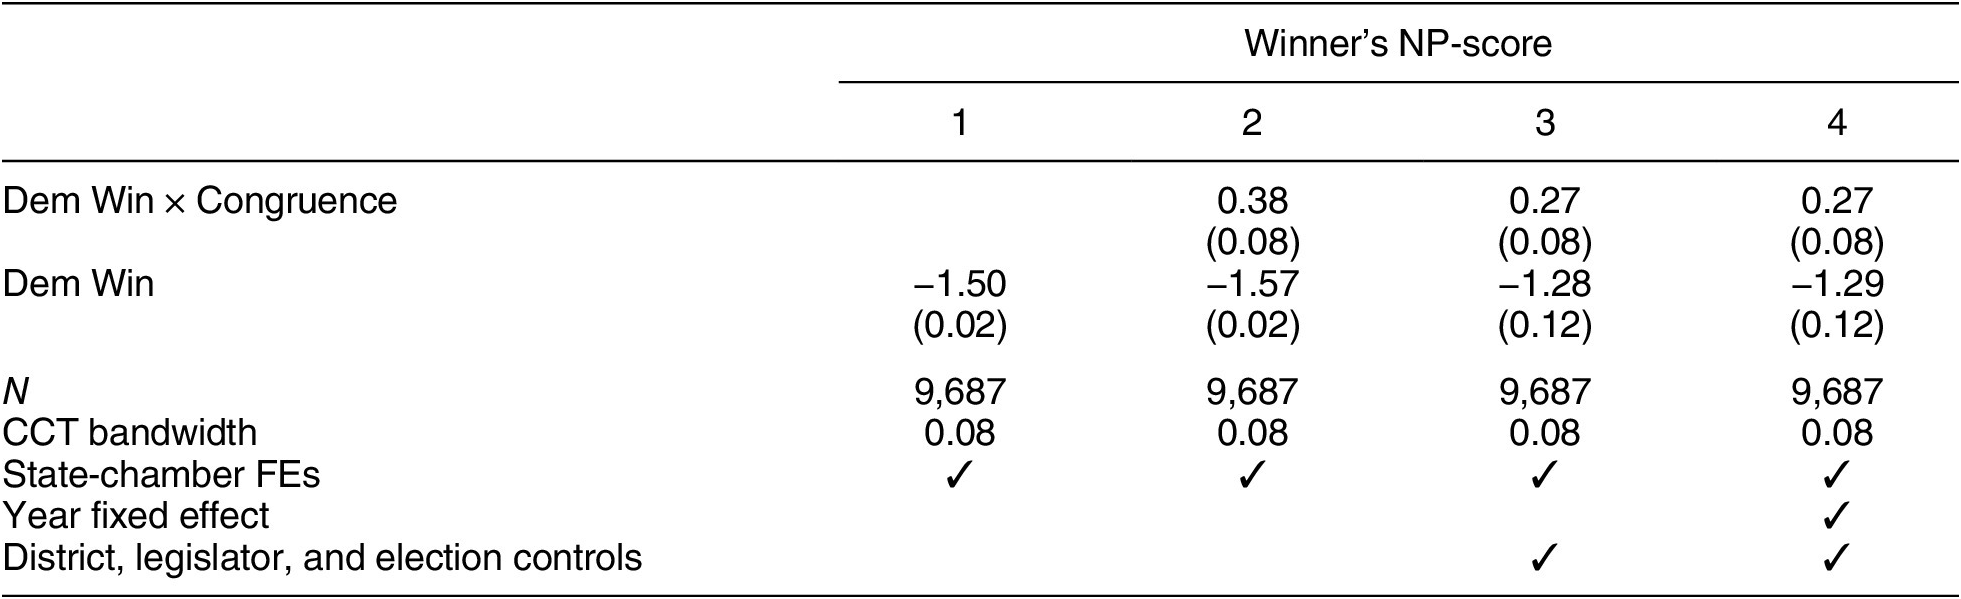


 Open access


Comments
No Comments have been published for this article.