


INTRODUCTION
The Amundsen Sea Embayment (ASE) in West Antarctica has been described as the weak underbelly of the West Antarctic Ice Sheet because the landward-sloping beds of its two largest glaciers (Thwaites and Pine Island, Fig. 1) reach deep into the interior of the ice sheet, making them potentially vulnerable to unstable retreat (Hughes, Reference Hughes1981; Schoof, Reference Schoof2007; Alley and others, Reference Alley2015; Scambos and others, Reference Scambos2017). The ASE is also the site of recent acceleration, surface lowering, and mass loss (Shepherd, Reference Shepherd2001; Bamber and Rignot, Reference Bamber and Rignot2002; Rignot and others, Reference Rignot, Vaughan, Schmeltz, Dupont and MacAyeal2002; Joughin and others, Reference Joughin, Rignot, Rosanova, Lucchitta and Bohlander2003; Chen and others, Reference Chen, Wilson, Blankenship and Tapley2009; Wingham and others, Reference Wingham, Wallis and Shepherd2009; MacGregor and others, Reference MacGregor, Catania, Markowski and Andrews2012; Mouginot and others, Reference Mouginot, Rignot and Scheuchl2014) correlated with ice-shelf melting and the local intrusion of warm ocean water onto the continental shelf (Pritchard and others, Reference Pritchard, Arthern, Vaughan and Edwards2009; Joughin and others, Reference Joughin, Smith and Holland2010; Rignot and others, Reference Rignot, Jacobs, Mouginot and Scheuchl2013; Alley and others, Reference Alley2015). These observations have raised the possibility that the unstable retreat of Thwaites Glacier and/or Pine Island Glacier may be underway (Joughin and others, Reference Joughin, Smith and Medley2014; Rignot and others, Reference Rignot, Mouginot, Morlighem, Seroussi and Scheuchl2014). However, despite their dynamic character, potential instability, and immediate adjacency, most recent observational and modeling work has focused on either Pine Island (e.g., Joughin and others Reference Joughin2009; Scott and others Reference Scott2009; Morlighem and others Reference Morlighem2010; Gladstone and others Reference Gladstone2012; Schodlok and others Reference Schodlok, Menemenlis, Rignot and Studinger2012; Dutrieux and others Reference Dutrieux2013, Reference Dutrieux2014a; Muto and others Reference Muto2016; Brisbourne and others Reference Brisbourne2017) or Thwaites (e.g., Joughin and others Reference Joughin2009; Tinto and Bell Reference Tinto and Bell2011; MacGregor and others Reference MacGregor2013; Parizek and others Reference Parizek2013; Schroeder and others Reference Schroeder, Blankenship and Young2013, Reference Schroeder, Blankenship, Young and Quartini2014a,Reference Schroeder, Blankenship, Young, Witus and Andersonb, Reference Schroeder, Grima and Blankenship2016a,Reference Schroeder, Seroussi, Chu and Youngb; Scambos and others Reference Scambos2017; Seroussi and others Reference Seroussi, Ivins, Wiens and Bondzio2017; Smith and others Reference Smith, Gourmelen, Huth and Joughin2017) separately rather than emphasizing their potential as a coupled, interacting system.
(a) Our study area (red square and Figure 1b) in the context of ice surface speed from Rignot and others Reference Rignot, Mouginot and Scheuchl2011 and ice-thickness contours from Fretwell and others Reference Fretwell2013 in polar stereographic projection. (b) Flight lines for 2004 HiCARS (red) as well as 2012 and 2014 MCoRDS (blue) observations of the southwest tributary. 2011 grounding line (black) adapted from Rignot and others (Reference Rignot, Mouginot, Morlighem, Seroussi and Scheuchl2014).

One area where this independent treatment is likely inadequate is the southwest tributary of Pine Island Glacier (Fig. 1b) which flows from the Thwaites trunk into the Pine Island ice shelf (MacGregor and others, Reference MacGregor, Catania, Markowski and Andrews2012). This tributary initiates just downstream of the eastern shear margin of Thwaites Glacier, which is both the boundary with the Pine Island catchment and is the only Thwaites shear margin whose position is not strongly controlled by basal topography (MacGregor and others, Reference MacGregor2013). It then flows between two regions with low ice surface speeds (Rignot and others (Reference Rignot, Mouginot and Scheuchl2011), Fig. 1b) and frozen bed conditions (Joughin and others, Reference Joughin2009; Schroeder and others, Reference Schroeder, Grima and Blankenship2016a) before reaching its InSAR-derived grounding line (Rignot and others, Reference Rignot, Mouginot, Morlighem, Seroussi and Scheuchl2014) just inland of the Pine Island ice-shelf edge (MacGregor and others, Reference MacGregor, Catania, Markowski and Andrews2012). According to InSAR observations, the grounding-line location of the southwest tributary was stable between 1992 and 2011 (Rignot and others, Reference Rignot, Mouginot, Morlighem, Seroussi and Scheuchl2014). However, recent observations and modeling of ocean-driven melting of the Pine Island Ice Shelf (Jenkins and others, Reference Jenkins2010; Joughin and others, Reference Joughin, Smith and Holland2010; Pritchard and others, Reference Pritchard2012; Schodlok and others, Reference Schodlok, Menemenlis, Rignot and Studinger2012; Dutrieux and others, Reference Dutrieux2013, Reference Dutrieux2014a,Reference Dutrieuxb; Park and others, Reference Park2013; Favier and others, Reference Favier2014) make active melting beneath the southwest tributary of Pine Island Glacier appear likely or imminent. It is the aim of this paper is to exploit existing airborne radar sounding profiles (Fig. 1b) to evaluate the current extent of ocean access beneath the tributary.
METHOD AND RESULTS
In order to assess the reach and effect of ocean water beneath the southwest tributary, we investigate the relative reflectivity of two along-flow radar sounding profiles collected as part of NASA's Operation IceBridge (Koenig and others, Reference Koenig, Martin, Studinger and Sonntag2011) using the CReSIS MCoRDS radar system (Li and others, Reference Li2013) in 2012 (Fig. 2a) and 2014 (Fig. 2d) (Table 1). The data used for this study were standard 195 MHz L1B CSARP processed radargrams (as used in MacGregor and others Reference MacGregor2015a; Chu and others Reference Chu2016; Jordan and others Reference Jordan2016; Khazendar and others Reference Khazendar2016) with a wider bandwidth and larger cross-track antenna array used in 2014 (evident in Fig. 2). As part of this investigation, we identify potential along-flow step-changes in reflectivity (i.e. >~10 dB) consistent with a transition from ice-on-thawed-bed to ice-on-ocean reflectivity (Peters and others, Reference Peters, Blankenship and Morse2005) in the same manner as Khazendar and others (Reference Khazendar2016).
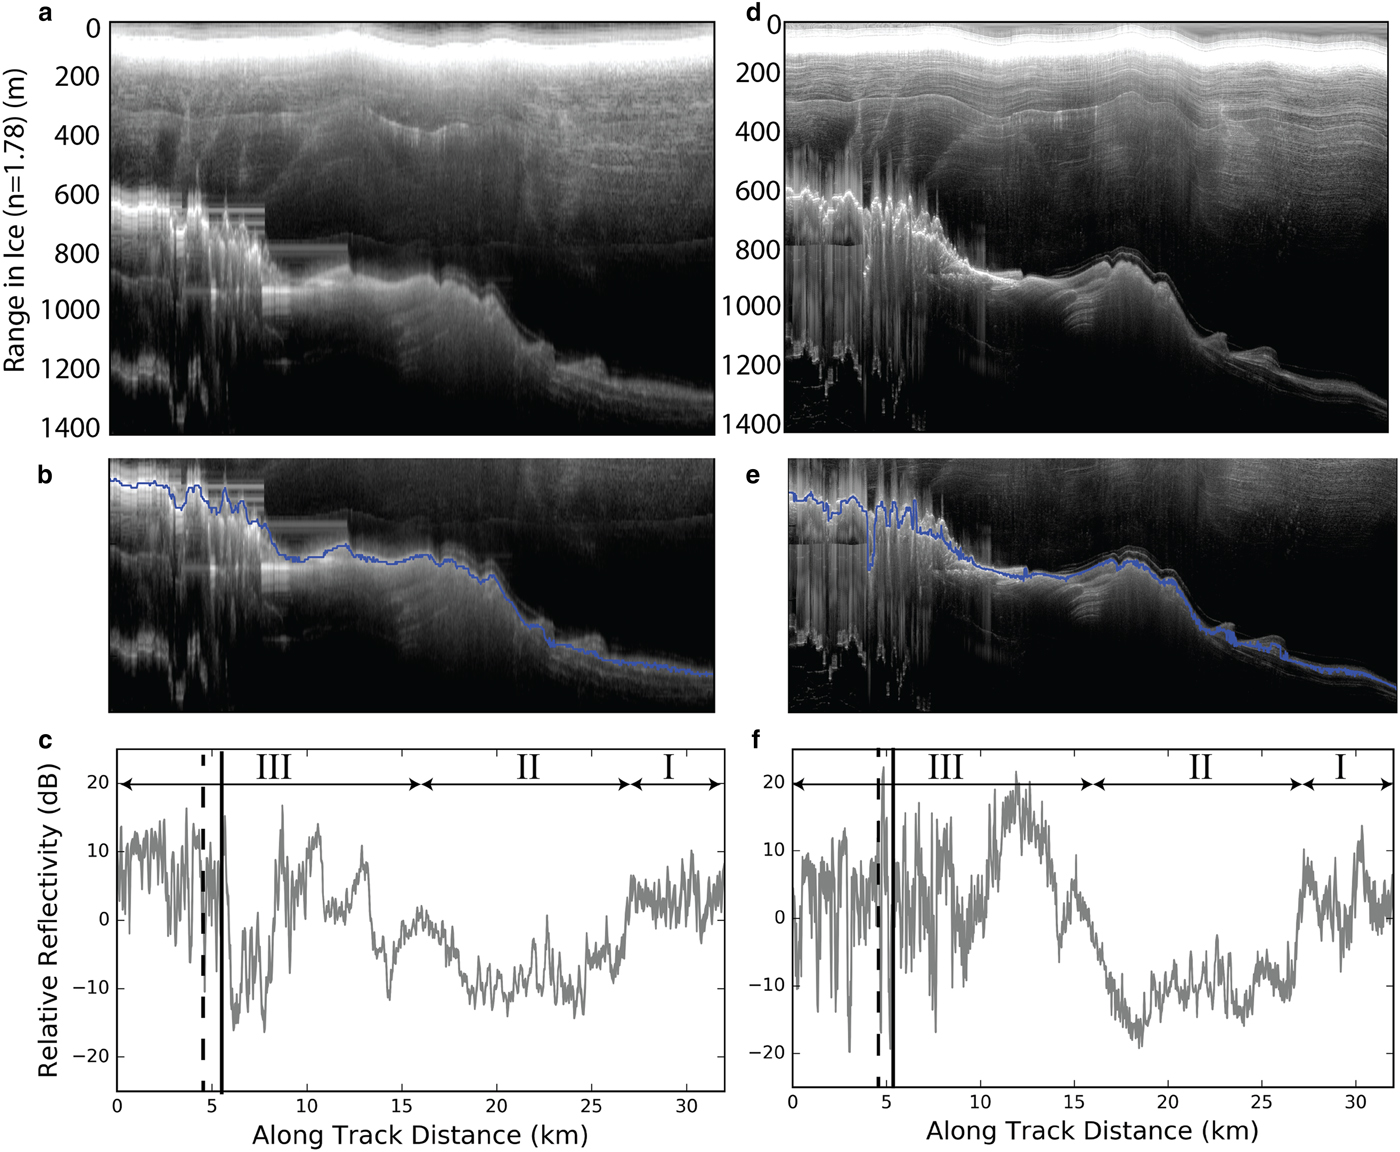
MCoRDS radargrams from (a) 2012 and (d) 2014, their corresponding bed picks (b, e), and relative reflectivity profiles (c, f). Gray-shaded plots show the range between the maximum and minimum relative reflectivity profiles from attenuation-rate fitting (Fig. 3). Zones I, II, and III correspond to areas of moderate, lower, and higher relative reflectivity values moving from the landward to seaward direction. The dashed black line shows the intersection with the 2004 HiCARS flight line (Fig. 4). The black white line shows the location of the 1992–2011 InSAR-derived grounding line (Rignot and others, Reference Rignot, Mouginot, Morlighem, Seroussi and Scheuchl2014).
Radar-sounding data used in this paper

To produce relative reflectivity profiles for the 2012 (Fig. 2c) and 2014 (Fig. 2f) MCoRDS profiles, we extract the bed-echo power from the MCoRDS radargrams (Figs 2a, d, respectively), correct for geometric spreading losses, and perform correlation-based attenuation-rate fitting for each profile (Fig. 3). We use the entire profile as a fitting window but otherwise follow Schroeder and others (Reference Schroeder, Seroussi, Chu and Young2016b) to ensure the initial and post-correction correlations between bed-echo power and thickness satisfy the requirements (minimum and maximum respectively) for fitting and correcting attenuation for a short, outlet-glacier profile using this technique (Schroeder and others, Reference Schroeder, Seroussi, Chu and Young2016b). We reference the along-track distance of the MCoRDS profiles to a common, arbitrary point on the floating ice and take the bed-echo strength to be the strongest echo within a + or − 20 pixel window of the CReSIS bed picks (Fig. 2b for 2012 and 2e for 2014). We estimate the maximum and minimum attenuation rates for each profile as the maximum and minimum attenuation rates with correlation values <0.1 (Fig. 3). The resulting maximum and minimum relative reflectivity profiles are shown as the bounds on the gray-shaded area in Figures 2c, f.
Fitting curves for englacial attenuation (after Schroeder and others (Reference Schroeder, Seroussi, Chu and Young2016b)) for the 2004 HiCARS profile shown in Figure 4 as well as the 2012 and 2014 MCoRDS profiles shown in Figure 2.

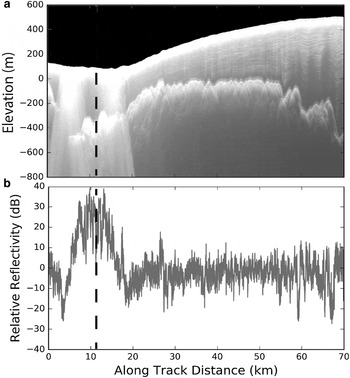
In addition to the two repeat MCoRDS along-flow profiles discussed above (Fig. 2), we also analyzed a 2004 UTIG HiCARS radar profile (Fig. 4) which intersects the MCoRDS lines (Fig. 1b) in the vicinity of the grounding zone. The radar data used in this portion of the analysis were a standard 60 MHz UTIG HiCARS unfocused SAR radar sounding profiles (as used in Schroeder and others (Reference Schroeder, Blankenship, Young and Quartini2014a, Reference Schroeder, Grima and Blankenship2016a,Reference Schroeder, Seroussi, Chu and Youngb)) (Table 1). We follow the same attenuation-rate fitting procedure (Fig. 3) as described above for the MCoRDS data to produce maximum and minimum relative reflectivity profiles (bounding the gray region shown in Fig. 4b). The wider (larger uncertainty) attenuation-fitting curve in Figure 3 with a similar minimum-correlation estimated attenuation rate is fully consistent with two sounding profiles through the same area of the ice sheet with steady and significant along-track topographic relief (Figs 2, 3) for one profile and more modest and constrained relief for the other (Figs 3, 4). For this paper, we deliberately chose not to cross-calibrate or absolutely register the relative reflectivity profiles profiles calculated for the HiCARS (Fig. 4) and MCoRDS (Fig. 2) data. Therefore, the profiles for each system (which will have different means since they span different bed reflectivity regions) must be interpreted independently (as relative profiles) before those interpretations (rather than specific relative reflectivity values) are compared at their crossing points (Fig. 1 and dashed lines in Figs 4, 5).

(a) The 2014 MCoRDS radargram and (b) change in relative reflectivity between 2012 and 2014. Areas of reflectivity decrease are shown in blue and areas of reflectivity increase are shown in red. Gray-shaded plot shows the range between the maximum and minimum reflectivity change. The dashed white line shows the intersection with the 2004 HiCARS flight line (Fig. 4). The solid white line shows the location of the 1992–2011 InSAR-derived grounding line (Rignot and others, Reference Rignot, Mouginot, Morlighem, Seroussi and Scheuchl2014) Zones I, II, and III correspond to areas of moderate, lower, and higher relative reflectivity values moving from the landward to the seaward direction.
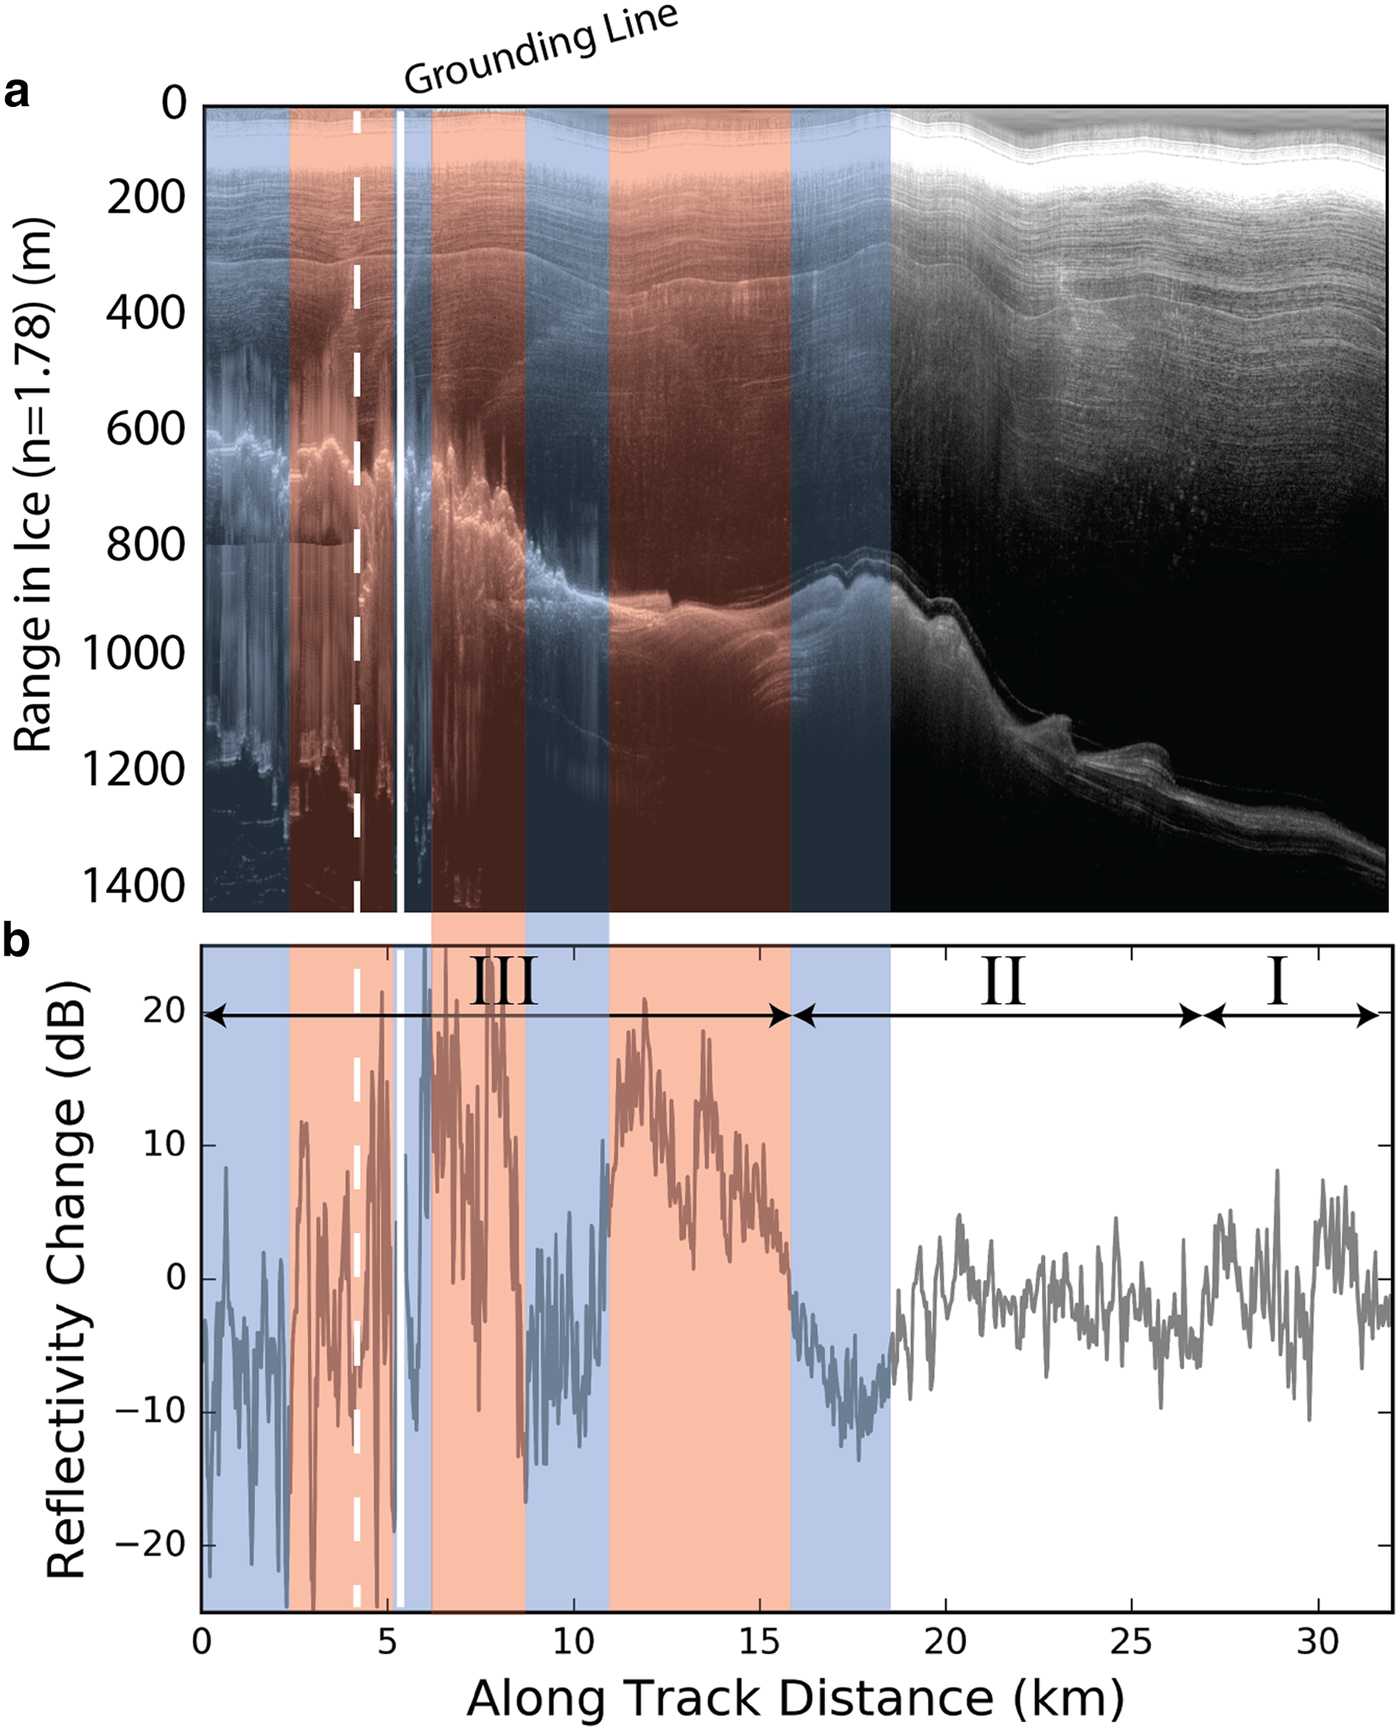
By contrast, because we are interested primarily in interpreting changes in along-profile reflectivity in a two repeat-track MCoRDS radargrams (Fig. 1b) with the same extent (Fig. 2), we are able quantitatively compare their relative reflectivity by assuming that the mean reflectivity over the profile is unchanged. This assumption is supported by the close match of relative reflectivity values inland of the 18 km along the track distance point (Figs 2, 5). This is further supported by the similarity of the attenuation fitting curves for both lines (Fig. 3) and the range of resulting reflectivity values (Figs 2c, f) despite the differences in system parameters and/or processing apparent in their corresponding radargrams (Figs 2a, d). Figure 5b shows the change in reflectivity between 2012 and 2014 for both the minimum and maximum attenuation rates (range shown in gray).
DISCUSSION
There have been recent advances in combining observations from multiple radar-sounding surveys to constrain ice-sheet temperature (MacGregor and others, Reference MacGregor2015b), age (MacGregor and others, Reference MacGregor2015a), map subglacial and englacial conditions (Jordan and others, Reference Jordan2016, Reference Jordan2017), and detect temporal changes in subglacial hydrology (Chu and others, Reference Chu2016) or ice-shelf melt (Khazendar and others, Reference Khazendar2016). However, to our knowledge, no study has done so with data from two or more different families of radar systems. This will be required if continent-scale studies are carried out in Antarctica due to the comparative heterogeneity of extant data relative to Greenland (Pritchard, Reference Pritchard2014). This paper is a first attempt to do so by utilizing data from two different radar systems (HiCARS and MCoRDS) in a quantitative analysis of bed-echo power in order to answer the specific question of how far ocean water reaches beneath the southwest tributary of Pine Island Glacier.
This question is well suited to a first cross-system relative-reflectivity comparison since we have existing hypotheses for the expected reflectivity transitions for across-flow and along-flow lines. For the along-flow lines, we expect to see transitions of >10–20 dB associated with the transition from a grounded, thawed bed to floating ice (Peters and others, Reference Peters, Blankenship and Morse2005; Khazendar and others, Reference Khazendar2016; Schroeder and others, Reference Schroeder, Grima and Blankenship2016a), which is consistent with the observed ~20 dB range in relative reflectivity values in Figure 2. For the across-flow line, we expect to see transitions of 30 dB from a grounded, frozen bed to floating ice (due to the greater reflectivity contrast for this transition; Peters and others Reference Peters, Blankenship and Morse2005; Schroeder and others Reference Schroeder, Grima and Blankenship2016a), which is consistent with the observed ~30 dB range in relative reflectivity values in Figure 4.
By inspecting individual relative reflectivity profiles, it is clear that the 2004 cross-flow profile (Fig. 4b) crosses an ~10 km wide stretch of floating ice between two areas of frozen bed (consistent with Joughin and others Reference Joughin2009 and Schroeder and others Reference Schroeder, Grima and Blankenship2016a). The floating portion of this profile also, unsurprisingly, crosses the along-flow profiles (Fig. 1 and dashed lines in Figs 4, 5) seaward of the 1992-2011 InSAR-derived grounding line (Rignot and others (Reference Rignot, Mouginot, Morlighem, Seroussi and Scheuchl2014) and solid white line in Fig. 5). It is also clear that the 2012 and 2014 profiles (Figs 2c, e) cross three distinct regions (moving from the landward to seaward side of the figure): (I) a moderate relative reflectivity region (~0 dB) from 32 to ~20 km along track; (II) a low relative reflectivity region (~−10 dB) from ~20 to ~15 km along track; and (III) a region of increasing relatively reflectivity starting from that low value (~ − 10 dB) and reaching the highest values (~10 dB) from ~15 to 0 km along track. We interpret these regions (from seaward to landward) as (III) floating ice, (II) grounded thawed bed, and (I) grounded thawed bed with greater quantities of subglacial water (than region II) landward of the basal topographic high at ~18 km (consistent with Peters and others Reference Peters, Blankenship and Morse2005; Joughin and others Reference Joughin2009; Schroeder and others Reference Schroeder, Blankenship and Young2013, Reference Schroeder, Grima and Blankenship2016a; Khazendar and others Reference Khazendar2016; Smith and others Reference Smith, Gourmelen, Huth and Joughin2017).
Beyond the individual reflectivity profiles, the change in relative reflectivity between the 2012 and 2014 repeat MCoRDS profiles (Fig. 5b) shows that while neither of the inland regions (I and II above) experienced a significant change in reflectivity, the reflectivity of entire region seaward of ~18 km along track either increased (blue areas in Fig. 5) or decreased (red areas in Fig. 5) by ~10 dB. Additionally, the point where the 2004 across-flow line crosses the along-flow lines (dashed lines in Figs 4, 5) had high relative reflectivity values in 2004 and 2014 (Fig. 2e), but was lower (than 2014) in 2012 (Figs 2c, 5). We interpret these intermittent increases and decreases to be the competing effects of basal melting (which can strengthen reflections from floating ice by smoothing the basal interface) and basal crevassing or accretion (which can weaken reflections from floating ice by increasing roughness) (Peters and others, Reference Peters, Blankenship and Morse2005; MacGregor and others, Reference MacGregor2013; Greenbaum and others, Reference Greenbaum2015; Schroeder and others, Reference Schroeder, Blankenship, Raney and Grima2015) or discontinuous grounding and/or ocean water exclusion (e.g. Horgan and others Reference Horgan2013; Parizek and others Reference Parizek2013; Walker and others Reference Walker2013; Sugiyama and others Reference Sugiyama, Sawagaki, Fukuda and Aoki2014; Khazendar and others Reference Khazendar2016), but consider all of these to be expressions of ocean access. Therefore, we place the extent of ocean access by 2014 to be around the 18 km point and ~13 km inland of the 2011 InSAR-derived grounding line (Rignot and others Reference Rignot, Mouginot, Morlighem, Seroussi and Scheuchl2014 and solid line in Fig. 5). This suggests that either the grounding line has retreated beyond its apparently stable 1992–2011 position (Rignot and others, Reference Rignot, Mouginot, Morlighem, Seroussi and Scheuchl2014) or that ocean water and related processes have access significantly (kilometers) inland of the InSAR-derived grounding line (e.g. Horgan and others Reference Horgan2013; Parizek and others Reference Parizek2013; Walker and others Reference Walker2013; Greenbaum and others Reference Greenbaum2015; Khazendar and others Reference Khazendar2016).
CONCLUSIONS
By comparing relative basal reflectivity profiles from three radar-sounding survey lines collected using the UTIG HiCARS radar system in 2004 and the CReSIS MCoRDS radar system in 2012 and 2014, we find evidence of a dynamic grounding zone with ocean access (including areas of both increased reflectivity from ocean intrusion or basal melting and decreased reflectivity from crevassing, accretion, or ocean water exclusion) ~13 km inland of the 1992–2011 InSAR-derived grounding line. This suggests that, as ocean-driven melting and retreat of Pine Island Glacier progresses, warm ocean water will have increasing access beneath the southwest tributary and may propagate inland of the currently frozen portion of the Thwaites Glacier grounding line, potentially triggering or facilitating retreat in that catchment as well.
ACKNOWLEDGMENTS
D.M.S. was partially supported by a grant from the NASA Cryospheric Sciences Program. This is UTIG contribution 3200.


 Open access