





1. Introduction
As we tackle complex and large-scale fluid problems with numerical and experimental methods, the proper analysis of these flows – while increasingly challenging – becomes ever more essential for our understanding of the underlying flow physics. A key tool in these analyses are decompositions of the flow fields (Taira et al. Reference Taira, Brunton, Dawson, Rowley, Colonius, McKeon, Schmidt, Gordeyev, Theofilis and Ukeiley2017), either purely data-based or linked to a set of governing equations, that produce a hierarchy of coherent structures, key processes and persistent dynamics, and break down a complex flow behaviour into its simpler constituent parts. This hierarchical approach is predicated on the assumption that the observed flow fields, in their full complexity, can be well approximated by a far lower-dimensional set of mechanisms. These decompositions can thus be considered as model reduction techniques tailored to the specifics of the intrinsic flow physics. Various linear and nonlinear methods are available, with each approach aiming at a specific aspect of the flow and characterized by strengths and limitations.
Common to most techniques is a separation-of-variables approach that isolates normalized spatial structures from their temporal dynamics and amplitudes. Constraints on either the spatial or temporal elements of the chosen decomposition determine the enforced coherence or structural independence (e.g. orthogonality, decorrelation) in the reduced-order model. The amplitudes (or spectra) furnish a hierarchical ranking of the identified subprocesses and, together with the temporal dynamics, drive the evolution of the reduced state vector in latent space. Among commonly used decompositions, the proper orthogonal decomposition (POD; Lumley Reference Lumley1970; Sirovich Reference Sirovich1987; Berkooz, Holmes & Lumley Reference Berkooz, Holmes and Lumley1993; Holmes et al. Reference Holmes, Lumley, Berkooz and Rowley2012; Schmidt & Schmid Reference Schmidt and Schmid2019) plays a key role in extracting spatially decorrelated coherent structures responsible for a maximum of variance in terms of kinetic energy. Decompositions into pure-frequency mechanisms, such as resolvent analysis (McKeon Reference McKeon2017; Ribeiro, Yeh & Taira Reference Ribeiro, Yeh and Taira2020; Rigas, Sipp & Colonius Reference Rigas, Sipp and Colonius2021), dynamic mode decomposition (DMD; Rowley et al. Reference Rowley, Mezić, Bagheri, Schlatter and Henningson2009; Schmid Reference Schmid2010; Kutz et al. Reference Kutz, Brunton, Brunton and Proctor2016; Schmid Reference Schmid2022) or spectral POD (sPOD; Towne, Schmidt & Colonius Reference Towne, Schmidt and Colonius2018; Schmidt & Colonius Reference Schmidt and Colonius2020), have joined the spatially oriented factorizations of the flow fields and have produced new insight into key flow processes. Other decompositions, such as independent component analysis (Hyvärinen, Karhunen & Oja Reference Hyvärinen, Karhunen and Oja2001) or linear stochastic estimation (Adrian & Moin Reference Adrian and Moin1988), are perhaps less prevalent but have nonetheless advanced our understanding of coherence in turbulent fluid motion. More recently, nonlinear model reduction techniques have been devised that account for nearest-neighbour or tangent-space measures in their algorithmic steps (see Lawrence (Reference Lawrence2012) for a review).
In these efforts, little attention is usually directed towards mapping dynamically coherent features in full space onto equally coherent features in latent space, particularly in the temporal part of the decompositions. As a result, the dynamical behaviour in latent space is often compromised in its ability to properly and concisely represent a particular motion in physical space. For example, it is commonly acknowledged that higher-order POD modes are associated with multi-frequential mixtures that, when interpreted in isolation, have little resemblance to observable mechanisms in the original high-dimensional space. Rather, a superposition of multiple modes is required to approximate temporally coherent (non-periodic) features in the full data sequence. Similarly, the pure-frequency decompositions (resolvent, DMD, sPOD) capture periodic flow features with distinct Strouhal numbers, but struggle with more complex and broadband time behaviour.
To compensate for this shortcoming, in particular in data-driven approaches, time-delay or Ruelle–Takens embedding has been proposed (Takens Reference Takens1981). This technique maintains temporal coherence across multiple time steps by considering sequences of snapshots as state vectors rather than individual flow fields. The key idea behind processing these short, concatenated time traces is a better retention of time coherence and a better encapsulation of history effects during the model reduction process. It is aligned with the general concept of temporally coherent structures and improves on the more commonly applied mappings over only a snapshot pair, thus moving from a Markovian to a non-Markovian description. Time-delay embedding, which leads to data matrices of block Hankel type, has been applied with some success, such as in singular spectral analysis (Golyandina, Nekrutin & Zhigljavsky Reference Golyandina, Nekrutin and Zhigljavsky2001), Hankelized DMD (Arbabi & Mezić Reference Arbabi and Mezić2017) or HAVOK (Brunton et al. Reference Brunton, Brunton, Proctor, Kaiser and Kutz2017), in the analysis of complex flows as well as the prediction of fluid processes as part of active control efforts (Budisić, Mohr & Mezić Reference Budisić, Mohr and Mezić2012; Kamb et al. Reference Kamb, Kaiser, Brunton and Kutz2020; Pan & Duraisamy Reference Pan and Duraisamy2020; Axås & Haller Reference Axås and Haller2023). The technique, however, comes at significantly increased computational costs, as each new snapshot now consists of a sizeable sequence of original snapshots which, for complex flows, are already of formidable size. This escalation of input dimensions puts a marked strain on standard (linear-algebra) algorithms used to analyse the flow.
In this present paper, we propose and validate an efficient method that reduces the degrees of freedom of the incoming snapshots, but enforces a crucial constraint on the latent space dynamics. By doing so, it accomplishes two desired outcomes: a reduced latent space and a high-fidelity correspondence between the physical and latent dynamics. These seemingly opposing goals can be accomplished with a remarkable technique that embeds a sequence of fields into a lower-dimensional space while preserving (within user-specified tolerances) their mutual distances via randomized projections. In combination, it thus acts as a constrained, dynamics-preserving model reduction strategy.
The rise of randomized methods, in particular in numerical linear algebra (Halko, Martinsson & Tropp Reference Halko, Martinsson and Tropp2011; Martinsson & Tropp Reference Martinsson and Tropp2020), has also reached quantitative flow analysis in the form of highly efficient algorithms that extract coherent structures from the response of the fluid system to a random forcing (Ribeiro et al. Reference Ribeiro, Yeh and Taira2020). These techniques, which also go by the name of matrix sketching, play a key role in applying standard analysis tools to large-scale and fully three-dimensional flows, and do so in a computationally efficient manner. While the present method falls within the category of randomized methods, it crucially distinguishes itself by its dynamics-preserving property. None of the previous sketching techniques comes with the guarantees of minimal distance distortion among any of the processed snapshots, and therefore maps the full dynamics into latent space with a significant amount of distortion and a potentially suboptimal representation.
We first sketch the theoretical background for the dynamics-preserving model reduction technique based on randomized projections. This technique is then attached to the procedural steps of a modal analysis, based on POD and DMD. An application to flow fields from simulations of compressible flow through a linear blade cascade will demonstrate the efficacy of the new compression technique, showing that the key mechanisms contained in the snapshot sequence can be faithfully extracted directly from the compressed sequence at significantly reduced computational cost. A discussion of future research directions and open challenges concludes this study.
2. Theoretical background
We start with a data sequence  ${{\boldsymbol{\mathsf{Q}}}} = \{ {\boldsymbol {q}}_1, {\boldsymbol {q}}_2, \ldots, {\boldsymbol {q}}_n \}$ consisting of $n$ snapshots of observables where each member ${\boldsymbol {q}}_i \in {\mathbb {R}}^d$ of the set represents a high-dimensional state vector with $d$ degrees of freedom and sampled from numerical simulations or physical experiments. Our task then consists of designing a mapping ${\boldsymbol {\varPhi }}$ that reduces each high-dimensional ${\boldsymbol {q}}_i$ in the data sequence to a lower-dimensional equivalent ${\boldsymbol {y}}_i = {\boldsymbol {\varPhi }}{\boldsymbol {q}}_i \in {\mathbb {R}}^k$ with $k \ll d$ while observing a given constraint. This mapping ${\boldsymbol {\varPhi }}$ will be linear and, hence, can be represented as a $k \times d$ matrix. As the constraint in this mapping, we aim at preserving the dynamics encoded in an $N$-member sample ${{\boldsymbol{\mathsf{Q}}}}_N \subseteq {{\boldsymbol{\mathsf{Q}}}},$ extracted from the original data sequence ${{\boldsymbol{\mathsf{Q}}}}.$ As a measure of the dynamics, we take the mutual pairwise Euclidean distance between snapshots taken from ${{\boldsymbol{\mathsf{Q}}}}_N.$ This choice stems from an interpretation of the data sequence as a path in $d$-dimensional phase space: by preserving the Euclidean distance between any, and not necessarily consecutive, pair of snapshots from any $N$-component subset ${{\boldsymbol{\mathsf{Q}}}}_N$, we maintain the global relational structure of the phase-space path – and thus the dynamics contained in the data sequence ${{\boldsymbol{\mathsf{Q}}}}$. Unfortunately, this preservation cannot be enforced exactly. Instead, we have to allow a slight distortion between the distance measure of the original and reduced data sequence. By forcing the preservation of the Euclidean distance between any $N$ snapshots, we are in effect partitioning the $d$-dimensional space into $k$ regions rather than enforcing a weaker chaining-preservation property that would arise if we were to preserve just consecutive pairs in the trajectory, and accordingly this compression scheme is agnostic to the temporal dynamics. For this reason, the spatial compression will affect the temporal evolution only through the removal of some information in the compressed fields, as the dynamics is itself enforced through the ordering of the snapshots in the data sequence formed by the columns of ${{\boldsymbol{\mathsf{Q}}}}$. The constraint on our dynamics-aware, rather than data-aware, model reduction can thus be stated as
 \begin{align} (1-\varepsilon) \underbrace{\Vert {\boldsymbol{q}}_i - {\boldsymbol{q}}_j \Vert_2}_{{\textit{original} \atop \textit{distance}}} \leq \underbrace{\Vert {\boldsymbol{\varPhi}} {\boldsymbol{q}}_i - {\boldsymbol{\varPhi}} {\boldsymbol{q}}_j \Vert_2}_{{\textit{compressed} \atop \textit{distance}}} \leq (1+\varepsilon) \underbrace{\Vert {\boldsymbol{q}}_i - {\boldsymbol{q}}_j \Vert_2}_{{\textit{original} \atop \textit{distance}}} \quad \text{for all } i,j \in [1,\ldots,N],\end{align}
where  $\varepsilon \ll 1$ represents the distortion factor of the mapping ${\boldsymbol {\varPhi }}.$ The existence of such a compressive linear mapping ${\boldsymbol {\varPhi }}$ has been established via the seminal Johnson–Lindenstrauss (JL) lemma (Johnson & Lindenstrauss Reference Johnson and Lindenstrauss1984). Besides its impact on many fields, this lemma has substantiated nearly orthogonal (approximate rotation) matrices, when acting on sparse vectors, which have become a key concept of compressed sensing and sparse signal recovery (Candès & Tao Reference Candès and Tao2006). Also, the above bounds (2.1) are not universally valid, but are implied statistically. They thus come with a failure probability $\delta$ which is bounded from above by one-third.
The JL lemma and the above bounds (2.1) are formulated in the Euclidean norm, and it is a valid concern to call into question the physical nature of this choice for both the original and reduced snapshot pairs. While weighted norms are certainly conceivable, we will proceed with the native formulation (Johnson & Lindenstrauss Reference Johnson and Lindenstrauss1984) and base our phase-space embeddings on this generic measure.
The practical realization of the mapping  ${\boldsymbol {\varPhi }}$ invokes embeddings by random projections (Achlioptas Reference Achlioptas2003), which is a path also followed by sketching techniques. The underlying idea is that probing a matrix by random vectors can reveal its main features, if the matrix, either from a data sequence or from discretized governing equations, is information-sparse when expressed in a proper basis. The research that followed the establishment of a JL-based, dimensionality-reducing mapping concentrated on two aspects: (1) the transformation of an arbitrary input signal/vector into a vector that is amenable to random projections and (2) the sparsification of the random projections themselves. While the first advance decreases the failure probability for (2.1), the second push increases the efficiency and compression rate of the embedding.
In our context, the parameter  $N$ quantifies the mutual linkage across snapshots. While a minimum of $N=2$ cross-connections are necessary, a larger value of $N$ will lead to more accurate mappings and a reduced failure probability, at the expense of a reduced compression rate. This lower failure probability stems from the fact that for $N$ connections, we have $N \choose 2$ pairings, any one of which will fail with a lower probability to cause an overall violation of the bound (2.1). We therefore establish a link between $N$ and $\delta$ of the form $\delta = \frac {1}{3} {N \choose 2}^{-1} \sim 1/N^2.$ It is also important to recognize that the linkage parameter $N$ in the fast JL transformation (FJLT) plays the role of the embedding dimension for a time-delay (Ruelle–Takens) embedding.
In the development of a practical algorithm to determine the mapping  ${\boldsymbol {\varPhi }}$, Ailon & Chazelle (Reference Ailon and Chazelle2009, Reference Ailon and Chazelle2010), and later Ailon & Liberty (Reference Ailon and Liberty2013), improve on an earlier attempt by Achlioptas (Reference Achlioptas2003) and propose a three-component transformation with a mapping of the form
 \begin{equation} {\boldsymbol{\varPhi}} = {{\boldsymbol{\mathsf{P}}}} {{\boldsymbol{\mathsf{H}}}} {{\boldsymbol{\mathsf{D}}}}. \end{equation}
In this formulation, the matrices  ${{\boldsymbol{\mathsf{P}}}}$ and ${{\boldsymbol{\mathsf{D}}}}$ are random, while ${{\boldsymbol{\mathsf{H}}}}$ is deterministic. Both ${{\boldsymbol{\mathsf{H}}}}$ and ${{\boldsymbol{\mathsf{D}}}}$ are $d\times d$ matrices responsible for the preconditioning of the input signal; ${{\boldsymbol{\mathsf{P}}}}$ is a $k\times d$ sketching matrix responsible for the final compression. Following Ailon & Chazelle (Reference Ailon and Chazelle2009), we have (assuming, without loss of generality, that $d$ is a power of two)
 \begin{equation} {{\boldsymbol{\mathsf{D}}}} = \hbox{diag} \{{\pm} 1, \ldots, \pm 1 \}, \quad {{\boldsymbol{\mathsf{H}}}}_m = {{\boldsymbol{\mathsf{H}}}}_1 \otimes {{\boldsymbol{\mathsf{H}}}}_{m-1}, \quad {{\boldsymbol{\mathsf{H}}}}_1 = \frac{1}{\sqrt{2}} \left[ \begin{array}{cc} 1 & 1 \\ 1 & -1 \end{array}\right], \end{equation}
with  $\otimes$ representing the Kronecker product and $m$ ranging from $2$ to $\log _2 d.$ In the above expression, ${{\boldsymbol{\mathsf{D}}}}$ is a diagonal matrix with elements independently and randomly drawn from $\{ -1,1 \}.$ The matrix ${{\boldsymbol{\mathsf{H}}}}$ represents a discrete Walsh–Hadamard transform, a generalization of a discrete Fourier transform over a modulo- $2$ number field. Both matrices are orthogonal and their action on ${{\boldsymbol{\mathsf{Q}}}}$ does not affect the mutual distance structure; they simply perform rotations and reflections on the data sequence.
The action of  ${\textsf{\textbf {\textit {H}}}}$ on a snapshot transforms the signal vector from physical to spectral space. Based on the uncertainty relation of harmonic analysis, a signal and its spectrum cannot both be concentrated: global signals have a narrow spectral content, while compact signals have broad spectral support. As a consequence, the ${{\boldsymbol{\mathsf{H}}}}$ matrix maps narrow signals to dense vectors and produces sparse vectors from dense (e.g. single-scale) signals. In view of the fact that ${{\boldsymbol{\mathsf{P}}}}$ will extract a very small number of components from the ${{\boldsymbol{\mathsf{H}}}}$-transformed signals, we are interested in producing dense vectors – even for single-scale signals – to avoid a zero output vector from the FJLT. To circumvent sparse output vectors altogether, the random matrix ${{\boldsymbol{\mathsf{D}}}}$ is added. More mathematically, it can be shown (Ailon & Chazelle Reference Ailon and Chazelle2010) that the largest ${{\boldsymbol{\mathsf{H}}}}{{\boldsymbol{\mathsf{D}}}}$-transformed component of a unit-norm flow field ${\boldsymbol {q}},$ i.e. $\Vert {{\boldsymbol{\mathsf{H}}}} {{\boldsymbol{\mathsf{D}}}} {\boldsymbol {q}} \Vert _\infty,$ is bounded by ${O }(\sqrt {\log N}/\sqrt {d}),$ with a failure probability of less than $1/20.$ This procedure is referred to as a spectral densification, as it always yields a dense vector, regardless of whether the input signal is single-scale or broadband in nature.
Once a proper densification has been established by  ${{\boldsymbol{\mathsf{H}}}} {{\boldsymbol{\mathsf{D}}}},$ a random projection via ${{\boldsymbol{\mathsf{P}}}}$ can then accomplish the model reduction in a reliable and efficient manner. The final matrix ${{\boldsymbol{\mathsf{P}}}}$ is given by
 \begin{equation} {{\boldsymbol{\mathsf{P}}}} = {\texttt{Bernoulli}}(q) {\mathcal{N}}(0,q^{{-}1}) = \left \{ \begin{array}{ll} {\mathcal{N}}(0,q^{{-}1}) & \text{with prob. } q \\ 0 & \text{with prob. } 1-q , \end{array} \right. \end{equation}
with  ${\texttt{Bernoulli}}(q)$ as a Bernoulli distribution, taking on the value of one with probability $q$ and zero with probability $1-q.$ The normal distribution with zero mean and variance $\sigma$ is denoted by ${\mathcal {N}}(0,\sigma ).$ The parameter $q$ measures the approximate sparsity of ${{\boldsymbol{\mathsf{P}}}}.$ Detailed analysis requires $q$ to be
 \begin{equation} q = \min\left({\mathcal{O}}\left(\frac{\log^2 N}{d}\right),1\right). \end{equation}
The compression that can be achieved with this parameter set-up can be estimated as (Dasgupta & Gupta Reference Dasgupta and Gupta1999, Reference Dasgupta and Gupta2003)
 \begin{equation} k \geq 4 \left( \frac{\varepsilon^2}{2} - \frac{\varepsilon^3}{3} \right)^{{-}1} \log N, \end{equation}
which, for small values of the distortion factor  $\varepsilon,$ reduces to $k \sim \varepsilon ^{-2} \log N.$ Commonly, this reduction to a latent-space dimension of $k$ is driven by a bound on the failure probability $\delta$ which, in turn, produces the above estimate. It is noteworthy that the reduced latent-space dimension $k$ is independent of the input dimension $d,$ but rather only scales with the enforced distortion factor and the imposed linkage parameter.
Most algorithms used in the processing of data sequences scale geometrically with the input dimension  $d$ and the snapshot number $n;$ for example, the singular value decomposition (SVD) of a tall-and-skinny data matrix has a ${O }(d n^2)$ operation count. This scaling quickly brings these algorithms to the breaking point of applicability, a phenomenon often referred to as the curse of dimensionality. The above compression counteracts this tendency and ultimately yields a more favourable scaling which is amenable to large-scale applications. For this reason, data-compression and hashing algorithms (like the FJLT) have entered iterative linear-algebra algorithms as data preconditioners (Nelson & Nguyên Reference Nelson and Nguyên2013). In these applications, the dynamics preservation translates to the maintenance of relational connections between subsequent members of a Krylov sequence, and maintenance of spectral information. In this study, we apply the FJLT technique to dynamic flow-field sequences.
The implementation of the FJLT procedure does not involve the explicit formation of the three matrix components  ${{\boldsymbol{\mathsf{P}}}}, {{\boldsymbol{\mathsf{H}}}}, {{\boldsymbol{\mathsf{D}}}},$ nor does the entire data sequence ${{\boldsymbol{\mathsf{Q}}}}$ have to be stored. Rather, (1) the multiplication of a snapshot by the diagonal matrix ${{\boldsymbol{\mathsf{D}}}}$ amounts to randomly flipping the signs on the components of the input vector, (2) the multiplication by ${{\boldsymbol{\mathsf{H}}}},$ the only dense matrix, can be accomplished in ${O }(d \log d)$ operations, similar to a fast Fourier transform, and (3) the multiplication by ${{\boldsymbol{\mathsf{P}}}}$ is very efficient due to its substantial sparsity; it practically amounts to a small random sampling/multiplication of the output from ${{\boldsymbol{\mathsf{H}}}} {{\boldsymbol{\mathsf{D}}}} {\boldsymbol {q}}_i$. The FJLT can even be applied in a streaming fashion to the data sequence, which also permits the application of an incremental version of the SVD (see e.g. Brand Reference Brand2002) for the subsequent POD or DMD analysis.
3. Problem set-up
To demonstrate the functionality and utility of data compression and model reduction by FJLTs, we make use of a model flow through a turbomachinery compressor blade row. This flow has previously been analysed in Glazkov (Reference Glazkov2021) and Glazkov et al. (Reference Glazkov, Fosas de Pando, Schmid and He2023a,Reference Glazkov, Fosas de Pando, Schmid and Heb) as to its global stability and receptivity characteristics. The flow configuration consists of a single, two-dimensional blade passage, formed by controlled-diffusion airfoils, with periodic boundary conditions forming a linear blade row. The purely two-dimensional flow field is simulated for a chord-based Reynolds number of  $Re=100\,000$, with an exit Mach number of $M=0.3$, and an inflow angle of $37.5^\circ$, which, downstream of the blade, is turned into a streamwise flow.
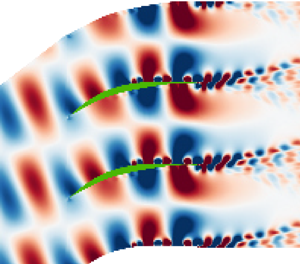
In this configuration the main features of the flow field can be summarized as comprising a laminar separation bubble on the suction side of the airfoils which periodically sheds vortices that subsequently interact with the trailing edge. These interactions of scattering and shedding processes at the trailing edge generate upstream-propagating acoustic waves that impinge upon the unstable boundary layers on the suction and pressure surfaces of the airfoil, as shown in the nonlinear flow snapshot in figure 1. Through a detailed wavemaker analysis in Glazkov (Reference Glazkov2021) and Glazkov et al. (Reference Glazkov, Fosas de Pando, Schmid and He2023a), it was shown that these interactions lead to feedback loops that sustain and drive the instabilities, and an ensemble of 14 dominant modes were identified and analysed through a direct-adjoint mean-flow global stability analysis. With such richness of dynamics, this case provides us with a sound foundation upon which to evaluate the performance of the FJLT when applied to modal flow analysis techniques explored in this paper.
The dilatation field of a nonlinear flow snapshot for this flow case, upon which are superimposed contours of vorticity.

The data set considered here consists of time-resolved snapshots of the four flow variables  $p$,
$p$,  $s$,
$s$,  $u$ and $v$ (pressure, entropy, streamwise and spanwise velocity), extracted from the simulation once the system reaches a limit cycle. A total of $n = 2001$ snapshots are recorded over the time period $t=0\to 40$, and each flattened snapshot has $d = 1\,804\,400$ degrees of freedom. As is standard for POD and DMD, a $d \times n$ data matrix ${\boldsymbol{\mathsf{Q}}}$ is then formed by consecutively stacking each snapshot into the columns of the matrix.
For a POD analysis,  ${\boldsymbol{\mathsf{Q}}}$ is decomposed using the SVD according to
 \begin{equation} {\boldsymbol{\mathsf{Q}}} = {\boldsymbol{\mathsf{U}}}\boldsymbol{\varSigma}{\boldsymbol{\mathsf{V}}}^H, \end{equation}
where we emphasize that  ${\boldsymbol{\mathsf{U}}}$ encodes spatial information in the form of POD modes, while $\boldsymbol {\varSigma }$ and ${\boldsymbol{\mathsf{V}}}^H$ are purely temporal, encoding the singular values (spectrum) and evolution behaviour, respectively. Since the FJLT only acts on the spatial dimension of ${\boldsymbol{\mathsf{Q}}}$, it follows that, in the latent (reduced) space, we have
 \begin{equation} {\boldsymbol{\mathsf{B}}} = {\boldsymbol{\mathsf{F}}}\boldsymbol{\varSigma}_c{\boldsymbol{\mathsf{V}}}_c^H, \end{equation}
where
 \begin{equation} {\boldsymbol{\mathsf{B}}} = {\texttt{FJLT}}({\boldsymbol{\mathsf{Q}}}) \equiv {{\boldsymbol{\mathsf{P}}}} {{\boldsymbol{\mathsf{H}}}} {{\boldsymbol{\mathsf{D}}}} {{\boldsymbol{\mathsf{Q}}}} ,\end{equation}
and  ${\boldsymbol{\mathsf{B}}}$ is a $k \times n$ matrix with $k \ll d$, while ${\boldsymbol{\mathsf{F}}}$ describes the POD modes in latent space. Although the inversion back to ${\boldsymbol{\mathsf{U}}}$ is not possible directly from ${\boldsymbol{\mathsf{F}}}$, the JL-guaranteed closeness of $\boldsymbol {\varSigma }_c{\boldsymbol{\mathsf{V}}}_c^H$ to $\boldsymbol {\varSigma }{\boldsymbol{\mathsf{V}}}^H$ means that the inversion can be performed directly, though approximately, from (3.1) at a markedly reduced computational cost when compared with a direct SVD of ${\boldsymbol{\mathsf{Q}}}$.
In a similar way, choosing DMD as our method of choice for a decomposition of  ${\boldsymbol{\mathsf{Q}}},$ we have
 \begin{equation} {\boldsymbol{\mathsf{Q}}} = {\boldsymbol{\varPsi}}{\boldsymbol{\mathsf{A}}}{\boldsymbol{\mathsf{V}}}_{\texttt{and}}, \end{equation}
with  ${\boldsymbol {\varPsi }}$ signifying the spatial dynamic modes, ${{\boldsymbol{\mathsf{A}}}}$ containing the amplitudes and ${{\boldsymbol{\mathsf{V}}}}_{\texttt{and}}$ carrying the temporal dynamics (in pure frequencies). Again, the FJLT approximately preserves the temporal dynamics contained in ${{\boldsymbol{\mathsf{A}}}} {{\boldsymbol{\mathsf{V}}}}_{\texttt{and}}$. For the recovery of the spatial dynamic modes, the inversion of the Vandermonde matrix ${{\boldsymbol{\mathsf{V}}}}_{\texttt{and}}$, however, proves more challenging. Instead, in this paper, the physical modes ${\boldsymbol {\varPsi }}$ are recovered using a discrete Fourier transform evaluated at the identified DMD frequencies and scaled by the DMD amplitudes. All spectral information about the retained dominant modes has been obtained using the sparsity-promoting variant of DMD (Jovanović, Schmid & Nichols Reference Jovanović, Schmid and Nichols2014) with a penalization parameter selected to yield between $20$ and $30$ prevailing modes.
A related approach has been taken by Brunton et al. (Reference Brunton, Proctor, Tu and Kutz2015) who used compressed-sensing techniques to preprocess the data stream that was subsequently analysed by DMD. In their study, Fourier sparsity is assumed and the temporal dynamics or spectral properties between the physical and latent space are not necessarily preserved.
4. Results
In all presented cases, the error tolerance has been set to a  $1\,\%$ maximal distortion of the intrinsic dynamics, with the embedding dimension $k$ determined by the number of snapshots $N$ (Larson & Nelson Reference Larson and Nelson2017) over which this error tolerance is to be preserved (following the bounds given in Dasgupta & Gupta (Reference Dasgupta and Gupta1999, Reference Dasgupta and Gupta2003)). In table 1, the values of $N$, considered in this study, are illustrated alongside the corresponding embedding dimension $k,$ the compression ratio relative to a single snapshot, $d/k$, and the compression ratio relative to a column of the equivalently Hankelized system, $Nd/k$. We also list the failure probabilities as a function of the linkage parameter $N$. We note that increasing the linkage number $N$, and therefore $k,$ increases the dimension of the column vectors in latent space, but relative to the Hankelized system, formed by a time-delay embedding over the same $N$ state vectors, the compression ratio steadily increases, progressively favouring the FJLT compression technique over the equivalent Ruelle–Takens embedding.
Compression ratios and failure probabilities for different FJLT embedding dimensions (linkage parameters).

4.1. Proper orthogonal decomposition (SVD/POD)
To demonstrate the POD mode preservation,  $n=500$ temporal snapshots of the flow are considered in the ${\boldsymbol{\mathsf{Q}}}$ matrix. From here on, the term ‘direct’ refers to quantities obtained directly from ${\boldsymbol{\mathsf{Q}}}$, while the label ‘FJLT’ refers to those generated from ${\boldsymbol{\mathsf{B}}}$, as defined in (3.3). Furthermore, we apply an economy-type SVD on the entire original or FJLT-reduced snapshot sequences. This choice isolates the influence of the compression algorithm on the full analysis. Alternative iterative SVD schemes, applied to each sequence, are left for a future effort.
Figure 2 displays the relative errors of the singular values, corresponding to the principal 20 POD modes for a range of linkage parameters  $N.$ For the lowest linkage of $N=2$ we observe that the relative error occasionally exceeds the user-defined distortion error of $1\,\%.$ This behaviour is particularly prevalent for the higher modal indices, beyond the first four singular values. However, even with this crude approximation and sizeable compression, the relative error does not exceed a value of about $1.3\,\%.$ As we increase the linkage parameter $N,$ the relative-error curve decreases markedly and remains (within our numerical experiments) below the threshold of $1\,\%.$ While there is no observable monotonic convergence towards lower errors, an overall tendency to smaller distortions, across the computed 20 POD modes, is clearly discernible.
Relative errors in the singular values  $\sigma$ for a range of linkage parameter $N.$ The first 20 POD modes have been computed, and a maximum distortion rate of $1\,\%$ has been chosen.

For our second test, we concentrate on the temporal dynamics contained in the rows of the matrix  ${{\boldsymbol{\mathsf{V}}}}^H.$ For a proper comparison, the dynamics of the direct case and the FJLT case have been Fourier-transformed and the difference between the respective two power spectra has been evaluated. Figure 3 depicts the $\ell _1$ error of the difference vector in frequency space. Again, we observe a trend towards smaller relative errors as the linkage parameter $N$ increases. More important, however, is the observation that the first four rows of ${{\boldsymbol{\mathsf{V}}}}^H$ are well represented by the FJLT-compressed matrix ${{\boldsymbol{\mathsf{B}}}}$ – even for very low values of $N.$ Higher modes (beyond a modal index of four) require a higher linkage parameter $N$ to achieve comparable relative $\ell _1$ errors.
Relative  $\ell _1$ errors in the frequency domain of the column vectors of ${\boldsymbol{\mathsf{V}}}$ obtained from the decomposition of ${\boldsymbol{\mathsf{B}}}$ for various values of $N.$ A maximum distortion rate of $1\,\%$ has been chosen.

As a final test, we determine the six most dominant POD structures  ${{\boldsymbol{\mathsf{U}}}}_{1,\ldots,6}$ associated with the identified principal singular values. We choose a linkage number of $N=6$ which has demonstrated in our previous test a sufficiently small relative error in the singular values as well as the temporal dynamics. As mentioned above, the spatial modes ${{\boldsymbol{\mathsf{U}}}}$ cannot be directly recovered from the latent equivalents ${{\boldsymbol{\mathsf{F}}}}.$ However, since ${\boldsymbol {\varSigma }_c {\boldsymbol{\mathsf{V}}}}_c^H$ is minimally distorted relative to the base case, we use the relation ${{\boldsymbol{\mathsf{U}}}} = {{\boldsymbol{\mathsf{Q}}}} {{\boldsymbol{\mathsf{V}}}}_c \boldsymbol {\varSigma }_c^{-1},$ where both ${{\boldsymbol{\mathsf{V}}}}_c$ and $\boldsymbol {\varSigma }_c$ are from the FJLT case, to approximate the original spatial POD modes. The first six POD modes are displayed in figure 4, showing the baseline modes in the left column and the corresponding FJLT-based, reconstructed modes in the right column. We confirm a remarkable semblance between the two columns, which manifests itself even in the smaller details (see e.g. the complex wake structure of the fifth mode). We notice a distortion neither in amplitude nor in phase. The FLJT-based analysis, however, has been accomplished at a highly reduced computational cost (see the data in table 2).
Proper orthogonal modes, corresponding to the six largest singular values, obtained from the direct POD (left column) and reconstructed from the FJLT-compressed snapshot sequence (right column). A linkage parameter of  $N=6$ and a maximum distortion factor $\varepsilon = 0.01$ have been chosen.

Timing comparison of direct and FJLT-driven analysis.

4.2. Sparsity-promoting DMD (spDMD)
Using the same data sequence and performing a flow analysis based on the spDMD, coupled to our FJLT compression, also shows encouraging results at a highly reduced computational effort. The amplitudes, identified by the sparsity-promoting optimization, are displayed for the dominant 24 dynamic modes in figure 5 for the same range of parameter values for  $N.$ Excellent representation for the highest pair of structures can be observed, even for the minimal linkage of $N=2.$ Lower-amplitude, subdominant modes are well represented as the linkage parameter $N$ is increased, and even modest values of $N$ accurately capture the amplitudes of the majority of the top 24 dynamic modes.
The spDMD amplitudes for (a–h) varying  $N$.
$N$.

The same tendency can be observed in spectral space. Figure 6 displays the eigenvalues of the recovered Koopman operator in the complex plane, again for our range of linkage parameters  $N.$ A part of the unit disk is displayed for each case, showing the direct eigenvalues in blue and the FJLT-based eigenvalues in red. In addition, the colouring encodes the associated amplitude of each eigenvalue, with darker shades corresponding to larger amplitudes. We see that the eigenvalues close to the dominant structure (darkest symbol) are well represented by the FJLT equivalent, even for a coarse linkage of $N=2.$ The lower-frequency structures, near the spectral point $\lambda = (1,0),$ require a higher linkage parameter $N,$ before they can be extracted reliably from the FJLT-compressed data set, but are nonetheless well represented when compared with their direct equivalents.
Direct and reconstructed DMD eigenvalues. Blue filled circles indicate the direct eigenvalues, with darker circles representing higher amplitudes, and red circles indicating the corresponding FJLT-derived eigenvalues for varying  $N$.
$N$.

A more quantitative analysis of the eigenvalue errors is presented in figure 7. We stress that the user-specified distortion of  $1\,\%$ in phase-space distance does not translate in a straightforward manner into an estimate for the DMD eigenvalue deviation. Nevertheless, we notice a pleasing tendency of the eigenvalue error to reduce for increasing values of $N.$ The eigenvalues associated with the largest two amplitudes (representing the dominant dynamic structures in the processed data sequence) show very low relative errors with values below $0.15\,\%,$ even for the crudest of approximations ( $N=2$). Less dominant structures, i.e. higher modes, representing mostly lower-frequency structures are represented with a maximum eigenvalue error of about $1\,\%$ once the linkage parameter exceeds $N=6.$ Even at this point, the computational savings, compared with the direct case, are substantial.
The relative errors in the FJLT-reconstructed modes given by  ${err} = \vert \lambda _{{dir}} - \lambda _{{FJLT}} \vert /\vert \lambda _{{dir}} \vert.$

The reconstruction of the spatial structures corresponding to the identified eigenvalues/frequencies is less straightforward than for the POD analysis. A technique similar to the POD case would require the inversion of a Vandermonde matrix and compound the FJLT approximation error with additional numerical errors stemming from the inversion. For this reason, we chose a different reconstruction method, using the fact that for statistically equilibrated data sequences the eigenvalues are located on the unit disk and represent single-frequency structures. We thus identify the FJLT-compressed frequency and inverse-Fourier-transform the data sequence for this frequency. The results are shown in figure 8, juxtaposing the six direct DMD modes with the largest amplitudes, the equivalent six modes from a direct reconstruction and the corresponding modes from an FJLT-based recovery. While the recovered modes (direct and FJLT-based) match closely, corroborating the efficacy of the compression algorithm to capture significant flow characteristics from the latent data sequence, there are noticeable differences, mostly in phase, between the direct and reconstructed coherent structures. Nevertheless, the key features in each of the six modes are represented in a very satisfactory manner. It is important to mention that the differences can be attributed to the reconstruction, not the compression procedure, and should be taken as an encouragement to direct further attention to a better extraction method for the spatial structure from the latent dynamics.
A DMD reconstruction from an FJLT sequence. Shown are the six most dominant dynamic modes, with the reference case on the left, and the reconstructed modal structures in the middle and on the right. Contours of pressure are used to visualize the flow fields.

4.3. Computational cost, timings and failure rates
The logarithmic scaling of the latent-space dimensionality translates to an equivalent logarithmic scaling in execution time, since the SVD of a rectangular matrix scales linearly with the larger of the two dimensions. With the execution time of the base case established and fixed, we determine the speed-up factor of the FJLT-based modal decomposition as the linkage parameter  $N$ is varied from $N=2$ to $N=32.$ For cases of both POD and spDMD analyses, we corroborate an inverse logarithmic decrease in the speed-up factor (see table 2). When multiplying by the embedding dimension for the processing of a delay-embedded (Hankelized) data sequence, the speed-up factors become even more impressive, asymptotically displaying an $N/ \log N$ tendency (see the columns in table 2 labelled $\hbox {H-POD}$ and $\hbox {H-DMD}).$ Figure 9 depicts the raw execution speeds (executed on a $32$ GB-RAM, Apple M1 Max laptop) versus the linkage parameter graphically, and with the colour code of earlier figures. Both cases (POD and spDMD analyses) are presented, and a clear logarithmic scaling is confirmed.
Timing of the FJLT-based POD (a) and spDMD (b) versus the linkage number  $N.$ We note that the embedding dimension $k$ scales logarithmically with the linkage number $N;$ consequently, the horizontal axis can be interpreted as the embedding dimension.

In a final analysis, we address the failure rate of the FJLT bound. As mentioned earlier, the bounds on the distortion (2.1), on which our accelerated modal analysis rests, have to be understood stochastically. In other words, the bounds are satisfied up to a failure rate  $\delta,$ when the actual distortion exceeds the specified values of $(1 \pm \varepsilon ).$ The rate at which this outlier occurs gives a measure of reliability of our compression algorithm. For this reason, we present a statistical experiment where we compute the distortion in the pairwise distance between randomly sampled snapshots from our data sequence, i.e. we compute
 \begin{equation} \varepsilon_{{true}} = \left\vert \frac{\Vert \boldsymbol{\varPhi} \Delta {\boldsymbol{q}} \Vert_2}{\Vert \Delta {\boldsymbol{q}} \Vert_2} - 1 \right\vert, \end{equation}
with  $\Delta {\boldsymbol {q}} = {\boldsymbol {q}}_i - {\boldsymbol {q}}_j, i,j \in [0,n]$ and process the data into a histogram. Again, we select a desired value of $\varepsilon = 1\,\%$ and perform the experiment for a linkage parameter of $N=2,4,6.$ We sampled our data sequence $60\,000$ times (without repetition) to obtain properly converged statistics. The results are shown in figure 10. For $N=2$ we observe a failure rate of $22.37\,\%;$ in other words, nearly a quarter of our samples exceeded the desired distortion of $\varepsilon = 1\,\%.$ This value confirms the upper bound of $\delta = 1/3.$ The distribution in figure 10, however, also shows that distortions larger than $2\,\%$ occur rarely, even for this minimal value of $N=2.$ Increasing $N$ improves the failure rate dramatically. Already for $N=4,$ only $1.48\,\%$ of our samples exceed the user-specified $1\,\%$ distortion value, and at $N=6,$ the failure rate has reduced to $0.0156\,\%.$ This experiment also shows that the theoretical bounds on the failure rate, given in the rightmost column of table 1, are rather conservative, as they predict a maximum failure rate of $1/18 = 5.55\,\%$ for $N=4$ and $1/45 = 2.22\,\%$ for $N=6.$ Our statistical analysis produced substantially lower failure rates in both cases.
Error (failure rate) histograms from a statistical analysis of the FJLT-based POD for a linkage number of (a)  $N=2$, (b) $N=4$ and (c) $N=6$. The respective upper bounds for the failure probability are $33.33\,\%$ for $N=2,$ $5.55\,\%$ for $N=4$ and $2.22\,\%$ for $N=6.$

5. Summary and outlook
High spatial resolution, and hence many degrees of freedom, is a computational necessity for capturing all relevant spatio-temporal scales and physical processes when simulating complex fluid flows, but acts as an impediment to algorithmic efficacy when the resulting flow fields are subsequently analysed. Common efforts in reducing flow mechanisms to their relevant subprocesses via spectral or modal decompositions yield distortions or misrepresentations of the temporal dynamics and result in a latent-space dynamics that is difficult to interpret or relate to full-scale observations.
In this study, we propose a spatial reduction scheme that achieves up to two orders of magnitude compression ratios while maintaining the temporal dynamics within a predetermined distortion tolerance. This nearly isometric (distance-preserving) reduction takes advantage of the JL lemma and its fast implementation via the FJLT. Randomized sketching techniques of preprocessed flow fields provide a low-dimensional embedding and produce substantially reduced latent-space sequences that are further subjected to modal analyses at diminished computational costs.
Applications to compressible flow through a linear blade cascade demonstrated the efficacy of the algorithm, where the dominant POD and DMD modes have been accurately, but far more efficiently, captured. Singular values, frequencies, amplitudes and modal shapes could be extracted from reduced data sets without significant degradation in quality despite a data compression factor of up to  ${O }(10^2).$
The algorithm is governed by a linkage parameter that enforces the distortion bounds across a set of snapshots. For the special case of successive linkage, this parameter can be interpreted as a time horizon over which temporal coherence is enforced during the compression. Our proposed algorithm can thus be considered as an alternative to time-delay (Ruelle–Takens) embedding. However, while time-delay embedding substantially inflates the spatial dimensionality of an already high-dimensional state vector, we venture in the opposite direction by reducing the spatial dimensionality while preserving temporal structures over the same time horizon. Our proposed algorithm exploits the compressibility (in a data-information sense) of the flow field, rather than introducing excessive and unnecessary redundancy by Hankelizing the data matrix.
While the FJLT-based flow analysis produced encouraging results, there still remain opportunities for improvements and extensions. Parallelization efforts come to mind to further increase the efficiency of the data compression. While the Walsh–Hadamard transform can be parallelized in itself, a more direct gain in execution speed may arise from a partitioning of the snapshot sequence and the parallel processing of each subset. Throughout this paper we have made use of the original approach of Ailon & Chazelle (Reference Ailon and Chazelle2009), Ailon & Chazelle (Reference Ailon and Chazelle2010) and Ailon & Liberty (Reference Ailon and Liberty2013), but recent work on FJLTs (see e.g. Fandina, Høgsgaard & Larsen Reference Fandina, Høgsgaard and Larsen2022) has sought to improve the computational complexity associated with the application of the transform. This would be of particular relevance when, for example, applying the transform in the contexts of long time series where the transform must be applied many times. The measure-densifying effect of the  ${{\boldsymbol{\mathsf{H}}}}{{\boldsymbol{\mathsf{D}}}}$ matrix (in our case, a Hadamard–Walsh transform of a sign-randomized signal) can be replaced by other options that accomplish the same densification. In particular, in-place transforms could be applied to alleviate the memory footprint of the compression. Most importantly, recovery techniques to reconstruct modal structures from their latent-space analogues are a target of future research, with an eye on machine-learning techniques, such as superresolution, to tackle this challenge. However, even in its original form presented here, the FJLT-based modal flow analysis represents an efficient and appealing way of gaining physical insight into high-dimensional, large-scale and complex flow processes, without the accompanying computational effort.
Supplementary material
Codes and data sets to reproduce the results in this paper are provided as supplementary material, available at https://github.com/antongla/fjlt-modal-compression.
Declaration of interest
The authors report no conflict of interest.


 Open access

